Atmospheric Moisture Content over Europe and the Northern Atlantic


1
Department of Climatology, Jagiellonian University, 30-387 Krakow, Poland
2
Institute of Meteorology and Water Management—National Research Institute, Branch in Krakow, 30-215 Krakow, Poland
*
Author to whom correspondence should be addressed.
Atmosphere 2018, 9(1), 18; https://doi.org/10.3390/atmos9010018
Submission received: 25 November 2017
/
Revised: 5 January 2018
/
Accepted: 7 January 2018
/
Published: 11 January 2018
(This article belongs to the Special Issue Water Vapor in the Atmosphere)
Abstract
:Water vapor plays a major role in the process of radiation, cloud formation, energy exchange within a system, and remains a key component of the Earth’s atmosphere. The purpose of this study is to examine the water vapor content of the troposphere over Europe and the Northern Atlantic. Both temporal and spatial differences were examined for total column water vapor (TCWV) and vertically integrated water vapor flux (IWVF) based on ERA-Interim reanalysis data. The statistical relationship between circulation patterns, as expressed by empirical orthogonal function (EOF) modes, and TCWV were examined, as were statistical relationships between distinguished advection types and TCWV and IWVF. The study confirmed the significance of atmospheric circulation in the formation of moisture content in the winter season (i.e., January) and its markedly lower impact in other seasons. The relationships noted in the study are characterized by statistically significant spatial differentiation. Spatial pattern analysis was used to identify six regions with different moisture content over the course of the year. The boundaries of the regions confirm the significant role of local factors impacting moisture content.
1. Introduction
Water vapor is a major component of the Earth’s atmosphere. Given its role in processes such as radiation, cloud formation, and energy exchange in the ocean–atmosphere system, water vapor is believed to be the most important trace gas in the atmosphere. The positive feedback of water vapor in the realm of global warming was first noted in the 1960s [1,2]. The main context was an exponential increase in equilibrium water vapor pressure with rising temperature estimated at about 7% per 1 K per decade (according to Clausius-Clapeyron equation) and a quasi-exponential increase of maximum water vapor holding capacity of the Earth’s atmosphere [2]. In addition, its strong absorptivity in the infrared and longwave range makes water vapor an important greenhouse gas. On the other hand, the presence of water vapor also leads to negative feedbacks by reflecting radiation through the clouds. Their properties are determined by the distribution, mobility, and convergence of water vapor. The key impact of water vapor has led to dynamic growth in the monitoring and verification of its content in the Earth’s atmosphere. Advanced and increasingly more refined research methods are making it possible to obtain data via the use of satellites, ground-based sensors (LIDAR), differences in the index of refraction, and wave dissipation speeds determined by the water vapor content of the Earth’s atmosphere.
Water vapor content depends on both latitude and altitude, reaching the highest values near the surface of the Earth in tropical areas. Given its strong relationship with air temperature, the amount of water vapor in the atmosphere is significant up to an altitude of about 2 km. A basic process that controls water vapor content is evaporation over the surface of oceans in the tropical zones of the Earth’s surface. Water vapor is pushed from there towards polar areas, which explains why its content changes dynamically—driven by atmospheric circulation.
The atmospheric moisture content over Europe is associated with the presence of a polar front and stationary eddies carrying a substantial amount of water vapor in the direction of the Earth’s poles in the form of atmospheric rivers [3,4,5]. The largest sources areas of moisture are the Northern Atlantic—especially in the winter—and the Mediterranean Sea [6]. It is the North Atlantic Oscillation that transports heat and moisture from the ocean to land areas in Europe. While the water vapor content over the ocean is determined primarily by air temperature, factors that are relevant over land include moisture advection, local factors, and convection. Its intensity is often limited by thermodynamic constraints and orographic effects. The latter is determined by low-level moisture flow and upslope water vapor transport patterns [7,8].
Changes in water vapor content in the Earth’s atmosphere remains a popular subject of research due to the significance of the subject matter, as described earlier, and consists of key areas such as changing climate conditions [9,10,11,12,13], global distribution of water vapor and its spatial variability [14,15,16,17,18], regional changes in atmospheric moisture content [19,20,21], and also the parametrization of climate models [22,23,24,25]. In addition to the examination of differences and changes, researchers focus on the role of atmospheric circulation in the distribution of water vapor, which is especially important due to its substantial influence on the occurrence of precipitation [3,5,26,27,28]. Research most often occurs in source areas or tropical areas [29,30], polar areas [31,32], and selected coastal areas [4,33]. The significance of the mobility of water vapor as a precipitation factor is also noted in mid-latitudes [28,34,35,36], where it also plays an important role in the development of frontal cyclones. The rapid advection of moisture content over land areas, and especially in the form of atmospheric rivers, causes the occurrence of high precipitation totals. These are enhanced by orographic effects, especially along coastal mountain ranges, which then leads to flooding. For the European continent, both the assessment of changes in the moisture content [13,37] and changes in Arctic areas are considered important. The moisture budget and characteristics of the cloud cover serve as key factors in climate change in the Arctic, and also affect weather patterns in temperate zones [38,39]. The newest climate models indicate that any trends may be exacerbated by high moisture mobility associated with changes in circulation patterns [40].
The purpose of this study is to examine the water vapor content over Europe on a seasonal basis as well as examine its circulation-related basis. The role of atmospheric circulation is defined using principal circulation patterns affecting the study area in different seasons of the year—identified using leading sea level pressure (SLP), empirical orthogonal function (EOF) modes and the advection directions of air masses.
2. Data and Methods
There are many different variables that can be used to describe water vapor content in the air. This study uses the variable precipitable water, also known as total (i.e., vertically integrated) column water vapor, which accurately describes the characteristics discussed in this paper (1).
where:
- q—specific humidity
- g—acceleration of gravity
- η—hybrid, vertical coordinates
- p—pressure, integrated over all model vertical levels
In light of the large number of direct and indirect sources of data on water vapor content in the air, which includes measurement data (hygrometers of different structure and sensors, radiosondes) and remote sensing data (e.g., photometers, LIDARs, satellites, GPS) of variable accuracy, the study was based on data for the period 1981–2015 obtained from ECMWF interim reanalysis (ERA-Interim) with a horizontal resolution of 0.75° [41]. Climatic reanalysis is based on a system of data assimilation (especially in the case of water vapor) and represents a solution in situations with a lack of temporal and spatial homogeneity in data sets. In addition, humidity analysis has become a powerful tool in recent years, resulting in strongly improved parametrization of the representation of the hydrologic cycle in modern reanalysis including ERA-Interim. This then leads to a reduction in the magnitude of errors for humidity-sensitive variables [42]. Many comparative studies have confirmed the usefulness of reanalysis data in the examination of water vapor fields [29,43,44].
The basis for the present study is daily values of total column water vapor (TCWV) averaged using 6-hour data, and complemented with relative humidity data for air masses (RH) up to a level of 700 hPa, selected based on the share of the specific humidity of an air parcel in total column water vapor. The average share for Europe is 87% (80% in polar areas, [31]) and it is considered the most important determinant in hydrometeorologic processes.
Basic statistical analyses were performed on the data set for water vapor content in the atmosphere (TCWV). This included measures of central tendency and dispersion with a key focus on the strong seasonality of temporal and spatial differentiation of air humidity. The next step consisted of a regionalization of differences in water vapor content in the air over Europe preceded by an analysis of spatial autocorrelation using Global Moran’s I statistics. This is a method for examining the intensity of a particular characteristic across geographic space [45]. Humidity regions were identified via the grouping of k-averages, which made it possible to identify strongly dissimilar types characterized by similar characteristics within each given type. This grouping method is successfully utilized in many climatologic studies [46]. The choice of the number of regions was preceded by an independent examination of principal components, which afforded the definition of uncorrelated models of the spatial structure of water vapor content in the atmosphere for consecutive months of the year. One additional step consisted of the use of Pseudo-F Statistics to describe the relationship between clusters and variance inside of these clusters [47].
The mobility of water vapor was characterized using vertically integrated water vapor flux (IWVF) calculated based on Formula (2), specific humidity, and both zonal and meridional wind component values at every available vertical level up to 300 hPa.
where:
- q—specific humidity
- g—acceleration gravity
- u—eastward wind component
- v—northward wind component
The dynamic part of the analysis in this study was supplemented with a determination of main EOF modes based on pressure values at sea level (SLP), circulation types identified based on advection directions and pressure system types [48], and the leading pressure level for water vapor mobility. All analyses in this study were performed for Europe and the North Atlantic, except Greenland, stretching between 27° W and 45° E as well as 33° N and 73.5° N.
The impact of atmospheric circulation on water vapor content in the air was determined based on anomalies and standard deviations of TCWV and IWVF in circulation types. The strength of the relationship between water vapor content in the atmosphere and atmospheric circulation was characterized using the coefficient of correlation for TCWV and IWVF vs. EOF values. Given the role played by water vapor in the occurrence of atmospheric precipitation, the present study also examines the occurrence of moisture extremes identified using the 90th percentile of TCWV as well as relative humidity of air masses in the context of the rate of the condensation process as a leading process in the formation of atmospheric precipitation.
3. Results and Discussion
3.1. Temporal and Spatial Differences in Water Vapor Content
Differences in water vapor content in the troposphere are strongly related to air temperature and strongly depend on latitude, and less so on longitude. In the latter case, the main determinants include local factors such as the presence of water or land, and the increasing role of Europe’s continental climate, which becomes increasingly more relevant in the eastern direction. These patterns are also confirmed in the works of [16,33,35,37].
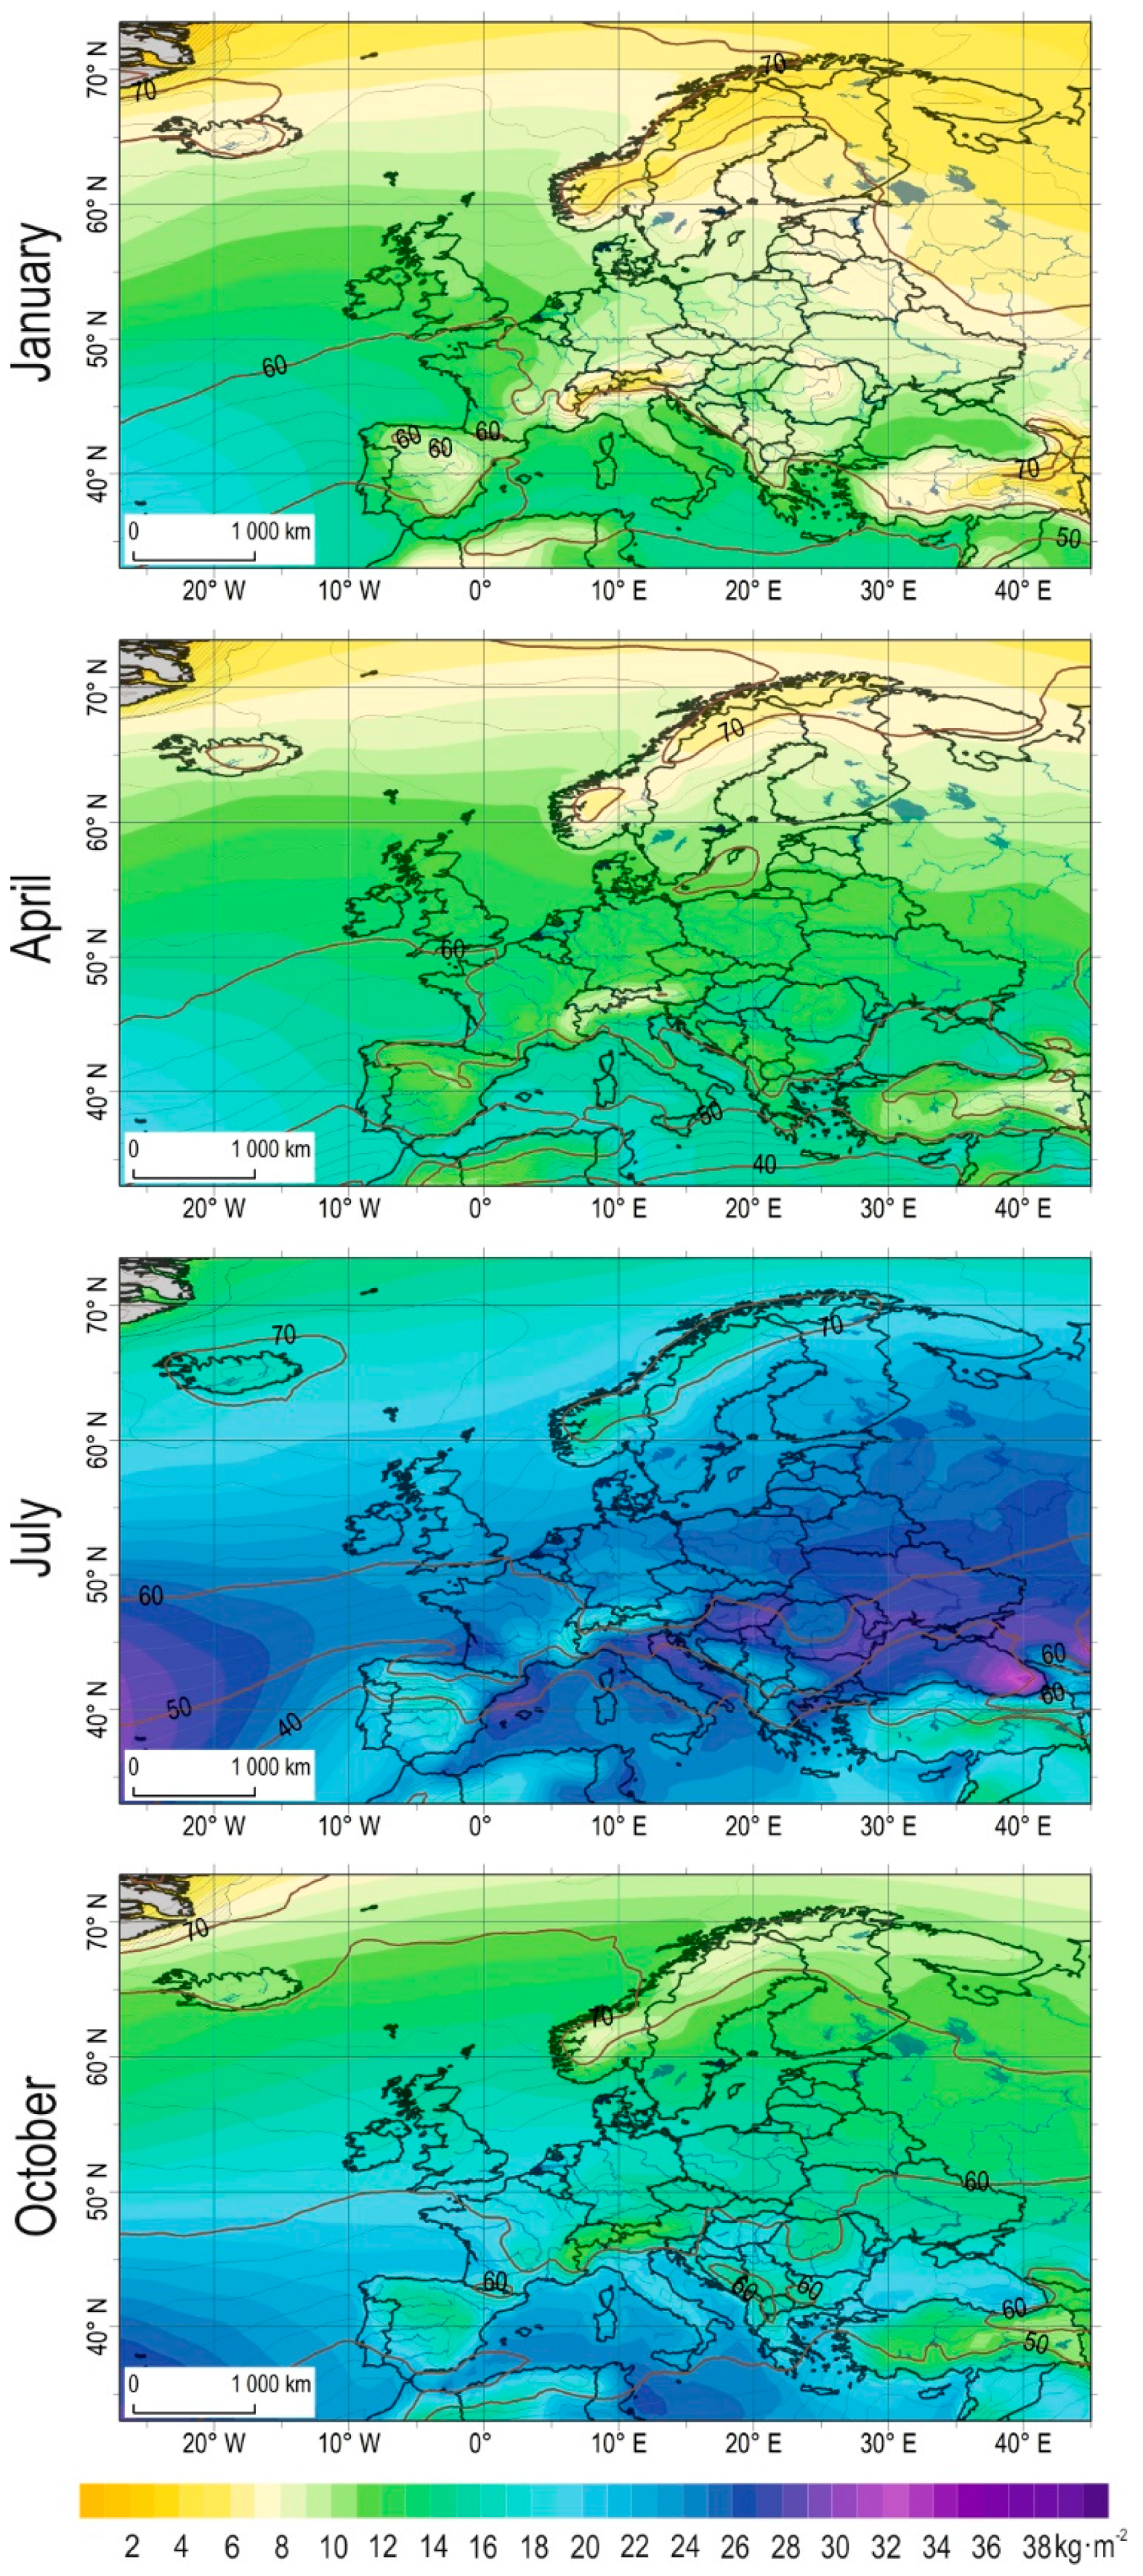
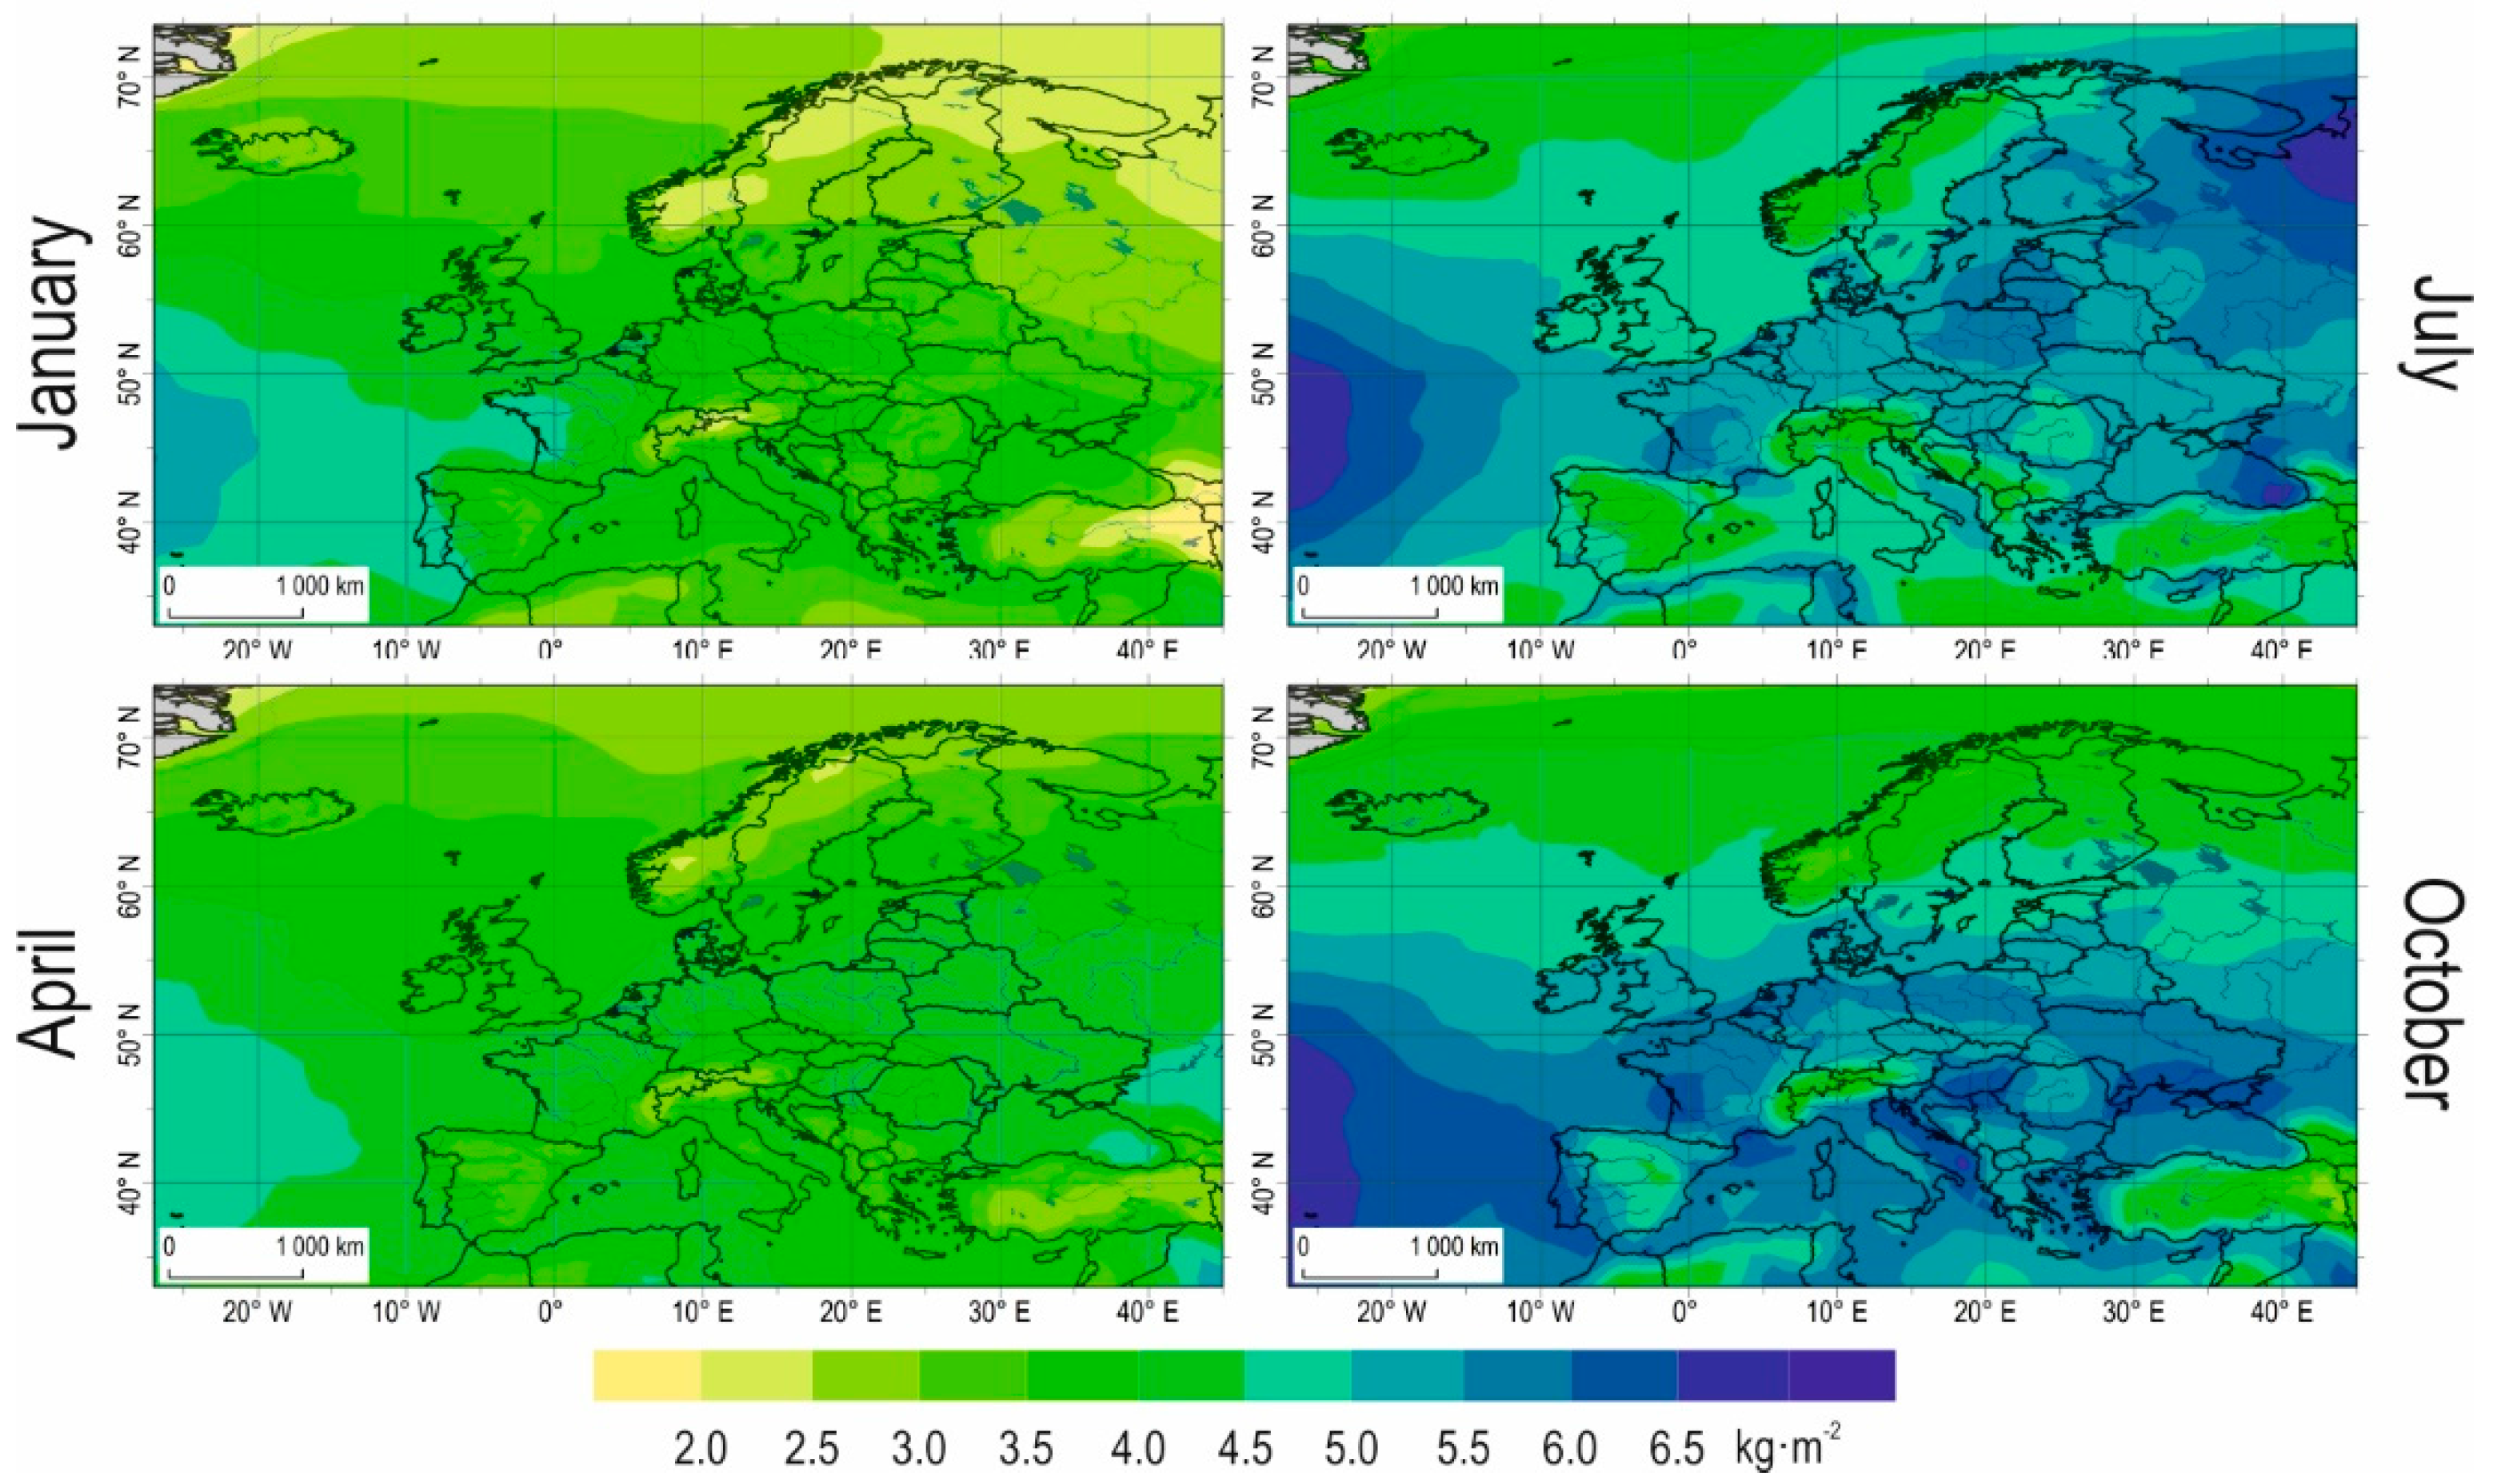
The highest TCWV values noted in the summer (June–August, JJA) range from an average of 14 kg·m−2 at the Arctic Circle to 20–25 kg·m−2 at temperate latitudes to more than 30 kg·m−2 in southeastern Europe (Figure 1), where a seasonal pressure system causes water vapor content to increase with temperature, reaching a TCWV that is higher than that over the ocean (Figure 1). Nevertheless, TCWV values are still lower than those predicted using the Clausius-Clapeyron equation. Ye and Fetzer [20] note that the moisture content for the Eurasian part of the world is less than half (3%) that of the theoretical value. The moisture shortage is first and foremost associated with an open water moisture source, which leads to low RH values in this region (Figure 1). On the other hand, maximum water vapor content in the atmosphere in subtropical and tropical areas is noted later—in September—when the air temperature is still high and the air is able to absorb water vapor emitted by the heated surface of the ocean and area seas. Central-Western Europe lies in a transitional climate zone and receives less moisture, on average, in the summer than do adjacent areas (Figure 1) thanks to ambient temperature conditions (lower temperatures than further inland) and the drying of air masses.
Differences in TCWV in the winter (December to February, DJF) follow an opposite pattern. The largest amounts of water vapor is noted over the warmest water areas or the southern part of the European Atlantic and over the Mediterranean Sea (16–18 kg·m−2), which nevertheless are affected by dominant zonal circulation and the shadow of the Iberian Peninsula. This leads to a drying of air masses (Figure 1). The lowest TCWV values were noted beyond the Arctic Circle and in the northeastern (continental) part of Europe, where moisture values do not exceed 6 kg·m−2 (Figure 1) due to the persistence of seasonal high pressure as well as low temperature.
Moisture conditions in transitional months of the year—a reference to spring (MAM: March, April, May) and autumn (SON: September, October, November)—are the result of conditions prevalent in preceding months; however, oceanic and continental effects cease to be relevant (Figure 1). In the spring, this is due to gradual warming of the continent and a very slow warming of water surfaces, which leads to much less evaporation and limited influx of water vapor into the atmosphere. In the autumn, evaporation from the surface of oceans and seas does provide a source of moisture, which is readily observable, especially in Mediterranean areas (Figure 1). In summary, the water vapor content in the atmosphere over Europe is substantially higher in the autumn versus the spring at comparable RH values (Figure 1).
Low TCWV values are noted throughout the year over mountain areas, especially the Alps and the Caucasus, in the form of areal minima, especially in the winter (Figure 1). The factors that facilitate this outcome are a much thinner atmosphere layer and lower air temperature. In the summer, on the other hand, most water vapor arriving from lower latitudes precipitates out in the form of rainfall, also at the base of mountains due to orographic effects (Figure 1).
Year-to-year variability was also examined based on standard deviations for TCWV values. In winter (January) the largest absolute differences occurred over the southern part of the European Atlantic (4.5–5.0 kg·m−2), reaching east toward the western coast of the Iberian Peninsula, while the smallest were noted at higher altitudes (<2.0 kg·m−2). Significant year-to-year variability in the summer was noted in the interior of the European continent and across areas of ocean (>6.5 kg·m−2). On the other hand, a fairly even distribution of moisture content is characteristic of high latitudes and the Mediterranean Sea, where changes in TCWV stand at less than 4.5 kg·m−2. April was the month with the smallest spatial changes in the study period. The standard deviation (SD) of TCWV in the spring (April) for the entire study area ranged from 3.5 to 4.5 kg·m−2, a much smaller range than that for autumn. For October, SD values ranged from more than 6 kg·m−2 over the Atlantic to about 4 kg·m−2 beyond the Arctic Circle. Outside of mountain areas, TCWV fluctuations clearly follow a zonal pattern (Figure 2).
When related to monthly means the highest variability was noted at higher latitudes, reaching 60% in January, 50% in April and October. Significant relative differentiation was also typical for central and eastern, especially north-eastern parts of Europe (up to 40–45%). In the summer the relative differences are the smallest. They do not exceed 30% in north-eastern regions, while in southern parts these are less than 20% of monthly mean TCWV.
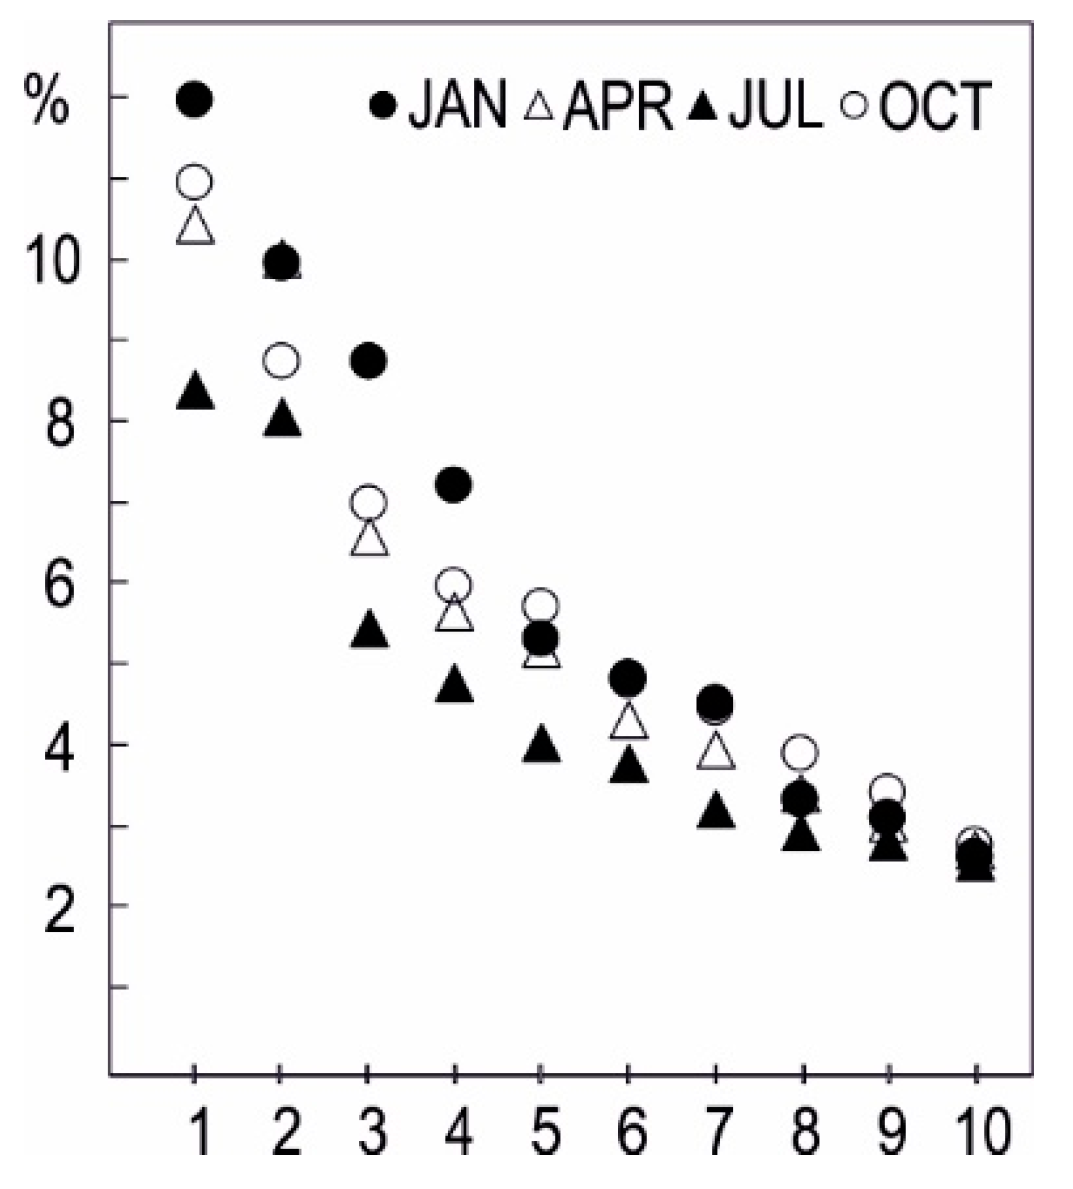
EOF analysis was employed for each month separately in order to supplement the analysis of TCWV (spatial patterns and fluctuations) for all of Europe. The amount of total variance was explained via each subsequent mode for selected months (Figure 3), which shows just how much water vapor content in air varies across a given geographic area. The first 10 modes explain an average of 60% of total variance in January and October, 56% in April, and merely 46% in July. The share of individual modes strongly suggests that only the first two modes serve as the most important TCWV patterns (Figure 3). This is true for all the studied months except January, when the first four modes are characterized by a decreasing but still important amount of variance (Figure 3).
In addition, spatial differentiation in January (Figure 4) shows that in the case of EOF 1, main anomalies are located over the Bay of Biscay (negative anomalies) and near Iceland (positive anomalies), while for EOF 2, the largest anomalies occur over the British Isles and the largest negative anomalies occur over southern Europe (Figure 4).
Spatial patterns for TCWV anomalies in July and October were similar to each other. EOF 1 represents coherent variations over the European continent (negative anomalies), with greater intensity in the summer. EOF 2 represents two types of anomalies: (1) negative anomalies over Europe as a whole; (2) positive anomalies over Western Europe and the British Isles, shifted to the east in July (Figure 4). In the spring (April), the first two EOF modes resemble October patterns with a reversed share in the total variance of monthly mean TCWV (Figure 4).
Temporal and spatial differentiation in water vapor content over Europe was characterized by vivid regional patterns. Spatial autocorrelation results (Morans I) with a given z-score >2.58 and p-value <0.001 for all months confirmed that these clustered patterns could be the result of random events with a probability of less than 1%, and spatial autocorrelation was statistically significant. Spatial pattern analysis was performed using cluster analysis (k-means method, number of clusters distinguished after pseudo-F analysis preceded by EOF analysis) using selected variables describing moisture content independently for every studied month: TCWVAV (monthly mean of TCWV), TCWVSD (monthly standard deviation of TCWV), and RH range at selected pressure levels (950 hPa, 850 hPa, 700 hPa, 500 hPa). The analysis was then repeated for subsequent seasons and for the year as a whole with two extra variables emphasizing the annual pattern of moisture content: TCWVY (annual ratio of TCWV defined as maximum vs. minimum monthly TCWV) and TCWVS (seasonal ratio of TCWV defined as spring vs. autumn TCWV).
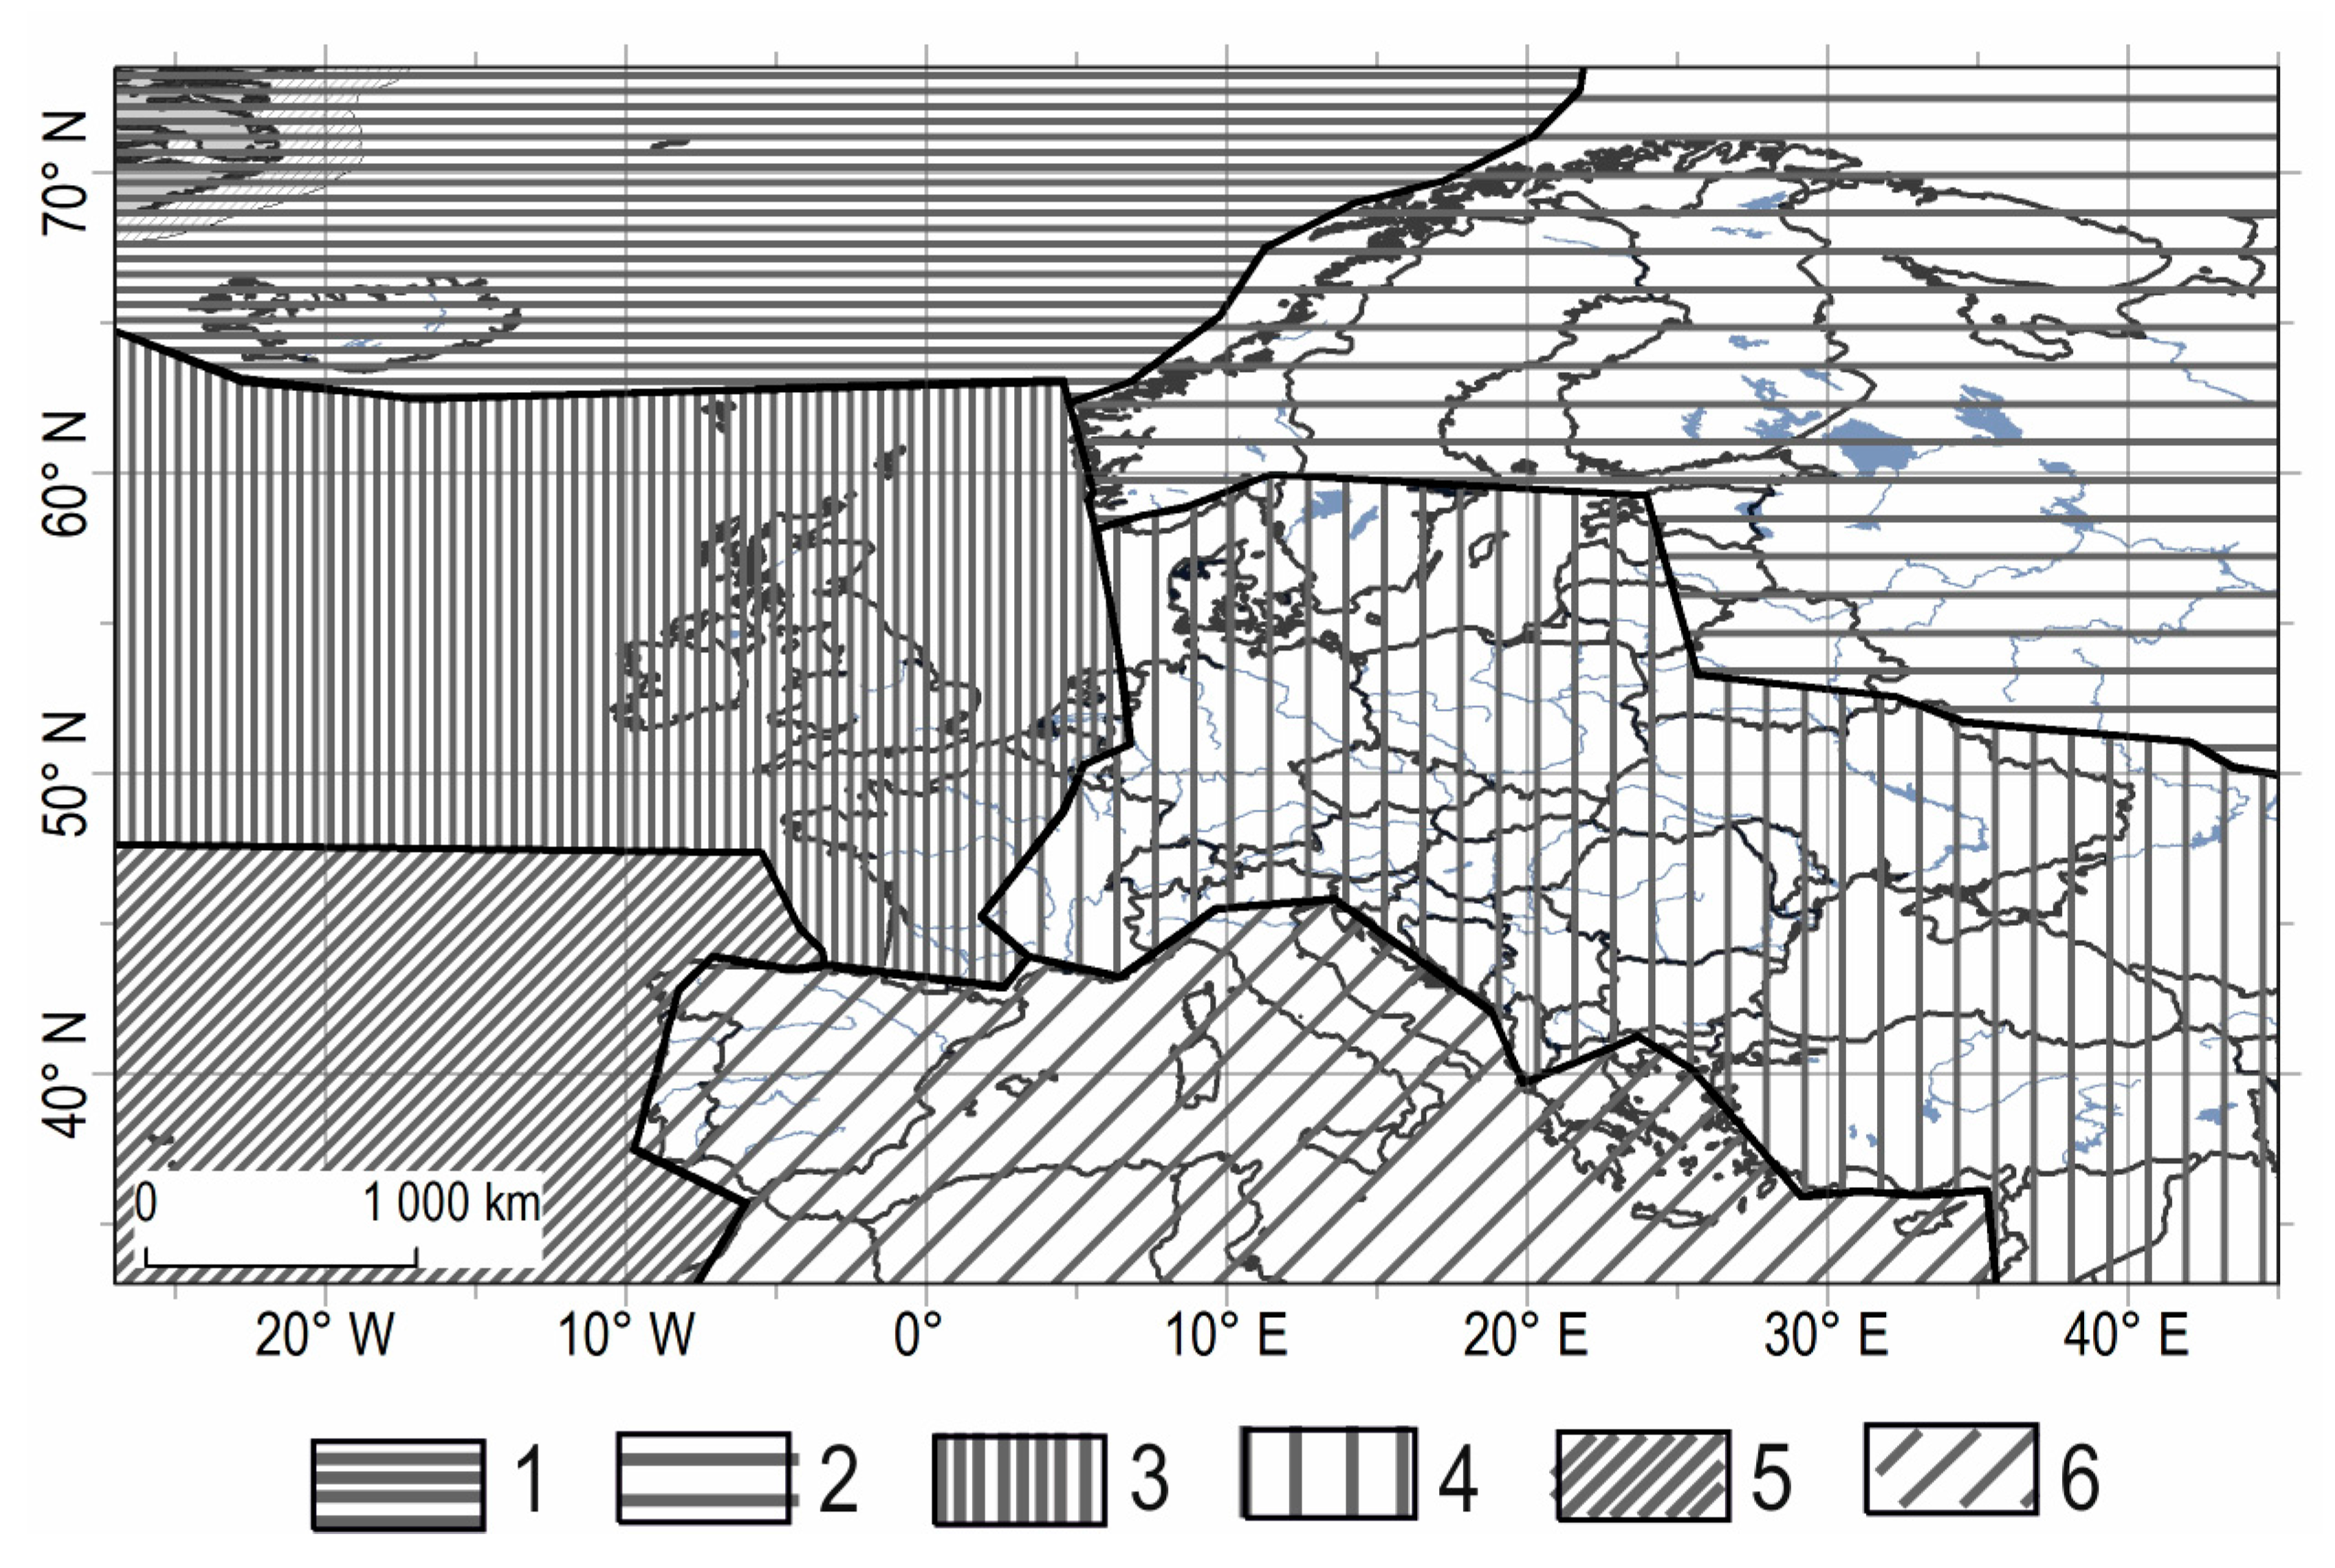
Cluster analysis performed in this study helped identify the following six regions: Northern—Atlantic (NA—1), Northern—Continental (NC—2), Mid—Atlantic (MA—3), Mid—Continental (MC—4), Subtropical—Atlantic (SA—5), and Mediterranean (Med—6) (Figure 5, Table 1).
The most coherent moisture conditions occur in the Subtropical—Atlantic region of Europe, which is characterized by the highest TCWV values and low SD values. The TCWVY ratio is the lowest for all the studied regions, while the RH range does not exceed 15%.
The Northern—Continental region of Europe is characterized by the most easily discernible annual pattern of atmospheric moisture along with little differentiation in RH. The TCWVY ratio confirms the large annual fluctuation of moisture whose content is low, due to ambient temperature conditions, but also more variable than in the Northern—Atlantic region, where the moderating and moisturizing influence of the ocean is more readily observable (Table 1).
The largest differences in the moisture content of air masses is noted in the Mid-Continental and Mediterranean regions. The former is characterized as a region with the largest moisture content in the summer and a moisture deficit (large RH range) and the lowest TCWV values in the winter and represents an excellent example for comparative purposes with the latter or a region with an annual air temperature distribution that produces relatively stabilized moisture conditions. However, differences in moisture conditions do exist due to a reduced delivery of water vapor in the winter caused by lower water temperatures in the Mediterranean Sea, less resulting evaporation, and the presence of the shadow of the Iberian Peninsula along with high TCWV content in the summer. These differences may also be observed in the vertical distribution of relative humidity (RH). At a height of 500 hPa in the free troposphere, the RH range reaches values close to those for the atmospheric boundary layer (950 hPa and 850 hPa). Relative humidity in atmospheric boundary layer (ABL) largely depends on the properties of the active surface layer, while the 500 hPa level reflects the influence of advective patterns associated with upper tropospheric circulation. The large RH range in the mid-troposphere is associated with the transport of dry warm air within Hadley and Mid-Latitude cells during summertime.
The humidity characteristics of the study regions mostly agree with selected regional climatologic studies based on different moisture data sources. Regional humidity conditions over the Mediterranean were studied by Ortiz de Galisteo et al. [21] for Spain as well as Velea et al. [33], for the Mediterranean Sea as a whole. They confirmed the important role of the Iberian Peninsula for the western part of the study area, along with the significance of evaporation processes—especially when sea-land differences are taken into account [33]. These regional patterns were also determined in the present study using gridded data. More comprehensive analysis was conducted by Zveryaev et al. [37]. They analyzed seasonal differences in moisture content over Europe and their circulation backgrounds. The results in the present study are not in full agreement with those calculated by Zveryaev et al. [37] due to seasonality in the cited paper along with a different base period and different data sets. Nevertheless the main structures are compatible. They found the largest variability in winter with two leading pattern centers: the southern part of the Iberian Peninsula (negative anomalies) and the southwestern part of Scandinavia (positive anomalies), which correspond to key patterns identified in this study (Figure 4).
Moisture data collected by weather balloons were analyzed also by Gaffen et al. [49] for the whole globe. They classified the European continent as having a middle to high latitude humidity regime; oceanic in the west, and continental in Central and Eastern Europe. Gridded data covering the entire study area provided spatially homogeneous information on moisture content over Europe. Moreover, given the large variety of variables available and obtained using consistent methodology, gridded data allowed a comprehensive analysis of processes determining the amount of moisture to be conducted. Therefore the use of gridded data in this study made it possible to identify more detailed divisions.
3.2. Role of Atmospheric Circulation
The vast majority of the European continent was found at temperate latitudes in an area with a predominance of western winds. Weather conditions across the continent were shaped first and foremost by zonal circulation (North Atlantic Oscillation—NAO) weakened from time to time by the occurrence of blocking systems generating a longitudinal flux of air masses.
The role of NAO in the moisture content present over Europe was emphasized by Hurrel [51] and Ruprecht et al. [34], who suggest an increase in water vapor mobility during high NAO winters (up to 30%). In addition, Stohl et al. [52] states that a positive NAO phase enhances the jet stream, which accelerates moisture flux. In agreement with advection directions, higher moisture content is noted in Northern Europe, while negative NAO phases direct a markedly weaker stream of moisture to Central and Southern Europe. Most of the moisture moves via cyclones that tend to occur with much more intensity during high NAO winters. The cyclone effect on air moisture mobility is observed in a number of regional studies including Jakobson and Vihma [32] and Boutle et al. [35]. Nevertheless, cyclones occurring during low NAO winters in southern Europe move approximately 60% more moisture than northern cyclones [34].
Spatial differentiation in vertically integrated water vapor eastward (i.e., zonal) and northward (i.e., meridional) flux (Figure 6) confirms the strong significance of zonal circulation carrying air masses saturated with moisture from over the ocean across the European subcontinent—first and foremost across Western Europe and the Atlantic coast of the Scandinavian Peninsula (high positive eastward flux values). A study by Lavers and Villarini [3] also confirms this finding. Zonal flux is most difficult to discern in the spring (April), which is also characterized by little differentiation in moisture conditions (cf. Figure 1, Figure 2 and Figure 4).
Meridional moisture flux is characterized by much less intensity (Figure 6) and produces much weaker effects, as noted by Lavers and Villarini [3], Couto et al. [4], and Salstein et al. [14]. Most of the European subcontinent experiences a value close to zero, especially in January, or slightly positive values in northern and eastern continental regions. In a climatologic sense, this indicates the absence of a dominant advection direction in longitudinal flow. Northward (positive) flux and southward (negative) flux compensate for one another. The significance of meridional moisture flux is substantial in the Mediterranean region according to Lavers and Villarini [3], as is the case with the Subtropical—Atlantic region. However, the advection of moisture in the latter is closely associated with a shift in the intertropical convergence zone towards higher latitudes and air circulation in the Azores High, which has a much better defined system center in the summer season. According to Salstein et al. [14], the magnitude of the northward vertically integrated vapor flux not only depends on the water vapor content, which serves as a significant factor in zonal flow, but also on the direction of advection. Differences in pressure fields in the summer in southern Europe generate southward air mass flows, which produces high negative northward IWVF values (Figure 6).
The North Atlantic Oscillation strongly affects weather patterns in Europe, but is not the sole determinant. In many areas, it is actually a marginal force, where other weather forces play a major role and this includes local circulation conditions [53]. This explains why the evaluation of the relationship between moisture content and atmospheric circulation was performed herein based on the correlation between TCWV and selected SLP EOF modes.
Principal Component Analysis (PCA) indicated that in each of the four studied months (January, April, July, October), three main circulation patterns explained in each case more than 60% of total variance. Spatial patterns for the first two EOF modes for each month are provided in Figure 7 (solid lines). The winter distribution of pressure fields (January)—EOF 1 (32% of total variance)—depicted one negative anomaly determining the influx of air masses from the west and southwest. A high positive correlation coefficient (r > 0.4) noted across most of Europe (Figure 7, in color) confirmed the dependence of TCWV on zonal circulation in the winter. The spatial pattern of EOF 2, which explained 23% of total variance, showed a dipolar system of major centers leading to advection from the northwest. The effect on differences in TCWV was substantially smaller, although statistically significant. The interior of the subcontinent and the Mid-Atlantic region was characterized by positive correlation coefficients, while this particular spatial pattern of atmospheric circulation in the Mediterranean region led to the advection of dry air—dried over the surface of the continent (Figure 7). In July, EOF 1 explained 26% of total variance.
One center of activity with a negative pressure anomaly determines advection from the west over the continent—a statistically significant relationship (positive correlation) only in the northeastern part of the study area—as well as the influx of air masses from the northeast over the Norwegian Sea (negative correlation, linked with the influx of dry air from over Europe). This type of situation is described by Phillips and McGregor [54] as one of two reasons for drought across the British Isles. EOF 2 (18.7%) featured a dipolar system of centers, with the center of negative anomalies over the Atlantic and center of positive anomalies over the Gulf of Bothnia, which generates air flow from the southwest and over the subcontinent. For most of Europe, this type of circulation pattern did not produce a statistically significant effect on TCWV, with the exception of western and northwestern coastal areas and adjacent sea areas.
The advection of warm air heated over land surfaces leads to positive anomalies in moisture content. In the transitional months of the year (April, October), the strength of the dependence is much lower than in January and July—the coefficient of correlation exceeded 0.1 or equaled less than −0.1 (statistically significant at α = 0.05) only in selected geographic areas. The EOF 1 for both months was manifested via an extensive center of positive anomalies in the north of the study area. This spatial pattern generated statistically significant relationships with TCWV in Central and Northern Europe and over the North Atlantic. EOF 2 modes mirrored patterns for the preceding season of the year—i.e., July pattern in October and January pattern in July (Figure 7).
Principal component analysis was also conducted for SLP for days featuring extremely high moisture content. Extreme cases were defined to be cases exceeding the 90th percentile of TCWV (TCWV 90p). However, in order to avoid the dispersal of information, a day with extreme TCWV was defined herein to be a day where extreme moisture content occurs across at least 10% of the study area. Much like in the case of mean values, three main atmospheric pressure patterns of SLP were identified for each month for extreme cases. The three main patterns, on average, explained almost 80% of total variance. In January, the first two EOF modes identified two regions where extreme TCWV depended on circulation: (1) Northern—Atlantic (EOF 1, 38% of total variance); (2) Northern—Continental (EOF 2, 23% of total variance). The two regions were characterized by high positive coefficients of correlation for circulation versus TCWV 90p (Figure 8).
The dipolar distribution of pressure systems in July determined the occurrence of extremes in the Baltic region (EOF 1, 27% of total variance). The EOF 2 SLP mode in July did not show a statistically significant correlation with the occurrence of TCWV extremes (Figure 8), which was indicative of a non-circulation origin or are caused by convection processes triggered by high instability of the atmosphere or geographically native orographic forcing (Figure 9). In April, TCWV extremes should not be associated with the identified pressure systems across most of the study area. Exceptions consisted of regions NA (EOF 1) and MC (EOF 2). In the latter case, the occurrence of extremes was facilitated by advection of warmer air from both the southwest and south (Figure 8). On the other hand, advection in October determined by the location of key pressure centers (EOF modes) prompted the statistically significant occurrence of high content of moisture over the Atlantic (EOF 1, EOF 2) and in the interior of the continent (EOF 1). In addition to the mentioned cases where circulation patterns strongly favored extremely elevated TCWV values, there existed some areas where the occurrence of TCWV 90p was blocked by the advection of low moisture air masses (Figure 8).
The last stage of analysis consisted of a description of the relationship between atmospheric circulation and moisture content for selected advection types. A simple classification system was devised based on advection directions obtained via geostrophic wind directions and types of pressure situations based on SLP values at a given point, with the boundary value assumed to be 1013.3 hPa. One additional criterion was wind speed. In the case ≤2 m·s−1, advection-free types were also identified [48]. A total of 16 types were identified in the study—nine cyclonic (c) and anticyclonic (a) as well as two advection-free types (c, a).
The magnitudes of TCWV and IWVF anomalies for different types of advection were analyzed in the study. Anomalies were defined with regard to monthly means of TCWV and IWVF (1981–2015) to emphasize the modifying effect of advection directions. Figure 9a,b show only selected situations characterized by the largest spatial differentiation or strong regional significance.
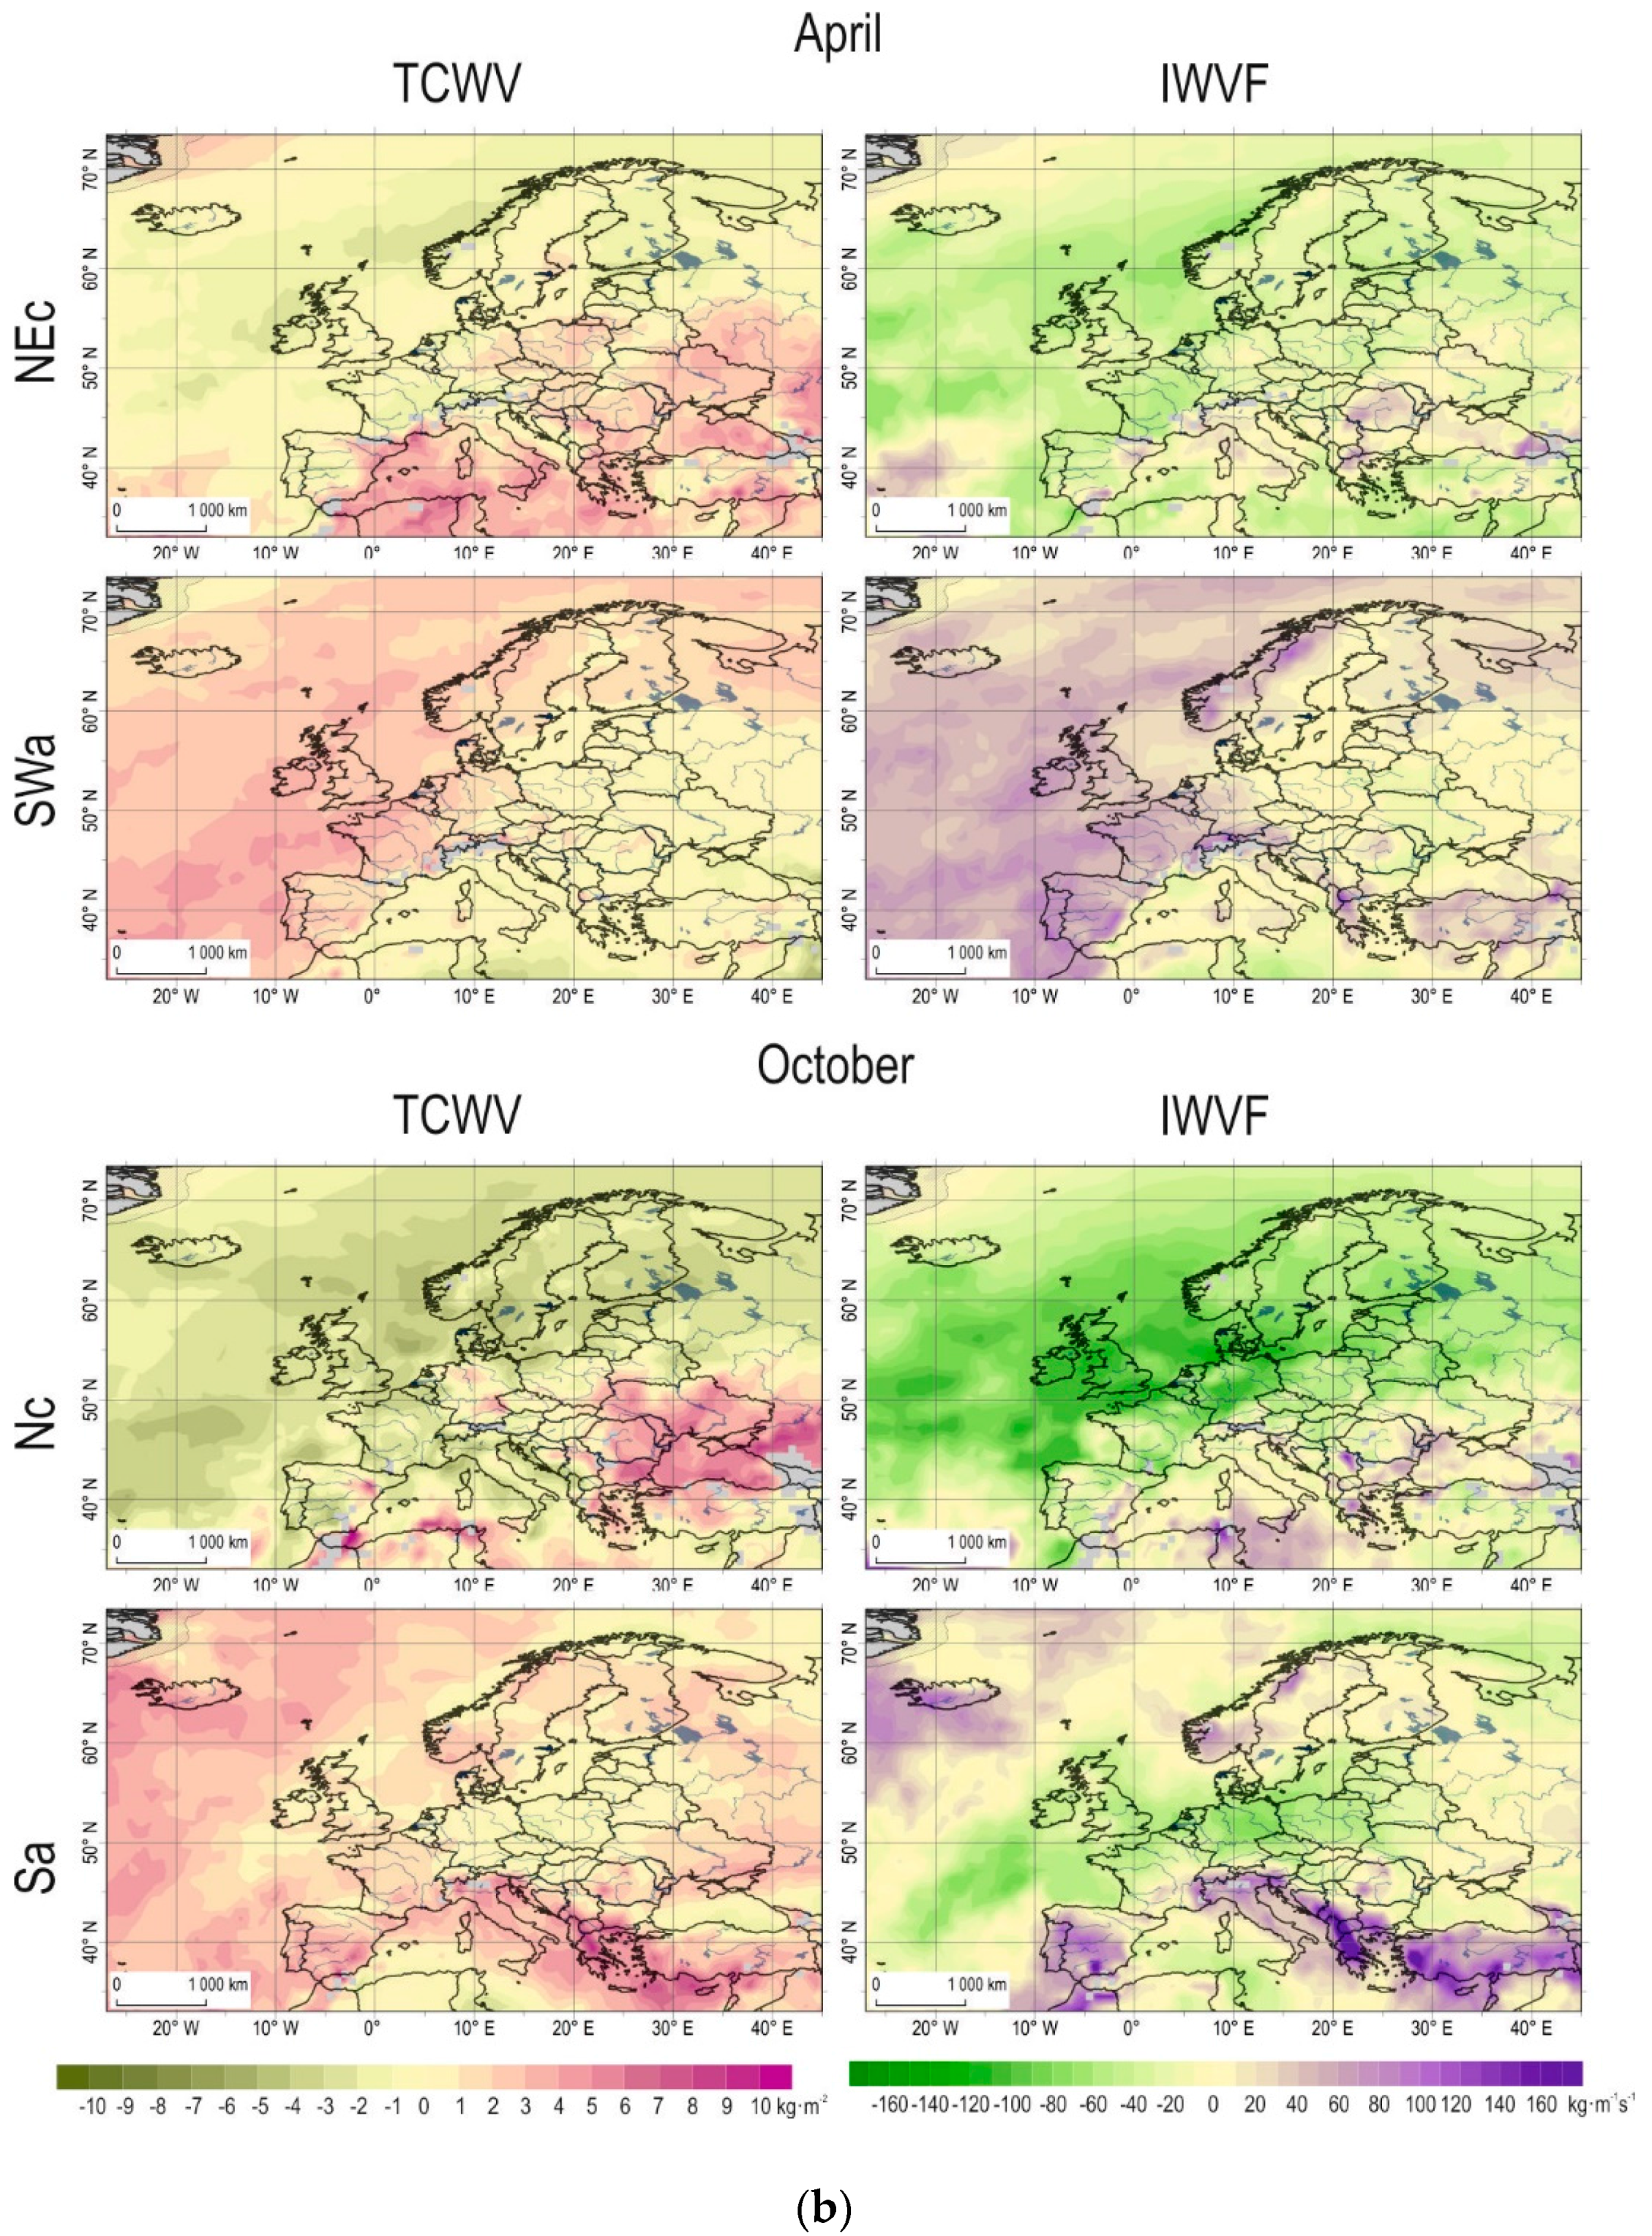
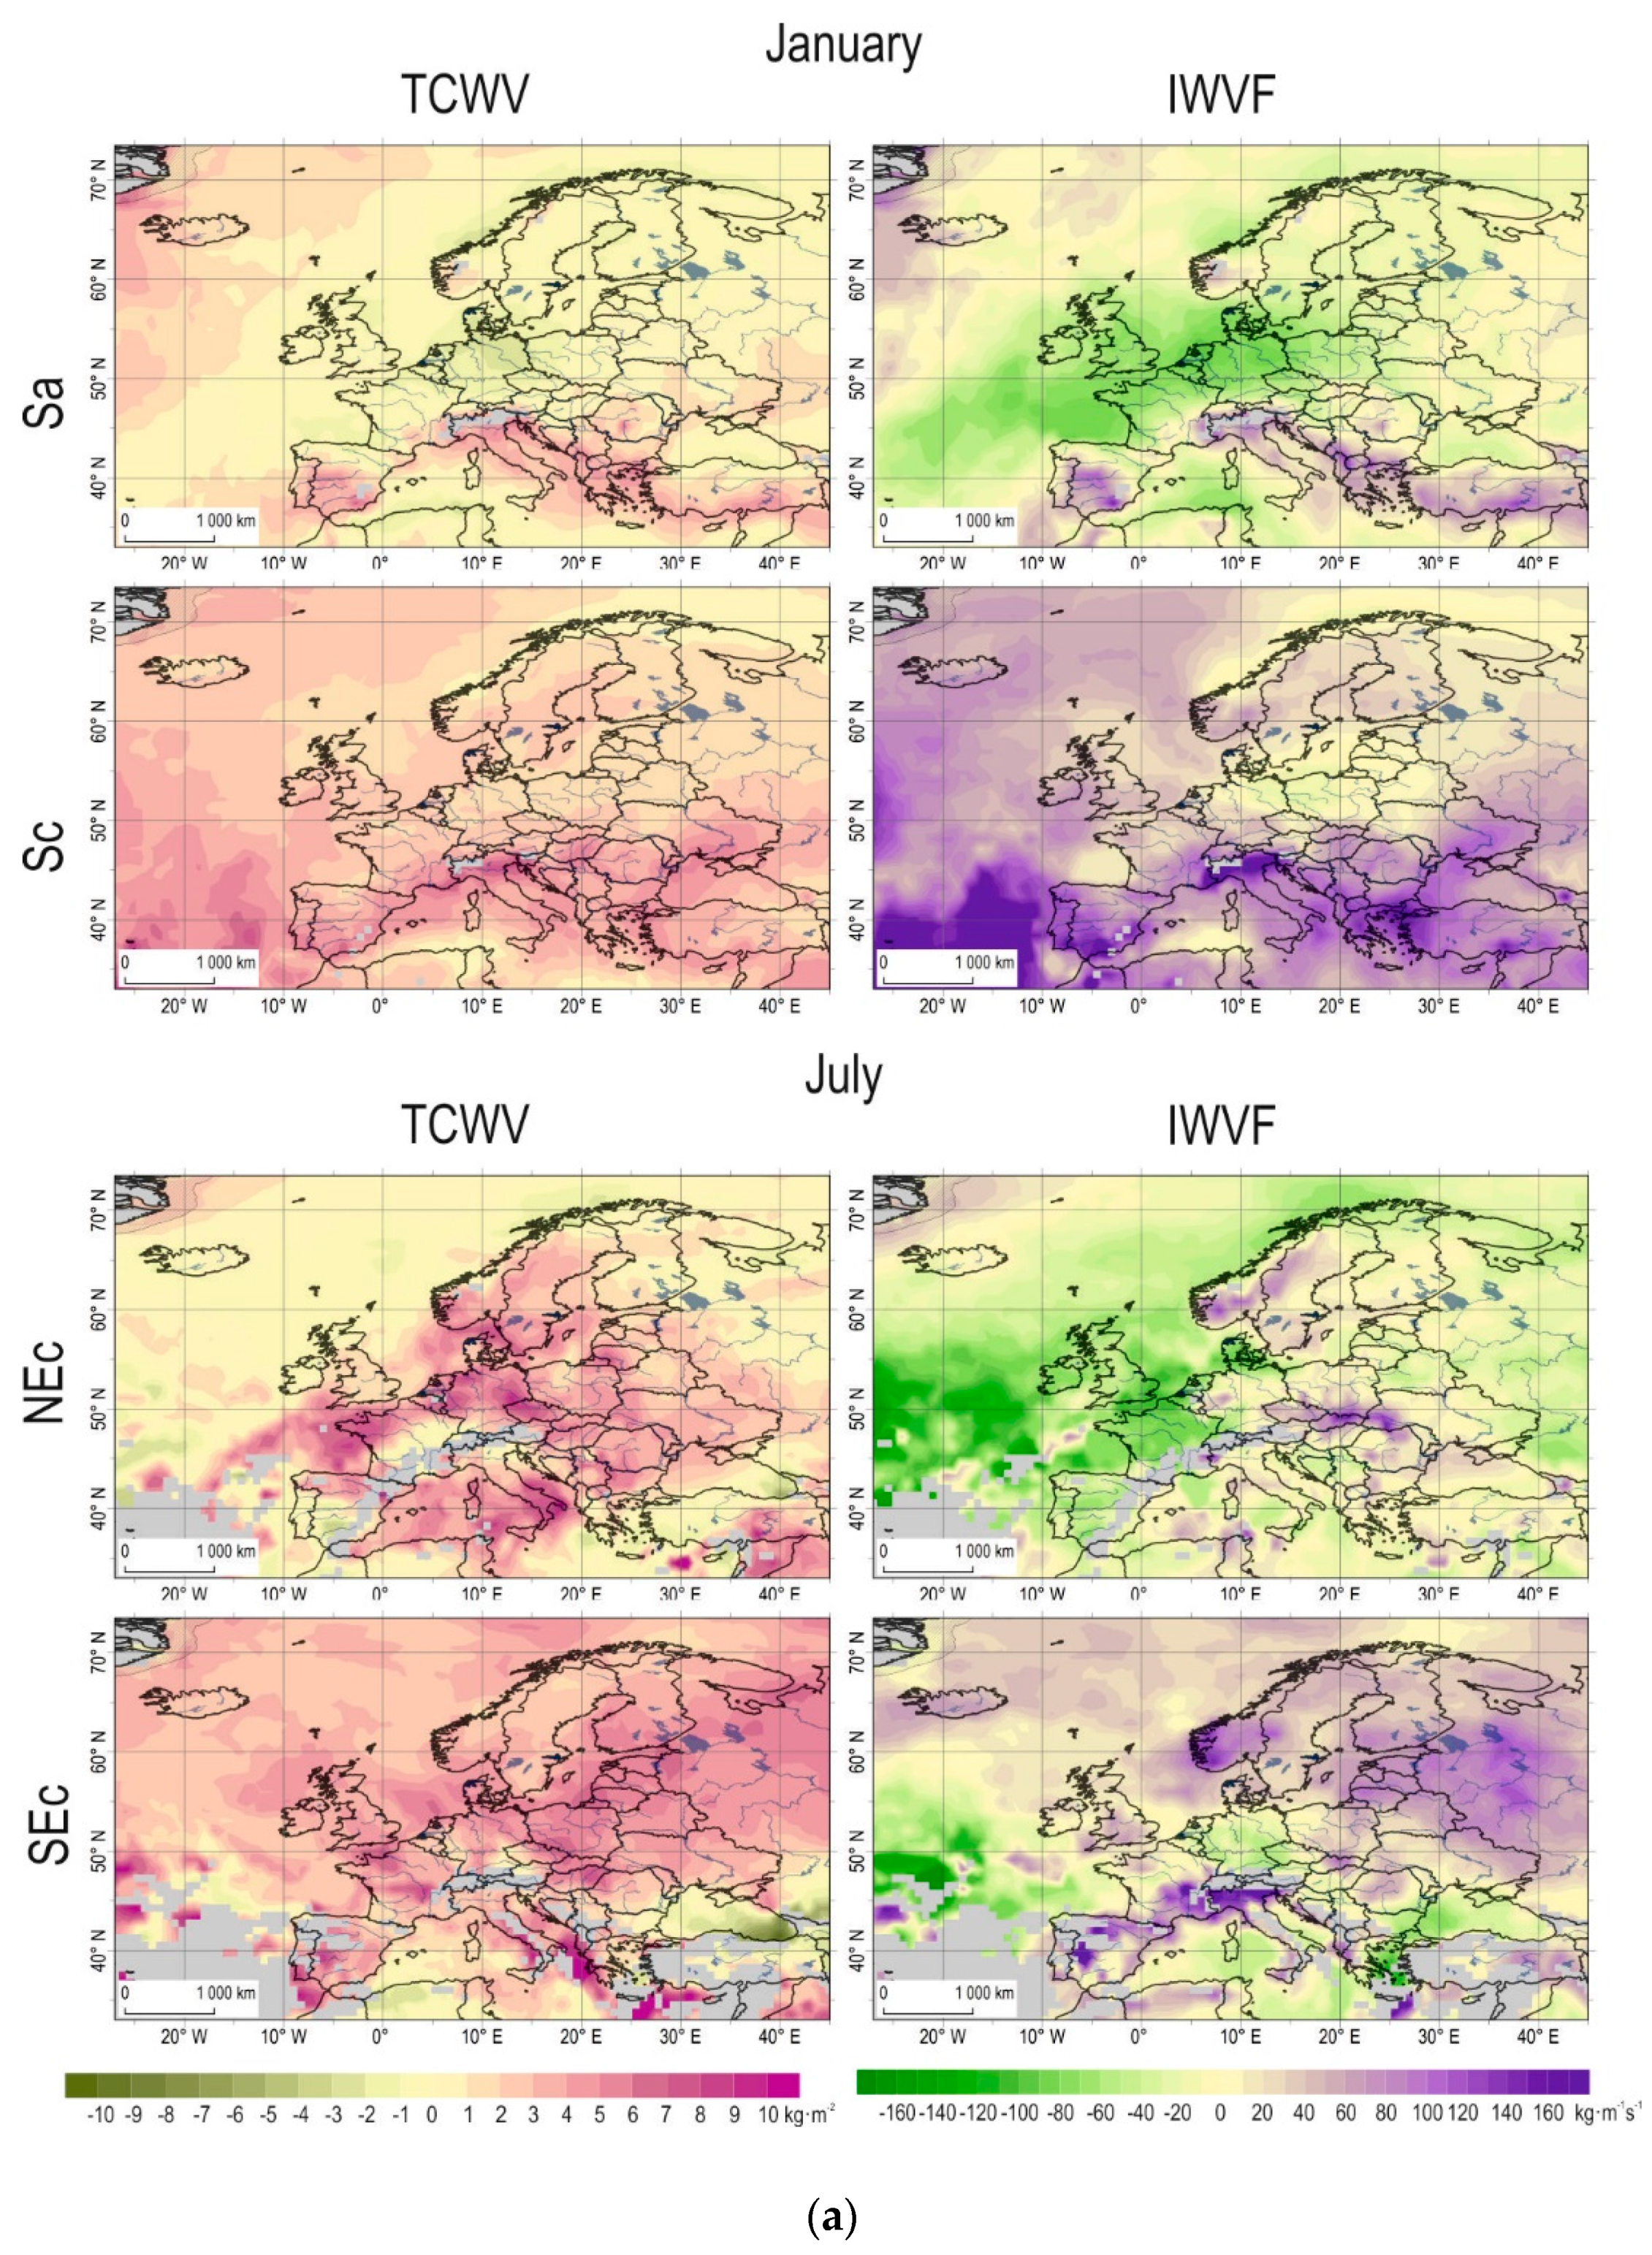
Advection types from the south (Sa, Sc) were selected for January in order to show contrast. It was easy to observe the “drying” effect of the seasonal pressure high over land areas along with the orographic barrier produced by the Alps (Sa). The largest positive anomalies in TCWV and IWVF occurred in the Mediterranean region, while the largest negative anomalies occurred in Central and Western Europe. Cyclones [34] helped facilitate the mobility of water vapor (Sc). The spatial differentiation of anomalies in both variables was much smaller. The advection of warm air from the south containing a relatively high amount of moisture was an additional driver of positive anomalies across most of the study area, except for areas in the shadow of an orographic barrier (Figure 9a). The situation with the largest positive anomalies in the study area (TCWV and IWVF) was January Sc, which was also characterized by the highest frequency of the occurrence of TCWV extremes whose relative humidity for a given air mass exceeded 80%.
The first example for July showed a situation where air from over the Mediterranean Sea (NEc) reaches Central and Eastern Europe along the so-called Vb van Bebber track [55]. Cyclone systems transported moisture north from areas found over the Mediterranean Sea characterized by rapid evaporation. While Central Europe only received at most 80% of the moisture from the source area, the rest was lost along the way due to changes in the air mass and advection that led to atmospheric precipitation [36]. TCWV anomalies suggested a moisture surplus, but the orographic barrier of the Carpathian and Sudeten mountain chains triggered positive IWVF anomalies on the windward side (Figure 9a). Advection from the southeast (SEc) triggered the occurrence of positive TCWV anomalies not only over land areas, but also over ocean areas (Figure 9a). The largest IWVF anomalies occurred on the windward side of the Alpide mountain belt and in the northeastern part of the European subcontinent.
The occurrence of TCWV extremes in July do not appear to be associated with air circulation in a statistically significant sense—there was a lack of a dominant advection direction. This was also confirmed by results published by Zveryaev et al. [37], Lavers and Villarini [3], and Allan et al. [5] on the marginal role of air circulation in moisture conditions in the summer. Moisture extremes are associated with convection, which depends on atmospheric stability; in addition, orographic patterns also play a role [5]. Furthermore, fairly low relative humidity of air masses (RH < 70%, areal average) precludes condensation of water vapor, which leads to only small amounts of atmospheric precipitation. In the absence of moisture advection, what occurs is recycled precipitation driven by local water evaporation [26]. The dominant convective nature of atmospheric precipitation in summer is consistent with many atmospheric typologies produced for Europe [56,57,58,59].
Differences in moisture content for April may be explained in part by water versus land cover, especially in the case of the SWa situation (Figure 9b). Advection from over the ocean carried humid air that reaches the western coast of the subcontinent. The continental part of Europe and the Mediterranean Sea region were characterized by negative TCWV anomalies due to the presence of a pressure high and location in the shadow of the Iberian Peninsula, respectively. The Sa situation in October is also worth a closer look. Higher temperatures of air arriving in the largest part of the study area resulted in positive TCWV anomalies, while the largest IWVF anomalies were associated with orographic forcing by the Alps—as in the case of January (Figure 9b). The occurrence of moisture extremes during transitional months (April, October) was associated first and foremost with advection from the southwest. In the vast majority of cases, these were situations with relative humidity above 80% and stationary or transient eddies. The exception here was the Mediterranean region, which was characterized by TCWV extremes with a low RH (July < 50%) throughout the entire year.
Differences in water vapor content in the air are a critical component of any regional analysis of atmospheric precipitation. Koffi et al. [28] and others have shown significant differences in IWVF values. The supply of precipitation water in an air mass moving across a given area in the form of high speed currents of water vapor (i.e., atmospheric rivers) may be 10 times larger than that produced by quiet spells of weather [28]. This type of situation creates the right conditions for precipitation; however, the right conditions for the process that triggers precipitation must also exist; this includes favorable orography [4]. Koffi et al. [28] and Couto et al. [4] show that not all cases of atmospheric precipitation are associated with atmospheric rivers. Phillips and McGregor [54] note that the direction of advection is even more important than magnitude, which is also confirmed in studies on the Mediterranean region [33].
4. Conclusions
Large-scale patterns of TCWV variability across the northern hemisphere were first identified several decades ago, but remain a strong subject of interest due to the significance of water vapor in key atmospheric processes. Given the objective difficulty of measuring water vapor content in the air, many researchers choose to focus on data quality, continuity, and homogeneity. Climatologic reanalysis appears to solve this problem to some extent. Despite the fact that the models used in reanalysis studies are characterized by poor parametrization of the hydrologic cycle, although errors are reduced in the course of the development of each reanalysis, the usefulness of reanalysis data (especially ERA-Interim) has been confirmed by numerous comparative studies) [29,44,59,60] featuring analyses with less temporal resolution (averaged data) and covering larger geographic areas (e.g., studies on climate change. In addition, gridded data now yield spatial information with a resolution high enough to make spatial pattern analysis possible.
The present study provides an analysis of temporal and spatial TCWV differentiation for the continent of Europe based on ERA-Interim reanalysis. The use of spatial pattern analysis was conducted to identify six regions with different moisture conditions over the course of the year.
The study confirmed that atmospheric circulation is a key factor in moisture levels in the winter (January). Air rich in water vapor moves from over the ocean to areas over land due to zonal circulation, and in the northerly direction due to meridional flux. Research has shown a statistical relationship between circulation patterns expressed by EOF modes and TCWV as well as between existing advection types and TCWV and IWVF. Substantially weaker relationships were determined for transitional season months such as April and October and for the summer season. The lack of a correlation between atmospheric circulation and TCWV in July and a significant moisture deficit in air masses on days with extreme moisture levels indicate that summer atmospheric precipitation across the European subcontinent originates primarily in convection processes, while horizontal moisture flux plays a secondary role.
The differences identified between each studied region and the results of circulation analysis suggest the need for additional research in order to help differentiate the vertical structure of tropospheric moisture, and to help identify the role played by pressure fields in its formation, especially in the winter season.
Acknowledgments
ERA-Interim data provided courtesy ECMWF. The authors would like to thank the anonymous reviewers for their valuable comments and suggestions to improve the quality of the paper.
Author Contributions
Bogdan Bochenek and Michał Różycki processed raw data and conducted principal component analysis. Agnieszka Wypych performed calculations, prepared figures, produced the original idea for the paper, and wrote the paper.
Conflicts of Interest
The authors declare no conflict of interest.
References
- Möller, F. On the influence of changes in the CO2 concentration in air on the radiation balance of the Earth’s surface and on the climate. J. Geophys. Res. 1963, 68, 3877–3886. [Google Scholar] [CrossRef]
- Manabe, S.; Wetherald, R.T. Thermal equilibrium of the atmosphere with a given distribution of relative humidity. J. Atmos. Sci. 1967, 24, 241–259. [Google Scholar] [CrossRef]
- Lavers, D.A.; Villarini, G. The relationship between daily European precipitation and measures of atmospheric water vapour transport. Int. J. Climatol. 2015, 35, 2187–2192. [Google Scholar] [CrossRef]
- Couto, F.T.; Salgado, R.; Costab, M.J.; Prior, V. Precipitation in the Madeira Island over a 10-year period and the meridional water vapour transport during the winter seasons. Int. J. Climatol. 2015, 35, 3748–3759. [Google Scholar] [CrossRef]
- Allan, R.P.; Lavers, D.A.; Champion, A.J. Diagnosing links between atmospheric moisture and extreme daily precipitation over the UK. Int. J. Climatol. 2016, 36, 3191–3206. [Google Scholar] [CrossRef]
- Gimeno, L.; Drumond, A.; Nieto, R.; Trigo, R.M.; Stohl, A. On the origin of continental precipitation. Geophys. Res. Lett. 2010, 37, L13804. [Google Scholar] [CrossRef]
- Neiman, P.J.; Ralph, F.M.; White, A.B.; Kingsmill, D.E.; Persson, P.O.G. The statistical relationship between upslope flow and rainfall in California’s coastal mountains: Observations during CALJET. Mon. Weather Rev. 2002, 130, 1468–1492. [Google Scholar] [CrossRef]
- Ralph, F.M.; Coleman, T.; Neiman, P.J.; Zamora, R.; Dettinger, M.D. Observed impacts of duration and seasonality of atmospheric-river landfalls on soil moisture and runoff in coastal northern California. J. Hydrometeorol. 2013, 14, 443–459. [Google Scholar] [CrossRef]
- Schneider, E.K.; Kirtman, B.P.; Lindzen, R.S. Tropospheric water vapor and climate sensitivity. J. Atmos. Sci. 1999, 56, 16491–16658. [Google Scholar] [CrossRef]
- Hall, A.; Manabe, S. The role of water vapor feedback in unperturbed climate variability and global Warming. J. Clim. 1999, 12, 23272–23346. [Google Scholar] [CrossRef]
- Mieruch, S.; Nöel, S.; Bovensmann, H.; Burrows, J.P. Analysis of global water vapour trends from satellite measurements in the visible spectral range. Atmos. Chem. Phys. 2008, 8, 491–504. [Google Scholar] [CrossRef]
- Allan, R.P.; Zveryaev, I.I. Variability in the summer season hydrological cycle over the Atlantic-Europe region 1979–2007. Int. J. Climatol. 2011, 31, 337–348. [Google Scholar] [CrossRef]
- Mattar, C.; Sobrino, J.A.; Julien, Y.; Morales, L. Trends in column integrated water vapour over Europe from 1973 to 2003. Int. J. Climatol. 2011, 31, 1749–1757. [Google Scholar] [CrossRef]
- Salstein, D.D.; Rosen, R.D.; Peixoto, J.P. Modes of variability in annual hemispheric water vapor and transport fields. J. Atmos. Sci. 1983, 40, 788–804. [Google Scholar] [CrossRef]
- Gaffen, D.J.; Barnett, T.P.; Elliott, W.P. Space and time scales of global tropospheric moisture. J. Clim. 1991, 4, 989–1008. [Google Scholar] [CrossRef]
- Trenberth, K.E. Atmospheric moisture recycling: Role of advection and local evaporation. J. Clim. 1999, 12, 1368–1381. [Google Scholar] [CrossRef]
- Trenberth, K.E.; Fasullo, J.; Smith, L. Trends and variability in column-integrated atmospheric water vapor. Clim. Dyn. 2005, 24, 741–758. [Google Scholar] [CrossRef]
- Wagner, T.; Beirle, S.; Grzegorski, M.; Platt, U. Global trends (1996–2003) of total column precipitable water observed by Global Ozone Monitoring Experiment (GOME) on ERS-2 and their relation to near-surface temperature. J. Geophys. Res. 2006, 111, D12102. [Google Scholar] [CrossRef]
- Morland, J.; Collaud Coen, M.; Hocke, K.; Jeannet, P.; Mätzler, C. Tropospheric water vapour above Switzerland over the last 12 years. Atmos. Chem. Phys. 2009, 9, 5975–5988. [Google Scholar] [CrossRef] [Green Version]
- Ye, A.; Fetzer, E.J. Atmospheric moisture content associated with surface air temperatures over northern Eurasia. Int. J. Climatol. 2010, 30, 1463–1471. [Google Scholar] [CrossRef]
- Ortiz de Galisteo, J.P.; Bennouna, Y.; Toledano, C.; Cachorro, V.; Romero, P.; Andrés, M.I.; Torres, B. Analysis of the annual cycle of the precipitable water vapour over Spain from 10-year homogenized series of GPS data. Q. J. R. Meteorol. Soc. 2014, 140, 397–406. [Google Scholar] [CrossRef]
- Allan, R.P.; Ringer, M.A.; Slingo, A. Evaluation of moisture in the Hadley Centre Climate Model using simulations of HIRS water vapour channel radiances. Q. J. R. Meteorol. Soc. 2003, 129, 3371–3389. [Google Scholar] [CrossRef]
- Ingram, W. A very simple model for the water vapour feedback on climate change. Q.J.R. Meteorol. Soc. 2010, 136, 30–40. [Google Scholar] [CrossRef]
- Kahn, B.H.; Teixeira, J.; Fetzer, E.J.; Gettelman, A.; Hristova-Veleva, S.M.; Huang, X.; Kochanski, A.K.; Köhler, M.; Krueger, S.K.; Wood, R.; et al. Temperature and water vapor variance scaling in global models: Comparisons to satellite and aircraft data. J. Atmos. Sci. 2011, 68, 2156–2168. [Google Scholar] [CrossRef]
- Ning, T.; Elgered, G.; Willén, U.; Johansson, J.M. Evaluation of the atmospheric water vapor content in a regional climate model using ground-based GPS measurements. J. Geophys. Res. Atmos. 2013, 118, 329–339. [Google Scholar] [CrossRef]
- Bisselink, B.; Dolman, A.J. Precipitation recycling: Moisture sources over Europe using ERA-40 Data. J. Hydrometeorol. 2008, 9, 1073–1083. [Google Scholar] [CrossRef]
- Sodemann, H.; Wernli, H.; Schwierz, C. Sources of water vapour contributing to the Elbe flood in August 2002—A tagging study in a mesoscale model. Q. J. R. Meteorol. Soc. 2009, 135, 205–223. [Google Scholar] [CrossRef]
- Koffi, E.; Graham, E.; Mätzler, C. The water vapour flux above Switzerland and its role in the August 2005 extreme precipitation and flooding. Meteorol. Z. 2013, 22, 328–341. [Google Scholar] [CrossRef]
- Trenberth, K.E.; Fasullo, J.T.; Mackaro, J. Atmospheric moisture transports from ocean to land and global energy flows in Reanalyses. J. Clim. 2011, 24, 4907–4924. [Google Scholar] [CrossRef]
- Pokam, W.M.; Djiotang, L.A.T.; Mkankam, F.K. Atmospheric water vapor transport and recycling in Equatorial Central Africa through NCEP/NCAR reanalysis data. Clim. Dyn. 2012, 38, 1715–1729. [Google Scholar] [CrossRef]
- Serreze, M.C.; Barry, R.G.; Walsh, J.E. Atmospheric water vapor characteristics at 70° N. J. Clim. 1995, 353, 215–225. [Google Scholar] [CrossRef]
- Jakobson, E.; Vihma, T. Atmospheric moisture budget in the Arctic based on the ERA-40 reanalysis. Int. J. Climatol. 2010, 30, 2175–2194. [Google Scholar] [CrossRef]
- Velea, L.; Chronis, T.; Anagnostou, N.E.; Papadopoulos, A. Comparative analysis of humidity characteristics for open-sea and coastal areas in the Mediterranean. Atmos. Res. 2012, 113, 126–139. [Google Scholar] [CrossRef]
- Ruprecht, E.; Schröder, S.S.; Ubl, S. On the relation between NAO and water vapour transport towards Europe. Meteorol. Z. 2002, 11, 395–401. [Google Scholar] [CrossRef]
- Boutle, I.A.; Belcher, S.E.; Plant, R.S. Moisture transport in midlatitude cyclones. Q. J. R. Meteorol. Soc. 2011, 137, 360–373. [Google Scholar] [CrossRef]
- Degirmendžić, J.; Kożuchowski, K. Mediterranean cyclones, the atmospheric moisture content and precipitation in Poland. Geogr. Polonica 2017, 90, 5–20. [Google Scholar] [CrossRef]
- Zveryaev, I.I.; Wibig, J.; Allan, R.P. Contrasting interannual variability of atmospheric moisture over Europe during cold and warm seasons. Tellus A 2008, 60, 32–41. [Google Scholar] [CrossRef]
- Screen, J.A.; Simmonds, I. Exploring links between Arctic amplification and midlatitude weather. Geophys. Res. Lett. 2013, 40, 959–964. [Google Scholar] [CrossRef] [Green Version]
- Vihma, T.; Screen, J.; Tjernström, M.; Newton, B.; Zhang, X.; Popova, V.; Deser, C.; Holland, M.; Prowse, T. The atmospheric role in the Arctic water cycle: A review on processes, past and future changes, and their impacts. J. Geophys. Res. Biogeosci. 2016, 121, 586–620. [Google Scholar] [CrossRef] [Green Version]
- Chadwick, R.; Good, P.; Willett, K. A simple moisture advection model of specific humidity change over land in response to SST warming. J. Clim. 2016, 9, 7613–7632. [Google Scholar] [CrossRef]
- Dee, D.P.; Uppala, S.M.; Simmons, A.J.; Berrisford, P.; Poli, P.; Kobayashi, S.; Andrae, U.; Balmaseda, M.A.; Balsamo, G.; Bauer, P.; et al. The ERA-Interim reanalysis: Configuration and performance of the data assimilation system. Q. J. R. Meteorol. Soc. 2011, 137, 553–597. [Google Scholar] [CrossRef]
- Flentje, H.; Dörnbrack, A.; Fix, A.; Ehret, G.; Hólm, E. Evaluation of ECMWF water vapour analyses by airborne differential absorption lidar measurements: A case study between Brasil and Europe. Atmos. Chem. Phys. 2007, 7, 5033–5042. [Google Scholar] [CrossRef]
- Kishore, P.; Venkat Ratnam, M.; Namboothiri, S.P.; Velicogna, I.; Basha, G.; Jiang, J.H.; Igarashi, K.; Rao, S.V.B.; Sivakumar, V. Global (50° S–50° N) distribution of water vapor observed by COSMIC GPS RO: Comparison with GPS radiosonde, NCEP, ERA-Interim, and JRA-25 reanalysis data sets. J. Atmos. Sol-Terr. Phys. 2011, 73, 1849–1860. [Google Scholar] [CrossRef]
- Schröder, M.; Lockhoff, M.; Forsythe, J.M.; Cronk, H.Q.; Vonder Haar, T.H.; Bennartz, R. The GEWEX Water Vapor Assessment: Results from Intercomparison, Trend, and Homogeneity Analysis of Total Column Water Vapor. J. Appl. Meteorol. Clim. 2016, 55, 1633–1649. [Google Scholar] [CrossRef]
- Goodchild, M.F. Spatial Autocorrelation, CATMOG 47. In Geobooks; Plenum Press: New York, NY, USA, 1986; pp. 1–576. [Google Scholar]
- Huth, R. An intercomparison of computer-assisted circulation classification methods. Int. J. Climatol. 1996, 8, 893–922. [Google Scholar] [CrossRef]
- Caliński, T.; Harabasz, J. A dendrite method for cluster analysis. Commun. Stat. 1974, 3, 1–27. [Google Scholar]
- Ustrnul, Z. Variability of Atmospheric Circulation over NORTHERN Hemisphere in 20th Century; Institute of Meteorology and Water Management: Warszawa, Poland, 1997; pp. 1–208. ISSN 0239-6262. (In Polish with English Summary). [Google Scholar]
- Gaffen, D.J.; Robock, A.; Elliott, W.P. Annual cycles of tropospheric water vapor. J. Geophys. Res. 1992, 97, 18185–18193. [Google Scholar] [CrossRef]
- Peixoto, J.P.; Salstein, D.A.; Rosen, R.D. Interannual variation in large-scale moisture fields. J. Geophys. Res. 1981, 86, 1255–1264. [Google Scholar] [CrossRef]
- Hurrel, J.W. Decadal trends in the North Atlantic Oscillation: Regional temperatures and precipitation. Science 1995, 269, 676–679. [Google Scholar] [CrossRef] [PubMed]
- Stohl, A.; Forster, C.; Sodemann, H. Remote sources of water vapour forming precipitation on the Norwegian west coast at 60° N—A tale of hurricanes and an atmospheric river. J. Geophys. Res. 2008, 113, D05102. [Google Scholar] [CrossRef]
- Wypych, A.; Ustrnul, Z.; Sulikowska, A.; Chmielewski, F.-M.; Bochenek, B. Spatial and temporal variability of the frost-free season in Central Europe and its circulation background. Int. J. Climatol. 2017, 37, 3340–3352. [Google Scholar] [CrossRef]
- Phillips, I.D.; McGregor, G. Western European Water Vapor Flux–Southwest England Rainfall Associations. J. Hydrometeorol. 2001, 2, 505–524. [Google Scholar] [CrossRef]
- Van Bebber, W.J. Zugstrassen der barometrischen Minima nach den Bahnenkarten Deutschen Seewarte für den Zeitraum von 1875–1890. Meteorl. Z. 1891, 8, 361–366. [Google Scholar]
- Łupikasza, E. Typology of the precipitation regimes in Europe. Ann. UMCS–Sect. B 2006, 61, 267–276. [Google Scholar]
- Zveryaev, I. Seasonality in precipitation variability over Europe. J. Geophys. Res. 2004, 109, D05103. [Google Scholar] [CrossRef]
- Łupikasza, E. The Climatology of Air–Mass and Frontal Extreme Precipitation; Springer: Cham, Switzerland, 2016; pp. 1–313. ISBN 978-3-319-31476-1. [Google Scholar]
- Brunke, M.A.; Stegall, S.T.; Zeng, X. A climatology of tropospheric humidity inversions in five reanalyses. Atmos. Res. 2015, 153, 165–187. [Google Scholar] [CrossRef]
- Wang, Y.; Zhang, Y.; Fu, Y.F.; Li, R.Y.; Yuan, J. A climatological comparison of column-integrated water vapor for the third-generation reanalysis datasets. Sci. China Earth Sci. 2016, 59, 296–306. [Google Scholar] [CrossRef]
Figure 1.
Climatology of monthly water vapor content in the atmosphere (TCWV) (kg·m−2, colored) and relative humidity (RH) (%, solid lines) (1981–2015).
Figure 1.
Climatology of monthly water vapor content in the atmosphere (TCWV) (kg·m−2, colored) and relative humidity (RH) (%, solid lines) (1981–2015).

Figure 2.
Standard deviations (SD) of monthly TCWV values (kg·m−2) (1981–2015).

Figure 3.
Amount of variance (%) explained by EOF modes 1–10 for selected months (1981–2015).

Figure 4.
Spatial patterns of TCWV anomalies (kg·m−2) in selected months for two leading EOF modes (1981–2015).
Figure 4.
Spatial patterns of TCWV anomalies (kg·m−2) in selected months for two leading EOF modes (1981–2015).
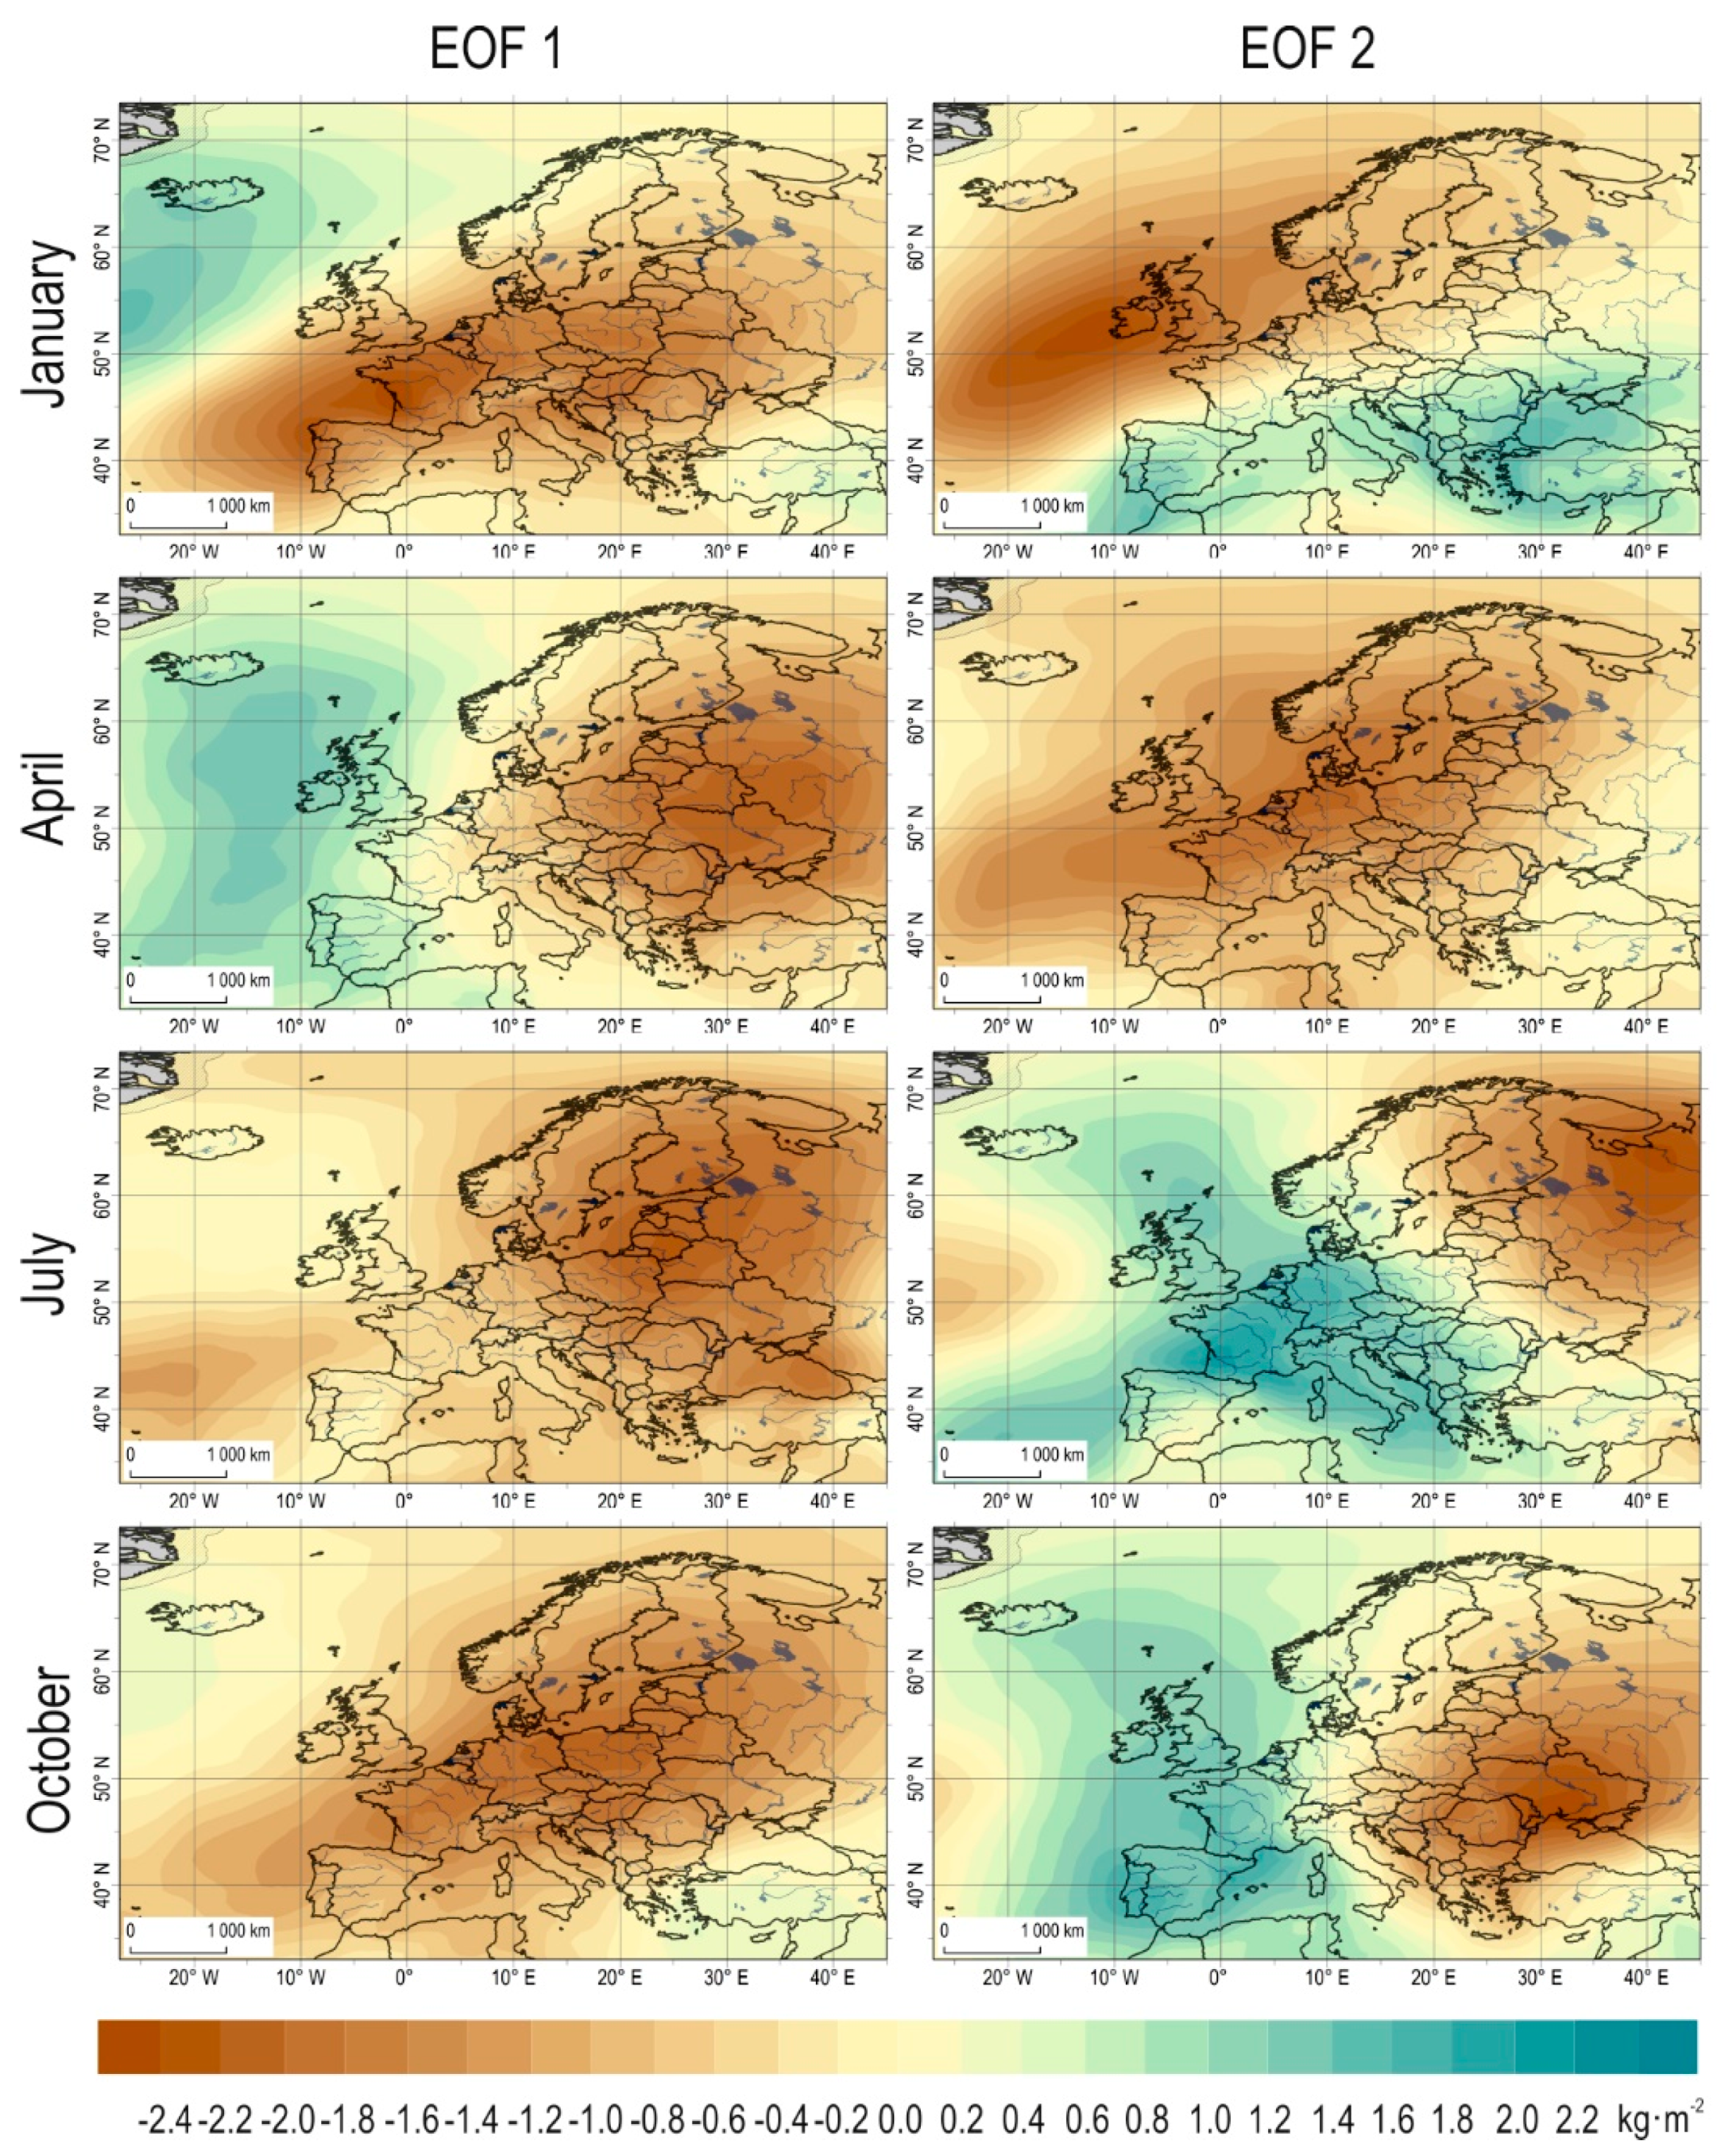
Figure 5.
Humidity regions in Europe (1981–2015).

Figure 6.
Vertically integrated water vapor flux (IWVF) (kg·m−1·s−1) for selected months (1981–2015).
Figure 6.
Vertically integrated water vapor flux (IWVF) (kg·m−1·s−1) for selected months (1981–2015).

Figure 7.
Spatial patterns of sea level pressure value (SLP) anomalies (hPa, solid lines) for two leading EOF modes and their relationship with TCWV (Pearson’s correlation coefficient, in color) in selected months (1981–2015).
Figure 7.
Spatial patterns of sea level pressure value (SLP) anomalies (hPa, solid lines) for two leading EOF modes and their relationship with TCWV (Pearson’s correlation coefficient, in color) in selected months (1981–2015).
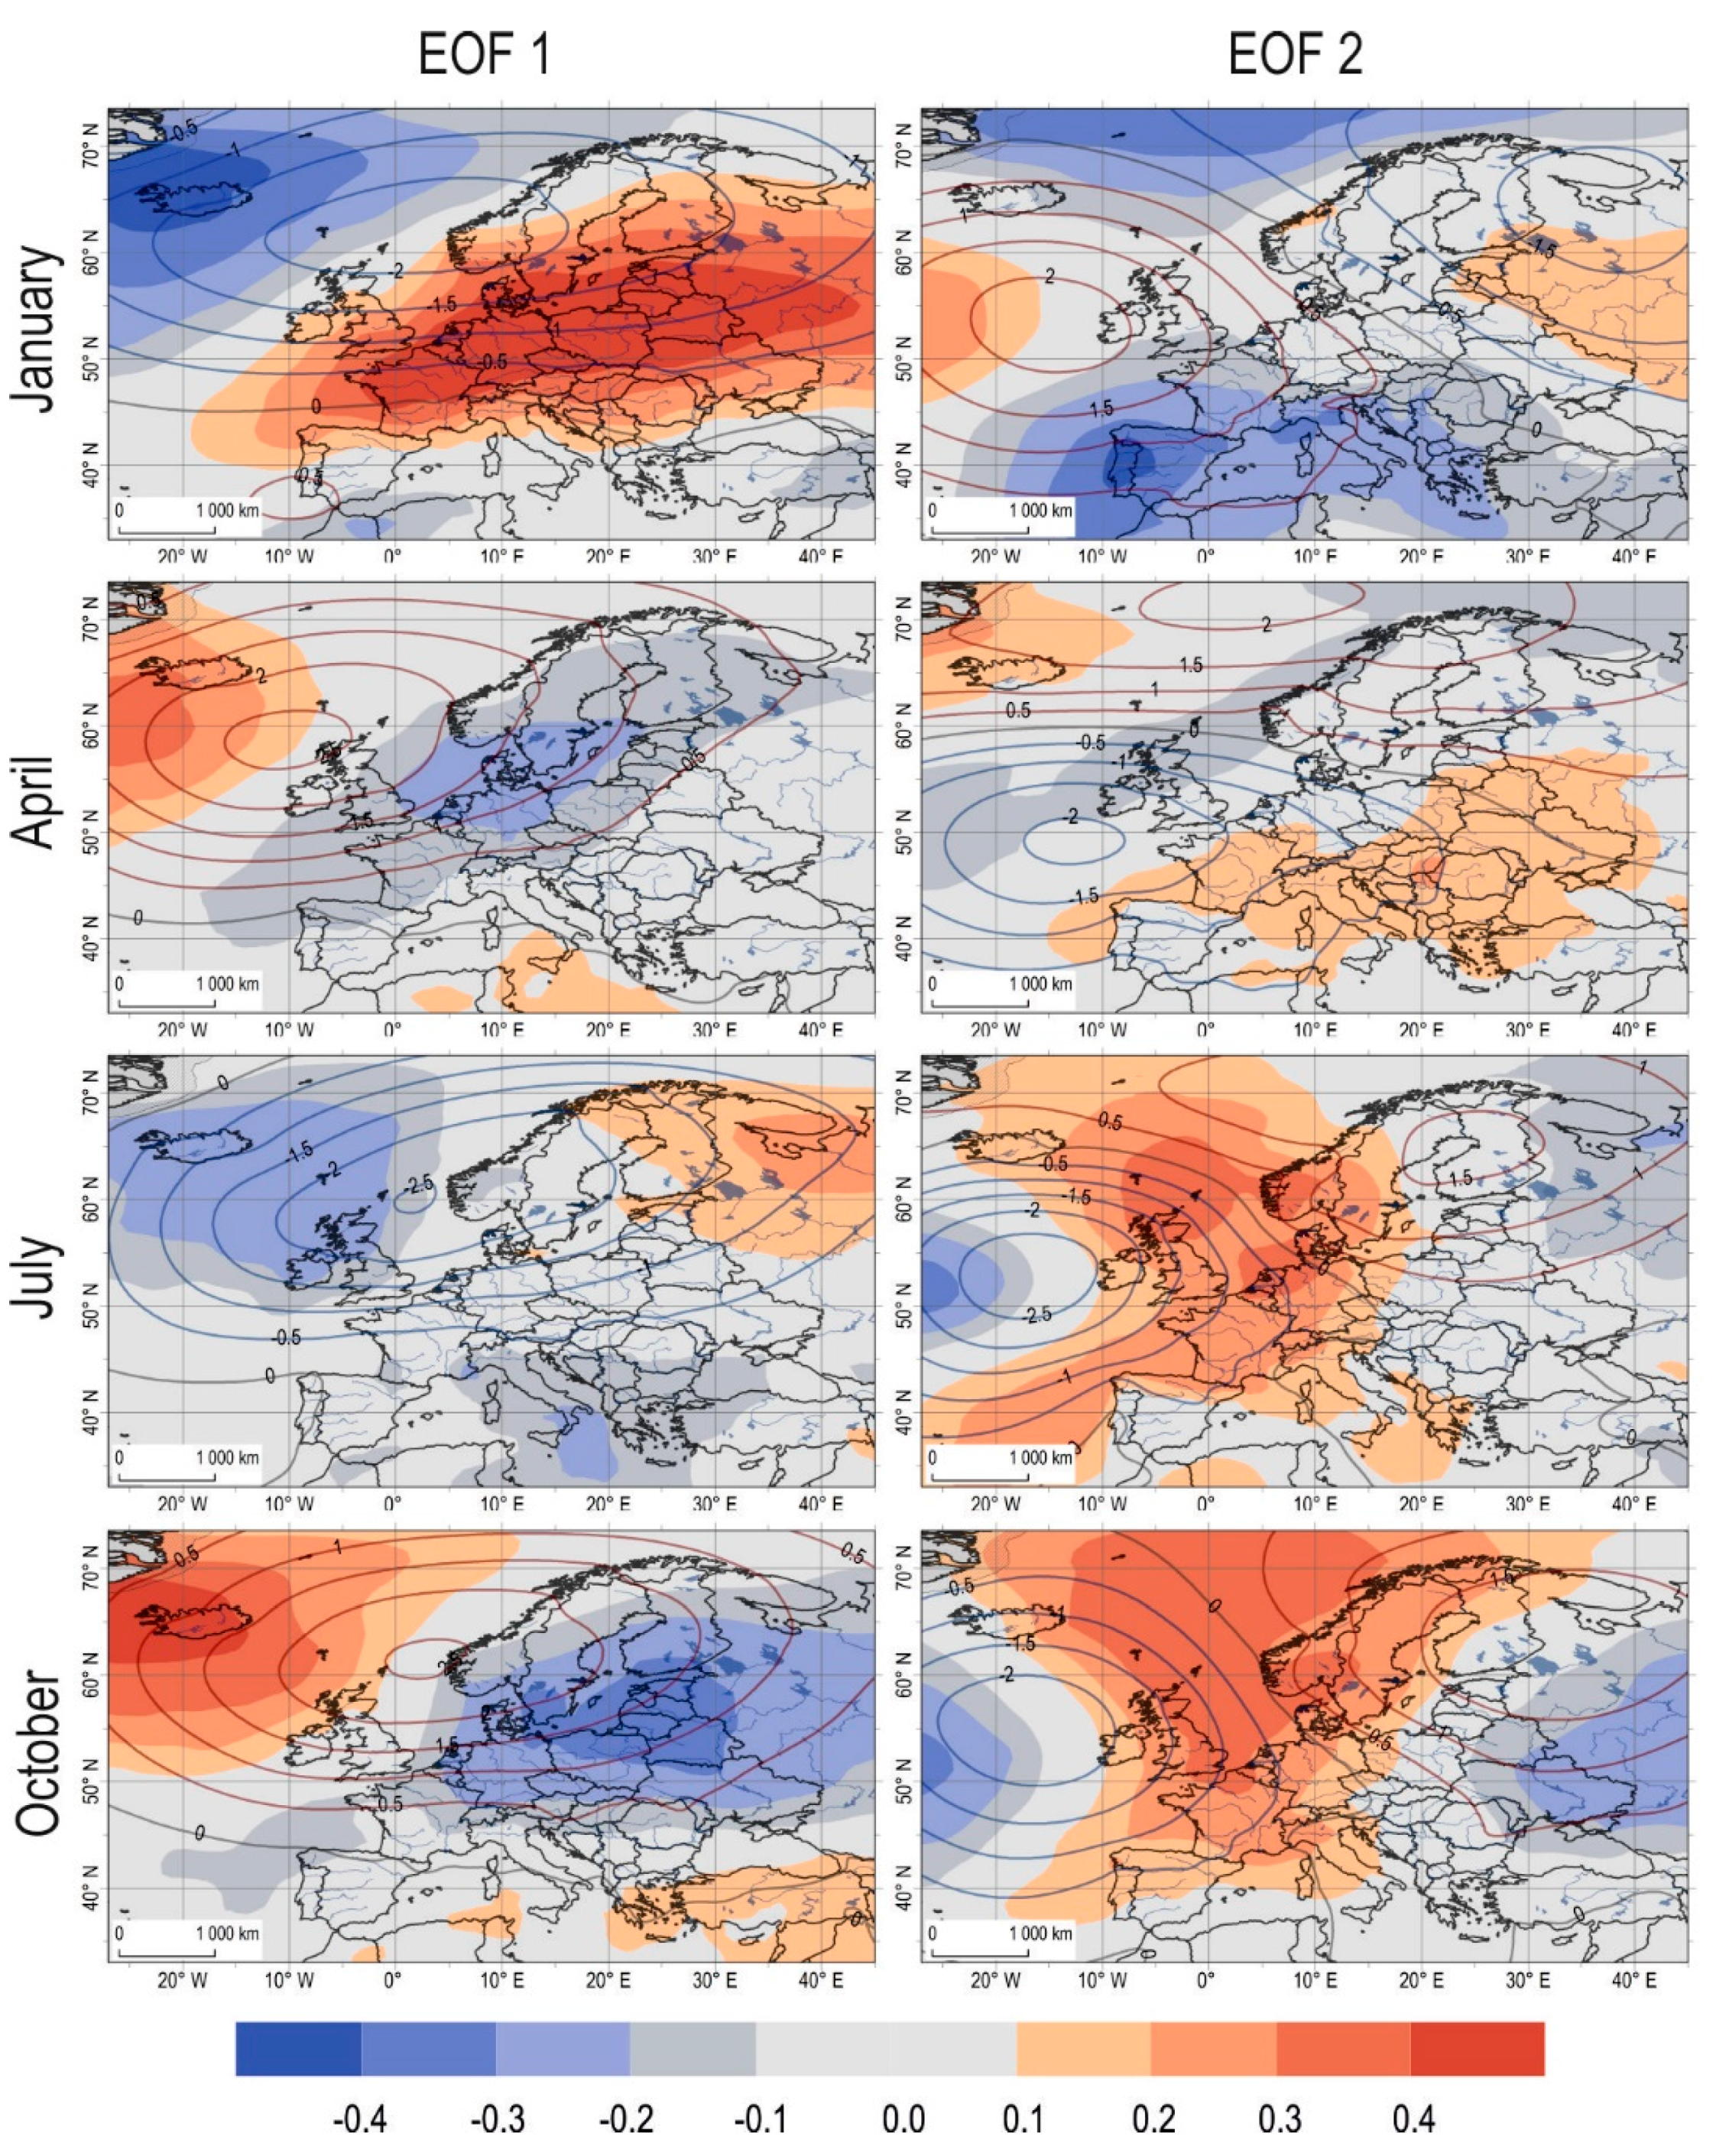
Figure 8.
Spatial patterns of SLP anomalies (hPa, solid lines) for two leading EOF modes calculated for days with extremely high moisture content and their relationship with TCWV extremes (Pearson’s correlation coefficient, in color) in selected months (1981–2015).
Figure 8.
Spatial patterns of SLP anomalies (hPa, solid lines) for two leading EOF modes calculated for days with extremely high moisture content and their relationship with TCWV extremes (Pearson’s correlation coefficient, in color) in selected months (1981–2015).

Figure 9.
Anomalies of total column water vapor (TCWV) and total column water vapor flux (IWVF) for selected advection types in (a) January and July (1981–2015), (b) April and October (1981–2015). Grey shadows indicate absence of advection type occurrence.
Figure 9.
Anomalies of total column water vapor (TCWV) and total column water vapor flux (IWVF) for selected advection types in (a) January and July (1981–2015), (b) April and October (1981–2015). Grey shadows indicate absence of advection type occurrence.


Table 1.
Moisture characteristics for selected European humidity regions (explanation in the text).
| Regions 1 | TCWV (kg·m−2) | RH (%) 7 | |||||||||||||
|---|---|---|---|---|---|---|---|---|---|---|---|---|---|---|---|
| DJF 2 | MAM | JJA | SON | Y 5 Ratio | S 6 Ratio | 950 | 850 | 700 | 500 | ||||||
| AV 3 | SD 4 | AV | SD | AV | SD | AV | SD | ||||||||
| 1 | NA | 6.6 | 2.8 | 7.8 | 3.3 | 14.8 | 4.4 | 10.3 | 4.3 | 2.64 | 0.76 | 6.1 | 8.8 | 6.4 | 8.6 |
| 2 | NC | 6.3 | 2.7 | 9.2 | 4.3 | 19.6 | 5.6 | 11.8 | 5.1 | 3.66 | 0.77 | 19.7 | 7.4 | 5.8 | 13.1 |
| 3 | MA | 11.5 | 4.1 | 13.1 | 4.4 | 20.7 | 5.3 | 16.5 | 5.6 | 2.01 | 0.79 | 7.0 | 5.3 | 6.0 | 7.9 |
| 4 | MC | 9.0 | 5.0 | 13.1 | 4.9 | 22.7 | 5.8 | 15.7 | 6.5 | 2.89 | 0.83 | 21.8 | 12.0 | 11.3 | 20.4 |
| 5 | SA | 16.9 | 3.9 | 17.5 | 4.6 | 25.0 | 4.9 | 23.2 | 6.1 | 1.72 | 0.75 | 7.0 | 12.8 | 8.4 | 13.7 |
| 6 | Med | 12.8 | 3.6 | 15.4 | 5.1 | 23.3 | 5.2 | 20.8 | 5.8 | 2.14 | 0.74 | 27.7 | 24.0 | 13.5 | 18.8 |
1 as in Figure 5; 2 DJF—December to January, MAM—March to May, JJA—June to August, SON—September to November; 3 monthly mean of TCWV; 4 monthly standard deviation of TCWV; 5 maximum vs. minimum monthly TCWV; 6 spring vs. autumn TCWV; 7 RH range at selected pressure levels.
© 2018 by the authors. Licensee MDPI, Basel, Switzerland. This article is an open access article distributed under the terms and conditions of the Creative Commons Attribution (CC BY) license (http://creativecommons.org/licenses/by/4.0/).
Share and Cite
MDPI and ACS Style
Wypych, A.; Bochenek, B.; Różycki, M. Atmospheric Moisture Content over Europe and the Northern Atlantic. Atmosphere 2018, 9, 18. https://doi.org/10.3390/atmos9010018
AMA Style
Wypych A, Bochenek B, Różycki M. Atmospheric Moisture Content over Europe and the Northern Atlantic. Atmosphere. 2018; 9(1):18. https://doi.org/10.3390/atmos9010018
Chicago/Turabian StyleWypych, Agnieszka, Bogdan Bochenek, and Michał Różycki. 2018. "Atmospheric Moisture Content over Europe and the Northern Atlantic" Atmosphere 9, no. 1: 18. https://doi.org/10.3390/atmos9010018
Note that from the first issue of 2016, this journal uses article numbers instead of page numbers. See further details here.