Assessment of Indoor-Outdoor Particulate Matter Air Pollution: A Review


1
Politecnico di Torino, DIATI—Dipartimento di Ingegneria dell’Ambiente, del Territorio e delle Infrastrutture, corso Duca degli Abruzzi 24, Torino 10129, Italy
2
Laboratoire de Mécanique des Fluides et d’Acoustique, UMR CNRS 5509 University of Lyon, Ecole Centrale de Lyon, INSA Lyon, Université Claude Bernard Lyon I, 36, avenue Guy de Collongue, Ecully 69134, France
3
Dipartimento di Scienze e Tecnologie Biologiche ed Ambientali, University of Salento, S.P. 6 Lecce-Monteroni, Lecce 73100, Italy
*
Author to whom correspondence should be addressed.
Atmosphere 2017, 8(8), 136; https://doi.org/10.3390/atmos8080136
Submission received: 9 June 2017
/
Revised: 12 July 2017
/
Accepted: 20 July 2017
/
Published: 26 July 2017
(This article belongs to the Special Issue Recent Advances in Urban Ventilation Assessment and Flow Modelling)
Abstract
:Background: Air pollution is a major global environmental risk factor. Since people spend most of their time indoors, the sole measure of outdoor concentrations is not sufficient to assess total exposure to air pollution. Therefore, the arising interest by the international community to indoor-outdoor relationships has led to the development of various techniques for the study of emission and exchange parameters among ambient and non-ambient pollutants. However, a standardised method is still lacking due to the complex release and dispersion of pollutants and the site conditions among studies. Methods: This review attempts to fill this gap to some extent by focusing on the analysis of the variety of site-specific approaches for the assessment of particulate matter in work and life environments. Results: First, the main analogies and differences between indoor and outdoor particles emerging from several studies are briefly described. Commonly-used indicators, sampling methods, and other approaches are compared. Second, recommendations for further studies based on recent results in order to improve the assessment and management of those issues are provided. Conclusions: This review is a step towards a comprehensive understanding of indoor and outdoor exposures which may stimulate the development of innovative tools for further epidemiological and multidisciplinary research.
1. Introduction
In many countries, the persistence or the increasing of air pollution represents a major environmental and health issue [1], which largely depends on the amount of chemical energy used in our society (i.e., fossil, biomass). The relapses of the anthropic activities cannot be related exclusively to local emissions in urban and metropolitan areas, but also to the diffuse pollution involving entire territories or mega-city regions [2]. This is the case, for example, of the Po Valley in Italy, where the urban emission contribution is overlapped with the critical state of pollution at the regional scale, in particular during wintertime periods.
The assessment of source emissions and the measuring and modelling of outdoor concentrations is, therefore, fundamental to obtain a framework of pollution conditions of an area at different temporal and spatial scales. International and national legislation and policies are mainly based on these approaches. Despite a general improvement of observation and measurement techniques of outdoor pollutant concentrations in the last 20 years, due to technological developments and the adoption of some normative restrictions, the implemented policies and actions have shown limitations in reducing personal exposure [3]. While the policy-makers at various public entities’ scales are challenged for the introduction of innovative actions, the scientific community is called to make a step forward in the assessment of air pollution and its relapses to different targets and in different environments.
The correlation among outdoor air pollution and health diseases, affecting in particular respiratory and cardiovascular systems, has been widely demonstrated [2,4,5,6]. However, an approach based exclusively on the assessment of outdoor air pollution has shown its limited effectiveness. People spend, in fact, most of their time indoors [7,8] and the correlation among personal exposure and outdoor concentrations of particulate matter is still weak in the literature [9,10]. For this reason, despite formerly and recent epidemiological studies referring mainly to outdoor particulate concentrations [11], the assessment of indoor and personal concentrations in work and life environments is necessary to evaluate the total exposure to air pollution.
Furthermore, direct health diseases are primary in a wide list of relapses of air pollution which also include disturbances to the population and the loss in quality and in the use of territories and indoor environments. This is even more serious especially in highly-populated areas, where the synergy of air pollution with other hazard factors (i.e., noise, vibrations, odours) may lead to increasing damages and disturbance to human health and land use [12,13]. Even though in most epidemiological studies the assessment of finer particulate sizes prevails, the employ of other indicators to understand the whole phenomena affecting human health and the use of environments is required.
Within this context, the present review analyses the existing works on the assessment of indoor-outdoor (I-O) particulate matter concentrations and relationships. Differently from other existing reviews on I-O particulate matter pollution [14,15,16], this work is not limited to investigate one specific parameter or approach, but studies which considered more indicators (i.e., Total Suspended Particles (TSP), PM10, PM2.5, PM10–2.5, ultrafine particles (UFP), Nanoparticles (NP), and Indoor/Outdoor Ratio (I/O ratio), air exchange rate, infiltration factors) in residential and working environments are preferred to find potentials and weaknesses in the framework of I-O PM research methodologies. Such recent studies, in fact, proposed sampling or modelling approaches for the assessment of site-specific cases. The lack of standardised methods, due to the complex phenomenology of air pollution release and dispersion and the boundary conditions, is evident. This review attempts to partially fill such a gap.
2. Materials and Methods
Starting from the definition of the main objectives, this review collects a large dataset of papers based on several main searches of key criteria which include: large-scale international studies on indoor-outdoor air pollution issues, on-site assessment of I-O concentrations in specific life environments and work sectors, and on-site and experimental studies of particulate matter with different size between indoor and outdoor environments.
The dataset is then reduced by specific exclusion criteria. The main focus is toward studies that analysed more than one indicator; however, studies focusing on one specific indicator are also considered. Likewise, studies involving different indoor and outdoor environments, such as residences and workplaces, are considered. Furthermore, recent studies are generally preferred and, in particular, those proposing innovative approaches and new points of views on methodologies and results; studies published prior to 2005 are also considered for their significant contribution to following studies or that focused on “atypical” case studies. Large-scale exposure assessment studies developed at the end of the last century, such as EXPOLIS, PTEAM, and THEES [9,17,18,19], are intended as starting points for the purpose of this review.
Using the SciVal tool [20], a qualitative analysis for investigating the main tendencies in I-O studies is also performed. For the searching criteria, indicator terms associated to indoor and outdoor keywords was compiled in order to observe their usage in recent years (2011–2016 published papers). The analysis was developed both by considering the overall results from the SciVal DB and then by filtering to journal categories (JC) expressing subject areas (SA), such as: “Environmental Science”; “Earth and Planetary Sciences”; “Engineering”; and “Medicine” (each journal could be characterised by more than one subject area). The research was developed in May 2017.
3. Brief Summary of the Main Characteristics of PM in Indoor and Outdoor Environments
The main sources of outdoor PM pollution in most developed countries are commonly identified to be road traffic (including exhaust and non-exhaust emissions of vehicle combustion, tire wearing, and resuspension), power generation plants, industries, agriculture, and domestic heating systems [2,21]. While natural sources, which represent a consistent fraction of aerosols in many regions, contribute mainly on coarser particles, anthropic sources are well-known for the generation of primary and secondary fine, ultrafine, and nano-scale particulates [22,23,24,25]. The definition and adoption by normative frameworks of size-depending indicators to fix mass concentration limit values for outdoor air quality considered both the penetration in the human respiratory tract and the need to distinguish anthropogenic and natural emissions [26].
Indoor sources are associated to anthropic activities and the intended use of spaces. In life environments a significant role is played by smoking and cooking, followed by heating systems, cleaning, and resuspension due to the presence of humans [10,27,28,29,30]. Combustion processes and cleaning contribute significantly to fine, ultrafine, and nanoparticles emissions, while coarse fractions of PM are principally evidenced due to resuspension [22,24,27,31,32]. In working environments, PM size distribution, concentrations, and chemical properties are even more site-specific than in residential ones as these depend on the used materials, productive methods, and working typologies. Extensive literature on school environments, partially for assessing children’s exposure (i.e., the tendency for health impairments, and the large percentage of daytime spent in those spaces) and as a major working sector for the number of employees, is found [14,33,34,35].
A large amount of works described the consistent contribution of outdoor PM to indoor concentrations. The heterogeneity in the estimation of such contributions found for different particulate size ranges is strictly linked to the different pathways of infiltration and aerodynamic behaviours of finer and coarse particles. A general trend describing a decreased penetration for coarser particles is found in the literature [27]. Other factors influencing the contribution of outdoor pollution on indoor environments are constituted by the type of ambient ventilation (i.e., natural or mechanical), distance to the sources, meteorological conditions, and by the building age and architectural characteristics [28,31].
Indoor versus outdoor levels are found to be heterogenic in the literature. In the absence of intense indoor sources, studies show a general trend of higher outdoor concentrations rather than indoor values [8,36,37]. Furthermore, spatial and temporal variability of outdoor PM could significantly affect the relation between I-O concentrations [38]. In urban areas, as an example, the source proximity and the primary and secondary particulate pathways lead to the high variability of the observed PM size distributions and concentrations. An even more uniform spatial distribution is generally observed for the finer particles, and frequent exceptions are reported in the literature due to the interference of local sources [26,39]. Moreover, the seasonal variability of I-O relationships may be referred mainly to the outdoor contribution, the influence of ventilation types, and occupant behaviours [26].
A widely-used indicator for evaluating the indoor-outdoor exchange is the ratio between the measured concentrations in those environments [40,41]. The results of I/O ratios varied in the literature from values tending to zero in modern mechanically-ventilated buildings with an absence of indoor activities to values over 10 in the occupational sector or for residential buildings with intense indoor activity and smoking in territories with relatively low outdoor concentrations [10,37,42]. This wide range is consistently influenced by resuspension, air exchange, and the deposition velocity of particles. Therefore, this indicator does not permit reaching a complete explanation of I-O relationships.
In the literature [15,40,43,44] various sets of parameters and models which consider the mechanisms of generation (i.e., the contribution of indoor sources), transport (i.e., the air exchange rate, infiltration factor, penetration factor, change in indoor concentration per unit change in outdoor concentration) ,and deposition (i.e., the decay rate) of particulate are presented. Evidence from the literature frameworks reinforce the review hypothesis of the need for methods which consider different indicators and parameters, rather than limiting the assessment to the ones required by the normative framework or for the assessment of specific patterns.
4. Indoor-Outdoor Particulate Matter Sampling and Assessment
4.1. Indicators
Within the reviewed papers, the analysis of the main indicators used to describe particulate matter mass and particle number concentrations (PNC) is developed. Both standard and non-standard indicators found in I-O studies are considered.
4.1.1. Total Suspended Particles (TSP)
Total Suspended Particles (TSP) is a historically-used indicator for the assessment of outdoor air pollution and its relapses. However, a limited employ emerges in the literature for the purposes of I-O assessment. This outcome follows the general trend of substitution of such indicators, due to the availability of consolidated technologies and techniques, with others taking into account the size distribution of airborne particulate (i.e., PM10, PM2.5) in outdoor applications. Moreover, even if the interest on assessing TSP for intense natural and human dust emissions persists, such an indicator has a limited effectiveness for observing outdoor particle infiltration phenomena into indoor ambient environments.
The few recent uses of TSP are mainly related to the determination of specific components of particulates. Nazir et al. [45] assessed I-O distributions of trace metal in the TSP of outdoor origins (i.e., industry, vehicles, soils sources). As expected, higher values of TSP are found outdoors, rather than indoors, with moderate correlation among the two environments (R = 0.415). Similar results are found in other studies [46,47] which investigate I-O concentrations of particle phase PAHs in total dust. Other applications are found in researches considering large sets of indicators including TSP, PM10, PM4, PM2.5, PM1, and UFP at different environments, such as museums, offices, industries, schools, and an Antarctic research station [48,49,50,51,52].
4.1.2. PM10 and PM2.5
In the last two decades there has been an extensive and increasing use of PM10 and PM2.5. These indicators are adopted in a variety of different I-O studies and are considered as main objects of the samplings or as references for the comparison within other indicators or with other studies.
Ranges of PM10 and PM2.5 mass concentrations vary by orders of magnitude between, and within, indoor and outdoor environments. In the month of June in two modern offices with mechanical ventilation, Chatoutsidou et al. [53] report low indoor daily averaged PM10 concentrations (<3.5 μg/m3) while simultaneously-collected outdoor measures ranged between 11 μg/m3 and 21 μg/m3. Higher outdoor than indoor concentrations are also reported by Diapouli et al. [54] at three residences with air-conditioning in the Athens urban area. However, they found approximately ten times higher 24 h-averaged PM10 indoor values (≈25–47 μg/m3) compared to the results of Chatoutsidou et al. [53]. Additionally, in two naturally-ventilated commercial activities, higher mean PM10 indoor values (≈50–55 μg/m3) rather than outdoor (≈25–45 μg/m3) are found by Vicente et al. [55] over the sampling period. Same authors also found higher indoor concentrations of PM10 during working hours rather than non-working hours. A similar temporal variation between occupancy and non-occupancy is also found in a previous study by Branis et al. [56] which, however, developed the study using different sampling strategies and time references as discussed later in this review. High variability of PM2.5 I-O concentrations is also described by other analysed studies [40,50,57,58,59,60,61]. In particular, the findings of Liu et al. [58] through different residential and commercial buildings in Beijing, clearly show the wide variability within indoor PM10 and PM2.5 concentrations which are, resultantly, higher in restaurants, dormitories, and classrooms, rather than in supermarkets, computer rooms, offices, and libraries (PM10 and PM2.5 ranging, respectively, from 373.8 μg/m3 and 136.6 μg/m3 in restaurants to 33.8 μg/m3 and 5.6 μg/m3 in libraries).
In the literature, less frequently-adopted PM classes of indicators (PM5, PM4, PM2, PM1) are likewise investigated. The use of such indicators is, in many cases, related to the cut-off of the availability of instrumentation, the purposes of the occupational field investigations, or for evidence of specific size fraction emissions. In a former study, Monn et al. [8] investigated I-O and personal relationships by comparing indoor and outdoor PM10 and PM2.5 measurements with PM5 personal samplings. The use of PM4 is found in Weichenthal et al. [62] where the measure of indoor PM4 in relation to I-O measurements of ultrafine particles (UFP) is reported. More recently, Diapouli et al. [54] monitored I-O mass and PN concentrations of UFP, black smoke, PM10, and PM2, the latter using a custom-made impactor (with a cut-off point at 2.1 μm and at 23 L/min). The use of PM1 is documented in three studies at schools and universities of Central Europe and in studies assessing multiple indicators (including TSP, PM10, and PM2.5) [51,56,57,58,63,64].
A summary of the observed 24-h mean concentrations in indoor and outdoor environments is reported in Figure 1, which shows the box plot for PM10 and PM2.5. The selection of such indicators is ascribed to the availability of extensive data in the reviewed studies.
4.1.3. Ultrafine Particles (UFP) and Nanoparticles (NP)
Despite the limited amount of paper reporting the use of UFP compared to PM10 and PM2.5, the recent interest in these types of particles in I-O studies is well documented in the literature. The main content of the studies on UFP particles is related to the investigation of PNC and relapses to human health. The dominant contribution of such particles to number concentrations is, in fact, contraposed to the incidence of larger size particles to mass concentrations [26].
Weichental et al. [62] investigated the contribution to UFP from heating systems in life environments (in over 36 houses) taking into account outdoor concentrations, the age of buildings, types of cooking systems, and the presence of smokers. Results of the study describe the contribution of these sources in UFP indoor concentration, in particular in the residential buildings using electric baseboard heaters and wood stoves. However, as also reported by the authors, the ambient conditions and the potential dominant contribution of other sources (outdoor, cooking, and smoking) need to be taken into account in the comparison of the measured UFP concentrations in buildings with different heating systems. Increasing interest in the use of the UFP indicator is reported for specific workplaces, such as offices and copy centres, where significant indoor sources of fine and ultrafine particles are represented by laser printers [55,58,65,66].
Concentrations vary from low values (<103 particles/cm3) in particularly clean indoor environments [37] to high values (>106 particles/cm3) in the presence of intense indoor sources of such particles [67]. Diapouli et al. [68] report higher UFP mean concentrations outdoors (32,000 ± 14,200 particles/cm3) rather than indoors (24,000 ± 17,900 particles/cm3), with a maximum indoor mean value found in a library with a carpet-covered floor and a smoking office (both ≈52,000 particles/cm3). Similar results are also found in other studies [53,60,61]. In particular, Zauli Sajani et al. [61] investigate I-O concentrations in the front and back of a building along a high traffic street: the highest UFP 1 h-mean value is found for the outdoor front sampling (≈25,500 particles/cm3) and the lowest in the indoor located in the back of the building (≈3500 particles/cm3). Comparable values are found indoors at the front and outdoors at the back (7635 particles/cm3 and 7444 particles/cm3, respectively) leading the authors to suggest similarities between the gradients of front-back (I-O) and of high-low traffic areas (I-O). Seasonal variability investigated by Wheeler et al. [60] show both indoor and outdoor 24 h-averaged values are higher during winter rather than summer. Furthermore, the difference between indoor and outdoor concentrations is narrow during one of the sampled periods (the second summer campaign) due to a significantly lower outdoor averaged value compared to an another considered period with the same awaited meteorological conditions (first summer campaign).
Related to nanoparticles, relatively few studies focused directly on the assessment of I-O relationships. However, a growing interest is found in occupational indoor environments due to the increase of productive activities employing innovative nanomaterials [69]. Dahm et al. [70], for example, investigate the exposure to carbon nanotubes and nanofibers in six productive sites (handling materials with diameter ranges between 1.1 nm and 140 nm). In this research, no evident trends are described for mass and PN concentrations among the different factories and within the I-O samplings by using three different real-time optical instruments and a filter-based method.
4.1.4. Miscellaneous
In the reviewed articles, a heterogeneity in the use of multiple indicators is observed: the joint use of two indicators is found in different studies with PM10 and PM2.5 or PM2.5 and UFP, while studies considering more than two indicators employed PM10 and PM2.5 with UFP or TSP [38,60,61]. The recurrence of the use non-typical PM classes (i.e., PM5, PM4, PM1) is also found in many studies, frequently joint with the most-used indicators [49,50,54,57,62,71].
One of the main direct results of the studies assessing more indicators is the investigation of correlations and contributions among different particle size ranges. Mass concentration of finer sizes appear to contribute variously to the values of greater size classes. Liu et al. [58] showed a significant correlation and contribution of PM10 to TSP (R2 = 0.674–0.996, range 47–69%) and discrete for PM2.5 to PM10 (R2 = 0.144–0.894, range 16–45%) and PM1 to PM10 (R2 = 0.149–0.879, range 6–23%). In another study, Branis et al. [56] show a higher correlation of PM2.5 and PM10 by comparing indoor PM2.5/PM10 ratio during workdays (R = 0.872 daytime; R = 0.912 nighttime) and weekends (R = 0.918 daytime; R = 0.991 nighttime). High correlation between indoor PM1/PM10 and PM1/PM2.5 with a slighter increase during the weekend is also observed. The presence of a source of coarse particles during workdays, which does not appear during the other observed periods and can be associated to a good correlation among PM10–2.5 and student presence (R = 0.683), can be attributable to the resuspension. Similar results are provided by Vicente et al. [55], who show ratios between different size classes ranging from 0.62 to 0.78 for PM2.5/PM10 and PM4/PM10 during working hours and tending to unity during the hours of non-occupancy, as an effect of coarse particle decay. The same study reports slight unity values for PM1/PM2.5 and PM10/TSP, both for working and non-working periods. A correlation among indoor concentrations of PM4 and UFP (R2 = 0.53) is reported in the I-O research of Weichental et al. [62].
4.2. Sampling Methods
Based on the available systematic reviews on particulate air sampling technologies [72,73], it is worth examining instrumentation and approaches commonly employed in the reviewed I-O investigations.
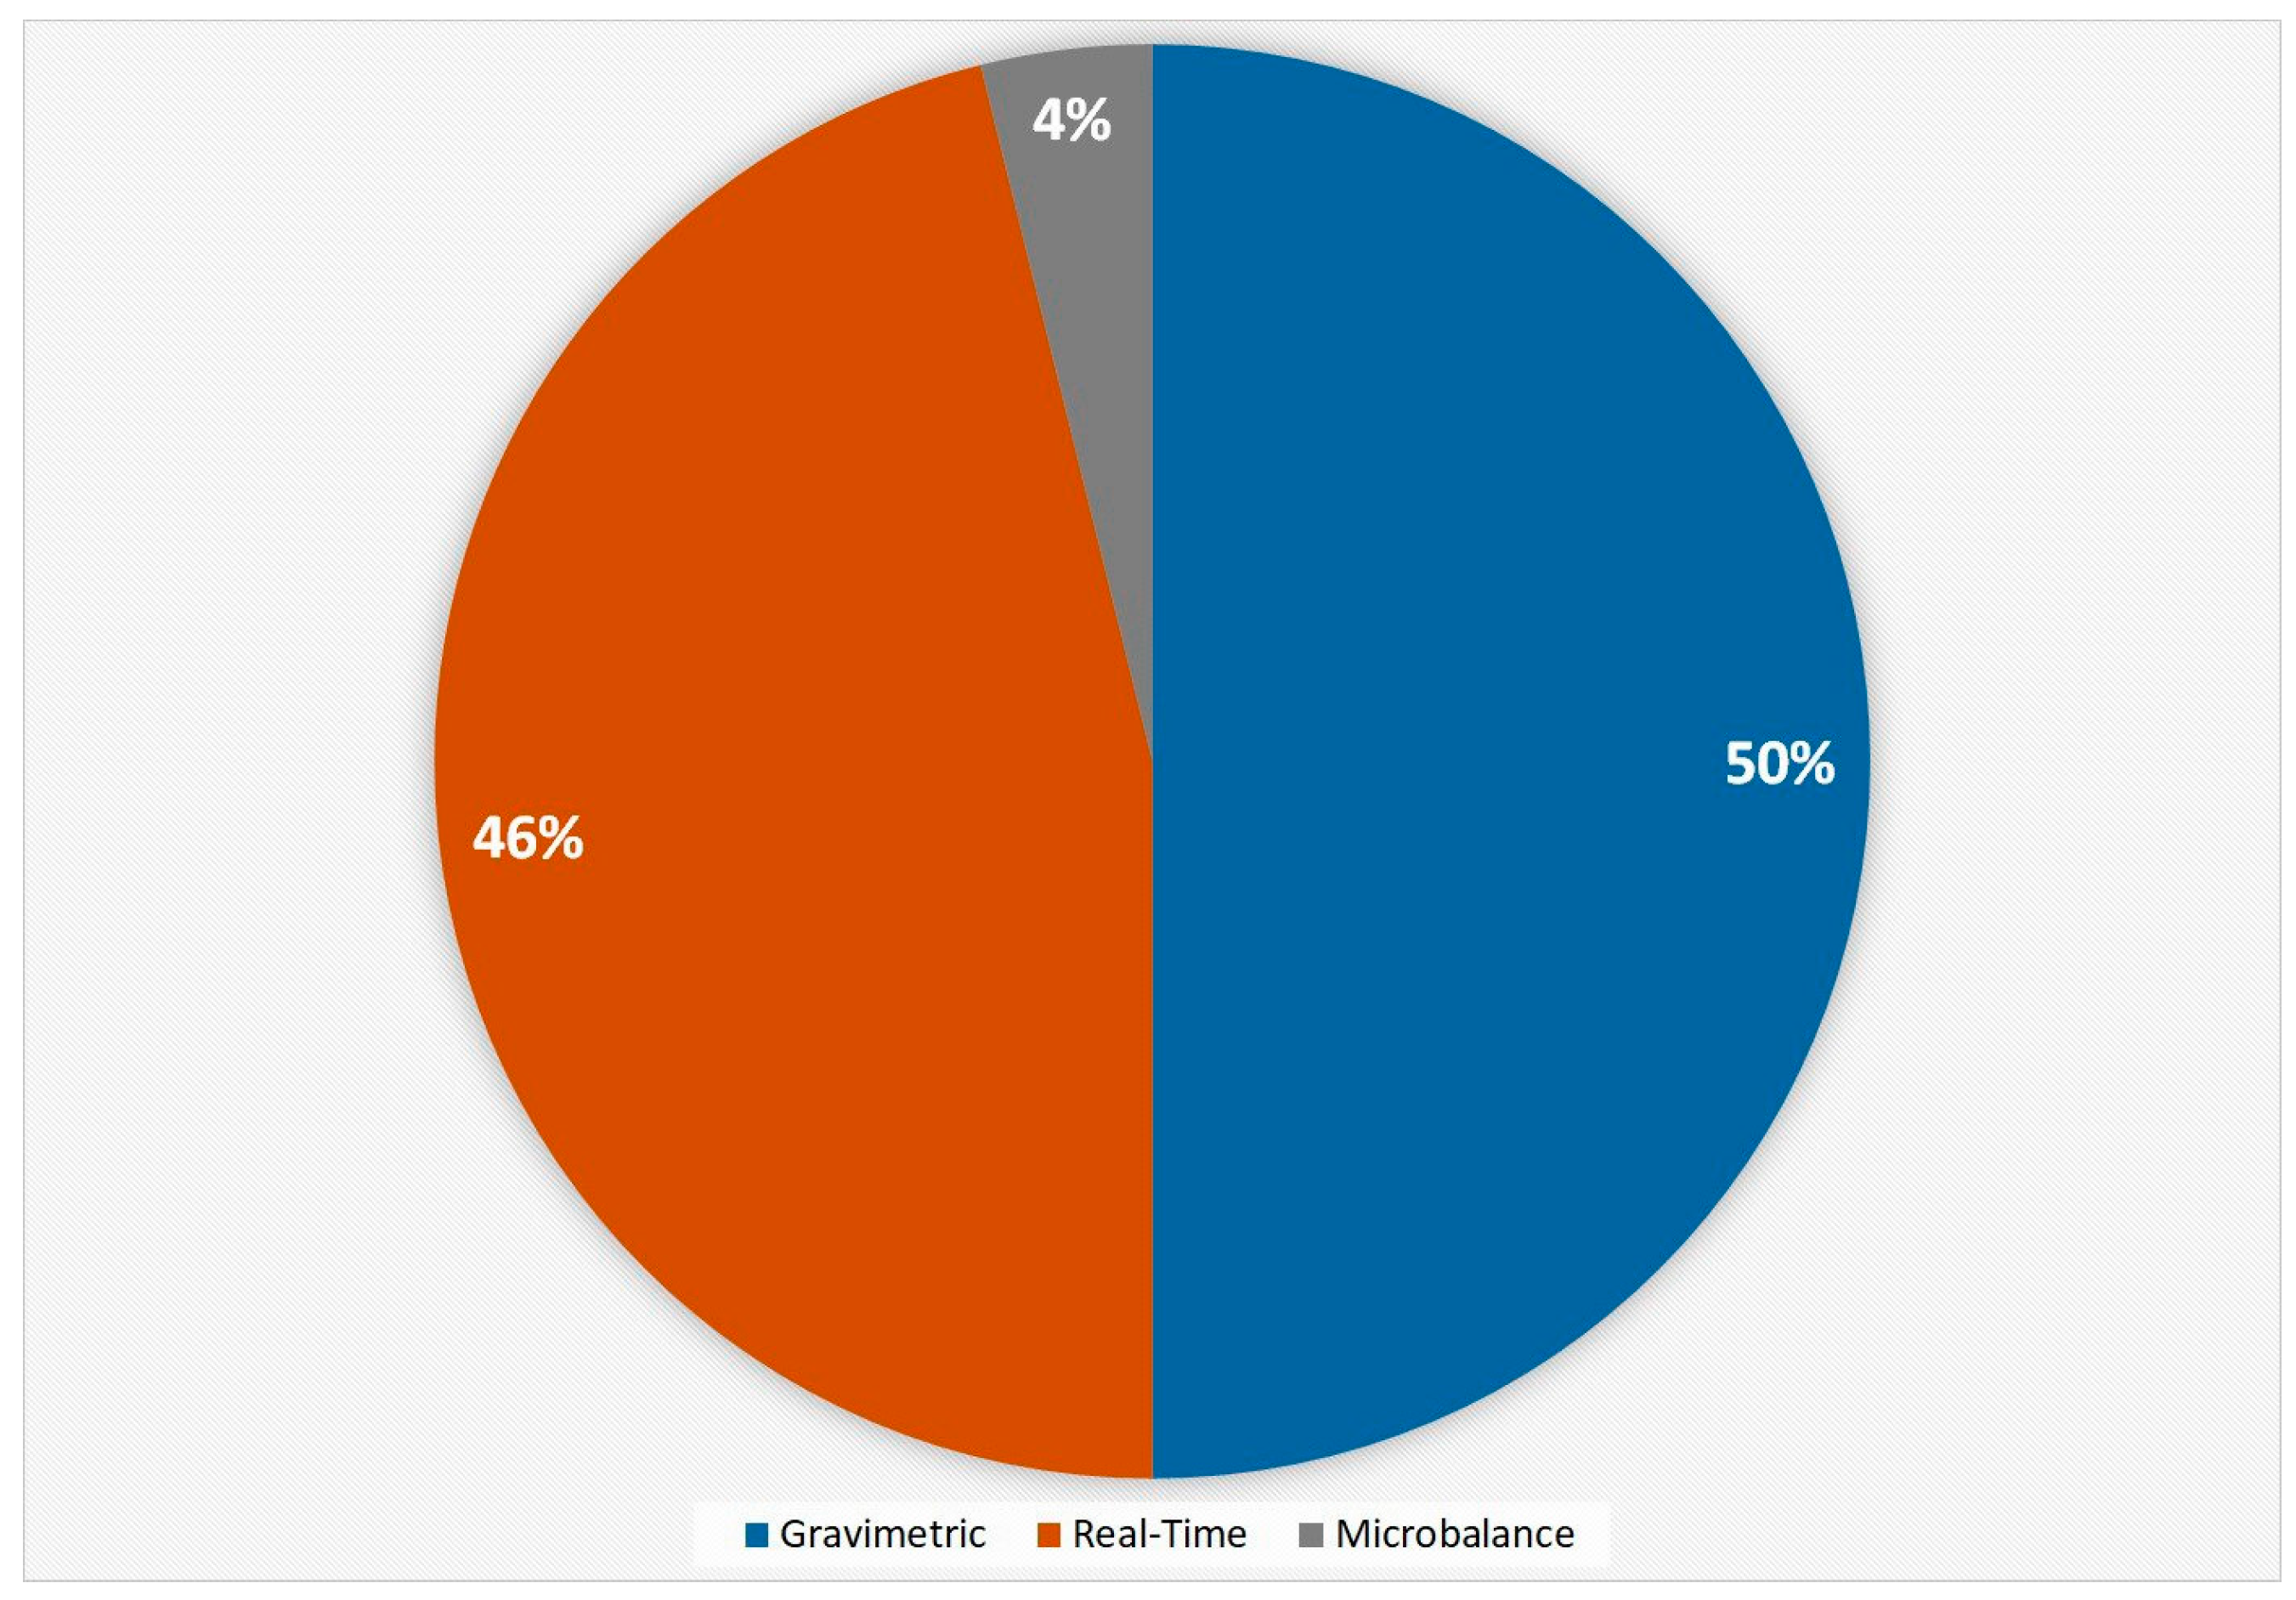
Related to concentration samplings, gravimetric methods are the most used (Figure 2). The reason is due to the historical development of this technology, the normative references, and the need to collect mass on filters for further analysis (i.e., the composition of PM). In particular, gravimetric cyclones and impactors, such as the widely-employed Harvard Impactor [74], are the most used technologies for collecting mass. The microbalances (i.e., TEOM, QCM) appear marginally considered in I-O studies, with applications restricted in time sampling, assessed environments, used indicators, or limited to the validation of other instrumentation [75,76,77]. Relating to the material of membranes, Teflon filters are the most used, followed by quartz and glass filters. The diameter of membranes are typically represented by 25 mm, 37 mm, and 47 mm filters, with the smaller membranes associated with personal samplers as, for example, personal environmental monitors (PEM) reported by Meng et al. [40]. Pumping flow rates in the studies range between 2.3 L/min and 38.3 L/min (with a high frequency of 10 L/min and 16.7 L/min) due to instrument design and compliance with legislation [78].
An alternative approach to obtain approximate mass concentrations is represented by the use of real-time techniques, such as optically-based systems. The availability of “instantaneous” results and higher time resolution than gravimetric methods represents an important key factor for the sampling campaign design. Advantages comprise the possibility to develop short-term and spot approaches at different locations and extract trends and behaviours over long-term monitoring. The use of such instrumentations should be subjected to dedicated site-specific verifications in order to investigate the need of correction factors to reduce bias with concentrations obtained using gravimetric methods [73,79]. Additionally, the main use of real-time instruments in I-O studies is related to the collection of PNC and size distribution. Chatoutsidou et al. [53] developed measurements of mass (PM10) and number concentrations in recently-built offices using real-time instruments: I/O simultaneously measures are collected by light scattering photometric instrumentation (PM10), scanning mobility particle sizer spectrometers (SMPS, for particles under 0.7 μm), and aerodynamic particle sizer spectrometers (APS, for particles amid 0.5–18 μm). Results show both mass and PN concentrations to be higher outdoors rather than indoors (I/O < 0.3 for all the measures), with PNC dominated by finer particles (the concentrations of particles with a diameter lower than 0.5 μm over two orders of magnitude higher than the range 0.5–18 μm) and mass by coarser particles (related, in particular, to the human presence in working hours leading to resuspension). Despite air conditioning determined to cause a significant reduction of PM10 concentrations, temporal fluctuations indoor are found comparable to outdoor PM10 variability over time.
Most of the measurements are made by fixed instruments. However, personal samplers are used to investigate the personal exposure with on-board direct measurements. These studies describe the need to follow dedicated design criteria to ensure the validity of such approaches as, for example, measuring at fixed positions in bedrooms during nighttime and keeping the instrumentation far from high-humidity sources [80]. Moreover, such sampling methods should be easy to carry and should integrate noise control and sound insulation systems in order to not interfere with personal daytime activities and, therefore, the representativeness of the collected data. Technological developments improved such issues compared to heavy personal samplers used in former studies as Koistinen et al. [81]. The use of personal samplers for developing measurements at fixed position is also reported. The good correlation of this sampling solution with traditional fixed monitoring samplers found by Meng [40] suggests a sufficient accuracy of such instruments for describing I/O relationships. The feasibility of the methodologies requires, however, a site-specific testing activity in parallel with traditional approaches.
The characteristic time interval of sampling is found to be predominantly of 24 h or 48 h (Figure 3). The daily interval is widely adopted to follow and compare the results with outdoor normative prescriptions which are frequently based on daily concentrations from midnight to midnight. Custom 24-h samplings with starting and ending points at different hours of the day are reported due to the campaign design requirements. The sampling interval of 48 h is typically related to epidemiological studies. Similar percentages can be found on the review on PM2.5 by Mohammed et al. [14]. Among the other intervals, the 8 h sampling period is associated with the typical working time and, therefore, is adopted on I-O studies developed at workplaces rather than in life environments. Furthermore, spot measurements (<8 h for each sampling position) are reported to investigate general trends of pollutants or due to limited available time to spend for in-site sampling. Moreover, a former study by Branis et al. [56] adopted a custom 12 h time interval in order to collect mass concentrations on filters describing different periods of use of a university hall (lecture hours vs. nighttime). Among long-term measurement campaigns, semi-continuous approaches are also reported [60]. Such methodologies do not permit the collection of representative data over the time series, but merely to have a general picture of the phenomena over the sampling period.
Most of the reviewed studies are developed using simultaneous sampling intervals between indoor and outdoor measurements. The design of contemporary measurement campaigns is adopted in order to neglect the time variability of PM among I-O environments. Few exceptions are reported in relation to limited parts of the studies (i.e., additional samplings, instrumentation failures) or for the unfeasibility of achieving simultaneous samplings as, for example, due to extreme weather conditions reported in the Antarctica study by Pagel et al. [49].
In accordance with good-practice and normative frameworks, all the studies set the instrument chains far from every potentially interfering source. For this reason, indoor sampling is typically made at the centre of the environment and at a height between 1 and 2 m (to simulate the breathing height of occupants). Distances from walls and heating sources are also identified as main design factors. Related to outdoor air samplings, in studies the height ranges from 1–2 m (referred to the front door or ground level) to the height of the floor corresponding to the indoor sampling (5–10 m from the ground). Measures on building roofs are also reported [57,79]. The horizontal distance from the external wall is frequently reported as another key parameter for the reduction of unwanted interference. Personal samplers are typically positioned in the breathing zone of the carrying person.
In some studies mainly related to epidemiological purposes [36,50,56] the outdoor concentrations are totally, or partially, obtained from central-site stations, instead of proximity samplings. The adoption of concentrations from the public monitoring stations or other samplings represents an opportunity to save resources. However, this requires both the detailed examination of representativeness of the station for describing outdoor values at the indoor sampling and the comparison of measurement methods. When possible, it is strongly recommended to perform measurements of outdoor concentrations in proximity to the indoor measure. The choice of the samplers’ disposition is strictly related to the goals of the survey and requires an accurate aprioristic design, as underlined by Zauli Sajani et al. [61].
4.3. Studies of Site-Specific and Environmental Characteristics
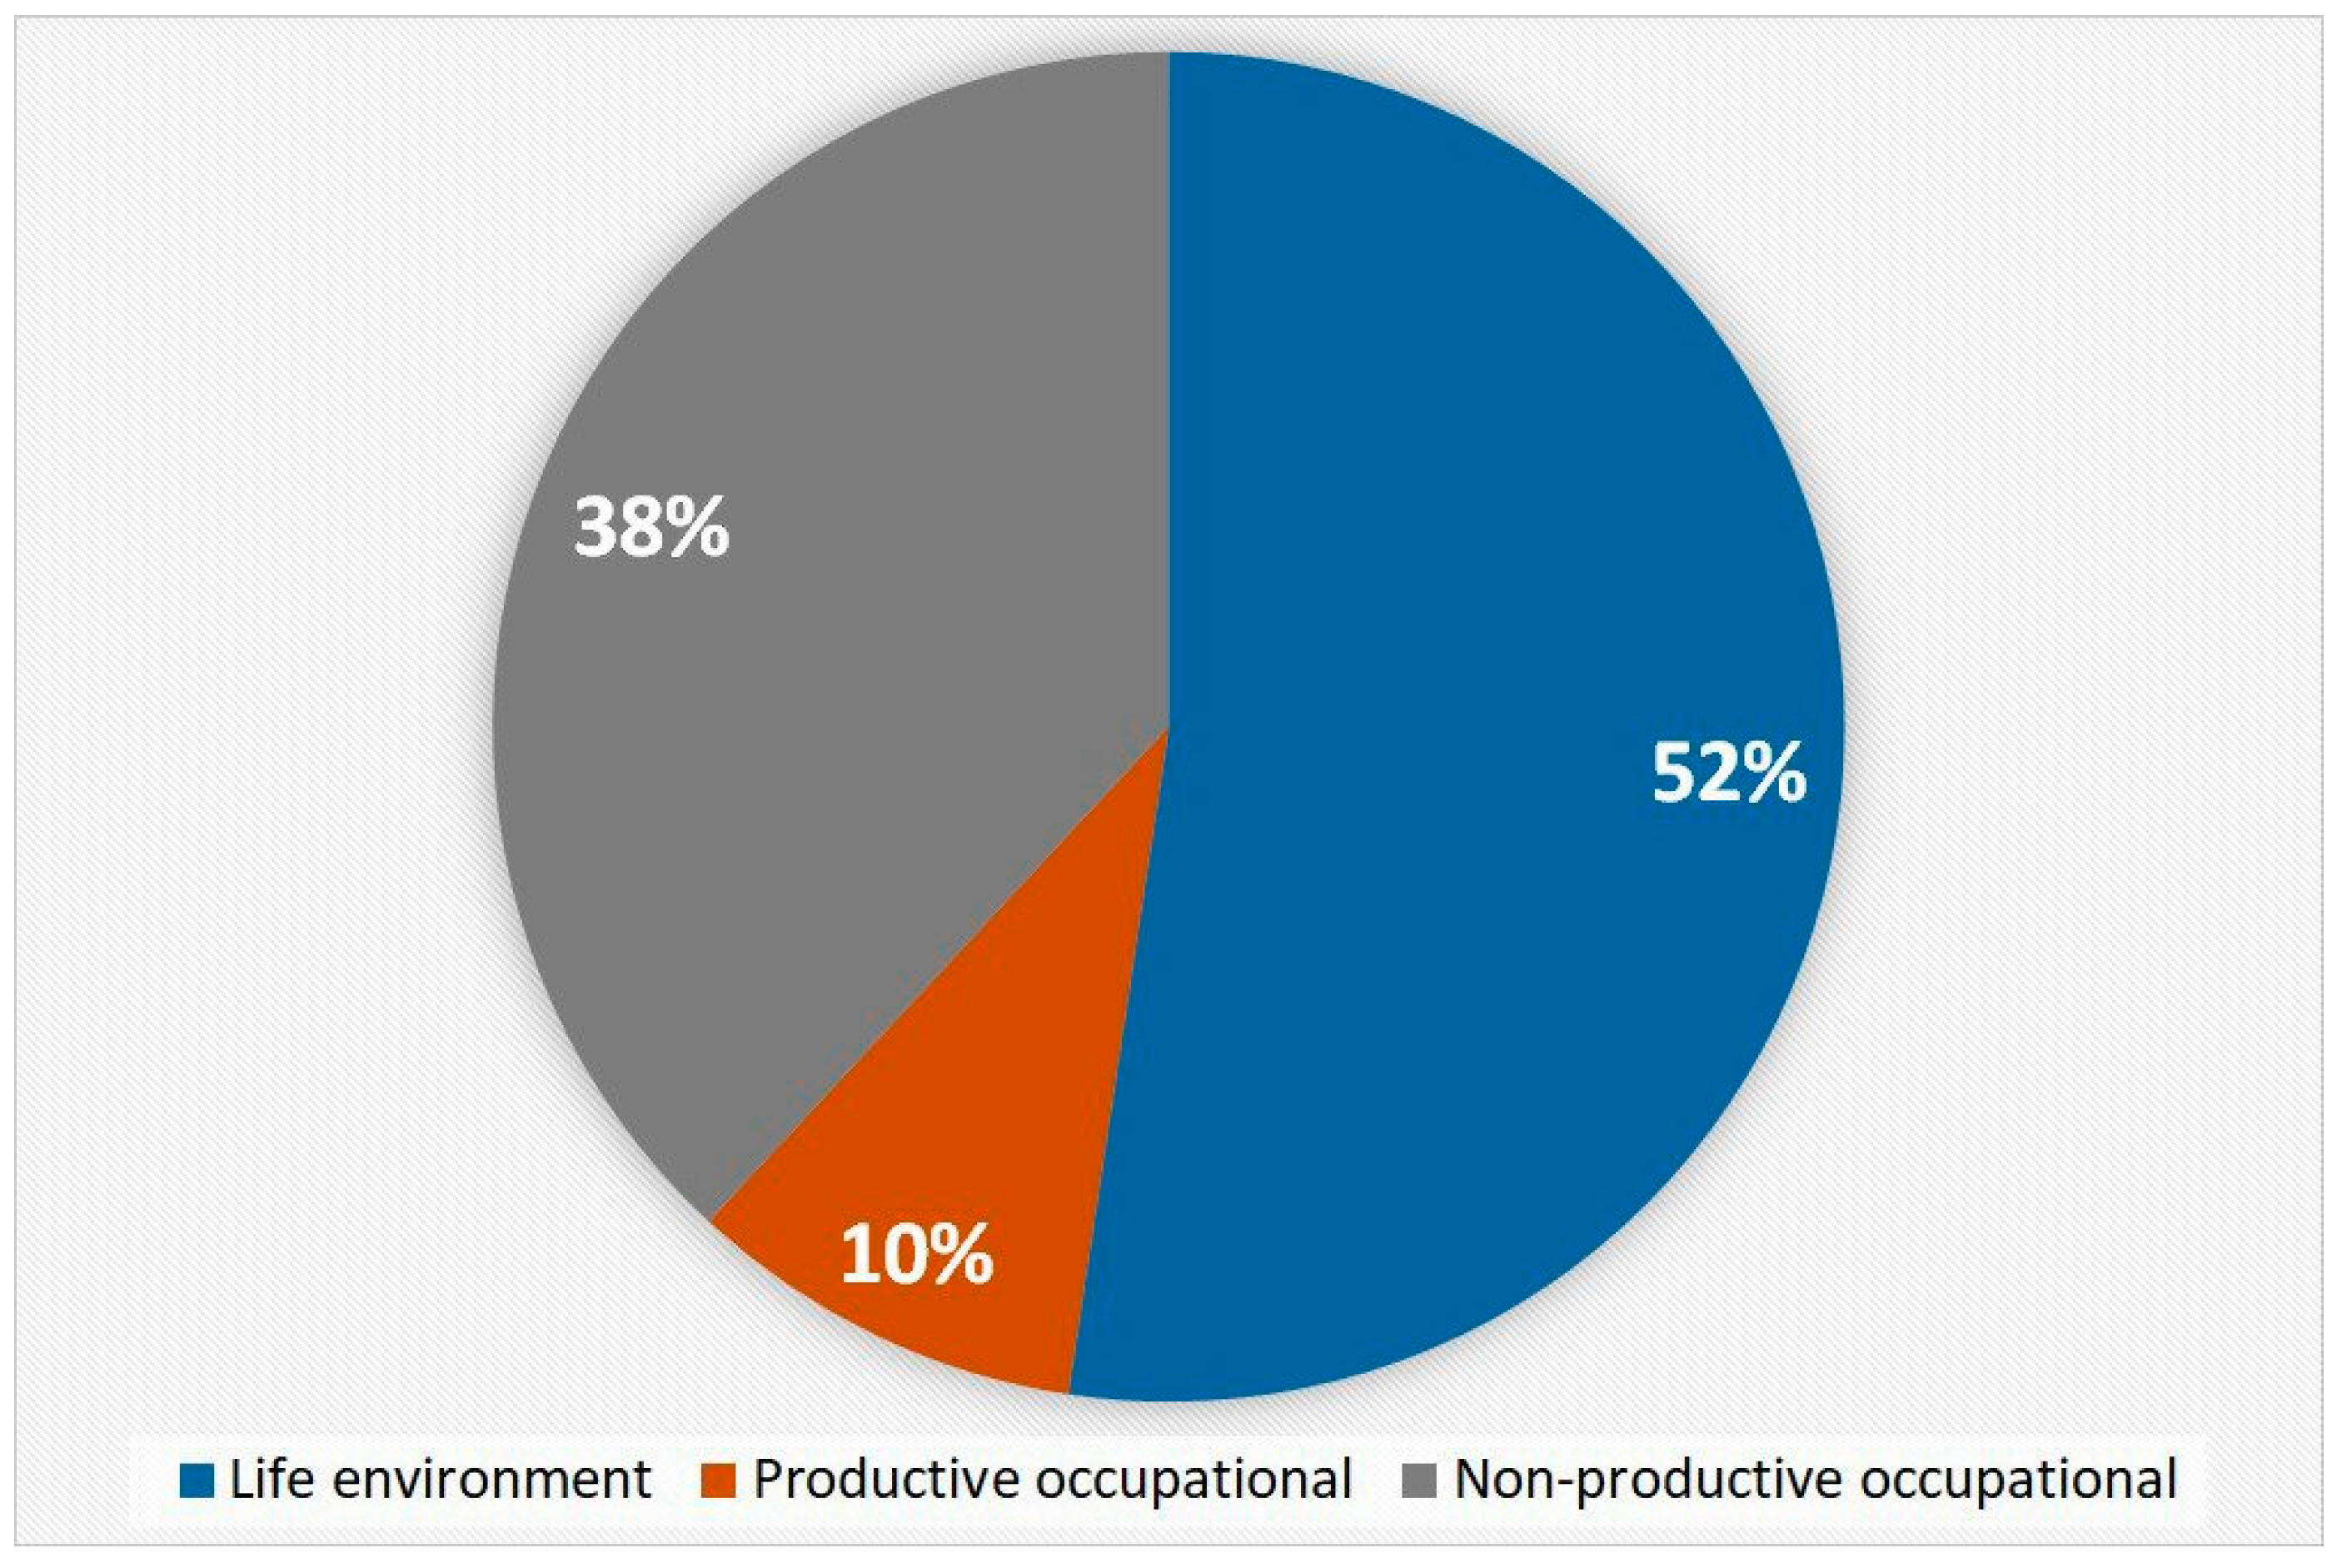
As expected, different sites and ambient characteristics emerge through the reviewed literature. First, the type of analysed environments: a comparable number of case-studies is found between workplaces (productive, non-productive) and life environments (Figure 4). Residential homes appear as the most represented, followed by schools and universities, offices, and commercial buildings. Only a few I-O studies considered industries [50,70]. The choice to investigate different typologies of buildings is also reported [50,58] and clearly indicates the interest of the international community to develop I-O studies on a wide range of life and occupational environments.
Related to the spatial variability, urban and suburban areas prevail over rural areas. Most studied indoor life environments are kitchens and living rooms due to the long time spent by occupants and to the presence of the major residential indoor sources (cooking, smoking). In the occupational sector, offices and ambient conditions potentially subjected to intense indoor sources (i.e., printers in commercial copy centres) are investigated. The design of indoor measurements in unoccupied residential environments is also found due to epidemiological purposes [61]. Outdoor environments are frequently chosen as the front door and front windows of indoor ambient environments, followed by courtyards and roofs.
Another difference among the studies is represented by the seasonal and duration variability of assessment campaigns. The choice of seasonal periods is based principally on outdoor sampling design both for meteorological constraints (i.e., rainfall, temperature) and for the need of measuring during high- or low-pollution periods. Many studies analyse more different periods of the year covering cold and hot seasons. While a predominance of a specific month or season do not emerge, frequently multi-seasonal durations are represented by autumn-winter-spring campaigns for the assessment of I-O relationships during such a particularly-sensible period for outdoor PM pollution. Spring-autumn and winter-summer investigations are also frequently adopted as representative of antipode meteorological conditions. These observations are based on the campaign duration reported by the authors of the original works: the effective sampling intervals could involve only a part of the entire period of study. As a brief observation, samplings are generally conducted over the entire campaign period, or at least on multiple weeks/months, rather than limited to single days or weeks.
No prevalence of mechanically- or naturally-ventilated buildings emerges from the studies. The type of ventilation assessed by the studies is, in fact, mainly related to the available sampling areas, with the exception to studies on the effects of a specific ventilation design to the infiltration of outdoor particles in indoor environments [53,79,82]. Significant differences are shown, in fact, in relation to ventilation systems, as described in Section 5.
5. Exchange Factors
5.1. Indoor/Outdoor Ratio
For the purposes of this review, the term “exchange factors” denotes the indicators describing the I-O relationship’s characteristics. The I/O ratio is widely used, even though it presents some limitations, as described in Section 3. In particular, its high variability also emerges among the reviewed studies and no consistent global trends can be stated a priori.
A general relationship with indoor activities and I/O ratio higher than the unity is found by Diapouli et al. [68] which report PM10 and PM2.5 ratios higher than 1 in gym, offices, and classes, and lower than 1 for a library (used only for a limited part of the day by students). Similar results are obtained for PM10 by Vicente et al. [55] by observing I/O ratio at copy centres in workdays (mostly > 1, with a maximum of 2.38) and in weekends (≈0.7–0.8). Significantly high I/O ratios for TSP, PM10, PM2.5, and PM1 (ranging from values approx. between 2 and 18, except for PM1 between 0.98 and 8.9) are found at an Antarctic research station [49]. In this case study, the extreme environmental conditions and limited outdoor sources significantly affect the increase of the observed I/O ratios, which should depend on the indoor activities and the emissions of the research station (i.e., vehicles, incinerator). The maximum observed I/O ratio (30.40), reached in an air conditioned classroom during cleaning hours and in the presence of rainfall, is reported by Guo et al. [82]. I/O ratios less than unity is found in the published studies of either occupied or unoccupied indoor environments [55,57,58,61,64,68,82].
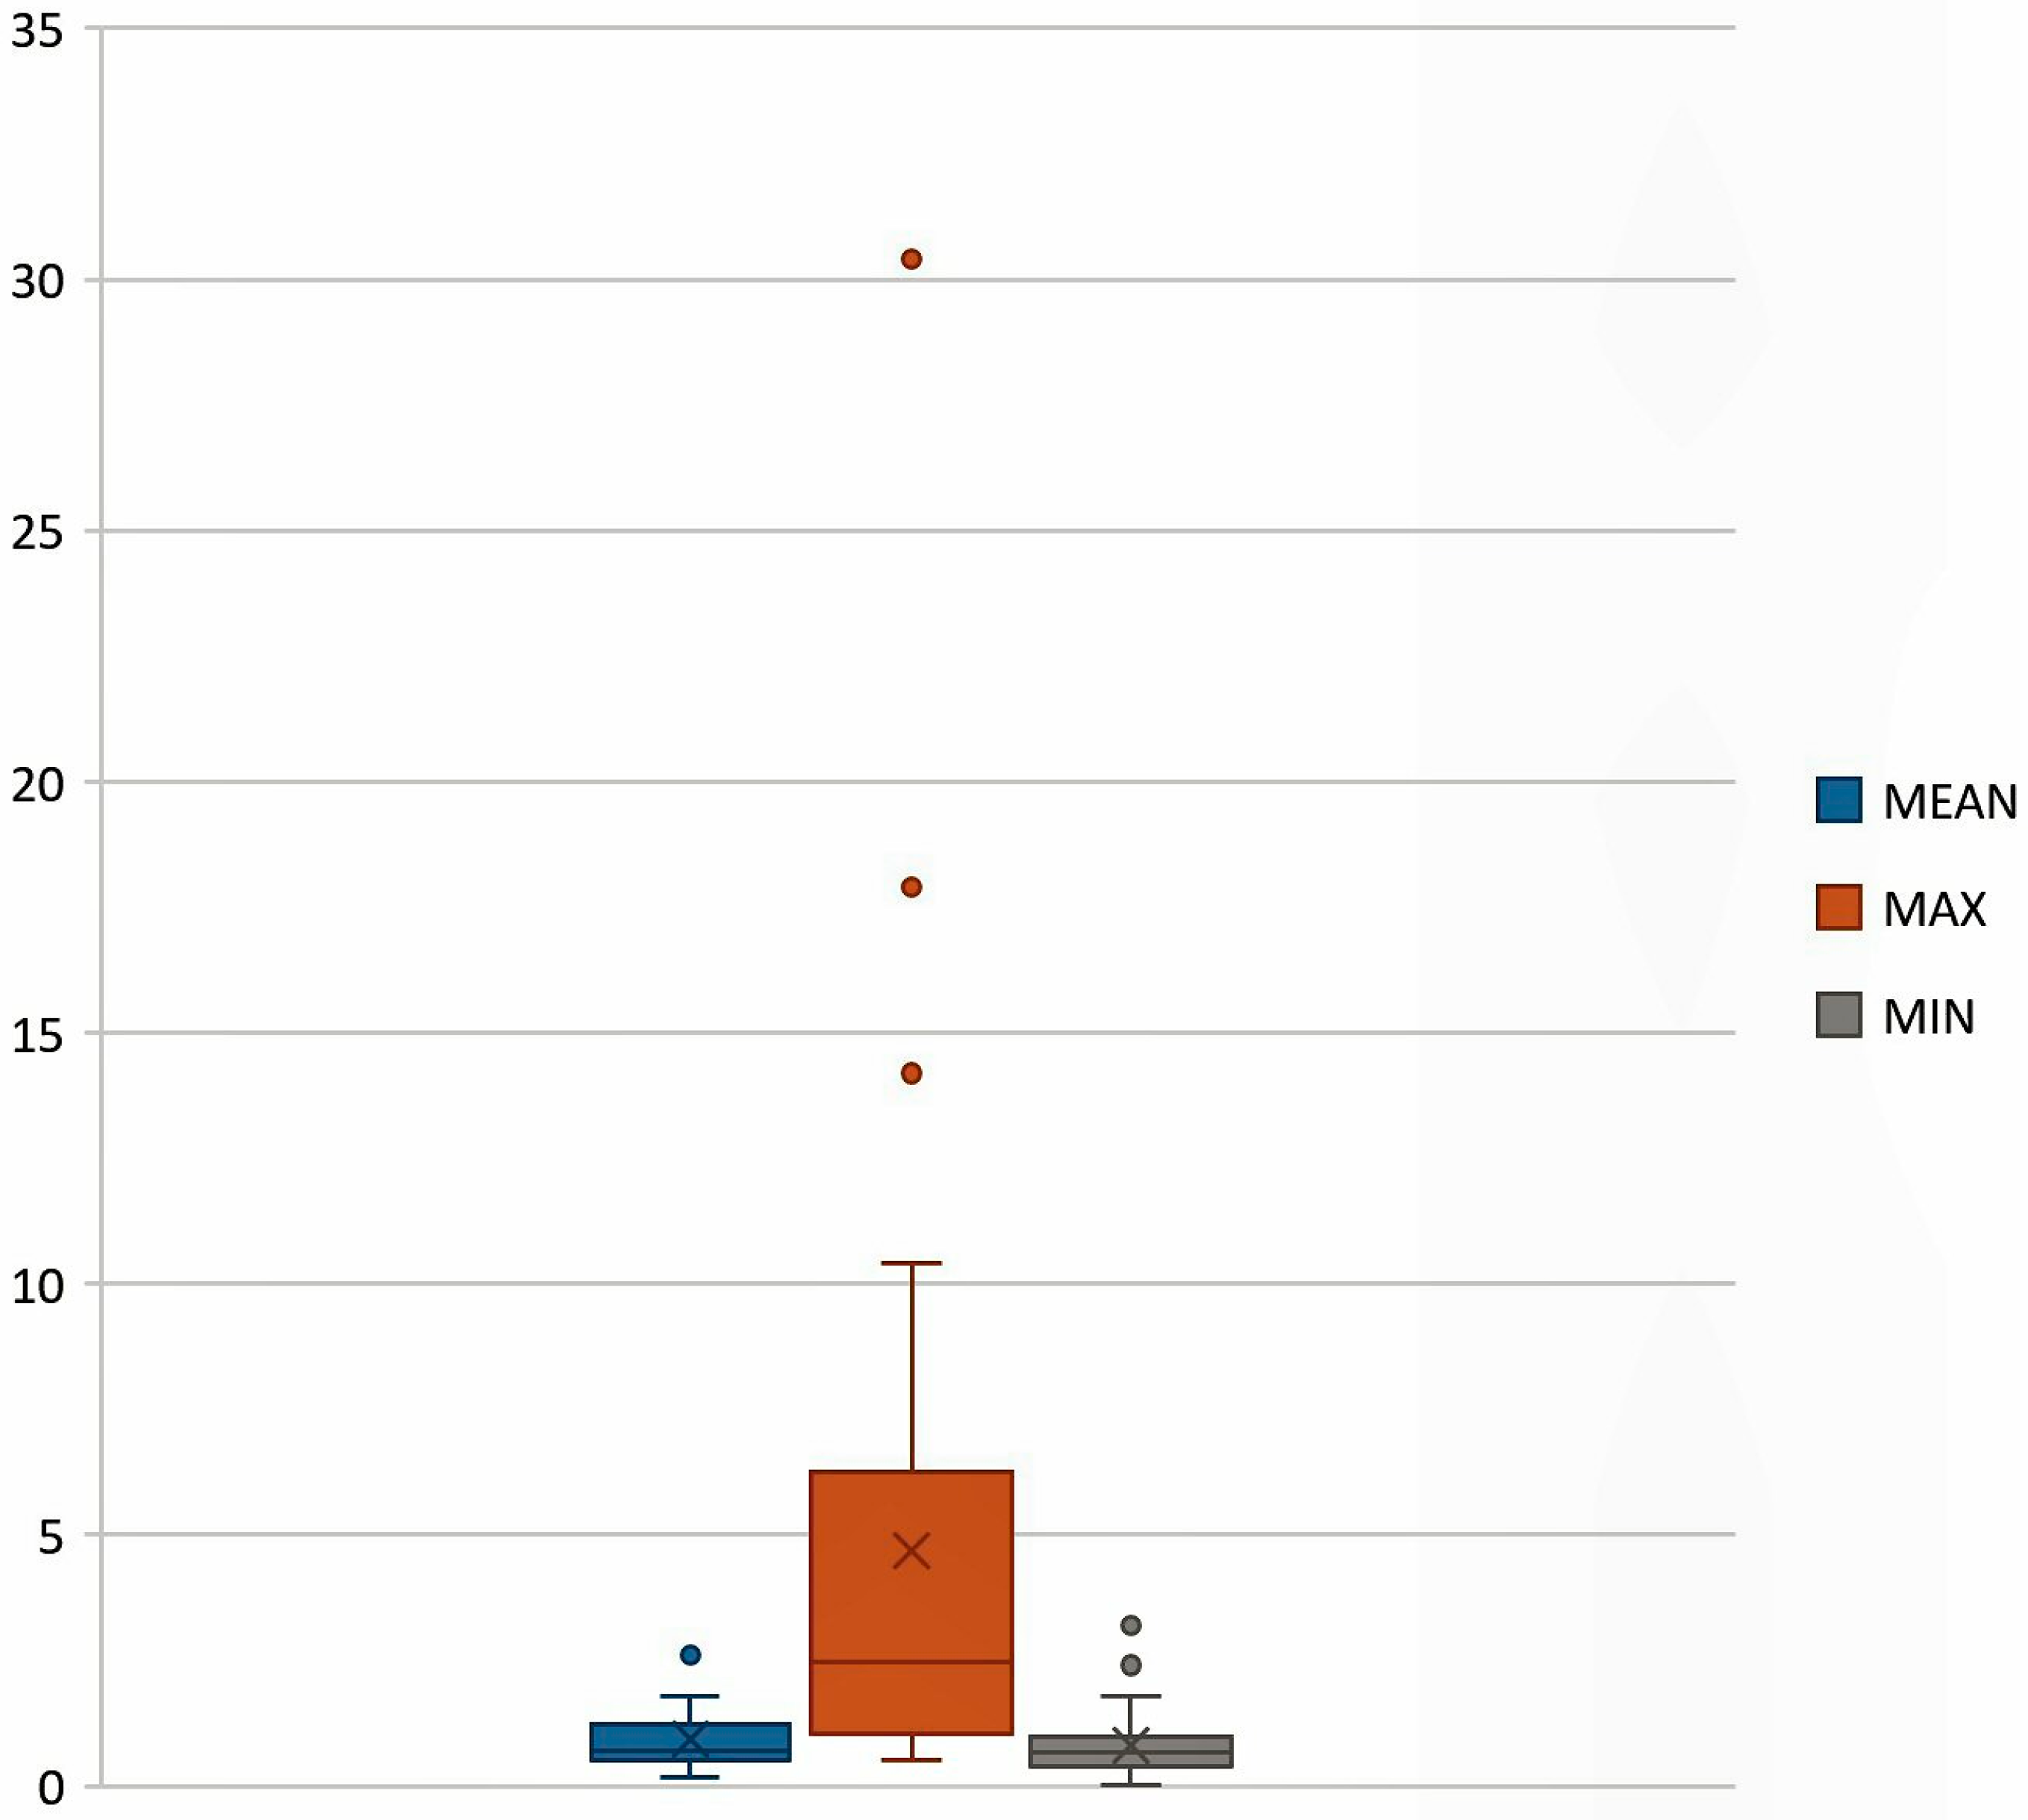
A significant example of the indicator variability can be clearly observed in the results of Challoner et al. [79]. The two highest I/O values (9.18 and 8.18), compared to other values between 1 and 3, are found for two offices (A and B) with consistent differences among them and some “contradictory” results from the expected trends: naturally (A) and mechanically (B) ventilated (no significant difference found in this study by building ventilation types); at the fifth (A) and ground (B) floors (expected different outdoor concentration incidence); small office (A) and large open plan (B) (incidence of air volume and ventilation pathways to indoor contribution); both during non-working hours (even if during working hours higher values are generally expected rather than non-working, in this case they are inferior and correspond to values of 4.68 and 2.87, respectively); and ventilation intake in front of a high-traffic road for (B) (with the expected effect of consistent outdoor concentrations on reducing the ratio). The study also developed two different campaigns for (B) considering a different disposition of the outdoor sampling: an I/O ratio four times higher is obtained with the outdoor station at the ground floor (8.18) than on the roof (2.04), where outdoor concentrations are expected to be lower. Considering the need of detailed correlation analysis with the indoor sources and the characteristic meteorological conditions of the area (i.e., temporal variation, well-noted high humidity, and frequent rainfalls in the Dublin region), these results confirm the extreme susceptibility of the I/O ratio to boundary conditions. Such variability among the reviewed studies is synthetized in Figure 5, which shows the box plot reporting mean, maximum, and minimum values of I/O ratios.
5.2. Air Exchange Rate (AER)
Evaluation of building ventilation is needed for the comprehension of influence of outdoor air pollution into indoor environments. Using the air exchange rate (AER), expressed as the air flow rate per volume of the indoor environment, a minor exchange of air is reported for mechanically-ventilated buildings rather than naturally-ventilated [40,60,62] ones. Volume estimation is obtained in the studies by direct and indirect approaches as measures of indoor spaces, cadastre data, and reported data by occupants. Measures of the AER are carried using tracer gasses or the pressurized blower method. Uses of perfluorocarbon, carbon dioxide, and perfluorinated methyl-cyclohexane are reported [40,60,61,82]. The distance of tracer sources from ventilation or heating sources is needed in order to reduce their interference. Different results for mechanical and natural ventilations are found due to the age of the building, occupants’ behaviours, and the efficiency of filters. The greater seal in mechanically-ventilated buildings is generally associated to a lower penetration of PM of outdoor origin than for naturally-ventilated environments [54].
5.3. Other Approaches
Among the I-O reviewed studies, considerations on some exchange factors or modelling approaches, rather than the sole analysis of the I/O ratio, are reported. Meng et al. [40] adopted a single compartment mass balance model and a random component superposition statistical model (RCS), with the support of AER and PM direct measurements and values obtained from the literature, to evaluate the contribution of ambient and non-ambient sources to indoor and personal concentrations. Results showed an average contribution of outdoor pollution to PM2.5 indoor concentrations over 60%. Furthermore, the increasing trend of the infiltration factor (IF) at the growth of AER values reported in the research shows the general reduction of outdoor contributions due to the decrease of air exchange. Using a two-compartment mass balance model, Chatoutsidou et al. [66] have also estimate the incidence of printer emissions in different rooms in a mechanically-ventilated building.
Within the results of the study published by Hoek et al. [38] emerges the role of particle size and composition to their infiltration and penetration in indoor environments: using a single mass balance model and comparing the results with other studies, the incidence of both dimensions and chemical components is confirmed by the authors from the variability of the average IF among sulphate, soot, and mass and particulate number concentrations (whole range between 0.06 and 0.87). The assessment of sulphate in parallel with the other I-O multiple samplings, is also found in other reviewed studies [50,68,83]. Actually, indoor sulphate concentration is a good estimator of IF due to the absence of significant indoor sources of such inorganic pollutants and constitutes, considering some limitations, a surrogate for describing the contribution of outdoor sources to indoor environments, as described in the literature [84].
As previously stated, the description in detail of infiltration and penetration factors, as well as modelling approaches, is intentionally considered marginal for the purposes of this review. Indicators and models for describing the dynamics of the unwanted entrance of outdoor pollution into indoor environments are systematically evaluated in other reviews [15,22,31,84]. We suggest to the readers who aim to obtain a complete framework of the subject to refer to such, and to other works in the existing literature.
6. Discussion
The framework emerging from the review of the existing literature shows a growing interest on PM I-O assessment. Most of recent studies focus on the evaluation of fine and ultrafine particulates due to the relevance of the relapses of potentially highly-penetrating particles to human health. Additionally, the use of a standard indicator, such as the PM10, is widely documented and the adoption of innovative or non-standard indicators is also observed in recent studies. The observed outline from the analysis of indicators is representative of the variety of approaches adopted within the I-O studies.
With the aim of finding potential standard approaches for the design and execution of I-O assessment, the need to associate a common indicator to the ones adopted for the specific objective of the studies is strengthened. This may represent an opportunity to make comparisons among studies, considering prior research. The feasibility of such additional measurement with a standard indicator must be subjected to the projects’ available resources and technologies. For this reason, the adoption of PM10 or PM2.5 additional sampling and the description of the I-O ratio could represent a good compromise between the use of resources and having a general comparison of indoor and outdoor environments among studies. Furthermore, the use of other indicators can also generally lead to a better comprehension of indirect relapses of PM as an annoyance and disturbance or to evaluate a specific contribution to mass concentrations, as a resuspension of dust, by assessing coarse particles (i.e., PM10–2.5).
In order to design a measurement campaign, the site-specific conditions of indoor and outdoor environments are not of secondary importance. The potential role of different sources should be evaluated: for outdoor sources the distance within the receptors, the emissions over time, and the dispersion pathways should be considered while, for indoor environments, human activities and behaviours (i.e., smoking, cooking, presence of pets) and internal and external architectural characteristics (i.e., age of the building, carpets, doors) represent crucial parameters for the definition of the assessment procedures [15,36,68]. In addition, sampling disposition should take into account the interference with unwanted sources of heat, ventilation, and other pollutants. Simultaneous measurements and outdoor sampling in the proximity of indoor environments should also be included as design criteria. The aim is to reduce spatial and temporal variability, which is widely described for indoor and outdoor PM. Contemporaneity is found to be generally considered in the reviewed studies, while a persistence of studies adopting outdoor values from other samplings is observed.
Related to human exposure, which is one of the main goals of the reviewed studies, the weak potential of using the sole outdoor concentrations to represent personal exposure to PM is confirmed by the literature. The good correlation found among indoor workplaces and personal samplings during working hours or, likewise, indoor residential and leisure time personal concentrations [85], show the feasibility of a simplified approach-based fixed monitoring in different I-O environments to obtain personal exposures [60]. Furthermore, the choice to associate I-O measurement with personal samplings represents a major opportunity: a well-designed personal measurement can describe unintended individual behaviours and might cover specific exposures to PM which can be difficult to assess by adopting only fixed monitoring. An example is represented by in-vehicle exposures which can consistently contribute to the “personal cloud” [9] for people spending a large amount of daytime moving from one indoor environment to another (i.e., the workplace and home) or working in transportation sectors. The recent developments of low-cost, light, and real-time samplers, used in association with GPS technologies, represent an opportunity for further studies employing personal measurements as shown by Steinle et al. [77]. The effectiveness of personal concentration measurements, however, requires as a critical parameter of design the verification of the aptitude of participants to carry the sampler, as also reported by Meng et al. [40]. Definitely, the design of both fixed and personal approaches is suggested.
The good precision and the correlation with traditional fixed monitoring stations, demonstrated in the literature [40], suggest the feasibility of using personal samplers in fixed positions for some specific purposes. In fact, the use of personal samplers might represent a good alternative to assess indoor and outdoor concentrations instead of traditional approaches, as described by Snyder et al. [86]. Different scenarios comprehend limitations in instrumentation and resources, difficulties of carrying heavy samplers and reaching the investigated site, the need of short-time or spot sampling, and the unavailability of connection to the electricity grid. It is, however, important to underline that the good correlation founded in some studies [40] does not necessarily imply a complete correspondence of the obtained concentrations and requires a reliable choice of sampling parameters considering the site-specific boundary conditions.
As a final consideration, the available literature showed the wide interest in I/O studies on the assessment of particulate matter chemical components between indoor and outdoor environments, in different contexts, especially schools [34,45,49,61,68,83]. In particular, a broad investigation of PM-bound PAHs is widely reported by recently-published papers [87,88,89,90] and a dedicated review on such topics is under consideration by the authors, given the increasing interest of the scientific community.
7. Conclusions
This paper reviews recent studies on the assessment of I-O particulate matter air pollution. An increasing interest by the international scientific community to indoor-outdoor relationships is evidenced by the development of several techniques for the study of emission and exchange parameters among ambient and non-ambient pollutants. The present review emphasises the importance of reducing divergences among I-O studies, derived from differences in measuring approaches, site characteristics, and campaign periods, and by the definition and adoption of standard approaches. This statement is joint with the need of efforts for the definition of dedicated normative frameworks, with the implementation of international common policies and specific value limits for indoor environments.
The opportunity given by the recent technological developments and the need to assess the human exposure to recently-introduced materials and in less studied environments are continuously leading to a growing interest in the development of innovative epidemiological and multidisciplinary studies in the field of I-O assessment.
Author Contributions
Matteo Bo, Pietro Salizzoni, Marina Clerico, and Riccardo Buccolieri conceived and designed the structure of the paper. Matteo Bo conducted the literature research, analysed the data, and wrote the main part of the paper. All authors contributed to the discussion of the results and have read and approved the final manuscript.
Conflicts of Interest
The authors declare no conflict of interest.
Abbreviations
| I-O | indoor-outdoor |
| Mass concentration | concentration expressed in micrograms per cube meters [μg/m3] |
| NP | nanoparticles |
| PM | (airborne) particulate matter |
| PN | Particle number |
| PNC | Particle number concentration = concentration expressed in number of particles per cubic centimetre [particles/cm3] |
| UFP | ultrafine particles |
References
- World Health Organization (WHO). Ambient Air Pollution: A Global Assessment of Exposure and Burden of Disease. Available online: http://www.who.int/phe/publications/air-pollution-global-assessment/en/ (accessed on 11 May 2017).
- International Agency for Research on Cancer (IARC). International Agency for Research on Cancer (IARC) Monographs on the Evaluation of Carcinogenic Risks to Humans, Volume 109; Outdoor Air Pollution; IARC: Lyon, France, 2015; Available online: http://monographs.iarc.fr/ENG/Monographs/vol109/index.php (accessed on 12 July 2016).
- World Health Organization (WHO). WHO Guidelines for Indoor Air Quality: Selected Pollutants. 2010. Available online: http://www.euro.who.int/en/health-topics/environment-and-health/air-quality/publications/2010/who-guidelines-for-indoor-air-quality-selected-pollutants (accessed on 12 May 2017).
- Brunekreef, B.; Holgate, S.T. Air pollution and health. Lancet 2002, 360, 1233–1242. [Google Scholar] [CrossRef]
- Raaschou-Nielsen, O.; Andersen, Z.J.; Beelen, R.; Samoli, E.; Stafoggia, M.; Weinmayr, G.; Hoffmann, B.; Fischer, P.; Nieuwenhuijsen, M.; Brunekreef, B.; et al. Air pollution and lung cancer incidence in 17 European cohorts: Prospective analyses from the European Study of Cohorts for Air Pollution Effects (ESCAPE). Lancet Oncol. 2013, 14, 813–822. [Google Scholar] [CrossRef]
- Seaton, A.; Godden, D.; MacNee, W.; Donaldson, K. Particulate air pollution and acute health effects. Lancet 1995, 345, 176–178. [Google Scholar] [CrossRef]
- Brasche, S.; Bischof, W. Daily time spent indoors in German homes—Baseline data for the assessment of indoor exposure of German occupants. Int. J. Hyg. Environ. Health 2005, 208, 247–253. [Google Scholar] [CrossRef] [PubMed]
- Monn, C.; Fuchs, A.; Högger, D.; Junker, M.; Kogelschatz, D.; Roth, N.; Wanner, H.U. Particulate matter less than 10 μm (PM10) and fine particles less than 2.5 μm (PM2.5): Relationships between indoor, outdoor and personal concentrations. Sci. Total Environ. 1997, 208, 15–21. [Google Scholar] [CrossRef]
- Ozkaynak, H.; Xue, J.; Spengler, J.; Wallace, L.; Pellizzari, E.; Jenkins, P. Personal exposure to airborne particles and metals: Results from the Particle TEAM study in Riverside, California. J. Expo. Anal. Environ. Epidemiol. 1996, 6, 57–78. [Google Scholar] [PubMed]
- Wallace, L. Indoor Particles: A Review. J. Air Waste Manag. Assoc. 1996, 46, 98–126. [Google Scholar] [CrossRef] [PubMed]
- Chen, R.; Kan, H.; Chen, B.; Huang, W.; Bai, Z.; Song, G.; Pan, G. Association of Particulate Air Pollution with Daily Mortality: The China Air Pollution and Health Effects Study. Am. J. Epidemiol. 2012, 175, 1173–1181. [Google Scholar] [CrossRef] [PubMed]
- Bo, M.; Clerico, M.; Pognant, F. Annoyance and disturbance hazard factors related to work and life environments: A review. Geam-Geoing. Ambient. E Mineraria-Geam-Geoengin. Environ. Min. 2016, 149, 27–34. [Google Scholar]
- Kephalopoulos, S.; Koistinen, K.; Paviotti, M.; Schwela, D.; Kotzias, D. Proceedings of the International Workshop on “Combined Environmental Exposure: Noise, Air Pollutants and Chemicals”. Available online: https://ec.europa.eu/jrc/en/publication/eur-scientific-and-technical-research-reports/proceedings-international-workshop-combined-environmental-exposure-noise-air-pollutants-and (accessed on 10 May 2017).
- Mohammed, M.O.A.; Song, W.-W.; Ma, W.-L.; Li, W.L.; Ambuchi, J.J.; Thabit, M.; Li, Y.-F. Trends in indoor–outdoor PM2.5 research: A systematic review of studies conducted during the last decade (2003–2013). Atmos. Pollut. Res. 2015, 6, 893–903. [Google Scholar] [CrossRef]
- Chen, C.; Zhao, B. Review of relationship between indoor and outdoor particles: I/O ratio, infiltration factor and penetration factor. Atmos. Environ. 2011, 45, 275–288. [Google Scholar] [CrossRef]
- Lin, C.-C.; Peng, C.-K. Characterization of Indoor PM10, PM2.5, and Ultrafine Particles in Elementary School Classrooms: A Review. Environ. Eng. Sci. 2010, 27, 915–922. [Google Scholar] [CrossRef]
- Clayton, C.A.; Perritt, R.L.; Pellizzari, E.D.; Thomas, K.W.; Whitmore, R.W.; Ozkaynak, H.; Spengler, J.D. Particle Total Exposure Assessment Methodology (PTEAM) study: Distributions of aerosol and elemental concentrations in personal, indoor, and outdoor air samples in a southern California community. J. Expo. Anal. Environ. Epidemiol. 1993, 3, 227–250. [Google Scholar] [PubMed]
- Jantunen, M.J.; Hänninen, O.; Katsouyanni, K.; Knöppel, H.; Kuenzli, N.; Lebret, E.; Maroni, M.; Saarela, K.; Srám, R.; Zmirou, D. Air pollution exposure in European cities: The “EXPOLIS” study. J. Expo. Anal. Environ. Epidemiol. 1998, 8, 495–518. [Google Scholar]
- Lioy, P.J.; Waldman, J.M.; Buckley, T.; Butler, J.; Pietarinen, C. The personal, indoor and outdoor concentrations of PM-10 measured in an industrial community during the winter. Atmos. Environ. Part B Urban Atmos. 1990, 24, 57–66. [Google Scholar] [CrossRef]
- SciVal. Available online: https://www.scival.com/ (accessed on 7 May 2017).
- Karagulian, F.; Belis, C.A.; Dora, C.F.C.; Prüss-Ustün, M.A.; Bonjour, S.; Adair-Rohani, H.; Amann, M. Contributions to cities’ ambient particulate matter (PM): A systematic review of local source contributions at global level. Atmos. Environ. 2015, 120, 475–483. [Google Scholar] [CrossRef]
- Biswas, P.; Wu, C.-Y. Nanoparticles and the Environment. J. Air Waste Manag. Assoc. 2005, 55, 708–746. [Google Scholar] [CrossRef] [PubMed]
- Brauer, M.; Amann, M.; Burnett, R.T.; Cohen, A.; Dentener, F.; Ezzati, M.; Henderson, S.B.; Krzyzanowski, M.; Martin, R.V.; Dingenen, R.V.; et al. Exposure Assessment for Estimation of the Global Burden of Disease Attributable to Outdoor Air Pollution. Environ. Sci. Technol. 2012, 46, 652–660. [Google Scholar] [CrossRef] [PubMed]
- Murr, L.E.; Garza, K.M. Natural and anthropogenic environmental nanoparticulates: Their microstructural characterization and respiratory health implications. Atmos. Environ. 2009, 43, 2683–2692. [Google Scholar] [CrossRef]
- Wangchuk, T.; He, C.; Dudzinska, M.R.; Morawska, L. Seasonal variations of outdoor air pollution and factors driving them in the school environment in rural Bhutan. Atmos. Environ. 2015, 113, 151–158. [Google Scholar] [CrossRef] [Green Version]
- Monn, C. Exposure assessment of air pollutants: A review on spatial heterogeneity and indoor/outdoor/personal exposure to suspended particulate matter, nitrogen dioxide and ozone. Atmos. Environ. 2001, 35, 1–32. [Google Scholar] [CrossRef]
- Abt, E.; Suh, H.H.; Allen, G.; Koutrakis, P. Characterization of indoor particle sources: A study conducted in the metropolitan Boston area. Environ. Health Perspect. 2000, 108, 35–44. [Google Scholar] [CrossRef] [PubMed]
- Jones, N.C.; Thornton, C.A.; Mark, D.; Harrison, R.M. Indoor/outdoor relationships of particulate matter in domestic homes with roadside, urban and rural locations. Atmos. Environ. 2000, 34, 2603–2612. [Google Scholar] [CrossRef]
- Lai, H.K.; Kendall, M.; Ferrier, H.; Lindup, I.; Alm, S.; Hänninen, O.; Jantunen, M.; Mathys, P.; Colvile, R.; Ashmore, M.R.; et al. Personal exposures and microenvironment concentrations of PM2.5, VOC, NO2 and CO in Oxford, UK. Atmos. Environ. 2004, 38, 6399–6410. [Google Scholar] [CrossRef]
- Yocom, J.E. A Critical Review. J. Air Pollut. Control Assoc. 1982, 32, 500–520. [Google Scholar] [CrossRef]
- Nazaroff, W.W. Indoor particle dynamics. Indoor Air 2004, 14, 175–183. [Google Scholar] [CrossRef] [PubMed]
- Fuoco, F.C.; Stabile, L.; Buonanno, G.; Trassiera, C.V.; Massimo, A.; Russi, A.; Mazaheri, M.; Morawska, L.; Andrade, A. Indoor Air Quality in Naturally Ventilated Italian Classrooms. Atmosphere 2015, 6, 1652–1675. [Google Scholar] [CrossRef] [Green Version]
- Rivas, I.; Viana, N.; Morento, T.; Pandolfi, M.; Amato, F.; Reche, C.; Bouso, L.; Alvarez-Pedrerol, M.; Alastuey, A.; Sunyer, J.; et al. Child exposure to indoor and outdoor air pollutants in schools in Barcelona, Spain. Environ. Int. 2014, 69, 200–212. [Google Scholar] [CrossRef] [PubMed]
- Tofful, L.; Perrino, C. Chemical Composition of Indoor and Outdoor PM2.5 in Three Schools in the City of Rome. Atmosphere 2015, 6, 1422–1443. [Google Scholar] [CrossRef]
- Mainka, A.; Zajusz-Zubek, E.; Kaczmarek, K. PM2.5 in Urban and Rural Nursery Schools in Upper Silesia, Poland: Trace Elements Analysis. Int. J. Environ. Res. Public Health 2015, 12, 7990–8008. [Google Scholar] [CrossRef] [PubMed]
- Lachenmyer, C. Urban Measurements of Outdoor-Indoor PM2.5 Concentrations and Personal Exposure in the Deep South. Part I. Pilot Study of Mass Concentrations for Nonsmoking Subjects. Aerosol Sci. Technol. 2000, 32, 34–51. [Google Scholar] [CrossRef]
- Riesenfeld, E.; Chalupa, D.; Gibb, F.R.; Oberdörster, G.; Gelein, R.; Morrow, P.E.; Utell, M.J.; Frampton, M.W. Ultrafine Particle Concentrations in a Hospital. Inhal. Toxicol. 2000, 12, 83–94. [Google Scholar] [CrossRef] [PubMed]
- Hoek, G.; Kos, G.; Harrison, R.; de Hartog, J.; Meliefste, K.; ten Brink, H.; Katsouyanni, K.; Karakatsani, A.; Lianou, M.; Kotronarou, A.; et al. Indoor–outdoor relationships of particle number and mass in four European cities. Atmos. Environ. 2008, 42, 156–169. [Google Scholar] [CrossRef]
- Hussein, T.; Hämeri, K.; Aalto, P.P.; Paatero, P.; Kulmala, M. Modal structure and spatial–temporal variations of urban and suburban aerosols in Helsinki—Finland. Atmos. Environ. 2005, 39, 1655–1668. [Google Scholar] [CrossRef]
- Meng, Q.Y.; Turpin, B.J.; Korn, L.; Weisel, C.P.; Morandi, M.; Colome, S.; Zhang, J.; Stock, T.; Spektor, D.; Winer, A. Influence of ambient (outdoor) sources on residential indoor and personal PM2.5 concentrations: Analyses of RIOPA data. J. Expo. Sci. Environ. Epidemiol. 2005, 15, 17–28. [Google Scholar] [CrossRef] [PubMed]
- Brunekreef, B.; Janssen, N.A.H.; de Hartog, J.J.; Oldenwening, M.; Meliefste, K.; Hoek, G.; Lanki, T.; Timonen, K.L.; Vallius, M.; Pekkanen, J.; et al. Personal, indoor, and outdoor exposures to PM2.5 and its components for groups of cardiovascular patients in Amsterdam and Helsinki. Res. Rep. Health Eff. Inst. 2005, 127, 1–70. [Google Scholar]
- Shilton, V.; Giess, P.; Mitchell, D.; Williams, C. The Relationships between Indoor and Outdoor Respirable Particulate Matter: Meteorology, Chemistry and Personal Exposure. Indoor Built Environ. 2002, 11, 266–274. [Google Scholar] [CrossRef]
- Zhou, B.; Zhao, B.; Guo, X.; Chen, R.; Kan, H. Investigating the geographical heterogeneity in PM10-mortality associations in the China Air Pollution and Health Effects Study (CAPES): A potential role of indoor exposure to PM10 of outdoor origin. Atmos. Environ. 2013, 75, 217–223. [Google Scholar] [CrossRef]
- Zhao, B.; Wu, J. Particle deposition in indoor environments: Analysis of influencing factors. J. Hazard. Mater. 2007, 147, 439–448. [Google Scholar] [CrossRef] [PubMed]
- Nazir, R.; Shaheen, N.; Shah, M.H. Indoor/outdoor relationship of trace metals in the atmospheric particulate matter of an industrial area. Atmos. Res. 2011, 101, 765–772. [Google Scholar] [CrossRef]
- Krugly, E.; Martuzevicius, D.; Sidaraviciute, R.; Ciuzas, D.; Prasauskas, T.; Kauneliene, V.; Stasiulaitiene, I.; Kliucininkas, L. Characterization of particulate and vapor phase polycyclic aromatic hydrocarbons in indoor and outdoor air of primary schools. Atmos. Environ. 2014, 82, 298–306. [Google Scholar] [CrossRef]
- Halsall, C.J.; Maher, B.A.; Karloukovski, V.V.; Shah, P.; Watkins, S.J. A novel approach to investigating indoor/outdoor pollution links: Combined magnetic and PAH measurements. Atmos. Environ. 2008, 42, 8902–8909. [Google Scholar] [CrossRef] [Green Version]
- Alves, C.; Duarte, M.; Ferreira, M.; Alves, A.; Almeida, A.; Cunha, Â. Air quality in a school with dampness and mould problems. Air Qual. Atmos. Health 2016, 9, 107–115. [Google Scholar] [CrossRef]
- Pagel, É.C.; Reis, N.C.; Alvarez, C.E.; Santos, J.M.; Conti, M.M.; Boldrini, R.S.; Kerr, A.S. Characterization of the indoor particles and their sources in an Antarctic research station. Environ. Monit. Assess. 2016, 188, 167. [Google Scholar] [CrossRef] [PubMed]
- Saraga, D.; Pateraki, S.; Papadopoulos, A.; Vasilakos, C.; Maggos, T. Studying the indoor air quality in three non-residential environments of different use: A museum, a printery industry and an office. Build. Environ. 2011, 46, 2333–2341. [Google Scholar] [CrossRef]
- Polednik, B. Particulate matter and student exposure in school classrooms in Lublin, Poland. Environ. Res. 2013, 120, 134–139. [Google Scholar] [CrossRef] [PubMed]
- Worobiec, A.; Samek, L.; Krata, A.; van Meel, K.; Krupinska, B.; Stefaniak, E.A.; Karaszkiewicz, P.; van Grieken, R. Transport and deposition of airborne pollutants in exhibition areas located in historical buildings–study in Wawel Castle Museum in Cracow, Poland. J. Cult. Herit. 2010, 11, 354–359. [Google Scholar] [CrossRef]
- Chatoutsidou, S.E.; Ondráček, J.; Tesar, O.; Tørseth, K.; Ždímal, V.; Lazaridis, M. Indoor/outdoor particulate matter number and mass concentration in modern offices. Build. Environ. 2015, 92, 462–474. [Google Scholar] [CrossRef]
- Diapouli, E.; Eleftheriadis, K.; Karanasiou, A.A.; Vratolis, S.; Hermansen, O.; Colbeck, I.; Lazaridis, M. Indoor and Outdoor Particle Number and Mass Concentrations in Athens. Sources, Sinks and Variability of Aerosol Parameters. Aerosol Air Qual. Res. 2011, 11, 632–642. [Google Scholar] [CrossRef]
- Vicente, E.D.; Ribeiro, J.P.; Custódio, D.; Alves, C.A. Assessment of the indoor air quality in copy centres at Aveiro, Portugal. Air Qual. Atmos. Health 2017, 10, 117–127. [Google Scholar] [CrossRef]
- Braniš, M.; Řezáčová, P.; Domasová, M. The effect of outdoor air and indoor human activity on mass concentrations of PM10, PM2.5, and PM1 in a classroom. Environ. Res. 2005, 99, 143–149. [Google Scholar] [CrossRef] [PubMed]
- Goyal, R.; Kumar, P. Indoor-outdoor concentrations of particulate matter in nine microenvironments of a mix-use commercial building in megacity Delhi. Air Qual. Atmos. Health 2013, 6, 747–757. [Google Scholar] [CrossRef] [Green Version]
- Liu, Y.; Chen, R.; Shen, X.; Mao, X. Wintertime indoor air levels of PM10, PM2.5 and PM1 at public places and their contributions to TSP. Environ. Int. 2004, 30, 189–197. [Google Scholar] [CrossRef]
- Schembari, A.; Triguero-Mas, M.; de Nazelle, A.; Davdand, P.; Vrijheid, M.; Cirach, M.; Martinez, D.; Figueras, F.; Querol, X.; Basagaña, X. Personal, indoor and outdoor air pollution levels among pregnant women. Atmos. Environ. 2013, 64, 287–295. [Google Scholar] [CrossRef]
- Wheeler, A.J.; Wallace, L.A.; Kearney, J.; van Ryswyk, K.; You, H.; Kulka, R.; Brook, J.R.; Xu, X. Personal, Indoor, and Outdoor Concentrations of Fine and Ultrafine Particles Using Continuous Monitors in Multiple Residences. Aerosol Sci. Technol. 2011, 45, 1078–1089. [Google Scholar] [CrossRef]
- Sajani, S.Z.; Ricciardelli, I.; Trentini, A.; Bacco, D.; Maccone, C.; Castellazzi, S.; Lauriola, P.; Poluzzi, V.; Harrison, R.M. Is particulate air pollution at the front door a good proxy of residential exposure? Environ. Pollut. 2016, 213, 347–358. [Google Scholar] [CrossRef] [PubMed]
- Weichenthal, S.; Dufresne, A.; Infante-Rivard, C.; Joseph, L. Indoor ultrafine particle exposures and home heating systems: A cross-sectional survey of Canadian homes during the winter months. J. Expo. Sci. Environ. Epidemiol. 2006, 17, 288–297. [Google Scholar] [CrossRef] [PubMed]
- Colbeck, I.; Nasir, Z.A.; Ali, Z. Characteristics of indoor/outdoor particulate pollution in urban and rural residential environment of Pakistan. Indoor Air 2010, 20, 40–51. [Google Scholar] [CrossRef] [PubMed] [Green Version]
- Majewski, G.; Kociszewska, K.; Rogula-Kozłowska, W.; Pyta, H.; Rogula-Kopiec, P.; Mucha, W.; Pastuszka, J. Submicron Particle-Bound Mercury in University Teaching Rooms: A Summer Study from Two Polish Cities. Atmosphere 2016, 7, 117. [Google Scholar] [CrossRef]
- Barthel, M.; Pedan, V.; Hahn, O.; Rothhardt, M.; Bresch, H.; Jann, O.; Seeger, S. XRF-Analysis of Fine and Ultrafine Particles Emitted from Laser Printing Devices. Environ. Sci. Technol. 2011, 45, 7819–7825. [Google Scholar] [CrossRef] [PubMed]
- Chatoutsidou, S.E.; Serfozo, N.; Glytsos, T.; Lazaridis, M. Multi-zone measurement of particle concentrations in a HVAC building with massive printer emissions: Influence of human occupation and particle transport indoors. Air Qual. Atmos. Health 2017, 1–15. [Google Scholar] [CrossRef]
- Lee, C.-W.; Hsu, D.-J. Measurements of fine and ultrafine particles formation in photocopy centers in Taiwan. Atmos. Environ. 2007, 41, 6598–6609. [Google Scholar] [CrossRef]
- Diapouli, E.; Chaloulakou, A.; Mihalopoulos, N.; Spyrellis, N. Indoor and outdoor PM mass and number concentrations at schools in the Athens area. Environ. Monit. Assess. 2008, 136, 13–20. [Google Scholar] [CrossRef] [PubMed]
- Kuhlbusch, T.A.; Asbach, C.; Fissan, H.; Göhler, D.; Stintz, M. Nanoparticle exposure at nanotechnology workplaces: A review. Part. Fibre Toxicol. 2011, 8, 22. [Google Scholar] [CrossRef] [PubMed]
- Dahm, M.M.; Evans, D.E.; Schubauer-Berigan, M.K.; Birch, M.E.; Deddens, J.A. Occupational Exposure Assessment in Carbon Nanotube and Nanofiber Primary and Secondary Manufacturers: Mobile Direct-Reading Sampling. Ann. Occup. Hyg. 2013, 57, 328–344. [Google Scholar] [PubMed]
- Xu, H.; Guinot, B.; Shen, Z.; Ho, K.F.; Niu, X.; Xiao, S.; Huang, R.J.; Cao, J. Characteristics of Organic and Elemental Carbon in PM2.5 and PM0.25 in Indoor and Outdoor Environments of a Middle School: Secondary Formation of Organic Carbon and Sources Identification. Atmosphere 2015, 6, 361–379. [Google Scholar] [CrossRef]
- Amaral, S.S.; De Carvalho, J.A.; Costa, M.A.M.; Pinheiro, C. An Overview of Particulate Matter Measurement Instruments. Atmosphere 2015, 6, 1327–1345. [Google Scholar] [CrossRef]
- Chow, J.C.; Doraiswamy, P.; Watson, J.G.; Chen, L.-W.A.; Ho, S.S.H.; Sodeman, D.A. Advances in Integrated and Continuous Measurements for Particle Mass and Chemical Composition. J. Air Waste Manag. Assoc. 2008, 58, 141–163. [Google Scholar] [CrossRef] [PubMed]
- Marple, V.A.; Rubow, K.L.; Turner, W.; Spengler, J.D. Low Flow Rate Sharp Cut Impactors for Indoor Air Sampling: Design and Calibration. JAPCA 1987, 37, 1303–1307. [Google Scholar] [CrossRef] [PubMed]
- Crist, K.C.; Liu, B.; Kim, M.; Deshpande, S.R.; John, K. Characterization of fine particulate matter in Ohio: Indoor, outdoor, and personal exposures. Environ. Res. 2008, 106, 62–71. [Google Scholar] [CrossRef] [PubMed]
- Kuo, H.-W.; Shen, H.-Y. Indoor and outdoor PM2.5 and PM10 concentrations in the air during a dust storm. Build. Environ. 2010, 45, 610–614. [Google Scholar] [CrossRef]
- Steinle, S.; Reis, S.; Sabel, C.E.; Semple, S.; Twigg, M.M.; Braban, C.F.; Leeson, S.R.; Heal, M.R.; Harrison, D.; Lin, C.; et al. Personal exposure monitoring of PM2.5 in indoor and outdoor microenvironments. Sci. Total Environ. 2015, 508, 383–394. [Google Scholar] [CrossRef] [PubMed]
- United States Environmental Protection Agency (US EPA). 2012 National Ambient Air Quality Standards (NAAQS) for Particulate Matter (PM). Available online: https://www.epa.gov/pm-pollution/2012-national-ambient-air-quality-standards-naaqs-particulate-matter-pm (assessed on 16 May 2017).
- Challoner, A.; Gill, L. Indoor/outdoor air pollution relationships in ten commercial buildings: PM2.5 and NO2. Build. Environ. 2014, 80, 159–173. [Google Scholar] [CrossRef]
- Weisel, C.P.; Zhang, J.; Turpin, B.J.; Morandi, M.T.; Colome, S.; Stock, T.H.; Spektor, D.M.; Korn, L.; Winer, A.; Alimokhtari, S. Relationship of Indoor, Outdoor and Personal Air (RIOPA) study: Study design, methods and quality assurance/control results. J. Expo. Sci. Environ. Epidemiol. 2005, 15, 123–137. [Google Scholar] [CrossRef] [PubMed]
- Koistinen, K.J.; Kousa, A.; Tenhola, V.; Hänninen, O.; Jantunen, M.J.; Oglesby, L.; Kuenzli, N.; Georgoulis, L. Fine Particle (PM25) Measurement Methodology, Quality Assurance Procedures, and Pilot Results of the EXPOLIS Study. J. Air Waste Manag. Assoc. 1999, 49, 1212–1220. [Google Scholar] [CrossRef] [PubMed]
- Guo, H.; Morawska, L.; He, C.; Gilbert, D. Impact of ventilation scenario on air exchange rates and on indoor particle number concentrations in an air-conditioned classroom. Atmos. Environ. 2008, 42, 757–768. [Google Scholar] [CrossRef] [Green Version]
- Fromme, H.; Diemer, J.; Dietrich, S.; Cyrys, J.; Heinrich, J.; Lang, W.; Kiranoglu, M.; Twardella, D. Chemical and morphological properties of particulate matter (PM10, PM2.5) in school classrooms and outdoor air. Atmos. Environ. 2008, 42, 6597–6605. [Google Scholar] [CrossRef]
- Diapouli, E.; Chaloulakou, A.; Koutrakis, P. Estimating the concentration of indoor particles of outdoor origin: A review. J. Air Waste Manag. Assoc. 2013, 63, 1113–1129. [Google Scholar] [CrossRef] [PubMed]
- Kousa, A.; Oglesby, L.; Koistinen, K.; Künzli, N.; Jantunen, M. Exposure chain of urban air PM2.5—Associations between ambient fixed site, residential outdoor, indoor, workplace and personal exposures in four European cities in the EXPOLIS-study. Atmos. Environ. 2002, 36, 3031–3039. [Google Scholar] [CrossRef]
- Snyder, E.G.; Watkins, T.H.; Solomon, P.A.; Thomas, E.D.; Williams, R.W.; Hagler, G.S.W.; Shelow, D.; Hindin, D.A.; Kilaru, V.J.; Preuss, P.W. The Changing Paradigm of Air Pollution Monitoring. Environ. Sci. Technol. 2013, 47, 11369–11377. [Google Scholar] [CrossRef] [PubMed]
- Oliveira, M.; Slezakova, K.; Madureira, J.; de Oliveira Fernandes, E.; Delerue-Matos, C.; Morais, S.; do Carmo Pereira, M. Polycyclic aromatic hydrocarbons in primary school environments: Levels and potential risks. Sci. Total Environ. 2017, 575, 1156–1167. [Google Scholar] [CrossRef] [PubMed]
- Romagnoli, P.; Balducci, C.; Perilli, M.; Vichi, F.; Imperiali, A.; Cecinato, A. Indoor air quality at life and work environments in Rome, Italy. Environ. Sci. Pollut. Res. 2016, 23, 3503–3516. [Google Scholar] [CrossRef] [PubMed]
- Błaszczyk, E.; Rogula-Kozłowska, W.; Klejnowski, K.; Fulara, I.; Mielżyńska-Švach, D. Polycyclic aromatic hydrocarbons bound to outdoor and indoor airborne particles (PM2.5) and their mutagenicity and carcinogenicity in Silesian kindergartens, Poland. Air Qual. Atmos. Health 2017, 10, 389–400. [Google Scholar] [CrossRef] [PubMed]
- Rogula-Kopiec, P.; Rogula-Kozłowska, W.; Kozielska, B.; Sówka, I. PAH Concentrations Inside a Wood Processing Plant and the Indoor Effects of Outdoor Industrial Emissions. Pol. J. Environ. Stud. 2015, 24, 11–17. [Google Scholar] [CrossRef]
Figure 1.
Box plot of 24 h-mean values of PM10 and PM2.5 [μg/m3] in indoor and outdoor environments.
Figure 1.
Box plot of 24 h-mean values of PM10 and PM2.5 [μg/m3] in indoor and outdoor environments.
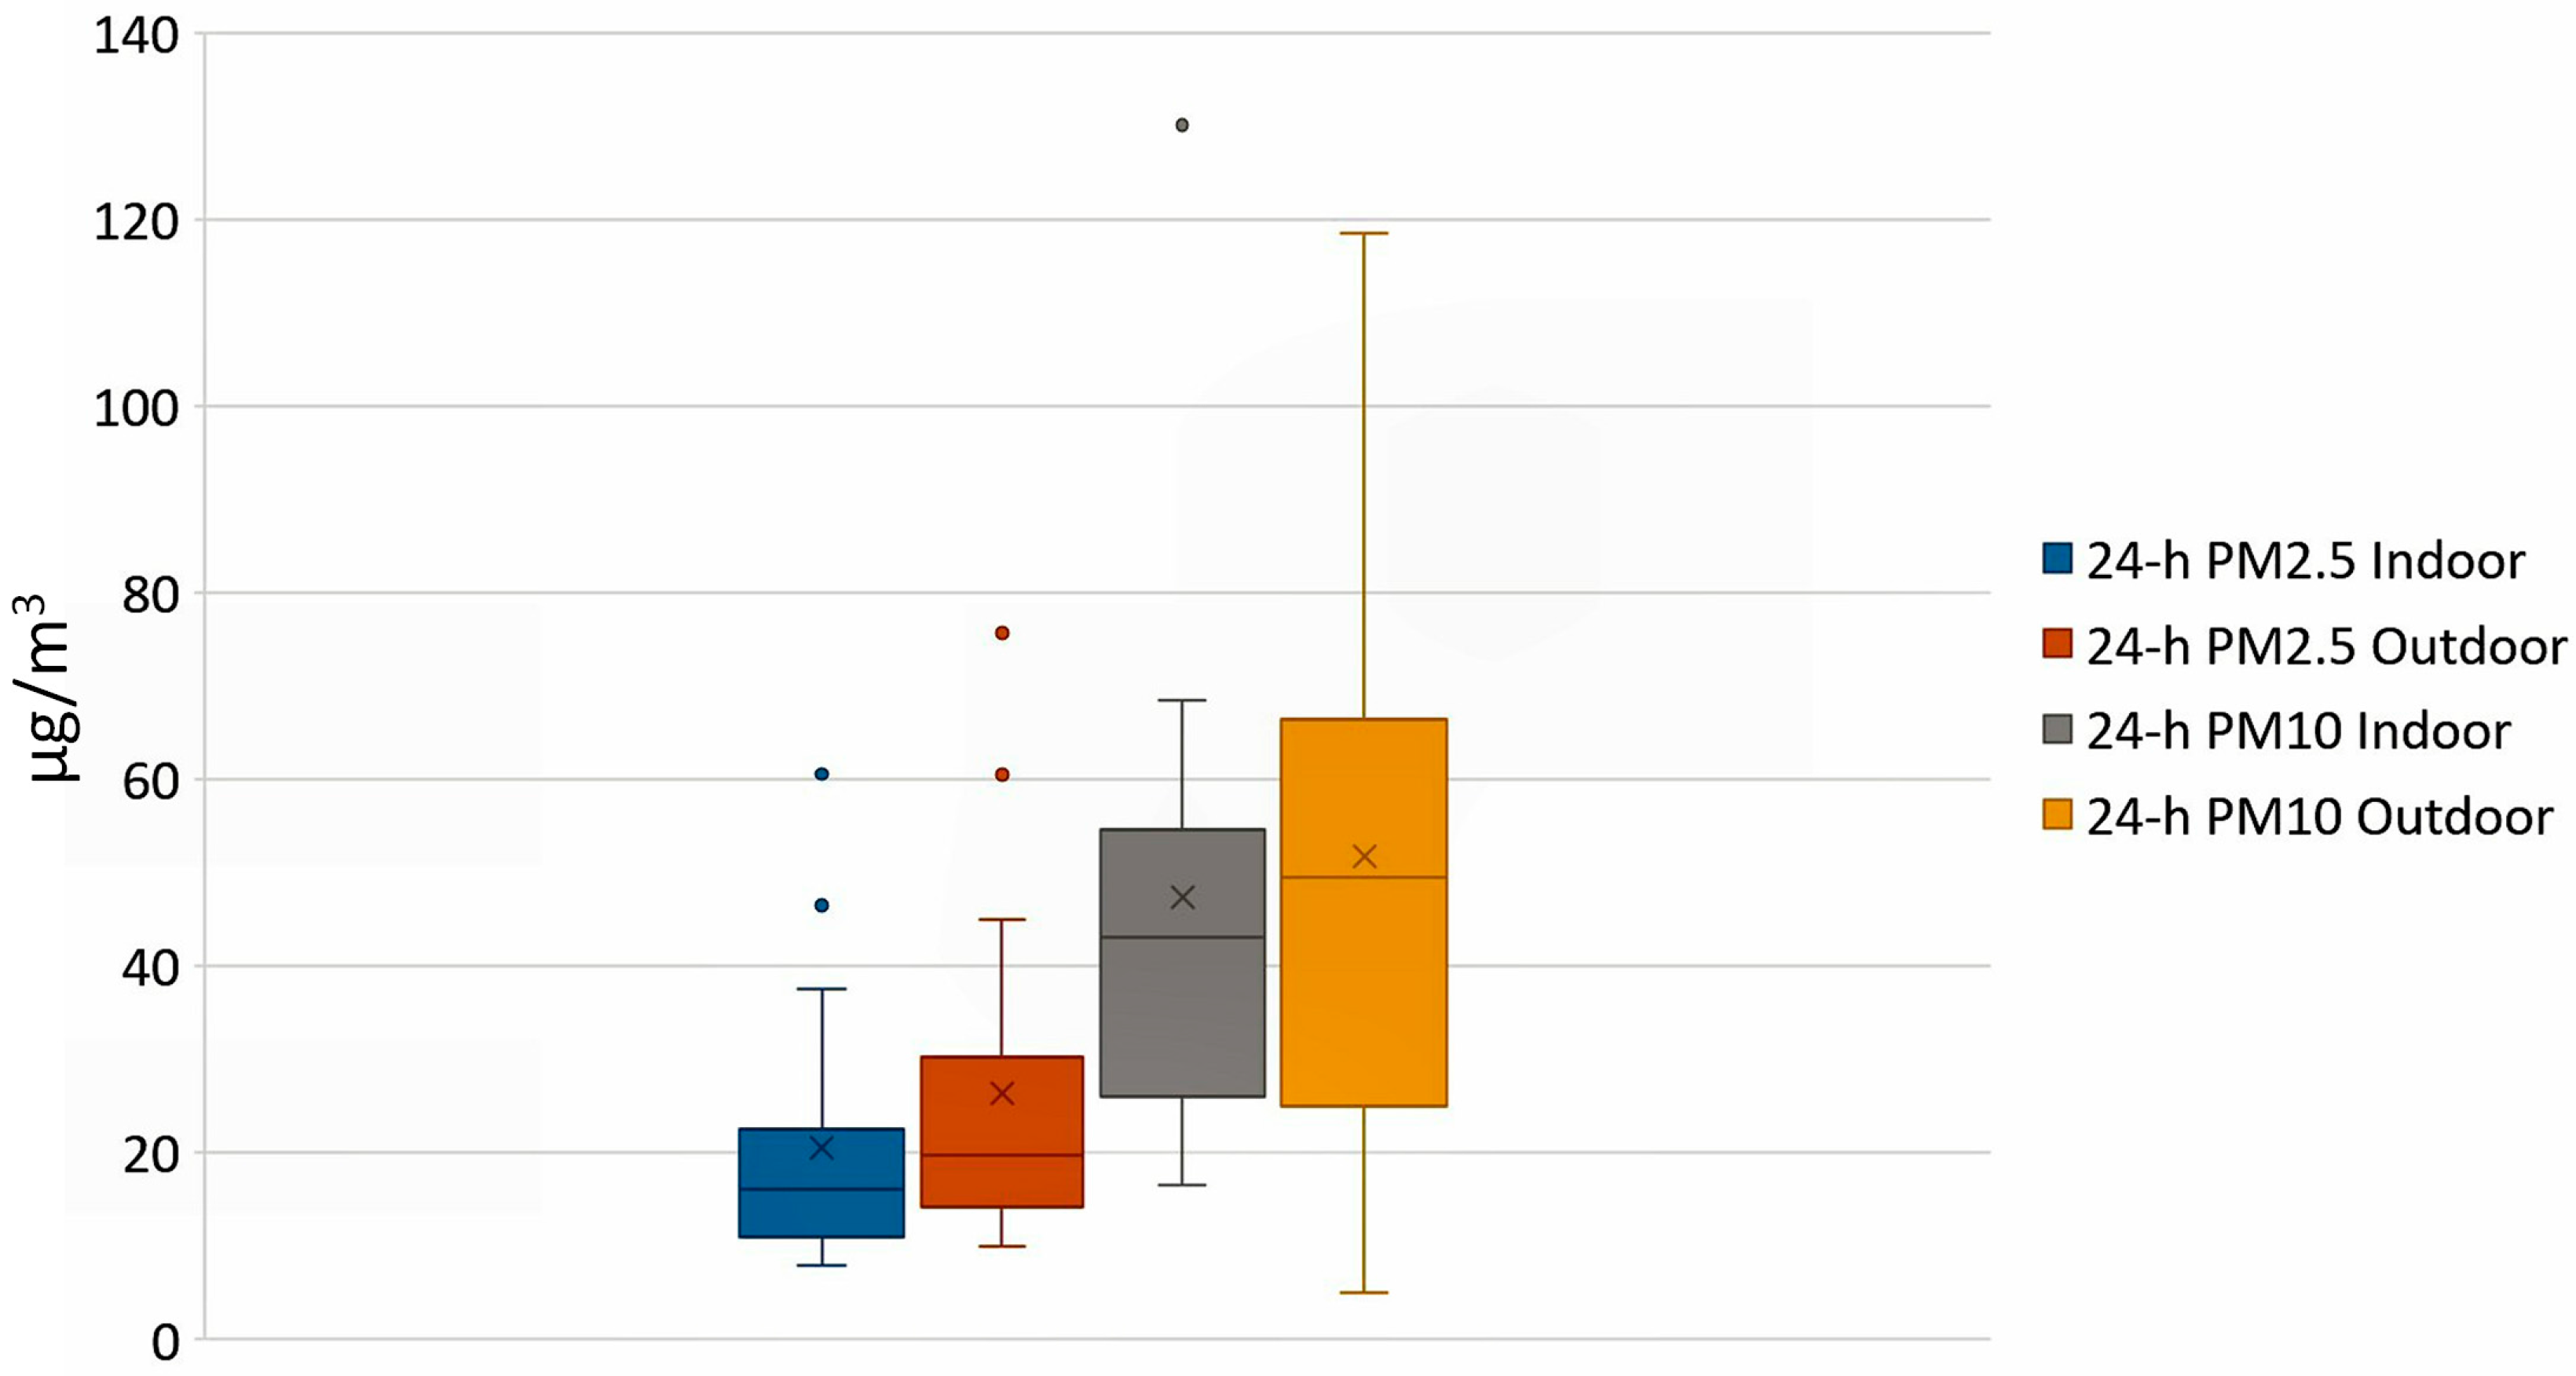
Figure 2.
The employed instrument technologies for the assessment of mass and particle number concentrations in the reviewed studies.
Figure 2.
The employed instrument technologies for the assessment of mass and particle number concentrations in the reviewed studies.
Figure 3.
Sampling intervals adopted in the reviewed studies.
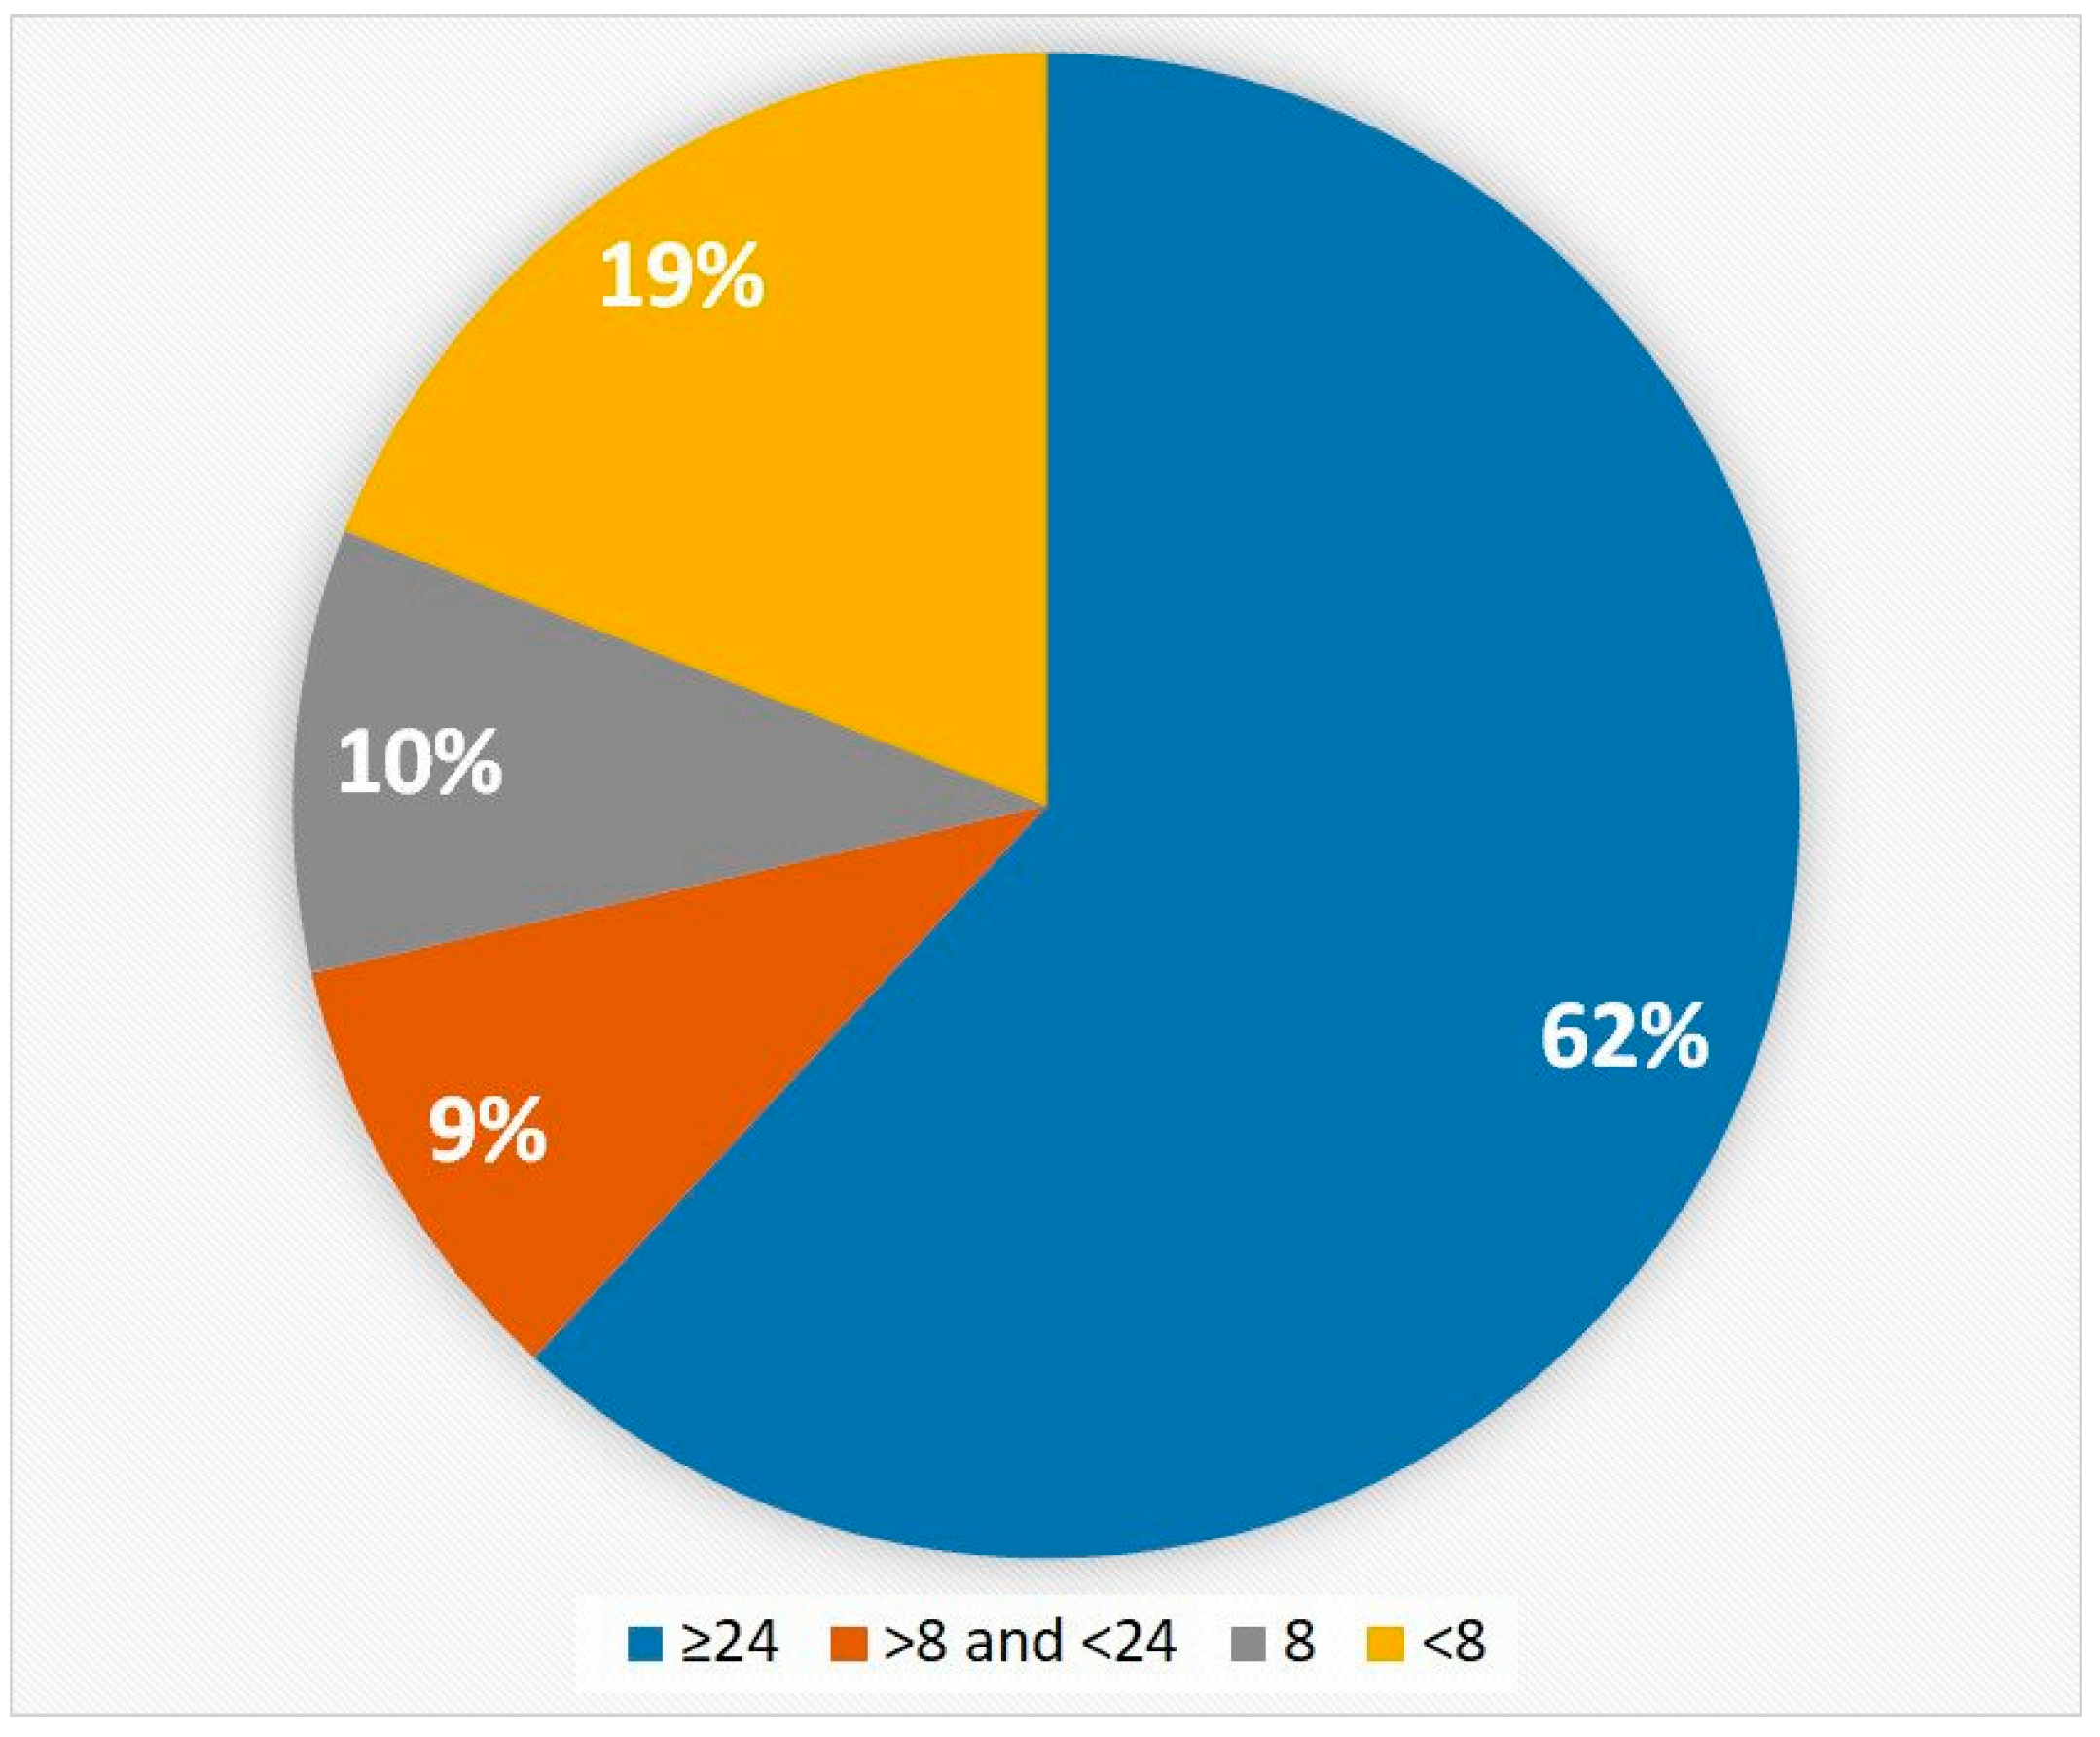
Figure 4.
Synthesis of the environment typologies assessed in the reviewed studies.
Figure 5.
Variability of mean, maximum and minimum I/O ratios in the reviewed papers.
© 2017 by the authors. Licensee MDPI, Basel, Switzerland. This article is an open access article distributed under the terms and conditions of the Creative Commons Attribution (CC BY) license (http://creativecommons.org/licenses/by/4.0/).
Share and Cite
MDPI and ACS Style
Bo, M.; Salizzoni, P.; Clerico, M.; Buccolieri, R. Assessment of Indoor-Outdoor Particulate Matter Air Pollution: A Review. Atmosphere 2017, 8, 136. https://doi.org/10.3390/atmos8080136
AMA Style
Bo M, Salizzoni P, Clerico M, Buccolieri R. Assessment of Indoor-Outdoor Particulate Matter Air Pollution: A Review. Atmosphere. 2017; 8(8):136. https://doi.org/10.3390/atmos8080136
Chicago/Turabian StyleBo, Matteo, Pietro Salizzoni, Marina Clerico, and Riccardo Buccolieri. 2017. "Assessment of Indoor-Outdoor Particulate Matter Air Pollution: A Review" Atmosphere 8, no. 8: 136. https://doi.org/10.3390/atmos8080136
Note that from the first issue of 2016, this journal uses article numbers instead of page numbers. See further details here.