Impacts of the Lower Stratosphere on the Development of Intense Tropical Cyclones


1
Department of Earth and Atmospheric Sciences, Indiana University, Bloomington, IN 47405, USA
2
Department of Meteorology, Pennsylvania State University, State College, PA 16802, USA
*
Author to whom correspondence should be addressed.
Atmosphere 2017, 8(7), 128; https://doi.org/10.3390/atmos8070128
Submission received: 12 June 2017
/
Revised: 6 July 2017
/
Accepted: 15 July 2017
/
Published: 19 July 2017
(This article belongs to the Special Issue Tropical Cyclones and Their Impacts)
Abstract
:This study examines potential impacts of the lower stratosphere on the development and the inner-core structure of intense tropical cyclones (TCs). By initializing the Hurricane Weather Research and Forecasting (HWRF) model with different monthly averaged sounding profiles in the Northwestern Pacific and the North Atlantic basins, it is shown that the lower stratosphere layer (LSL) can impose a noticeable influence on the TC structure and development via formation of an extra warm core near the tropopause along with a thin layer of inflow in the LSL at the high-intensity limit. Specifically, a lower tropopause level allows for higher TC intensity and a more distinct double warm core structure. Likewise, a weaker LSL stratification also corresponds to a warmer upper-level core and higher intensity. Of further significance is that the double warm core formation is more sensitive to tropopause variations in the Northwestern Pacific basin than those in the North Atlantic basin, given the same sea surface temperature. The results suggest that variations in tropopause level and LSL stratification could be an important factor that is responsible for the long-term variability of TC intensity.
1. Introduction
Tropical cyclones (TCs) are dynamical systems that are intrinsically governed by moist processes. A key feature that distinguishes TC dynamics from those of other strongly rotational systems is the presence of a warm core, which is defined as a positive temperature anomaly at the storm center with respect to the far-field environment. This warm core structure directly follows from the decrease of the tangential wind with height that determines the horizontal temperature gradient through the thermal wind relationship. The existence of the TC warm core can be indeed derived from balanced theory and has been well-documented in numerous modeling and observational studies (e.g., [1,2,3,4]).
From a thermodynamic perspective, a TC is akin to a heat engine that extracts energy from the sea surface, part of which is used to do work against frictional dissipation, with the remaining exhausted at the outflow levels around 13–14 km [5]. The efficiency of such energy conversion is proportional to the difference in sea surface temperature and outflow temperature, which dictates the maximum potential intensity (MPI) limit that a TC can attain in a given environmental condition. In Emanuel’s MPI framework, a TC warm core is nevertheless a prescribed structure, derived from a given radial profile of the saturated equivalent potential temperature at the top of the boundary layer. Therefore, the warm core is completely defined for a given absolute angular momentum (M) structure and outflow temperature.
While the MPI theory has been shown to provide a reasonable estimation of the upper bounds of TC potential intensity in different ocean basins, sufficiently intense TCs have been observed to develop a second, higher-level warm core (HWC) at 13–15 km that cannot be explained within the MPI framework. This double warm core (DWC) structure was in fact captured in a few early observational studies [6,7], and most recently in the inner core of Hurricane Patricia (2015) [8].
In contrast to rare inner-core observations at upper levels of intense TCs, the DWC structure was frequently seen in real-time TC forecasts in the Northwestern Pacific (WPAC) basin using the Hurricane Weather Research and Forecasting (HWRF) model [9,10]. Specifically, a distinct DWC structure during the peak intensity stage was observed in 9 of the 11 super typhoons in the Western Pacific basin as predicted by the HWRF model in 2012–2013 ([11]). In fact, this type of DWC structure is not limited to the HWRF model, but has been observed in many previous cloud-permitting numerical simulations of intense TCs regardless of models and configurations (e.g., [3,11,12,13,14]).
Despite much evidence of the DWC structure in recent observational and modeling studies, there is no clear consensus about the processes underlying its formation and implications. For example, a modeling study by [4] suggested that convective bursts in the inner-core region may be responsible for the development of the HWC. In a different study [15], the emergence of a HWC is related to efficiency of the warming in the upper level, which appeared to be determined by inertial stability in addition to the effect of convective bursts. Likewise, the formation of the HWC is attributed to the vertical advection of potential temperature within the eye region in [13], although no detailed explanation about why this vertical advection is more significant than that at the middle-level was provided. In contrast, the potential temperature budget and analyses of the Sawyer–Eliassen equation for idealized experiments by [14] showed that the warming could be attributed to cloud microphysics and adiabatic heating of subsiding lower stratosphere air. To explain the subsidence, they argued that the penetration of a sufficiently tall vortex into the lower stratosphere (a high static stability region) increases the Rossby deformation radius, thus allowing for an extension of warming inward to the eye.
Regardless of possible mechanisms underlying the formation of a HWC, the consistent level of the HWC near the tropopause apparently suggests that the TC inner-core should be affected by the lower stratosphere layer (LSL). By analyzing the DWC development at the high-intensity limit, a connection of the DWC with a thin layer of upper-level inflow in the lower stratosphere layer was recently proposed [11]. The persistence of this upper-level inflow in the LSL during the DWC development indicates that the lower stratosphere could have some realizable impacts on TC development after TCs reach their peak intensity. Specifically, a lower tropopause height or a weaker LSL stratification would allow a TC to interact more effectively with the lower stratosphere, thus forming an HWC on top of a pre-existing lower warm core. Along with the possible role in the formation of an HWC, variations in the lower stratosphere can also induce indirect changes to outflow temperature, thus affecting the MPI limit as well (e.g., [16,17]).
If speculation about the interaction of intense TCs and the lower stratosphere in [11,18] is plausible, one would expect that such an interaction should be differently manifested in different ocean basins where spatial variations of the tropopause level or the LSL stratification can control the DWC development. Such large-scale variations of the lower stratosphere can also help explain why the DWC has been observed more frequently in real-time TC forecasts in the WPAC as compared to the North Atlantic basin (NATL) basin despite using the same modeling system. Given this expectation, the objective of this study is to explore how the lower stratosphere variations between the NATL and the WPAC basins can affect the inner-core structure and development of intense TCs.
The rest of the paper is organized as follows. Section 2 discusses some implications of the HWC and its significance for the study of the TC development. Section 3 presents experimental designs and descriptions of initial sounding profiles constructed for the NATL and the WPAC basins. Main results are presented in Section 4 and Section 5, and concluding remarks are given in the final Section.
2. Implication of a High-Level Warm Core
The importance of a high-level warm core in TC development was stressed in a recent study by [19], which showed that a high-level warm core accounted for more than 50% of the central pressure deficit in Hurricane Wilma (2005). Such a contribution of a warm core to the surface pressure can be seen by directly integrating the hydrostatic equation from the surface to the top of the troposphere as follows:
where is the surface pressure, is a reference pressure at a reference level , R is the gas constant, is the mean temperature profile, and is the temperature perturbation with respect to . Since decreases with height in the troposphere, it is apparent that the ratio is larger for a higher warm core (assuming the same temperature perturbation ). Thus, the balanced surface pressure at the storm center would be lower, given a higher location of the warm core. From this perspective, the role of the upper warm core depends on the structure of tropospheric temperature, which justifies the effectiveness of the higher warm core in constraining the surface pressure via the hydrostatic equation.
An apparent question is as to whether the emergence of a high-level warm core helps strengthen the storm, or whether it is the strengthening of the storm that causes the formation of the high-level warm core. This question is difficult to answer from a diagnostic perspective, because there is no effective way to single out a mechanism in a loop and claim that such a mechanism is a cause or the result. From the energetic standpoint, the formation of an additional warm core can be, however, considered as a pathway that helps convert additional potential energy to kinetic energy. This can be seen from the energy budget equation for the total potential energy , and the total kinetic energy as follows (e.g., [20]):
where is the pressure deficit with respect to a far–field reference pressure , is the horizontal derivative operator associated with the horizontal wind components , is density, is the frictional forcing, are respectively the latent heating rate and sensible heat fluxes from the ocean surface, and P and K are the potential and kinetic energy compression rate associated with the compressibility of air volume (i.e., the density tendency term ).
Given these energy budget equations, a sequence of the impacts associated with the formation of a warm core can now be inferred by noting that the warm core first leads to the enhancement of at all levels as seen from the hydrostatic equation Equation (1). Such increase of results in a decrease of potential energy according to Equation (2) due to the increased negative advection of (the second term on the rhs of Equation (2)), while at the same time increases kinetic energy as seen from the first term on the right hand side of Equation (3). This energy conversion is most effective near the surface, where the pressure deficit is the largest. In this regard, the development of a warm core would facilitate the potential-kinetic energy conversion and enhance the positive feedback between the warm core development and the surface pressure, thus accounting for the further strengthening of the model vortex. The higher the warm core, the more effective this energy conversion will be as seen from Equation (1). We emphasize that this sequence by no mean dictates that the HWC is the “cause” of the intensification of a storm. It simply suggests that a HWC, once it appears, will promote the subsequent development of TCs beyond the traditional MPI framework.
It should be mentioned that the above sequence of energy conversion associated with development of a HWC is applicable to any warm core at any level, and does not necessarily imply a DWC structure for the energy conversion. Within the MPI framework, the existence of a single balanced warm core is natural, given the radial distribution of the absolute angular momentum profile and the boundary layer equivalent potential temperature [5]. How the balanced warm core is formed or how many warm cores a TC can support is not addressed in the MPI framework. As argued by [3], a balanced warm core should be around 5–7 km, thus leaving the HWC around 13–15 km unexplainable. In the study by [11], the development of the HWC in intense TCs is shown to be closely related to the existence of an upper-level inflow in the LSL. From this perspective, the lower stratosphere is not a simple passive rigid lid exchanging heat via radiative cooling, but it could actively interact with TCs and generate some response. The DWC structure with an upper warm core near the tropopause in this sense is a manifestation of a TC–LSL interaction. Regardless of the mechanisms underlying such a TC-LSL interaction, it is apparent that this interaction, if significant, should be differently realized in different oceanic basins where the lower stratosphere characteristics vary with space and time.
3. Experimental Designs
3.1. Model Configuration
Given the complex multi-scale nature of TCs, the full-physics HWRF model developed by the National Oceanic and Atmospheric Administration (NOAA/)National Center for Environmental Prediction (NCEP) is chosen in this study due to its parameterization and physical process schemes specific to TC processes [10,21,22]. To minimize external influences, an idealized configuration of the HWRF model was initialized with soundings obtained in the NATL and WPAC basins, while keeping all other model parameters fixed. For the sake of interest, the WPAC and the NATL basin are chosen in this study, because these basins have distinct TC characteristics with the highest annual count of intense storms (Category-4 or greater) in the WPAC basin. In fact, almost all of the super typhoon cases in the WPAC basin during 2012–2013 develop a DWC structure as obtained from HWRF’s real-time forecasts [11]. As such, this idealized design allows for a clean comparison between and within the two basins, making it possible to assess how the effects are in these basins.
Similar to the previous idealized HWRF configuration examined in [23,24], an initial weak vortex was implemented in the HWRF model with a maximum tangential wind at the surface of 20 m s−1 and a radius of maximum wind of 90 km in a quiescent environment. All experiments were carried out on an f-plane located at 12.5 N°. The sea surface temperature (SST) was held at a constant 302 K. Unlike the model designs in [25,26], both the vertical and horizontal resolutions in this study were much finer including 61 vertical levels with the highest being 1 mb, and nested domains at 8.1-km, 2.7-km, and 900-m horizontal resolutions. The 900-m resolution in the central domain is used to better capture small-scale features associated with DWC formation and better resolve the DWC structural features. As shown in previous studies (e.g., [11,14,19,27]), DWCs appear in the TC eye with a typical radius of 10–20 km, so high-resolution simulations are necessary to capture the detailed formation of the DWC structure in the vortex core.
Standard model physics schemes used in all experiments included the NCEP Global Forecasting System (GFS) planetary boundary layer (PBL) based on observational findings [21], improved Geophysical Fluid Dynamics Laboratory (GFDL) surface physics, improved Ferrier microphysics, and implementation of the new GFS shallow convective parameterization [28]. More details concerning other model features can be found in [24,25].
3.2. Construction of Initial Soundings
Because this study aims to investigate how the LSL can influence intensity and development of intense TCs in different basins, it is important first to construct a set of soundings that could sample the characteristics of the environment that TCs are embedded in. This is done by using the NCEP Final Global Analysis (FNL) data to obtain domain-averaged temperature and relative humidity (RH) profiles for each ocean basin. The FNL data are reanalyzed every six hours with continuous ingestion of observational data from different sources for analyses, and so this data to some extent represents well large-scale environments.
With the high annual TC activities during the period from June to September, the month of August in the year 2013 was chosen to maximize the favorable conditions for TC development. Considering favorable conditions for TC development, it should be noted that global mean tropopause height is also lowest in August on average [29], making this month potentially the most interesting for this study. Indeed, eight TCs including the Super-Typhoon Utor (2013) were observed in the WPAC basin during August 2013, whereas none were observed in NATL. This difference highlights the contrast between the two basins during August 2013, thus allowing for clear distinction between the two basins.
In the first set of control experiments (CTL), the domains needed to compute the mean sounding in the WPAC and NATL basins were defined as shown in Table 1 (cf. Figure 1 for visualization of the domains). Similar to [30], these domains were chosen because our main focus here is on the effects of the large-scale conditions on mature storms rather than on the TC track climatology. Due to requirements of the HWRF model’s sounding input, all mean soundings were interpolated to different upper-level pressure levels than those given in the FNL data. Specifically, we increased the number of levels from 26 in the default FNL data to 30 levels with 3 more additional levels above 100 hPa to match the format required by HWRF, using linear interpolation with the natural logarithm of pressure as an independent variable.
In an attempt to further separate the moisture effects from those associated with the temperature structure change due to variations in the tropopause height, two additional experiments were run in which the RH profiles in the two basins were exchanged while maintaining the same temperature profiles such that the roles of the RH and temperature profiles can be isolated. This switching of the RH profiles between the WPAC and the NATL basins leads to a total of four experiments in this set of control experiments.
While a fixed SST value of 302 K in the CTL experiments appears to be inconsistent with the input soundings from the WPAC and the NATL basins, our sensitivity experiments with SST ranging from 300 K to 305 K reveal however that the lower troposphere could rapidly adjust to the imposed SST after just 18–20 h into integration and subsequently become steady during the rest of the model integration (see Appendix A). This adjustment is in fact consistent with SST sensitivity experiments in ([12], hereinafter RE), in which RE set the initial temperature of the lowest model level equal to a prescribed SST along with a relative humidity of 80%, and integrated their model until a model-neutral sounding is attained. Given our model integration of 5 days in all experiments, the rapid adjustment of the lower tropospheric levels to the prescribed SST thus allows for a consistent large-scale atmospheric structure before its impacts on the TC development can be realized, particularly after the model storm approaches its MPI limit near the end of the model simulation.
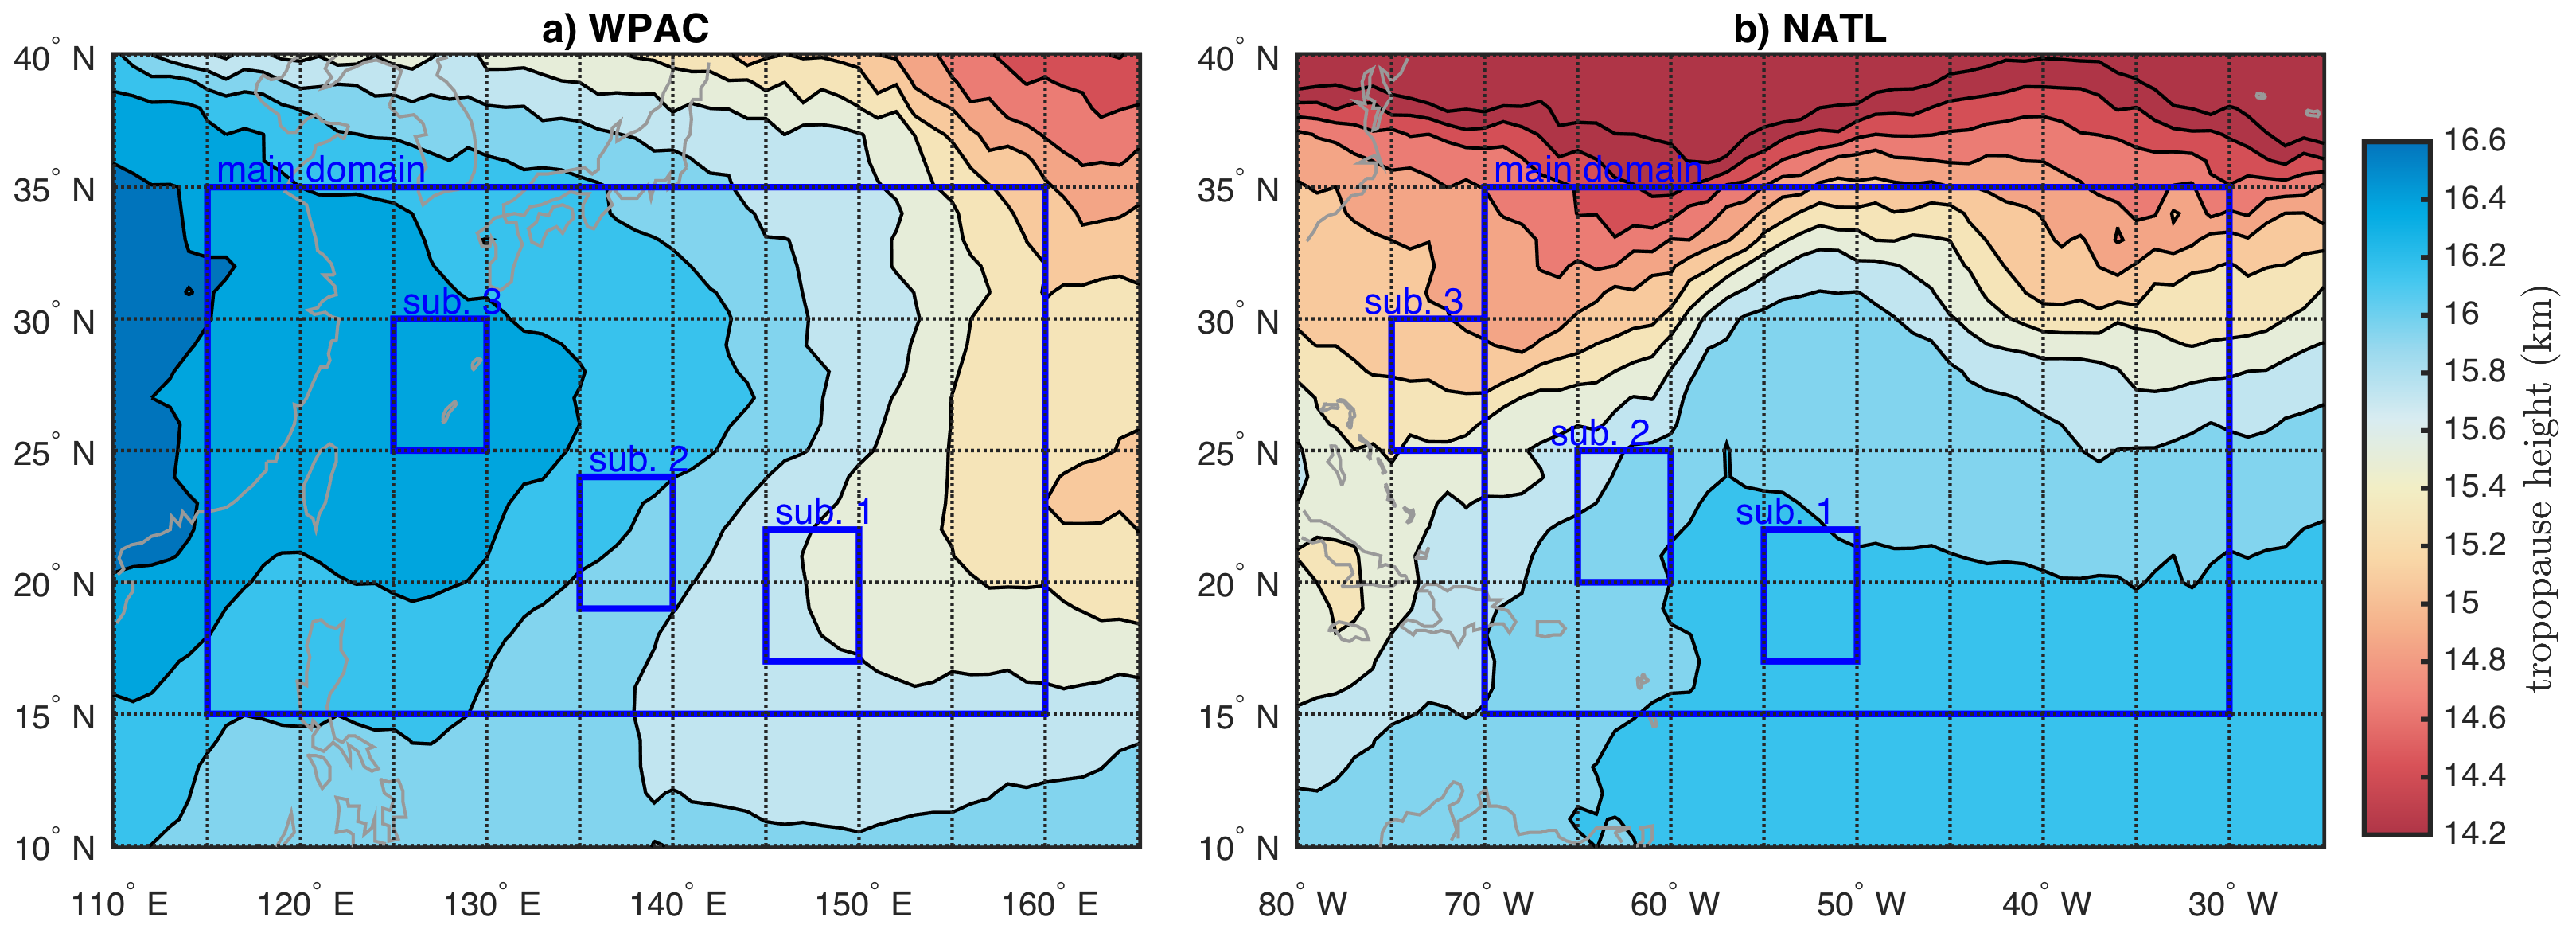
In the second set of experiments, three sensitivity experiments for each ocean basin were carried out with the same moisture structure as in the CTL experiments but with different temperature vertical profiles, which are obtained from the averaged sounding in three subdomains. This set of subdomain experiments with a fixed RH profile is to illustrate how the variations of the tropopause height in each basin can modulate the TC intensity and development. The spatial variation of the tropopause height across the ocean basin allows a natural design of these sensitivity experiments. Specifically, one notices from Figure 1 that the tropopause level in the NATL basin decreases along the southeast–northwest direction, which is roughly along the TC main trajectories in this area. In contrast, the tropopause level increases along the main direction of TC motion (i.e., the southeast–northwest direction) in the WPAC basin.
Given the tropopause distribution as shown in Figure 1, one can construct different temperature profiles by simply selecting different subdomains of 5° × 5° along the main direction of TC movement. By taking an average of the vertical temperature profile in each subdomain while keeping the RH profile fixed as in the CTL experiment, we obtain a set of initial soundings that could reflect the variation of the tropopause height while at the same time minimize the potentially confounding effects of RH variation among subdomains. With the tropopause level changes among the subdomains, these sensitivity experiments will highlight the role of tropopause height variation on TC development. Details of all subdomain bounds are given in Table 2.
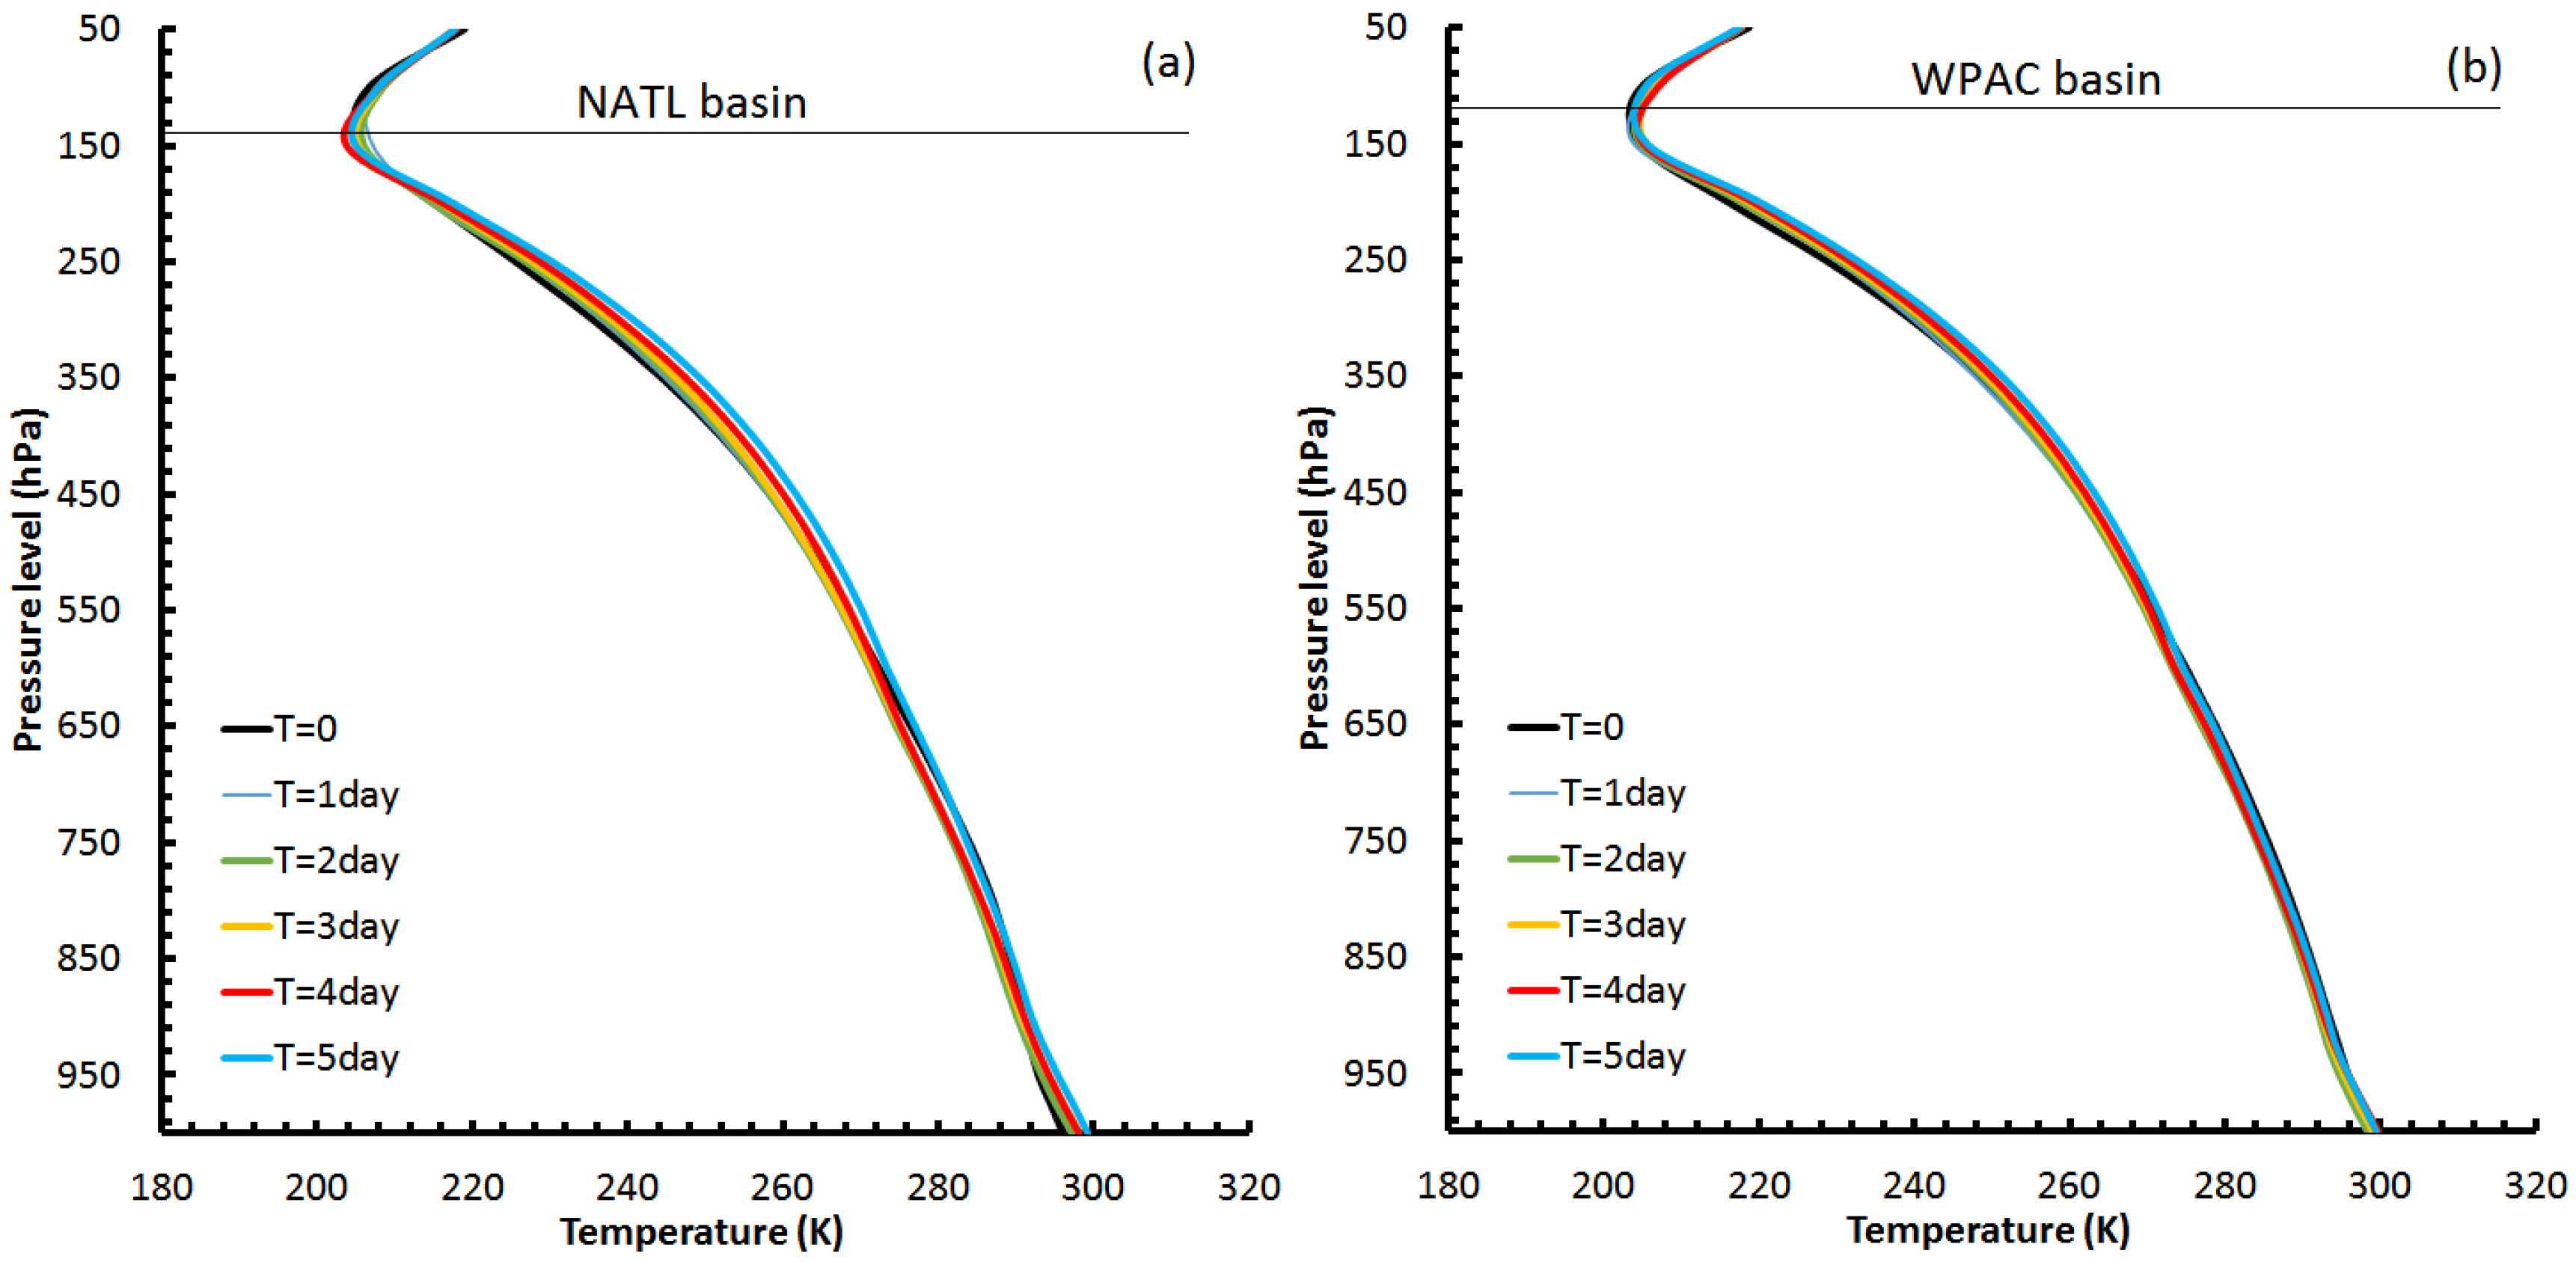
An apparent question regarding the above experiment design is whether the initial sounding could be maintained and truly represent the state of the atmosphere at the mature stage. This is an important issue to address, because any strong variation of the tropospheric structure over time will erase the initially imposed sounding. While TCs undoubtedly modify the ambient environment surrounding the storm location, it turns out that the initial sounding structure does indeed put a strong constraint on the mature state of a TC as dictated by Emanuel’s MPI framework [31,32]. In fact, many previous modeling studies have demonstrated the important and consistent impacts of initial sounding to the development of TCs [12,33,34].
To confirm the impacts of initial soundings during the course of TC development, Figure 2 shows the evolution of the environmental temperature profiles for the NATL-CTL and WPAC-CTL, which are computed as an area average of temperature within a radius of 500 km from the model vortex center. As seen in Figure 2, the mean vertical structure of the tropospheric temperature is well preserved during the entire 5-day simulation, with the tropopause level staying at roughly ∼145 hPa in the NATL basin and ∼120 hPa in the WPAC basin (see also Figure A1 in the Appendix for similar behaviors in the SST sensitivity experiments). This consistency of the environmental temperature structure during the course of the simulation indicates the importance of the initial soundings in governing TC development as expected.
4. Results
4.1. Control Simulations
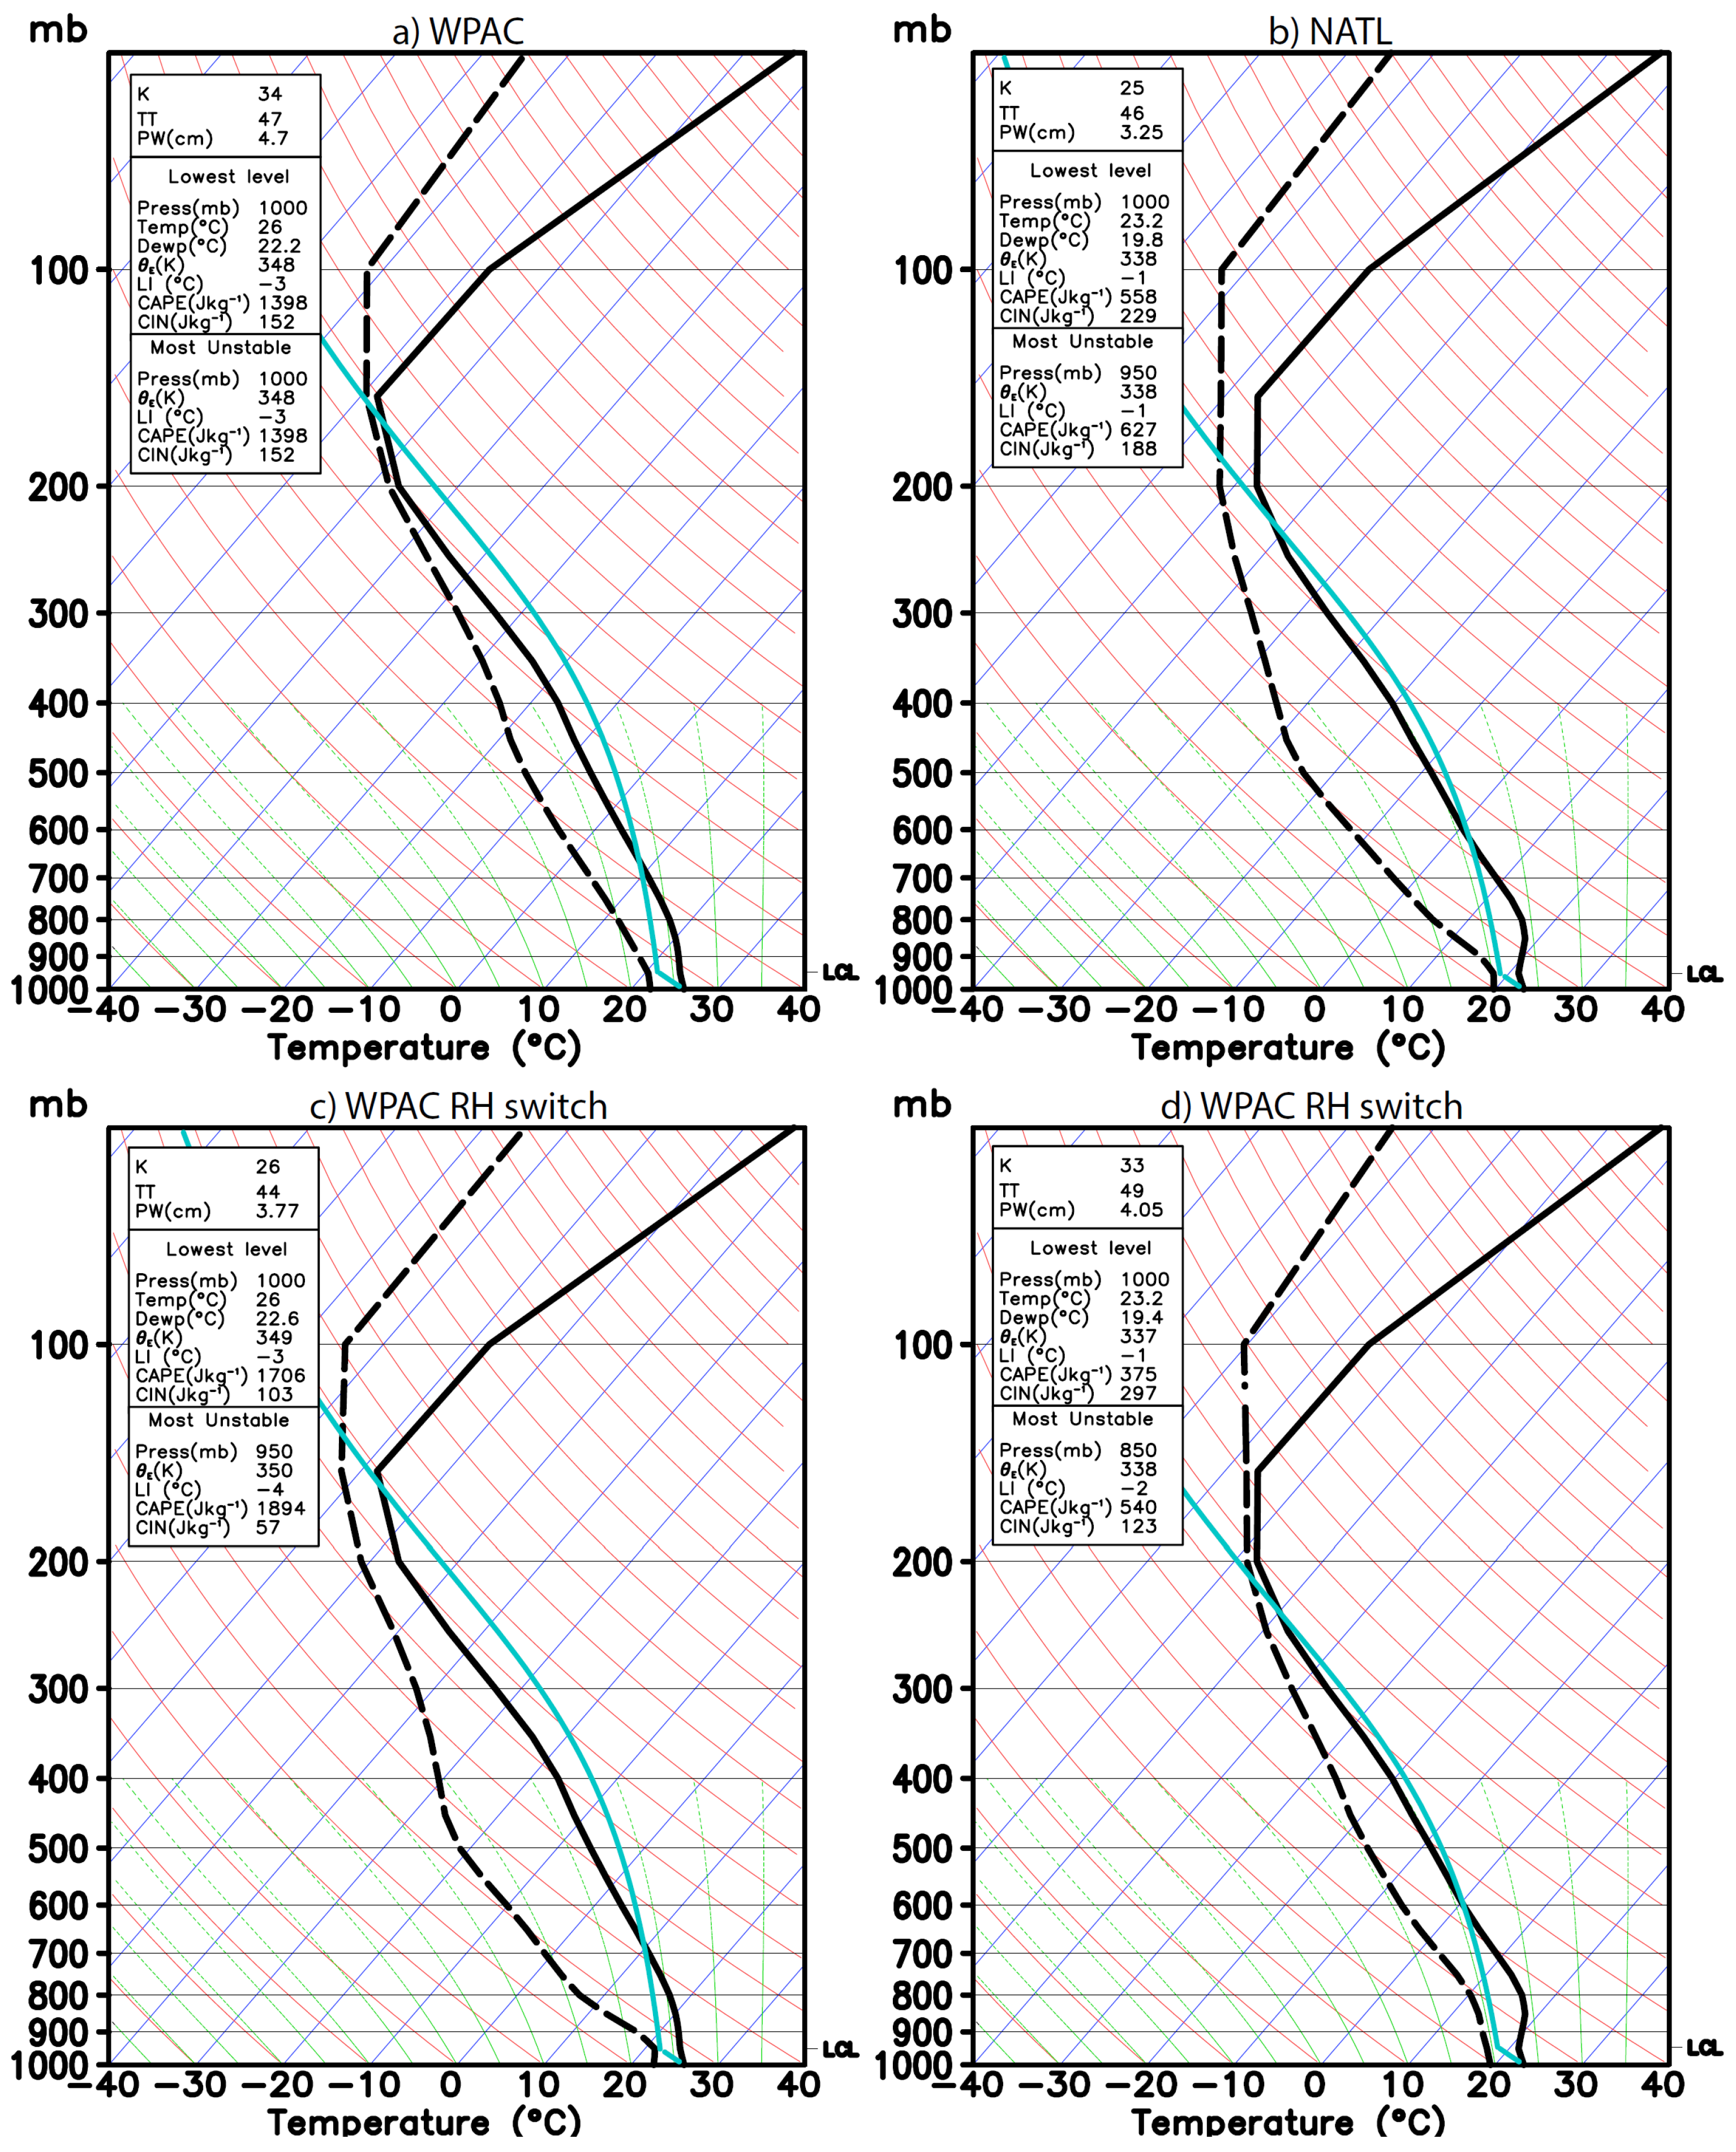
To first have a broad picture of the difference in the initial environmental conditions in the CTL experiments between the two basins, Figure 3 shows the initial soundings used to initialize the HWRF model in the NATL and WPAC basins. Consistent with the large-scale characteristics of the troposphere, the WPAC profile has a generally higher tropopause and more tropospheric moisture compared to the NATL sounding. A simple evaluation of the tropopause height, using the tropopause definition as a layer in which the temperature is minimum and the temperature gradient is less than 1 K km−1, indicates that the tropopause in the WPAC basin is located around the 120–130 hPa level (Figure 3a), while it is roughly at 140–150 hPa in the NATL basin (Figure 3b). Likewise, the difference in the relative humidity is as large as 25% for much of the troposphere, indicating substantially more tropospheric moisture in the WPAC basin.
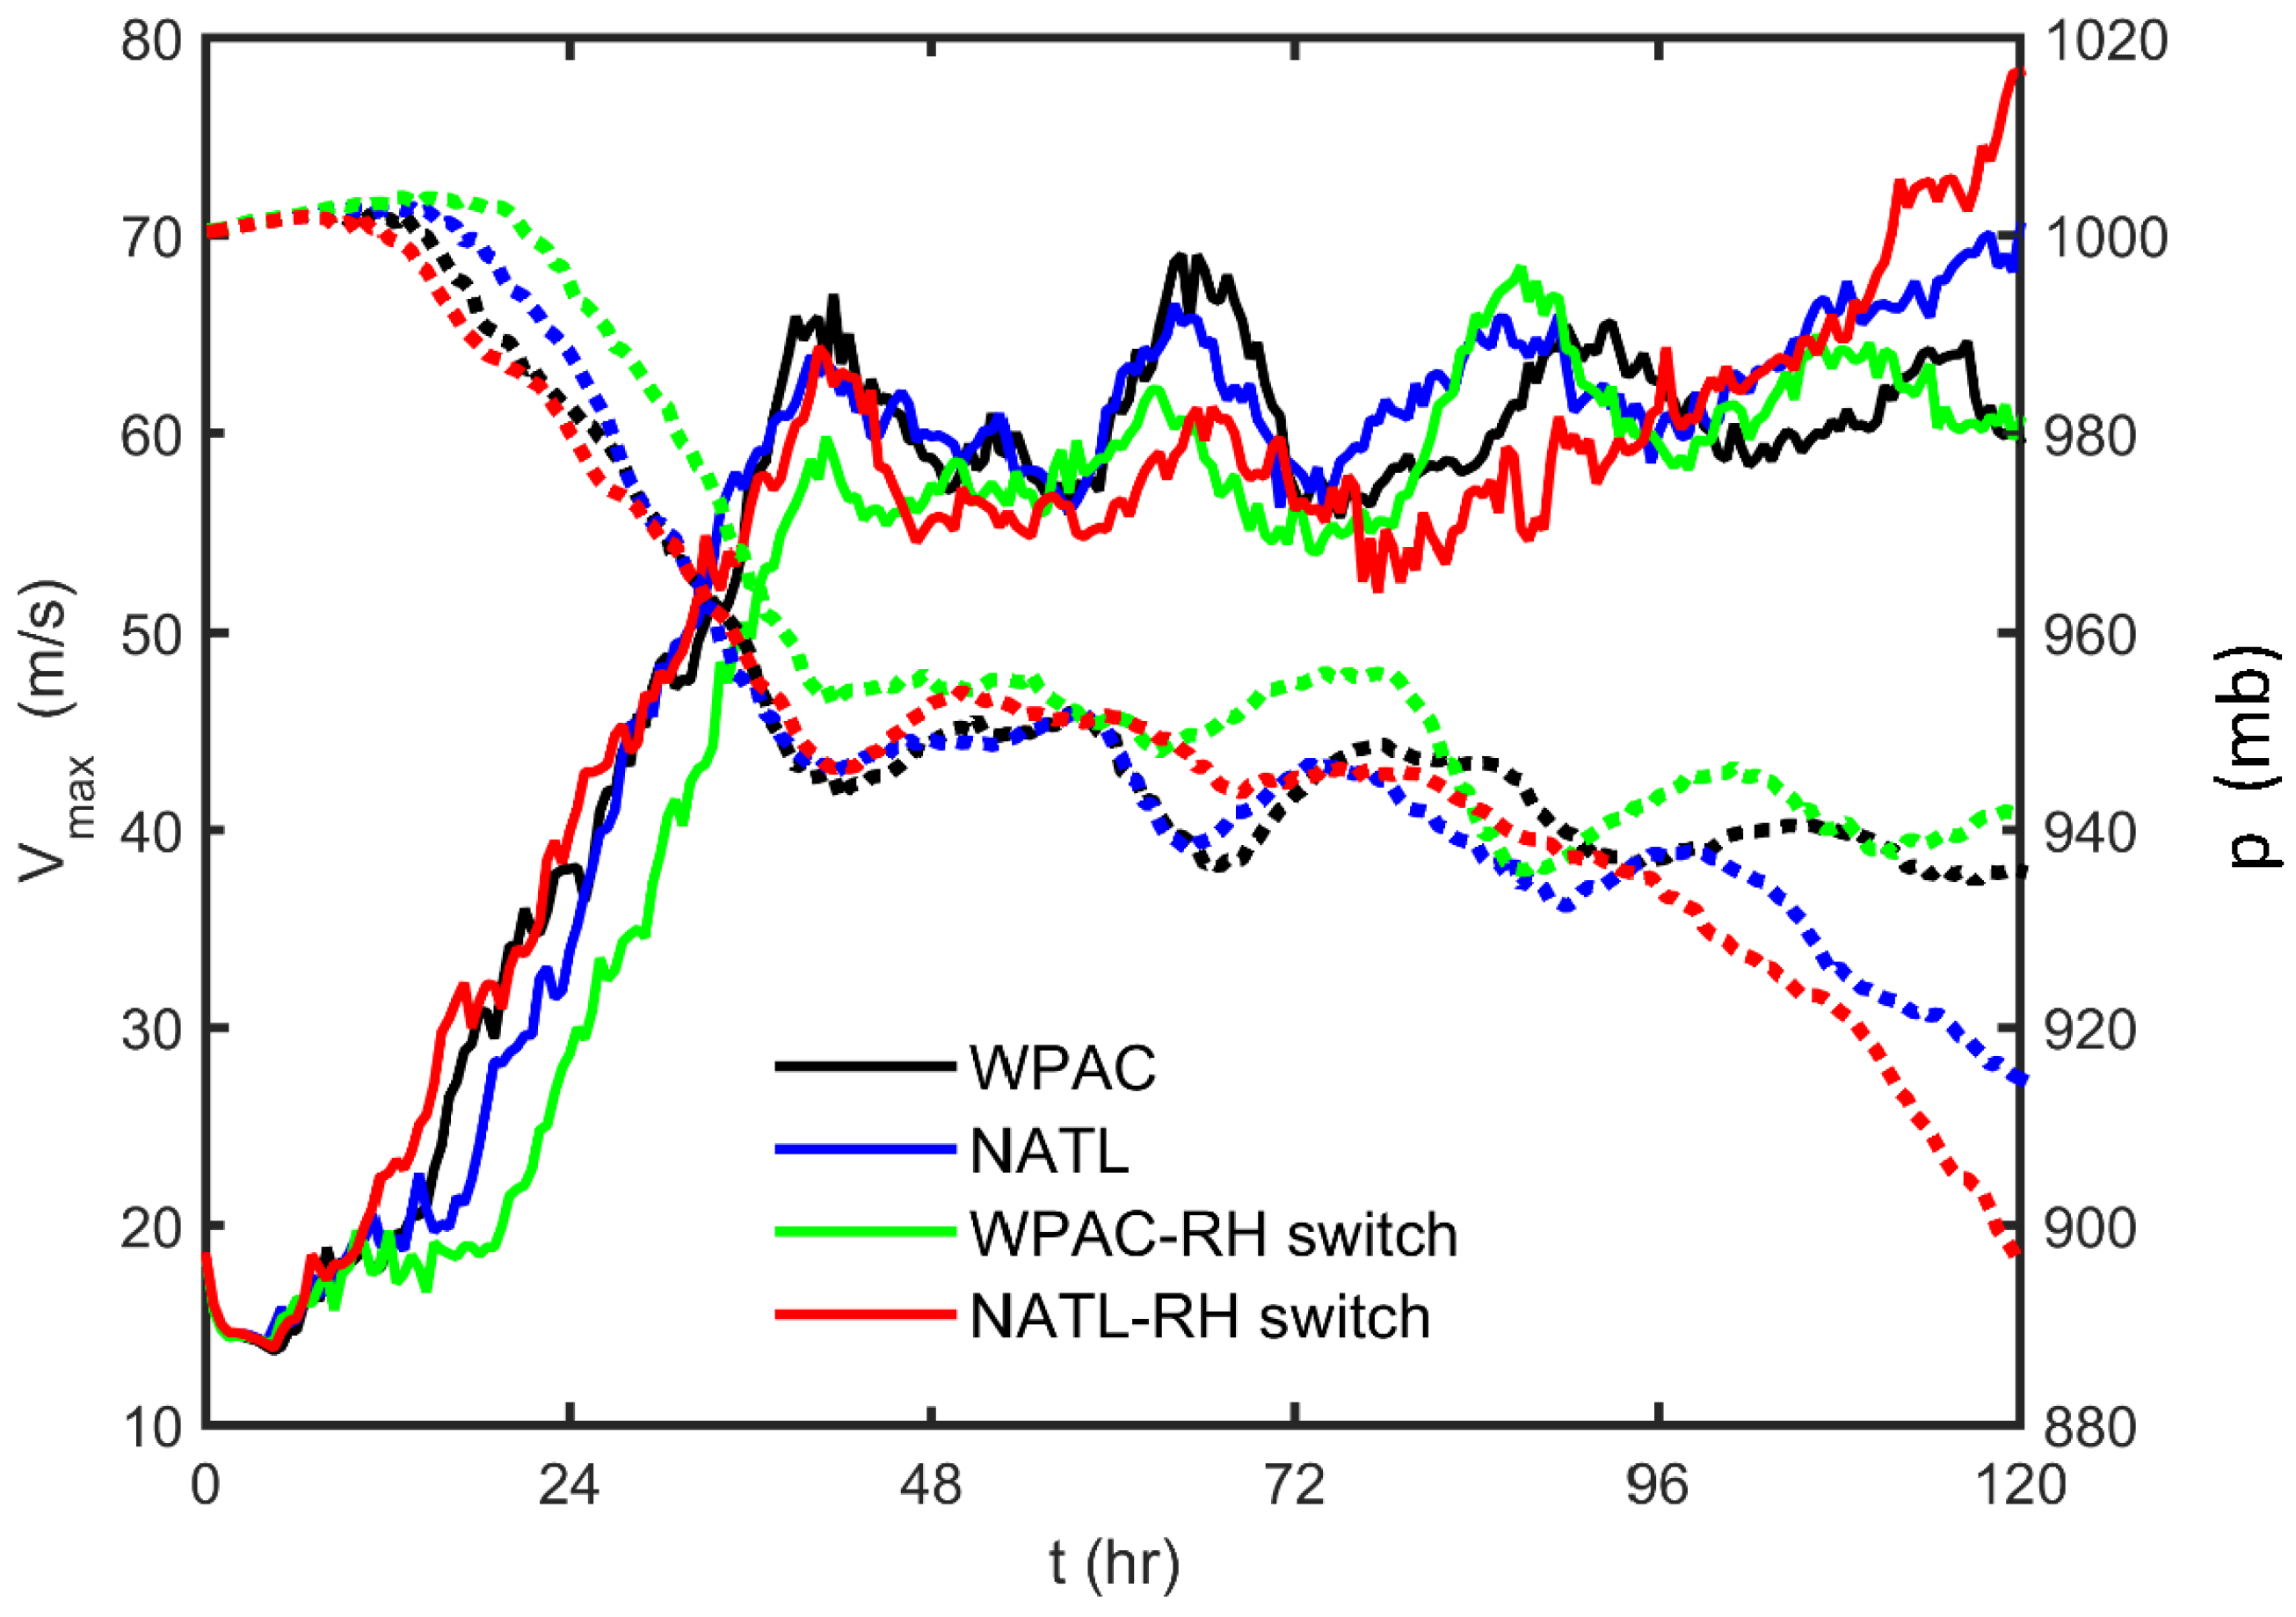
Figure 4 displays the time series of the maximum 10-m tangential wind () and the minimum central pressure () for the CTL experiments in both the WPAC and NATL basins, along with the two additional experiments in which the moisture profiles are switched. Unlike the expectation of a stronger storm in the WPAC basin from the climatological perspective, it is of interest to notice that both idealized TCs developing in the NATL basin attain significantly higher and lower after five days of simulation than those in the WPAC basin under the same SST condition. The strongest storm by a large margin appears to be that initialized with the temperature profile from NATL but with a more moist RH profile from the WPAC. Similarly, the WPAC storm using the NATL moisture profile is slightly less intense than the WPAC-CTL storm at 5 days into integration.
That the NATL temperature sounding results in stronger storms regardless of the moisture profiles indicates the overall more important role of the temperature structure in determining the maximum intensity limit. On the other hand, the similar role of the moisture profiles in changing the storm intensity between the CTL experiments and the RH-switching experiments in both the WPAC and the NATL basins suggests that the theoretical MPI limit may not fully explain the model-simulated maximum intensity limit. Specifically, the less mid-tropospheric moisture profile tends to delay the intensification as seen from both the RH-switched experiments in Figure 4. One can readily verify the relative role of the temperature and moisture profile to TC intensity within the MPI framework by using the theoretical MPI calculation based on the expression in [31] for four different soundings. While the theoretical MPI limits tend to overestimate the actual maximum intensity obtained from the HWRF model as shown in Table 3, it is apparent that the NATL’s temperature profile is more conducive to TC development than that in the WPAC, similar to the HWRF simulations (cf. Figure 4).
It is somewhat intriguing to see from Figure 4 and Table 3 that the NATL storms are consistently stronger than those in the WPAC basin in all the CTL experiments. This may appear difficult to understand at first, because it is well-known from the climatological standpoint that the WPAC basin tends to possess more intense TCs on average [27]. Such contradictory behaviors of the model storm in the CTL experiments are, nevertheless, understandable if one recalls that the SST is fixed at 302 K in all experiments. In practice, the SST in the NATL basin is on average 2–3 K cooler than that in the WPAC basin, which translates to significantly smaller enthalpy fluxes and results in a climatology of overall less counts of intense TCs in the NATL basin. Our sensitivity experiments with both the HWRF model and the theoretical MPI calculations confirm that the MPI limit depends crucially on the SST values (not shown). With a fixed SST value of 302 K, the above CTL experiments reveal however an interesting consequence that the tropospheric structure in the NATL basin during August 2013 turns out to be more conducive to the development of intense TCs, thus resulting in a stronger storm as seen in Figure 4.
It should be mentioned that the more favorable structure for TC development in the NATL basin contrasts with the fact that the 2012–2014 seasons were relatively less active in the NATL basin with very few major hurricanes, particularly in the 2014 season. This inactive season in the NATL basin reflects the fact that the TC development depends on other large-scale conditions such as dry air intrusion, vertical wind shear, SST variation, or the Sahara dust intrusion that the idealized configuration in this study could not capture.
Given the importance of the DWC structure in the development of intense TCs as discussed in [11], it is anticipated that the lower tropopause height in the NATL basin could be a factor determining its higher storm intensity through the enhanced DWC development. To examine how the DWC development is related to the more favorable tropopause condition with the NATL sounding, Figure 5 shows the Hovmöller diagram of the temperature anomaly at the storm center in the CTL experiments during the course of the 5-day integration. Here, the temperature anomaly is defined as the temperature difference between the vortex center and the far-field ambient environment similar to the definition used in [11]. The far-field ambient temperature in this study is defined as the area-averaged temperature within an annulus of 1000–2000 km radii.
As seen in Figure 5, the most prominent feature in the CTL experiments is the development of a DWC structure towards the end of the 5-day simulation, regardless of the moisture profile. Consistent with its strongest intensity, the NATL-CTL experiment with the WPAC moisture possesses a larger positive temperature anomaly at the end of the simulation, with the HWC temperature anomaly as large as 18 K (Figure 5b) as compared to 12 K in the WPAC-CTL experiment (Figure 5a). Use of the WPAC moisture profile produces even a larger impact in the NATL basin in terms of the magnitude of the upper warm anomaly, resulting in an HWC with a temperature anomaly ∼21 K (Figure 5d). In the WPAC, the moisture profile switch experiment appears to have less of an impact, and its influence is not apparent in the first 48 h. The DWC development seen in Figure 5 is consistent with the time series of the in Figure 4, suggesting that the later phase of intensification of the model storm from h to h is related to the interaction of the LSL with the TC inner core, at least in our CTL idealized configurations with a constant SST.
It is important to note that while the formation of an mid-level warm core is natural and persists in the 500–400 hPa layer throughout all stages of the TC development, the formation of an HWC is intermittent during the early phase of the storm development in all experiments. Similar to [11], the HWC in all four CTL experiments becomes most apparent only after the vortex intensity reaches 61 m s−1 with a well-defined eye. Additionally, the emergence of the HWC is separate from the mid-level warm core, and its formation precedes a second phase of intensification from h to h (cf. Figure 4) in all experiments. Such independent development of the HWC and the lower warm core around 5–6 km is not specific to the HWRF model or any experiments, but can be seen also in recent analyses of temperature anomalies by [14,15], suggesting that the HWC development is strongly associated with the late intensification of an already intense storm.
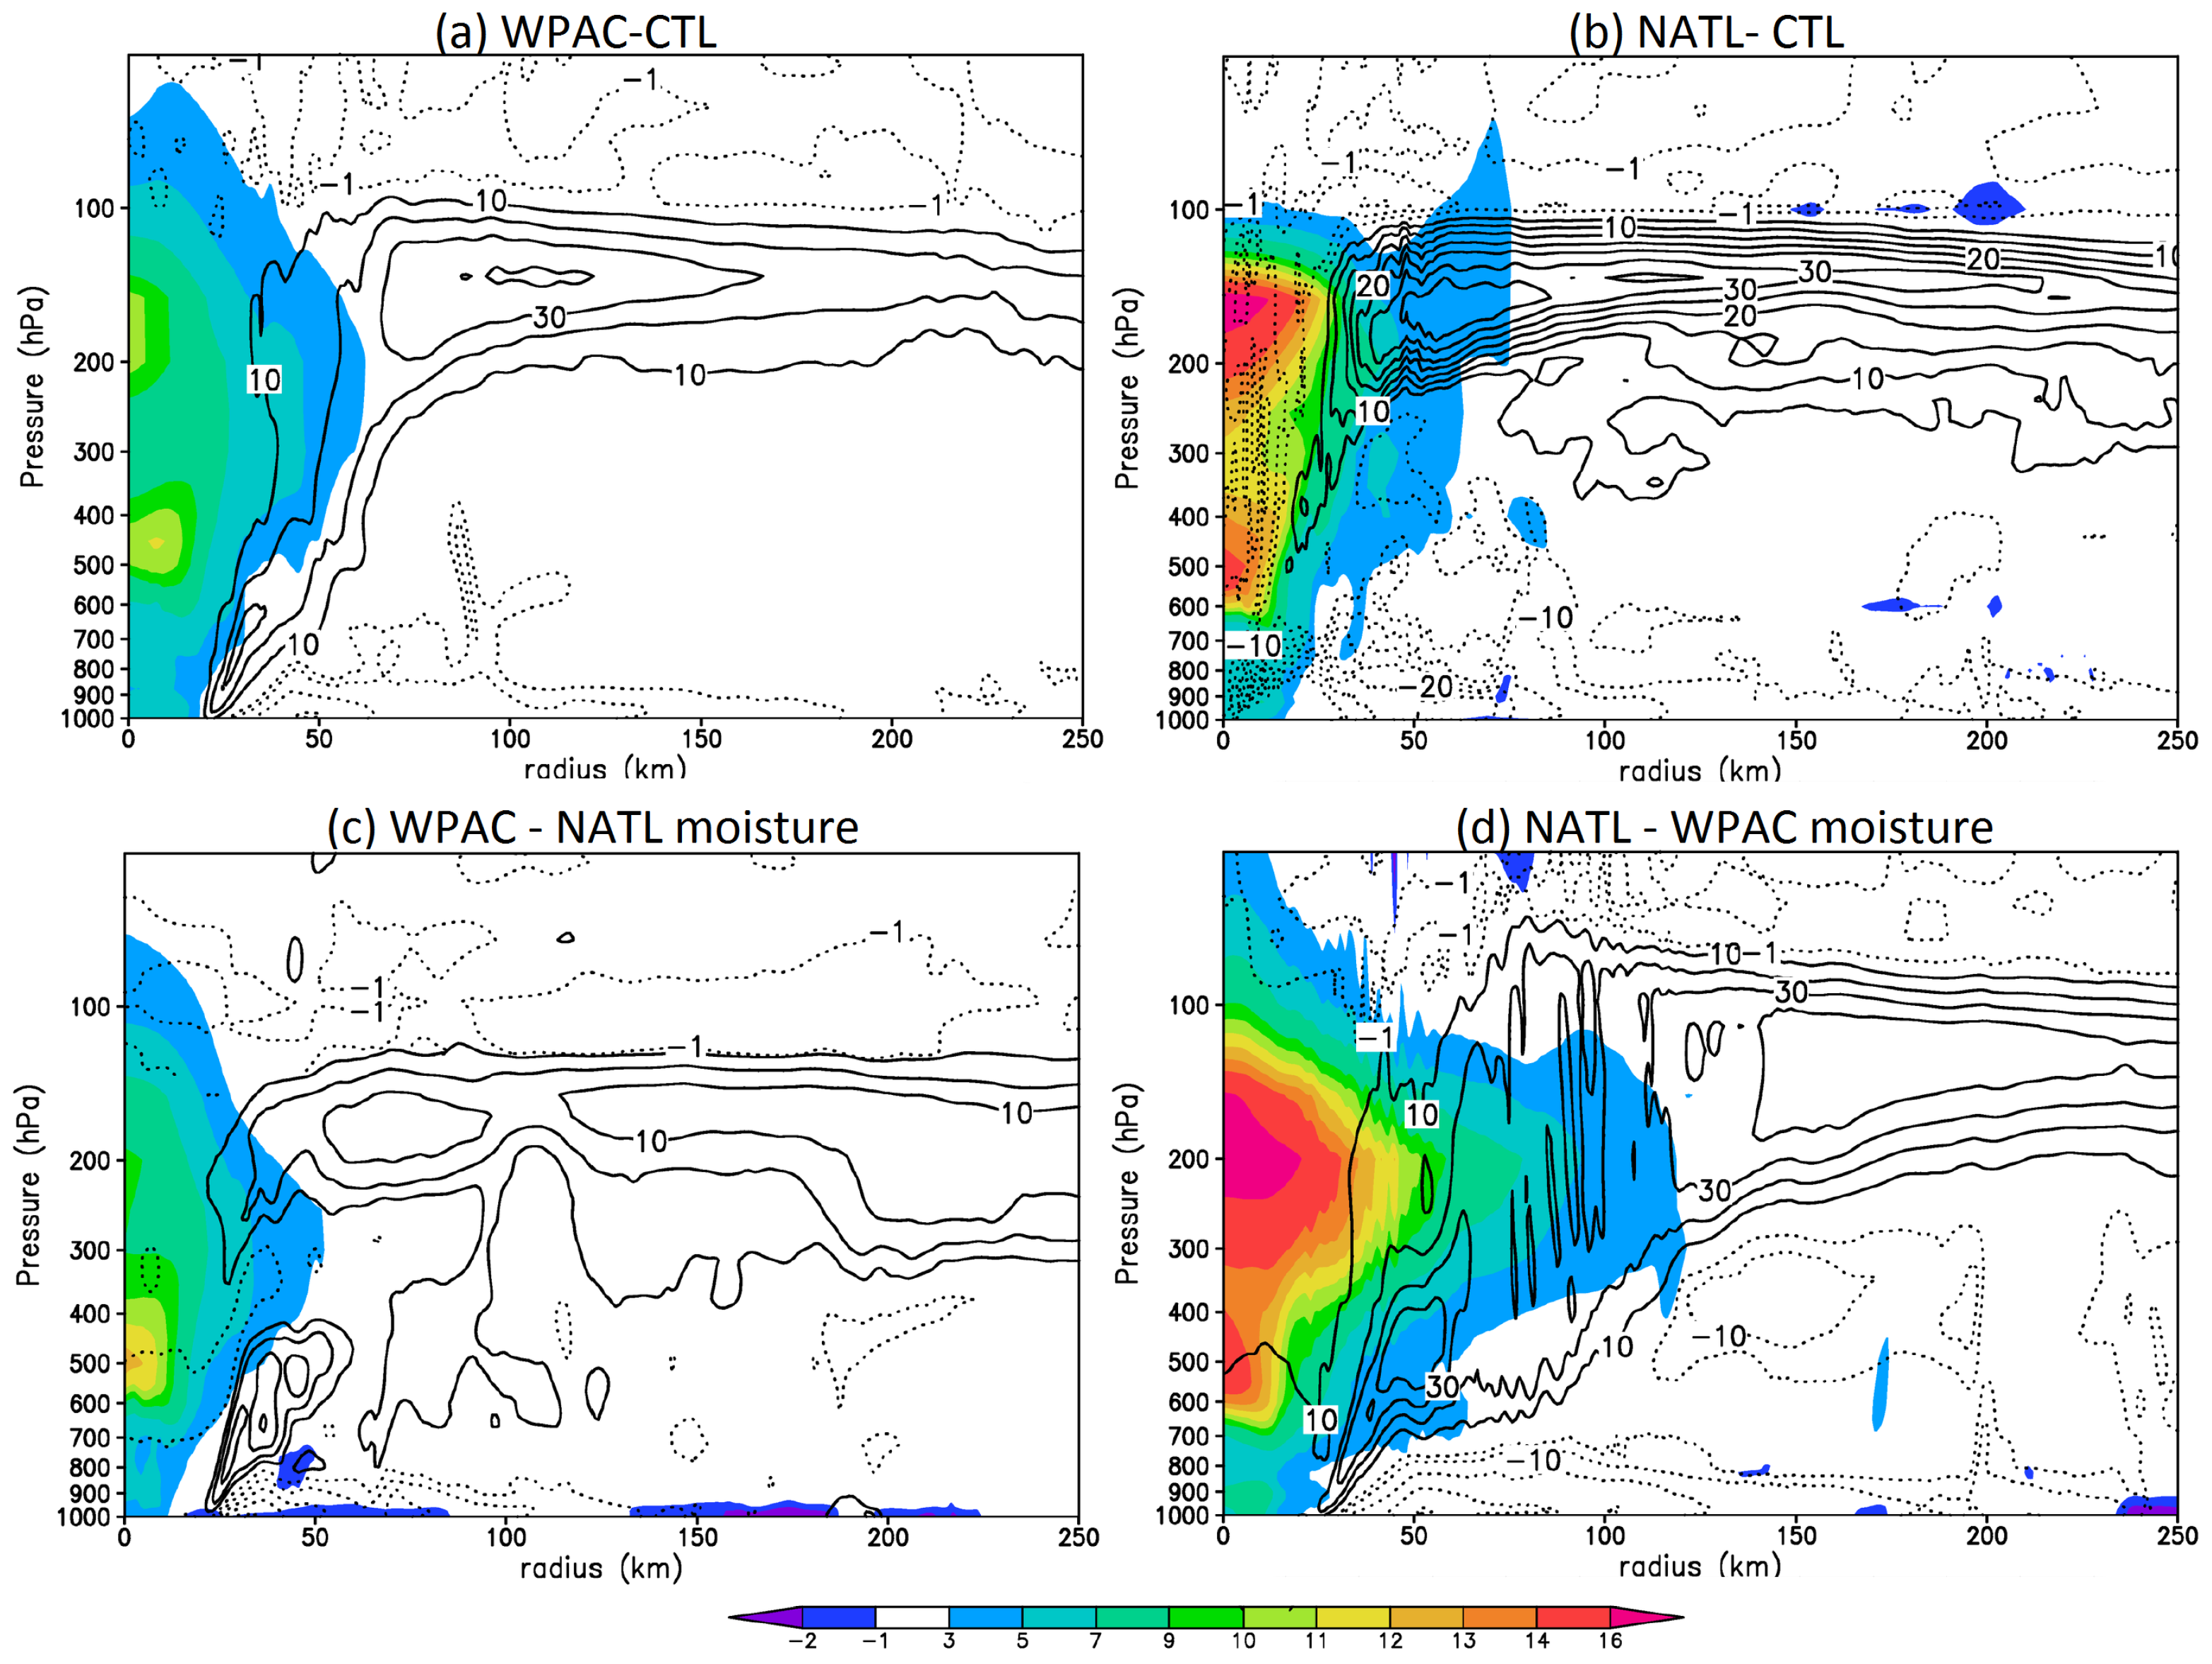
To further see the differences in the entire DWC structure among different experiments, Figure 6 shows a radius-height cross section of the temperature anomaly at the storm center valid at h at which the DWC is most distinct. In accordance with the interpretation of the Hovmöller diagrams, the HWC is well-defined and situated near the tropopause in all CTL experiments. Compared to the NATL experiments with a more dominant HWC (Figure 6b,d) and temperature anomalies reaching ∼14 K, the WPAC experiments capture a weaker HWC with the largest temperature anomaly of only ∼9 K. Except for the WPAC experiment with the NATL moisture profile that has the least signal of the HWC, the location of the HWC is always near the tropopause in all experiments, which is very similar to the recent observation of the warm core structure in Hurricane Patricia (2015) during the Office of Naval Research (ONR) Tropical Cyclone Intensity (TCI) field experiment reported by [8].
That the HWC is always located right below the tropopause indicates that its formation must have some connection with the lower stratosphere aloft. A recent study by [11] suggested that the development of the HWC could be connected to the existence of an upper-level inflow in the lower stratosphere layer. As discussed in [11], an upper-level inflow may emerge if there exits a sufficiently strong inward pressure gradient in the 100–70 hPa layer. Two possible mechanisms for the development of such an inward pressure gradient are radiative cooling at the cloud top in the outer-core region, and the returning inflow associated with overshooting convective rings in the eyewall region as disccused in [19].
To verify the existence of such an upper-level inflow in the CTL experiments, Figure 7 shows streamlines averaged in the lower stratosphere layer (i.e., 100–70 hPa), along with streamlines representing the outflow within 150–100 hPa layer valid at h. As seen in Figure 3, the 100–70 hPa layer is well within the lower stratosphere layer and can therefore represent well the upper-level inflow above the outflow level in both of the NATL and WPAC basins. One notices in Figure 3 a clear signal of a cold outer-core annulus from 200 km to 800 km (blue shaded area) along with the existence of the inflow in the LSL very similar to the results in [11]. The NATL experiment with the WPAC moisture profile (Figure 7d) most clearly exhibits the upper-level inflow in the lower stratosphere, showing streamlines in the LSL strongly converging toward the vortex center. Our analyses of the temperature budget show that such an upper-level inflow is responsible for a warm advection towards the storm center, thus related to the formation of the HWC as discussed in [11] (not shown).
The existence of an upper-level inflow above the outflow level as seen in Figure 6 and Figure 7 is noteworthy, because it indicates that the LSL is not a simple lid but could strongly interact and modify the structure of intense TCs. Our preliminary analysis of the HDSS dropsondes data for Hurricane Patricia (2015) during the Tropical-Cyclone Intensity field program appears to capture a similar reverse of the flow from outflow around 16.5 km to inflow near the 18-km level. That the HWRF model could capture this upper-level inflow along with the DWC structure consistently in all experiments thus provides strong evidence to support the dynamical role of the lower stratosphere in the development of TCs that is still elusive at present.
4.2. Sensitivity Experiments: WPAC Subdomains
While the CTL experiments could demonstrate the relative importance of the temperature profile as compared to the RH profile in determining the maximum intensity limit and the different inner-core structure between the NATL and the WPAC basins, a remaining question is how the influences of the LSL variations on the DWC development are realized in each basin. An implication obtained from the above CTL experiments in the WPAC and NATL basins is that the lower tropopause height in the NATL basin tends to be more favorable for the DWC development and results in a stronger storm than that in the WPAC basin under the same SST condition.
To examine the impacts of tropopause level on the TC inner-core structure in each basin, three subdomains are chosen along the climatological TC tracks in the WPAC basin such that subdomain 1 has the lowest tropopause and subdomain 3 the highest tropopause level as discussed in Section 3.2 (cf. Figure 1). With a fixed RH profile in all of these subdomain experiments, it is expected from the CTL experiments that the lower tropopause height would be more favorable for strong storms, i.e., a model vortex developed in subdomain 1 (hereinafter WS1) will be stronger at its peak intensity as compared to those in the subdomain 2 (WS2) and subdomain 3 (WS3) experiments.
Figure 8 shows the resulting time series for the three WPAC subdomain experiments, along with the comparison of the three initial temperature profiles in the subdomains 1–3. Similar to the results obtained from the CTL experiments, it is of significance to notice a correspondence between the increase in the tropopause height and a general decrease in storm intensity among the three subdomains. The difference in is generally insignificant during the intensification stage, but more apparent at the end of the simulations during which the interaction between the model vortex and the lower stratosphere appears to be most effective. Specifically, the in the WS1 experiment reaches as high as 68 m s−1 at days, whereas the WS3 storm reaches about 61 m s−1. The difference in storm intensity is realized even more in terms of , which shows a clear separation among the three experiments after 5 days into integration, with WS1 having the lowest minimum central pressure and WS3 the highest, and WS2 in between. Although does not show as a clear signal as , these sensitivity experiments reiterate the impacts of the tropopause height on the TC development similar to those obtained from the CTL experiments.
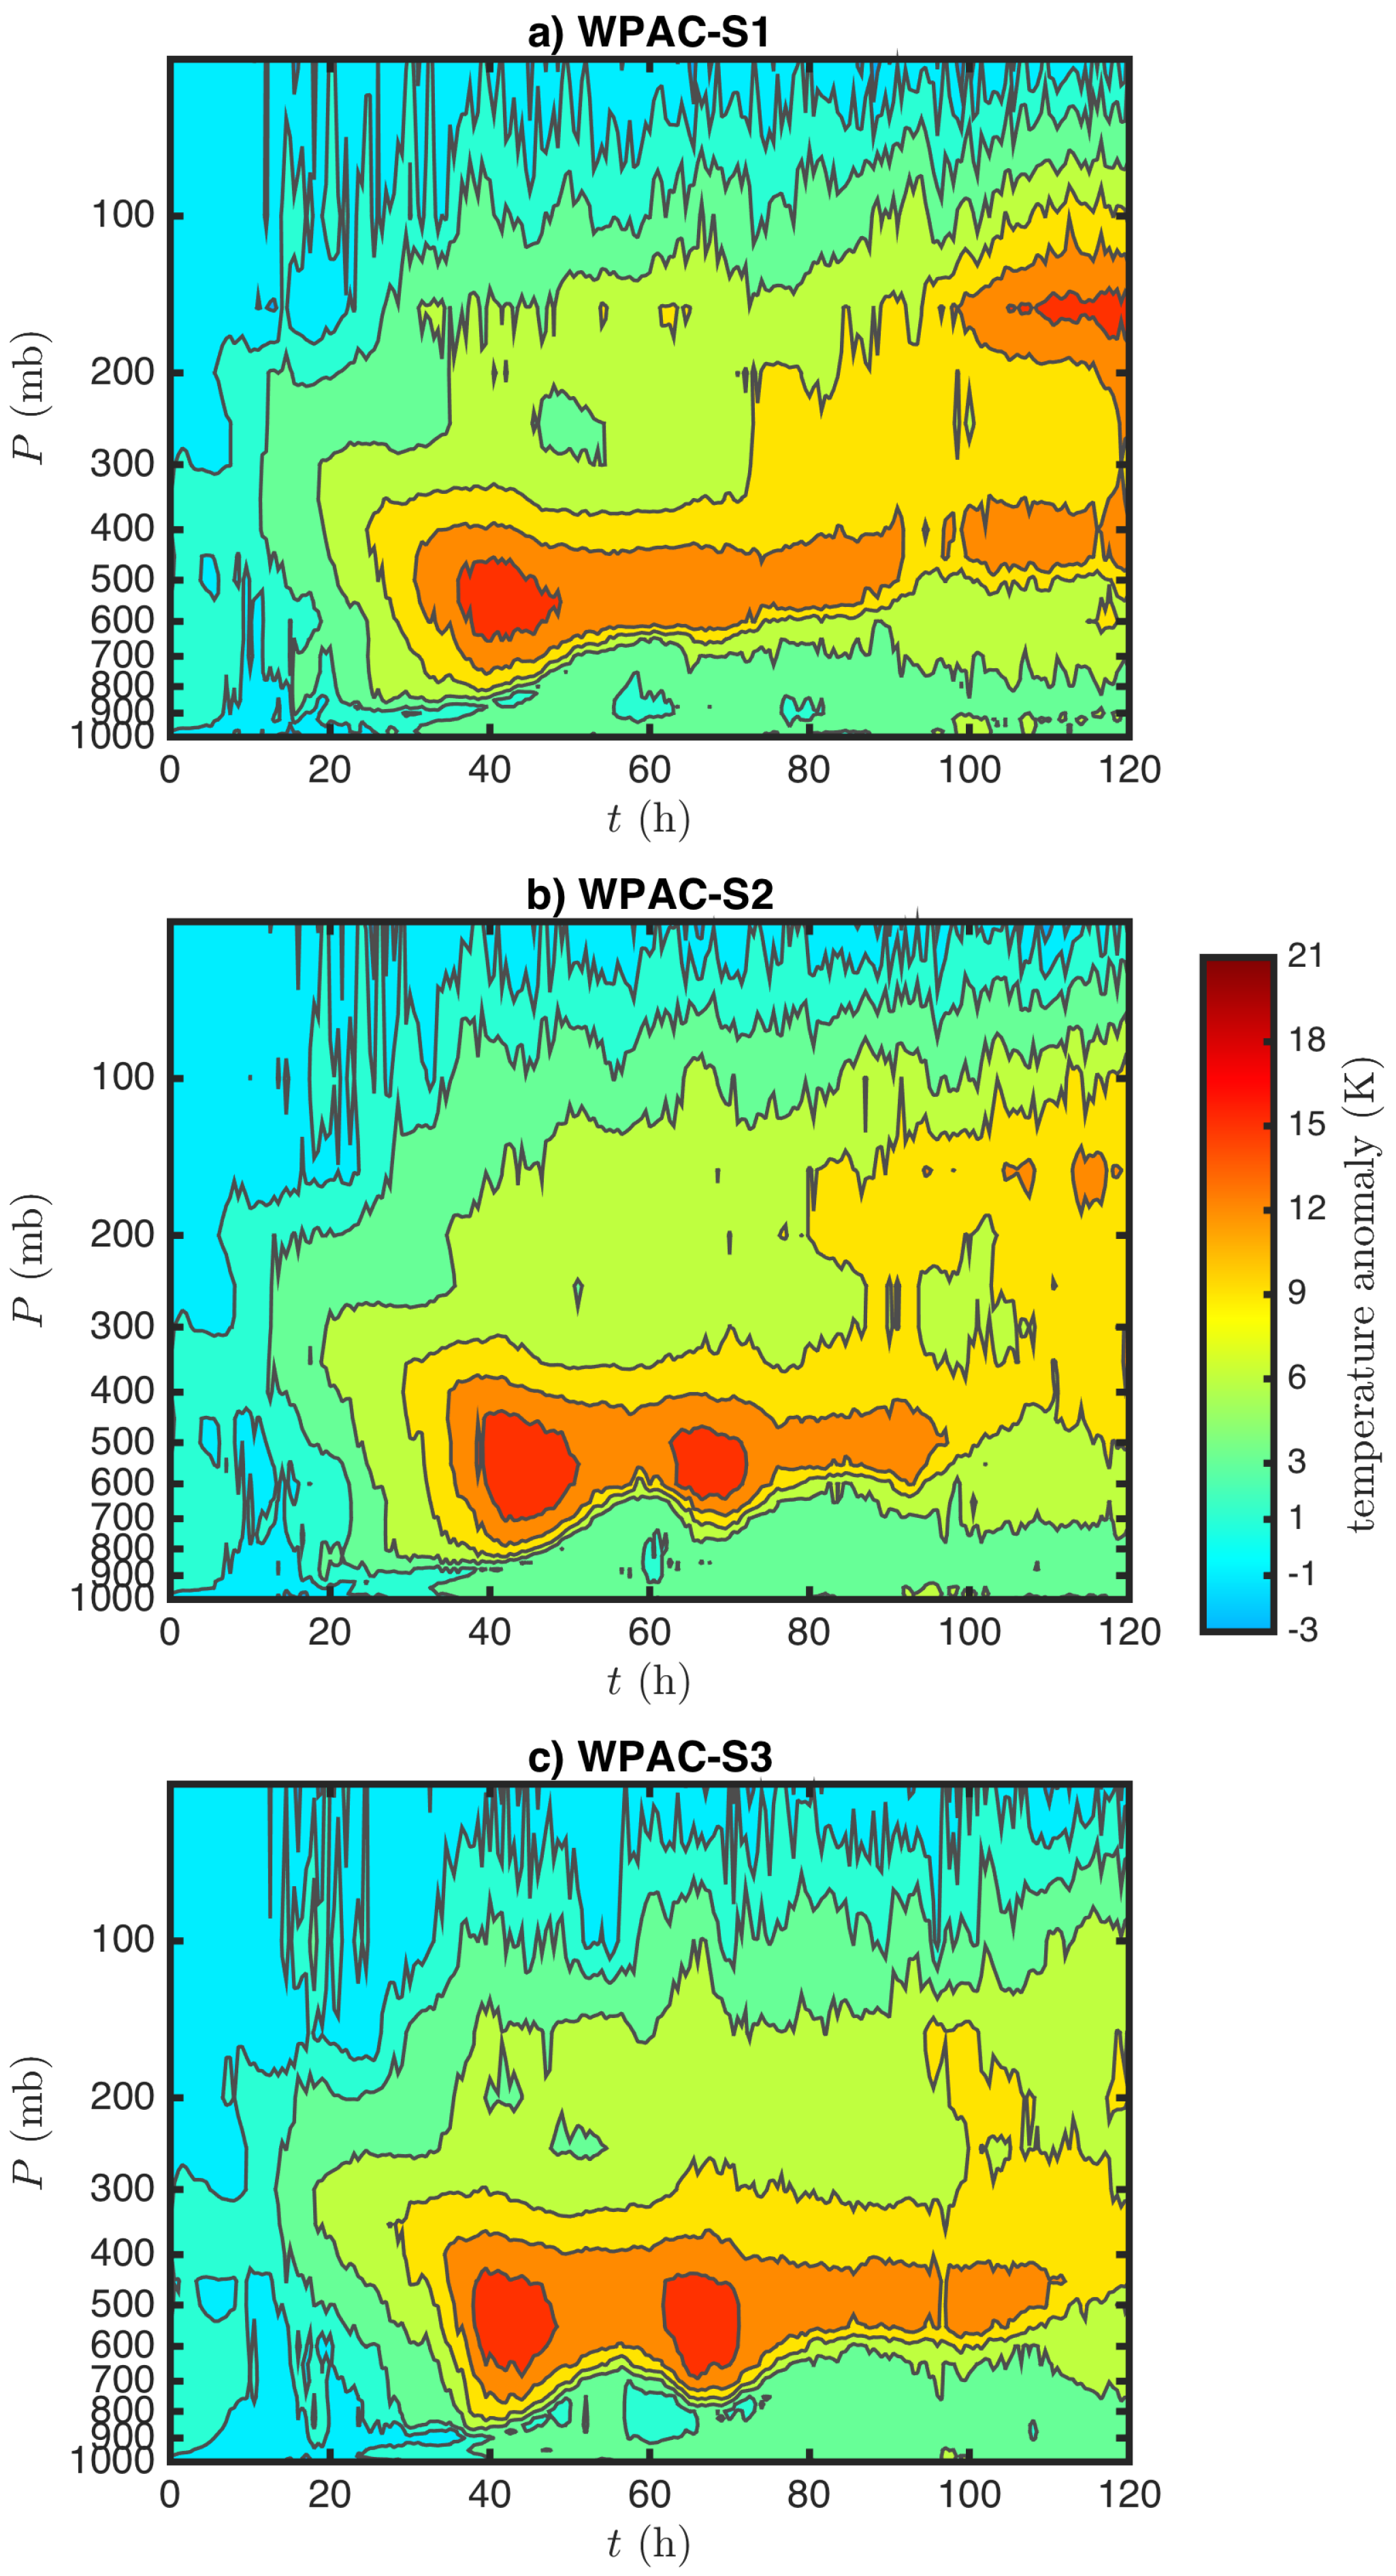
Consistent with the time series of the and , the Hovmöller diagrams of the temperature anomaly at the storm center confirm the corresponding DWC structure at the later stage of the development of the TCs (Figure 9). Similar to the CTL experiments seen in Figure 5, all three subdomain experiments share similar development for the first 12 h. Looking at the 9 K temperature anomaly contour, WS1 seems to show first evidence of formation of a HWC around ∼75 h, followed by WS2 at h and WS3 at h. Subsequently, the WS1 storm develops a prominent DWC structure after 5 days into integration, while WS3 has only a vague suggestion of an HWC (cf. Figure 1 and Figure 8). Although these idealized experiments are insufficient to make a compelling case for causation of increased intensity due to the lower tropopause, these results do suggest again that the TCs developing in regions of relatively lower tropopause height develop a more distinct DWC structure and consequently attain a greater intensity, at least in the WPAC basin.
That the lower tropopause level in these WPAC subdomain experiment produces a stronger storm may look at first contradictory to RE’s idealized experiments in which they demonstrated that a lower tropopause would lead to weaker storms rather than stronger storms as shown in Figure 8 (see their experiments A, F, G, H, I). Detailed examination of RE’s tropopause experiments shows, however, that their design of lowering the tropopause implicitly assumed a fixed lapse rate in the upper troposphere such that lowering the tropopause must correspond to a warmer tropopause temperature (see RE’s Figure 6 and Figure 7 and their discussion therein). In our WPAC subdomain experiments, note particularly that the tropopause level and temperature in the subdomain experiments S1–S3 do not follow RE’s design (the tropopause temperature of experiments WS1, WS2, WS3 experiments are −74.7 °C, −76.0 °C, and −75.1 °C, respectively). In addition to the variations of tropopause temperature in our WPAC subdomain experiments, we note also that the WPAC subdomain soundings change within the troposphere as seen in Figure 8b, whereas RE’s experiments maintain the same lapse rate throughout the troposphere. In this regard, the change of the tropopause level in the real environment affects not only the way the model vortex interacts with the LSL aloft, but also the stratification of the troposphere that RE’s experiments could not fully capture. This different design thus accounts for the discrepancy between our WPAC sensitivity experiments and RE’s tropopause experiments.
4.3. Sensitivity Experiments: NATL Subdomains
Unlike the WPAC basin where the tropopause level increases along the climatological storm tracks, the tropopause level in the NATL basin actually decreases as TCs get closer to the coastline. This characteristic of the tropopause level in the NATL basin allows for an opposite way to verify the important role of the TC–lower stratosphere interaction in the DWC development. Note that because of this tropopause height distribution (cf. Figure 1), subdomain 1 in the NATL basin (NS1), which represents a region where most storms are in earlier developmental stages, has the highest tropopause level, while subdomain 3 (NS3) has the lowest tropopause height, and subdomain 2 (NS2) in the middle but closer to NS1. Given the inverse relationship between the tropopause height and the peaked intensity obtained from the CTL experiments and the subdomain experiments in the WPAC basin, it is expected that the NS3 storm will be most intense, while the NS1 storm is the weakest of the three in the NATL subdomain experiments.
Figure 10a displays time series of intensity for three subdomain experiments in the NATL basin. Unlike the WPAC subdomain experiments, it is intriguing to notice that the three subdomain experiments in the NATL basin are not significantly different from each other at the end of simulations in terms of both the and the metric. In fact, NS1 appears to possess slightly higher intensity on average during the entire simulation, while NS2 and NS3 storms are comparable towards the end of the 5-day simulation. Likewise, the indistinguishable values in Figure 10 do not allow any justifiable distinction in the storm intensity among all three NATL subdomain experiments.
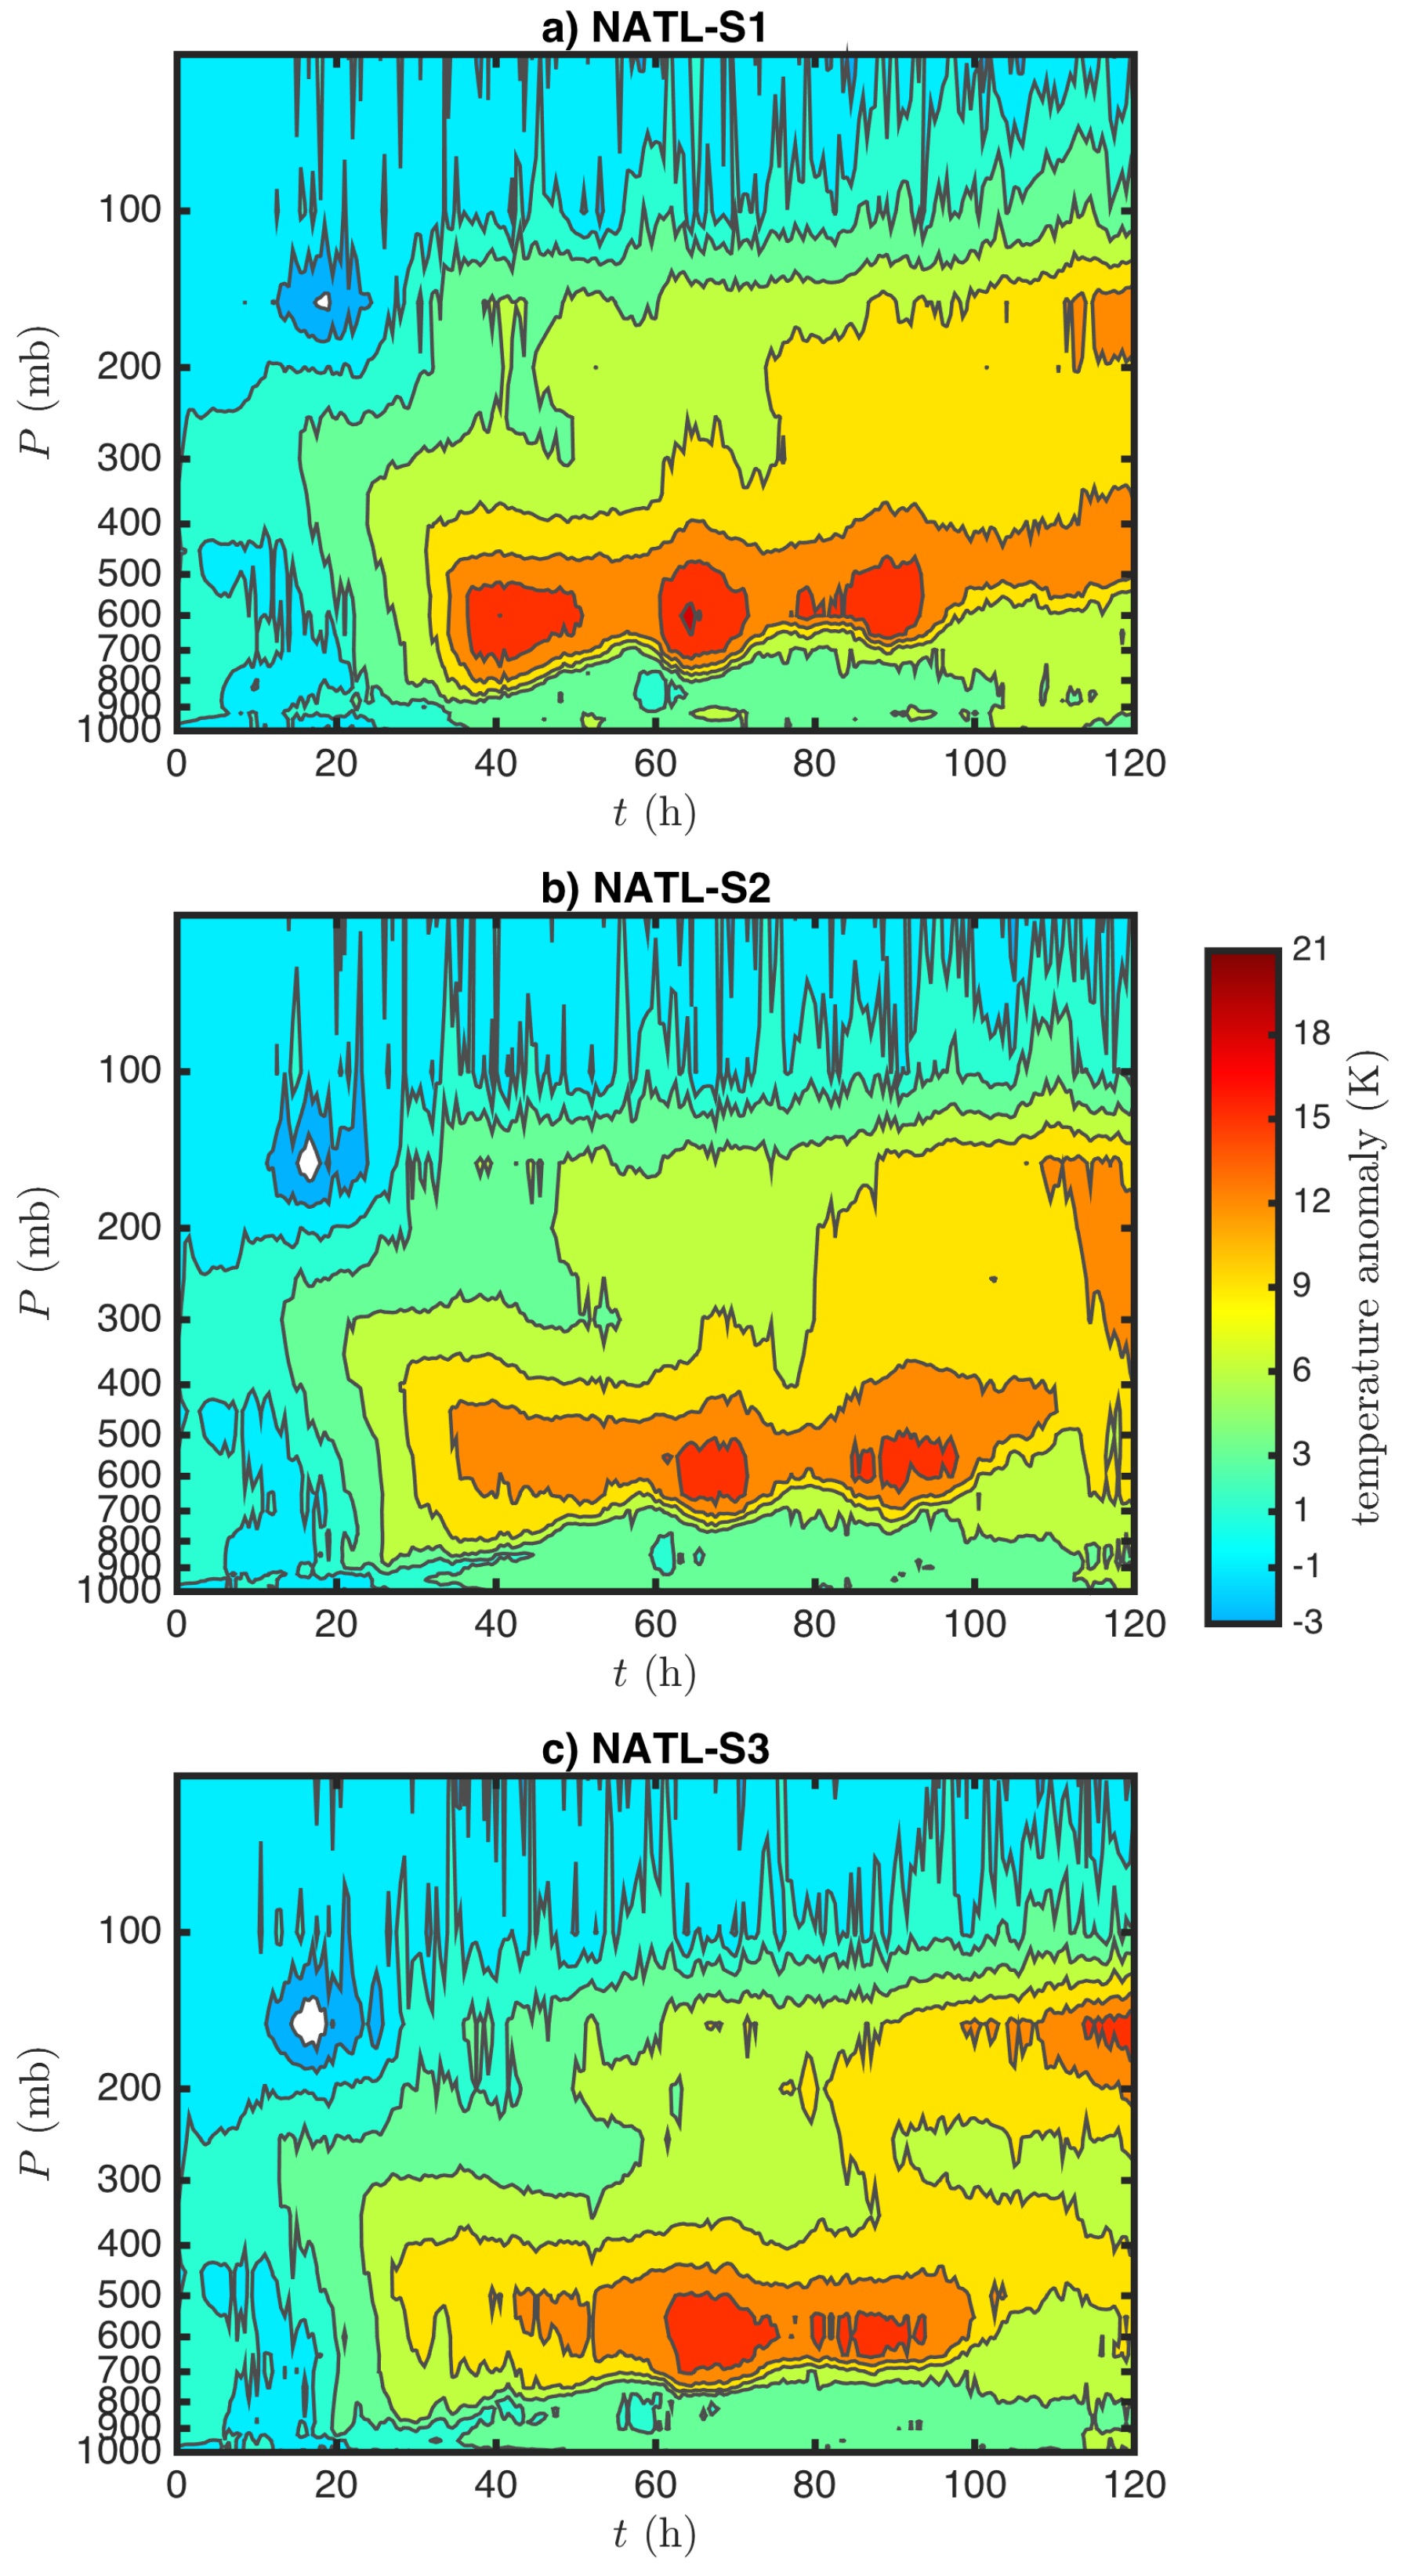
Analyses of the warm core structure in all NATL subdomain experiments reveal that these experiments in fact possess a similar warm core structure after 5 days into integration instead of very contrasting warm core features as in the WPAC subdomain experiments (see Figure 9, Figure 10 and Figure 11). Corresponding to the insignificant difference in the storm intensity is clear evidence of an HWC in all NATL subdomain experiments (Figure 11) , although the magnitudes of these HWCs are not exactly equal. Careful examination of the temperature anomaly at days shows that NS3 has in fact a more prominent HWC as expected from its lowest tropopause height, which exhibits an upper warm core anomaly as large as 15 K at days, as compared to only 11 K in the NS1 experiment (Figure 11a,c). However, the NS3 storm eventually approaches a weaker intensity consistent with its weaker lower-level warm core. The dominance of the HWC relative to the mid-level warm core in the NS3 experiment is somewhat difficult to understand, and may be related to the unfavorable tropospheric stratification associated with the lower tropopause that offsets the benefits of the enhanced LSL interaction aloft. While our current model diagnostics is insufficient to confirm this heuristic speculation, the development of a strong HWC with the relatively lower tropopause height in the NS3 experiment could at least indicate that the interaction between TCs and the lower stratosphere is sensitive to the height of the tropopause.
The contrasting outcomes from the above subdomain experiments in the WPAC and the NATL basins can be justified if we recall that the influences of the tropopause height on the TC development and structure are two-fold. On the one hand, the lowering or raising of the tropopause with fixed SST and outflow implies a modification of the entire tropospheric stratification, thus affecting deep convection and the stability of the troposphere. On the other hand, any change to the tropopause height can also alter the LSL stratification, and therefore change how effectively the LSL interacts with the TCs. Depending on the relative roles of these changes in the troposphere and the LSL, the net impact could strengthen or weaken TCs. In our CTL and the WPAC subdomain experiments, a lower tropopause appears to help enhance the TC development by forming a more distinct DWC structure, which indicates the important role of the LSL stratification. However, that the tropopause height tends to have minimal effects in the NATL basin suggests that changes in the troposphere and the LSL associated with the tropopause height variation may cancel out, thus explaining why there is no clear distinction in the storm intensity in the NATL subdomain experiments.
We should mention that the above sensitivity of the TC development to the tropopause height variation is realized not only for the mean soundings in August 2013, but is in fact observed in all of our sensitivity experiments for other months in 2013 including September and October (not shown). In this regard, the contrasting net impact of the tropopause height on the TC development in different basins highlights the hidden role of the LSL that is potentially essential for understanding of the long-term behaviors of intense TCs in different basins. Of course, our results concerning the role of the tropopause height in modulating the TC-LSL interaction are entirely confined within an idealized framework with constant SST and no vertical wind shear nor other large-scale external factors such as the monsoon troughs, topography, or random convective-scale forcings. In practice, variabilities of SST and environmental vertical wind shear have been shown to be also important in determining the long-term variabilities of TC intensity (see, e.g., [35,36]). Given its average of 2–3 K warmer SST than the NATL basin, it is expected that the WPAC basin should produce more intense TCs as well as higher TC frequency in this area, As a result, TCs in the WPAC basin are potentially subject to stronger interaction with the lower stratosphere and higher sensitivity to the tropopause height variations.
5. Axisymmetric Model Simulations
The idealized experiments with the full-physics HWRF model presented in Section 4 are of importance for examining TC development because of the HWRF’s realistic representations of TC physical processes. However, the strict requirement of initializing the HWRF model that ensures the model stability does not permit flexibility in changing the structure of the lower stratosphere. Furthermore, extensive computational time and data storage associated with very high-resolution simulations prevent us from conducting many sensitivity experiments to obtain statistically significant conclusions. Thus, the results obtained from the HWRF idealized experiments are to some extent inconclusive on how variability in the LSL stratification could impact TC structure and development.
To verify that the DWC structure at the high-intensity limit is not unique to HWRF and that the impacts of the lower stratosphere are significant, sensitivity experiments using a two-dimensional (2D) axisymmetric TC model developed by RE are presented in this section. The RE’s model was configured similarly to that used in [37] with a vertical resolution of 500 m, and horizontal resolution of 3 km on the radius-height plane. Except for a constant Newtonian radiative cooling cap of 1 K day−1, all default physical parameterizations used in the RE model were applied in this study. Our numerous experiments with the RE model showed that the stability of the RE model is sensitive to the radiative forcing, and can only maintain quasi-equilibrium stage for a radiative cooling rate <1.0 K day−1. Such a quasi-stable behavior of the storm intensity is of interest in this study, since the characteristics of the quasi-stable intensity state are functions of the ambient environment, of which the LSL temperature characteristics are a part. With this configuration, the MPI value is contained within the stable regime as discussed in [37], and any change in the MPI limit due to LSL variations can therefore reflect the impacts of the LSL.
In order to implement different stratifications of the lower stratosphere layer into simulations with the RE’s model, the square of the Brunt–Väisälä frequency is used as a control parameter to characterize the stratospheric stratification. A range of input soundings was created with the same cold-point tropopause temperature and SST, but with the lower stratospheric varying around that of Jordan’s sounding from s−2 to s−2. The requirement of the same tropopause temperature and the same SST is important to ensure that the entire tropospheric structure is the same, thus keeping the analytical MPI limit fixed in all experiments. As such, any difference in the storm intensity among -varying experiments will reveal the impact of the LSL rather than those associated with SST, the outflow temperature, or the tropospheric stratification. Given the default Jordan sounding and a prescribed increment of s−2 for , 35 input soundings were generated by adding an increment of temperature values at all model levels above the tropopause such that the value of above the tropopause is changed by an increment of s−2 in each experiment (see Figure 12a).
Figure 12b shows the storm intensity at the quasi-equilibrium state, which is calculated as a 1000-day average of , as a function of the LSL stratification parameter . It is of interest to observe an inverse relationship between and the intensity at the quasi-stable state, i.e., the stronger stability of the lower stratosphere corresponds to a weaker maximum intensity. The implication of such an inverse dependence of the on is significant, as it indicates that the variation of the LSL stratification can impose some changes to the actual MPI limit that a storm can attain. Physically, this impact of the LSL stratification on TC development is expected because a weaker stratification in the lower stratosphere allows deep convection to penetrate higher into the lower stratosphere and produce stronger returning inflow above the cloud top. Hence, the upper-level interaction between TCs and the LSL can enhance the storm development via accumulation of a warm core at high levels as captured in the HWRF’s simulations.
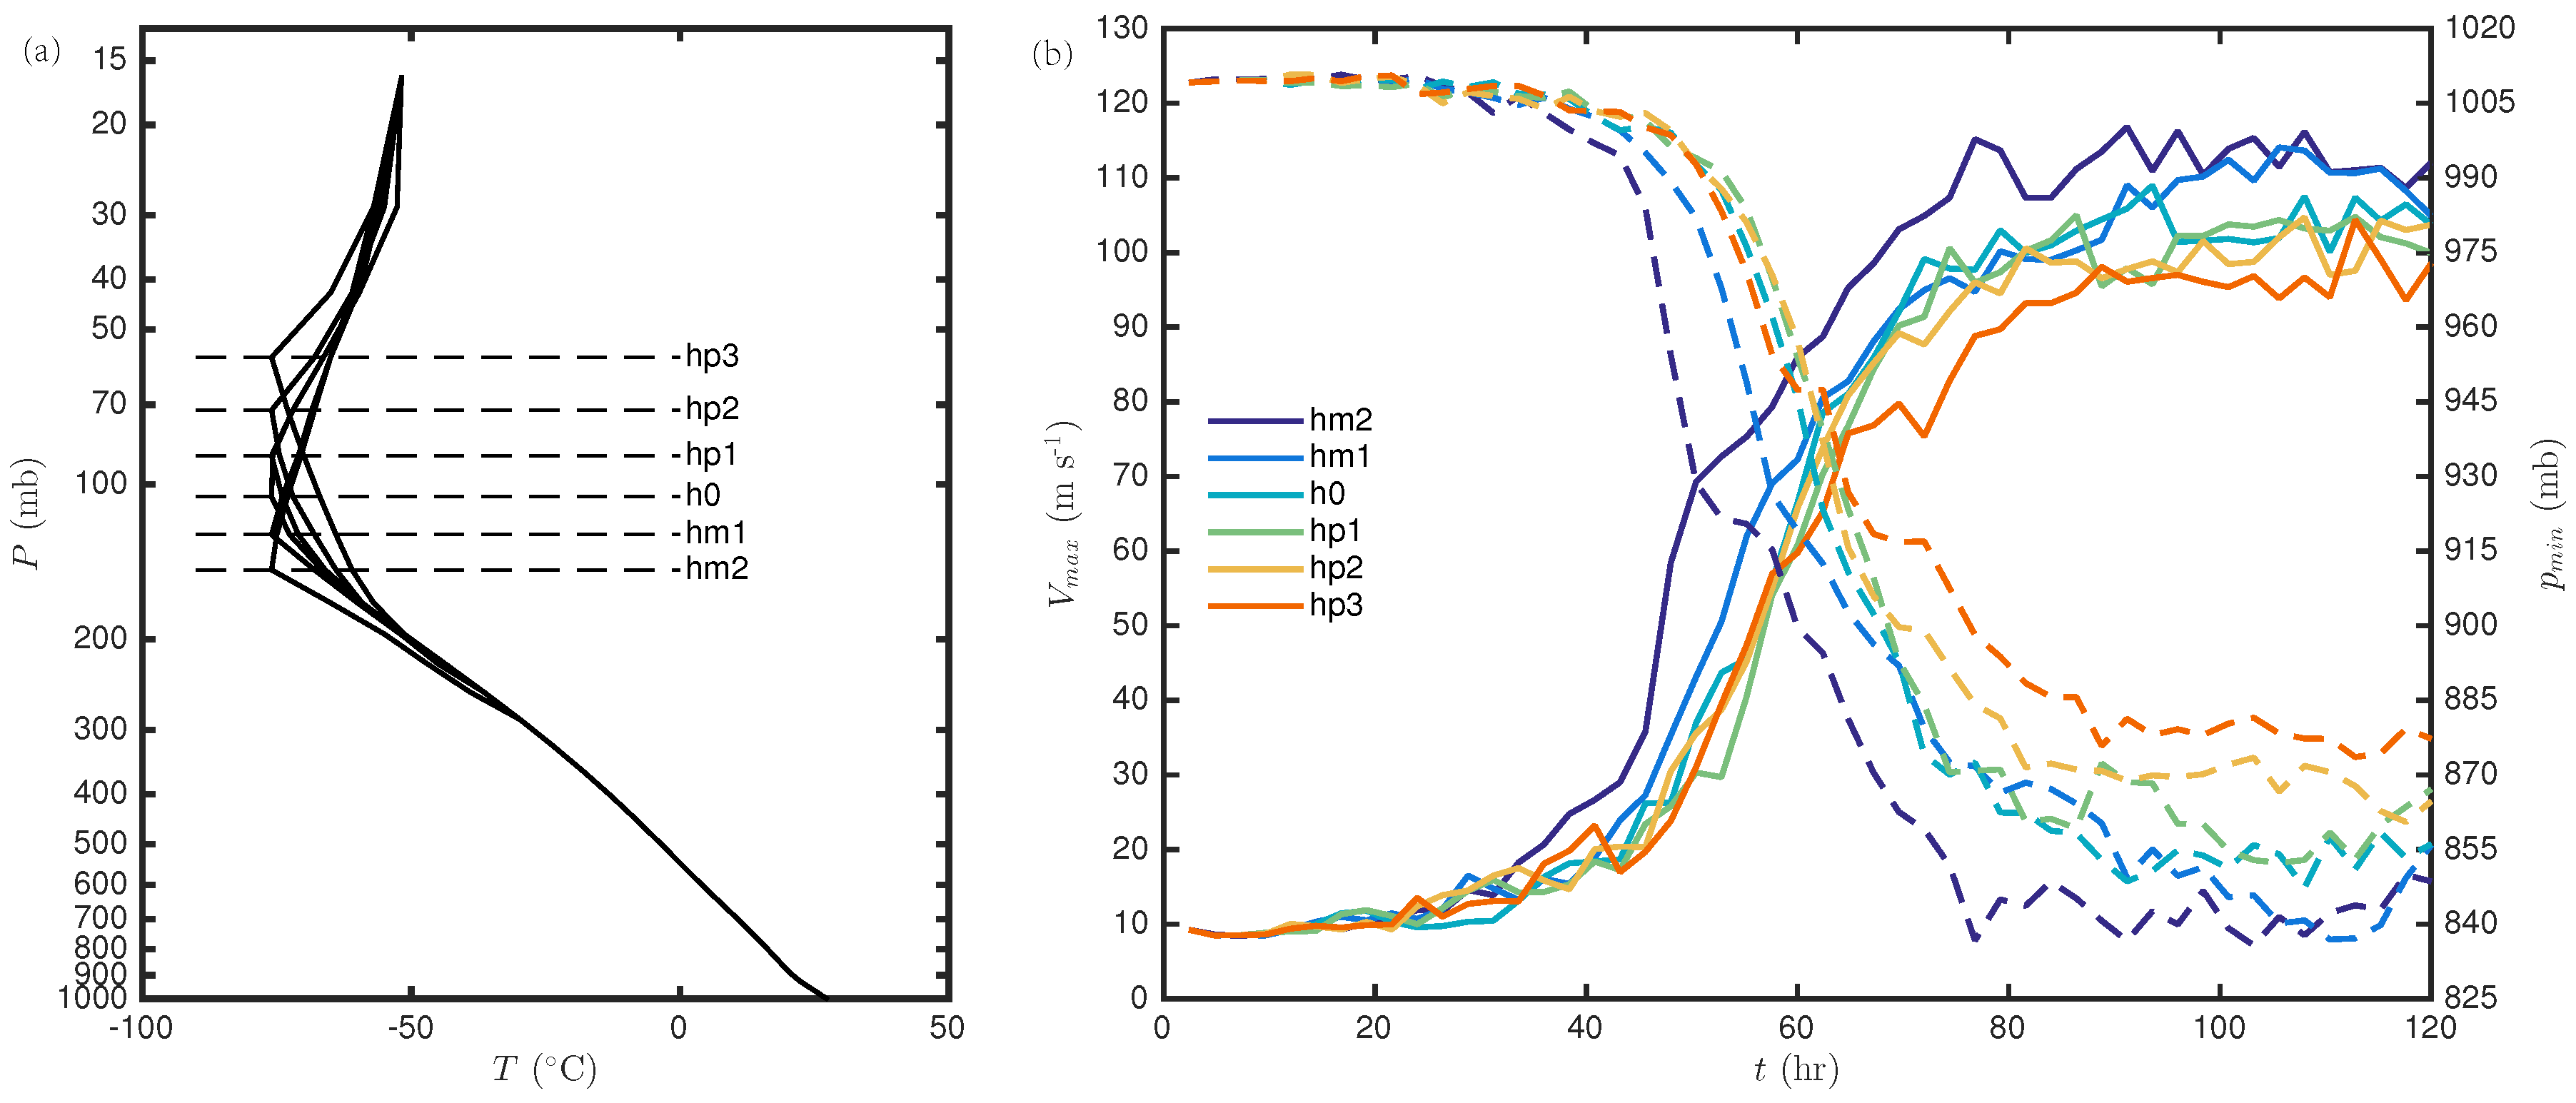
To verify the sensitivity of the model MPI on the tropopause variations within the axisymmetric framework, Figure 13 shows the time series of for another set of experiments for which the tropopause height is varied around the Jordan sounding reference. By keeping SST and the tropopause temperature fixed, any intensity variation in this set of experiments could highlight the role of the tropopause level. As seen in Figure 13, the RE model again captures a consistent behavior with higher for lower tropopause level towards the end of the 5-day integration. This relationship accords with the results obtained from the HWRF simulations with different tropopause heights as presented in Section 4, i.e., a lower tropopause height would correspond to weaker LSL stratification (assuming the same tropopause temperature) and result in a stronger storm. Although the inverse relationship between tropopause level and the maximum intensity obtained the RE model is apparent as shown in Figure 13 during the DWC development stage, it is noted that the maximum intensity gradually approaches a substantially lower value (around 64 m s−1) at the quasi-stationary stage. Such a lower quasi-stationary MPI limit clearly indicates the transient characteristics of the DWC structure that warrants further study in future.
6. Conclusions
In this study, potential impacts of the lower stratosphere on the inner-core structure and the development of intense TCs have been investigated, using the full-physics HWRF model and an axisymmetric model. The underlying motivation for investigating such stratosphere–TC interaction stems from recent real-time forecasts of TCs in the WPAC basin by the NOAA National Center for Environmental Prediction (NCEP) center, which consistently captured the development of a double warm-core structure in almost all intense TCs in the WPAC basin. The persistent location of an upper-level warm core near the tropopause together with a thin layer of inflow in the lower stratosphere layer (LSL) suggests that the lower stratosphere may not be a simple lid, but can interact with TCs and exert noticeable impacts on the inner-core structure and development of TCs at the extreme intensity limit. This persistent modeling evidence along with the recent compelling observation of the DWC structure in Hurricane Patricia (2015) motivated us to examine how variations in the tropopause level and the LSL stratification could modulate the development of intense TCs in different ocean basins. Specifically, we speculated that a lower tropopause or weaker LSL stratification would allow for a favorable interaction between the LSL and the TC inner-core above the typical anticyclonic outflow layer. As a result, an upper-level inflow could develop in the LSL, and induce advection of warm air from the lower stratosphere to the TC eye region, thus forming a higher-level warm core and allowing TCs to further intensify.
A range of numerical experiments with the HWRF model and the axisymmetric model have been conducted to examine how changes in the tropopause height can impact TC intensity. In experiments with the HWRF model, the idealized configuration of the HWRF model was initialized with different soundings in the WPAC and NATL basins during August 2013. Results from the CTL experiments showed that the lower tropopause height in the NATL basin results in a stronger vortex as compared to the WPAC basin under the same SST condition. Such higher intensity in the NATL basin is attributed to a more conducive structure of the troposphere to the DWC development. In particular, our results revealed that the NATL’s August soundings in 2013 tend to be more favorable to intense TCs than the WPAC’s soundings during the time, thus explaining for the overall higher maximum intensity in all experiments with the NATL’s soundings.
Sensitivity experiments with different subdomains in each ocean basin provided additional evidence that a lower tropopause would support higher intensity. Specifically, initializing the model with a sounding having a lower tropopause led to a more intense storm after 4–5 days in the WPAC basin, accompanied by a more prominent DWC structure. In the NATL basin, the variation of the tropopause height exerts, however, an unnoticeable impact on the TC intensity. In fact, all subdomain sensitivity experiments in the NATL basin showed similar intensity towards the end of the 5-day simulation, regardless of the difference in their tropopause level. Although these NATL experiments do not support the inverse relationship between tropopause height variation and TC intensity as seen in the WPAC basin, the strength of the high-level warm anomaly in the NATL basin does appear to be consistent with its lowest tropopause height, reiterating the anticipated impacts of the lower stratosphere layer on the development and the inner-core structure of intense TCs.
Because of the dual role of the variations in tropopause height in both changing the LSL stratification and the tropospheric stability, additional experiments with an axisymmetric model developed by [12] were conducted to isolate the impacts of the LSL stratification. With the flexibility of adjusting the LSL stratification for a large number of long simulations, the relative impacts of the tropopause height effects versus the stratification of the lower stratosphere can be separately analyzed in these idealized experiments. By keeping the SST, the tropopause temperature, and the tropospheric temperature structure fixed, our sensitivity experiments with a range of the LSL stratification using the RE axisymmetric model showed that the intensity of TCs at their quasi-stable state is inversely correlated to the lower stratosphere stratification. This inverse relationship between the TC potential intensity and the LSL stratification indicates that a weaker LSL stratification would correspond to stronger TCs at their mature stage, which is consistent with the results obtained from the HWRF simulations in the WPAC basin. The results obtained from this study thus strongly suggest possible impacts of the tropopause level and LSL stratification on TC development beyond the traditional MPI theory that one needs to take into consideration when examining the long-term variability of TC intensity.
Acknowledgments
This research is supported by NOAA HFIP funding (Award NA16NWS4680026), the ONR funding (Grant N000141410143), and the Vice Provost for Research through the Indiana University Faculty Research Support Program. We would like to thank Scott Robeson, Kaj Johnson, Madison Ferrara, and Faith Groff for their discussions and suggestions. Thanks are also extended to two anonymous reviewers whose comments have helped substantially improve this work.
Author Contributions
C.K. and Z.M. conceived and designed the experiments; Z.M. performed the experiments; Both C.K. and Z.M. analyzed the data and wrote the paper.
Conflicts of Interest
The authors declare no conflict of interest.
Appendix A. Sea Surface Temperature Model Adjustment
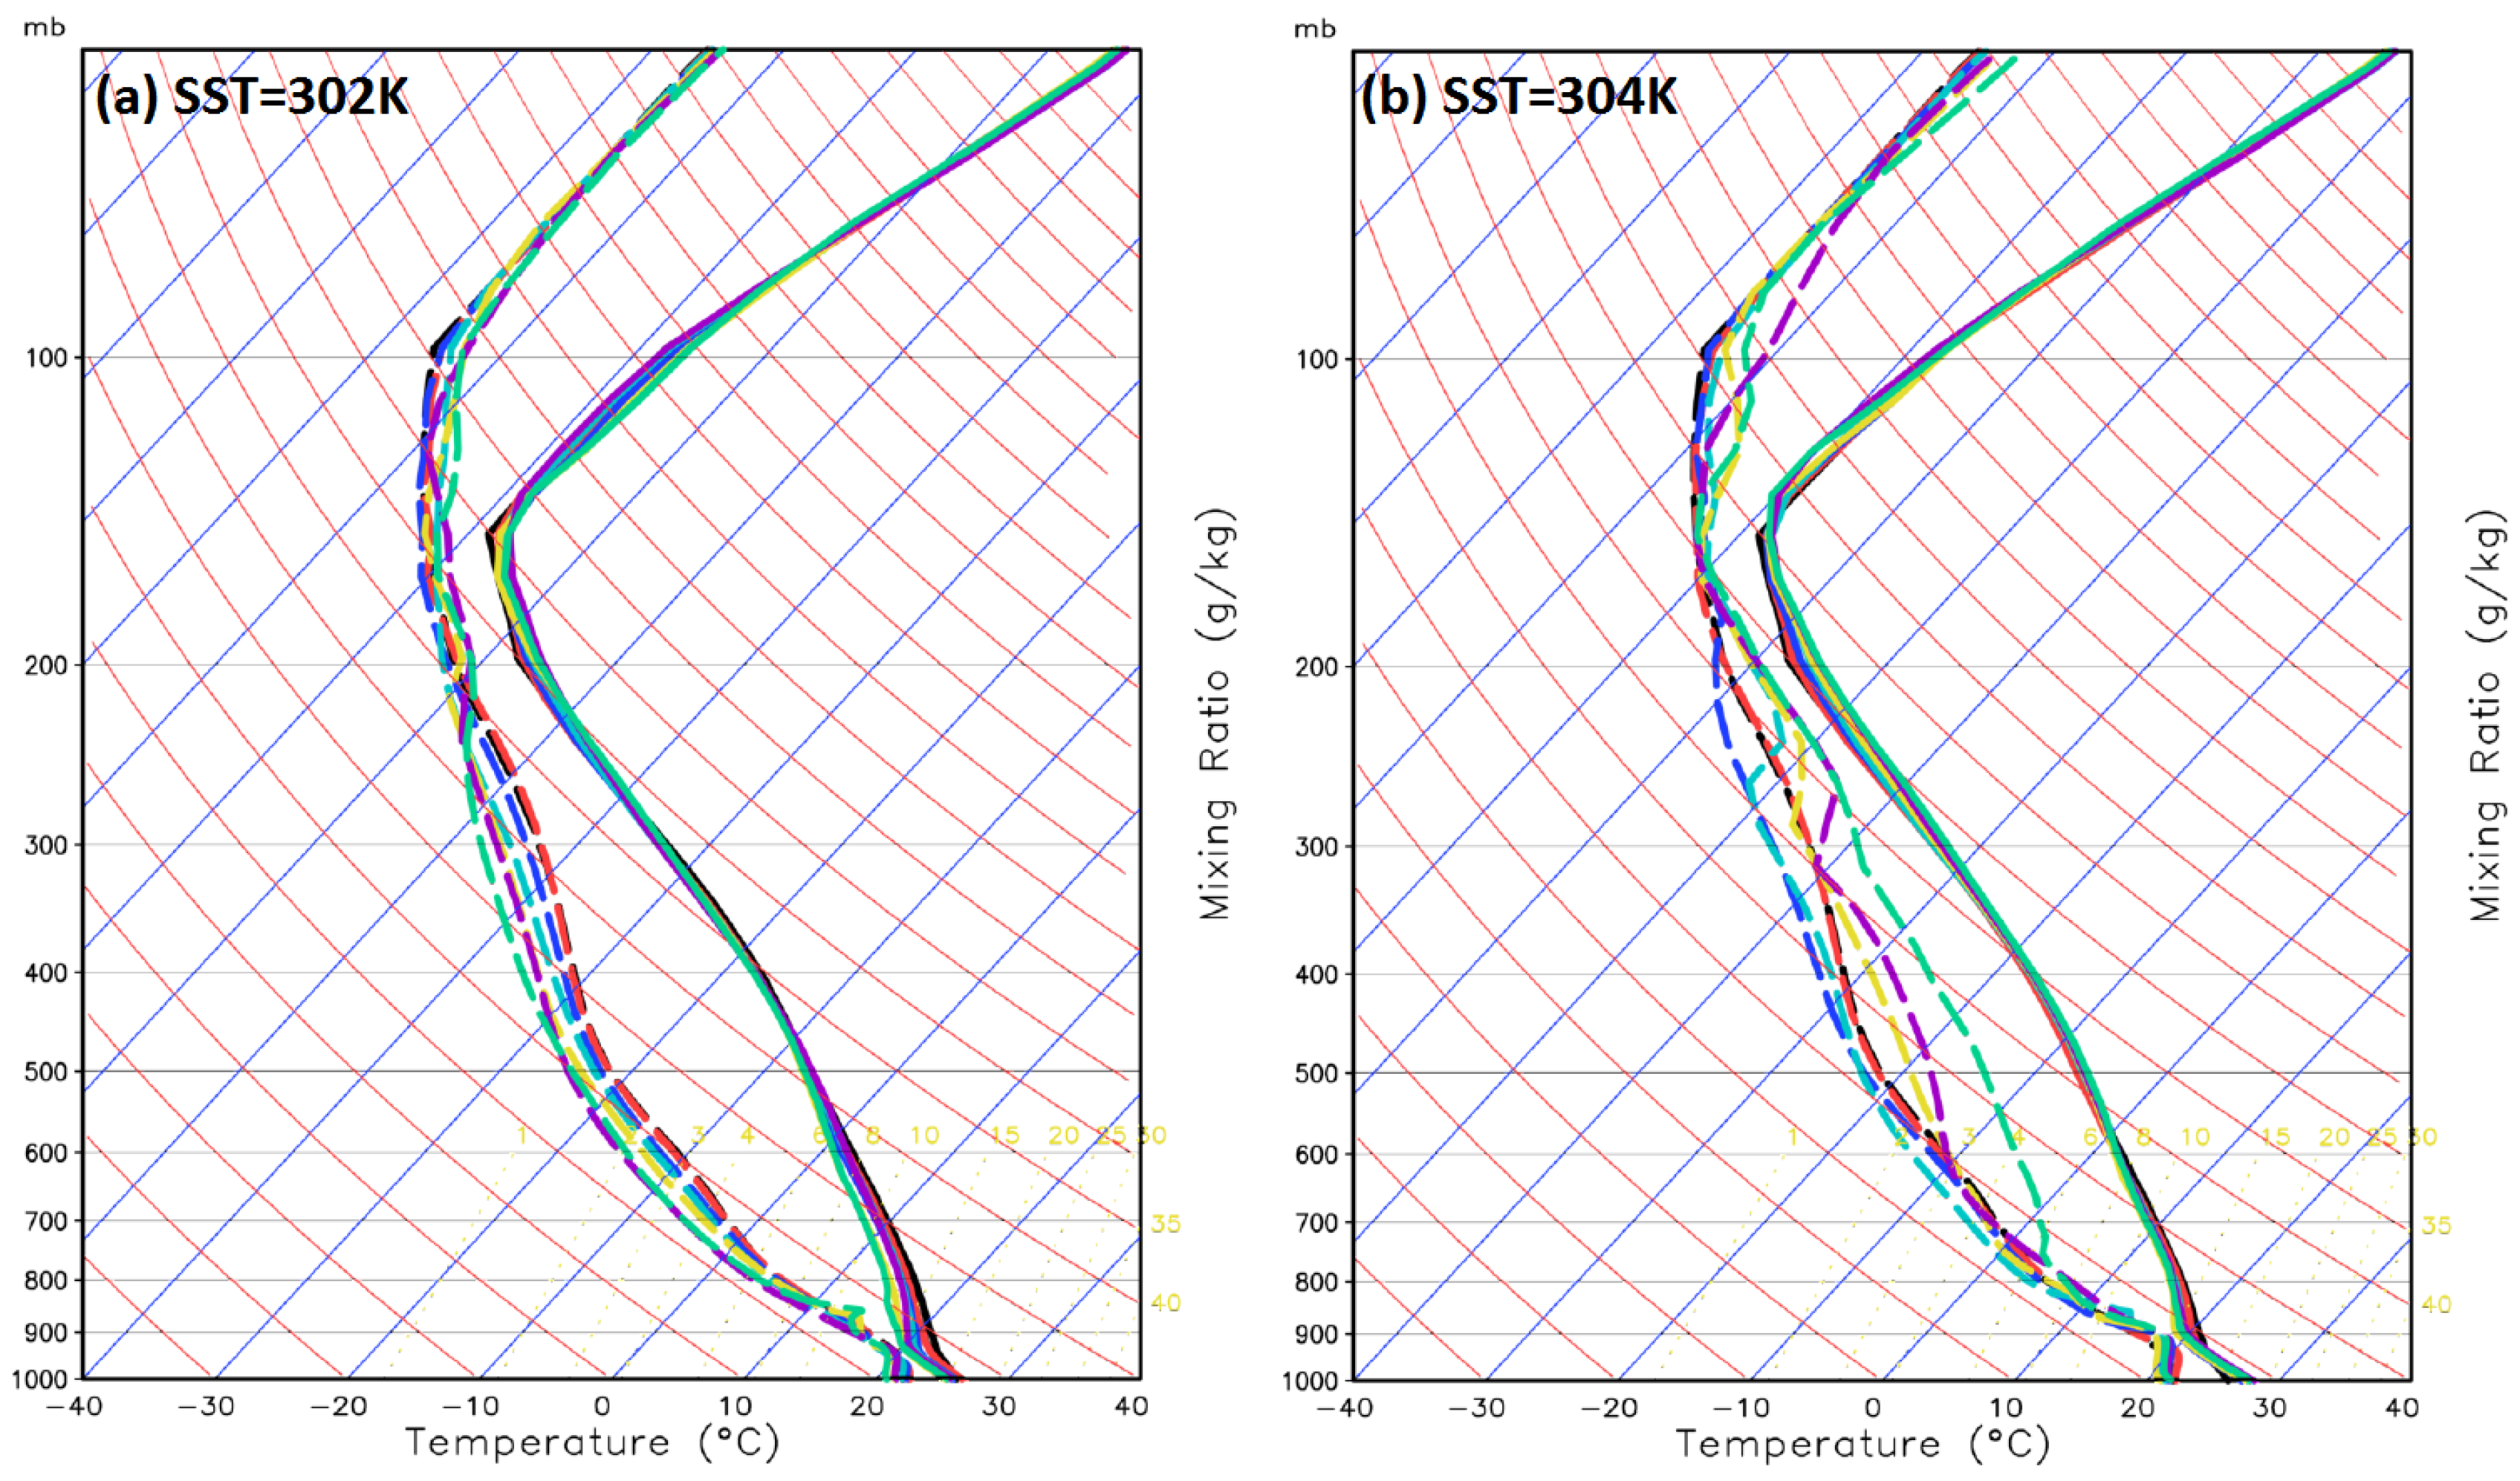
As a demonstration of the adjustment of the tropospheric profile to a prescribed SST in the WPAC and NATL subdomain sensitivity experiments, Figure A1 shows the area-averaged soundings within a radius of 1000 km from the model vortex center at intervals of 12, 24, 36, 48, and 72 h into integration for two different prescribed SST values of 302 K, and 304 K, assuming a fixed sounding as in the WPAC-CTL experiment (see Table 1). While both the temperature and the humidity at the HWRF model lowest level are not modified in these experiments as in RE’s design, it is seen in Figure A1 that the HWRF model shows a rapid adjustment of temperature below 700 hPa after just 12 h into integration, and maintains this temperature profile for the rest of the 5-day simulations. The most significant change is seen for the moisture profile with SST = 304 K, which shows gradual moistening with time above 800 hPa level. Note however that the temperature structure in the troposphere is well maintained even with SST = 304 K, thus justifying our design of a fixed SST for different initial soundings. Since our focus here is on the mature stage towards the end of 5-day simulations, it is reasonable to assume that the adjustment of the tropospheric temperature profile to a prescribed SST is sufficiently effective to allow us quantify any variation of the MPI with different SST conditions similar to RE’s SST experiments.
Figure A1.
Area-averaged soundings within a radius of 1000 km from the model storm center that are obtained from HWRF model with the August mean sounding in the WPAC basin, valid at h (black), h (cyan), h (blue), h (purple), h (brown), and h (green) in two experiments with (a) SST = 302 K, and (b) SST = 304 K. Solid (dashed) lines denote the temperature (dewpoint) profiles.

References
- Ooyama, K. Numerical Simulation of the Life Cycle of Tropical Cyclones. J. Atmos. Sci. 1969, 26, 3–40. [Google Scholar] [CrossRef]
- Liu, Y.; Zhang, D.-L.; Yau, M.K. A Multiscale Numerical Study of Hurricane Andrew (1992). Part I: Explicit Simulation and Verification. Mon. Weather Rev. 1997, 125, 3073–3093. [Google Scholar] [CrossRef]
- Stern, D.P.; Nolan, D.S. On the Height of the Warm Core in Tropical Cyclones. J. Atmos. Sci. 2012, 69, 1657–1680. [Google Scholar] [CrossRef]
- Chen, H.; Zhang, D.-L. On the Rapid Intensification of Hurricane Wilma (2005). Part II: Convective Bursts and the Upper-Level Warm Core. J. Atmos. Sci. 2013, 70, 146–162. [Google Scholar] [CrossRef]
- Emanuel, K.A. An Air-Sea Interaction Theory for Tropical Cyclones. Part I: Steady-State Maintenance. J. Atmos. Sci. 1986, 43, 585–605. [Google Scholar] [CrossRef]
- Hawkins, H.F.; Imbembo, S.M. The Structure of a Small, Intense Hurricane Inez 1966. Mon. Weather Rev. 1976, 104, 418–442. [Google Scholar] [CrossRef]
- Schwartz, M.J.; Barrett, J.W.; Fieguth, P.W.; Rosenkranz, P.W.; Spina, M.S.; Staelin, D.H. Observations of Thermal and Precipitation Structure in a Tropical Cyclone by Means of Passive Microwave Imagery near 118 GHZ. J. Appl. Meteorol. 1996, 35, 671–678. [Google Scholar] [CrossRef]
- Komaromi, W.A.; Doyle, J.D. On the nature of TC and trough-jet interactions. In Proceedings of the 32nd Conference on Hurricanes and Tropical Meteorology, 10D.5, San Juan, PR, USA, 17–22 April 2016. [Google Scholar]
- Kieu, C.; Tallapragada, V. On the Development of Double Warm Cores in Intense Tropical Cyclones in the HWRF Model. In Proceedings of the 32nd Conference on Hurricanes and Tropical Meteorology, 17D.4, San Diego, CA, USA, 30 March–4 April 2014. [Google Scholar]
- Tallapragada, V.; Kieu, C.; Trahan, S.; Liu, Q.; Wang, W.; Zhang, Z.; Tong, M.; Zhang, B.; Zhu, L.; Strahl, B. Forecasting Tropical Cyclones in the Western North Pacific Basin using the NCEP Operational HWRF Model. Model Upgrades and Evaluation of Real-Time Performance in 2013. Weather Forecast. 2015, 30, 1355–1373. [Google Scholar] [CrossRef]
- Kieu, C.; Tallapragada, V.; Zhang, D.-L.; Moon, Z. On the Development of Double Warm-Core Structures in Intense Tropical Cyclones. J. Atmos. Sci. 2016, 73, 4487–4506. [Google Scholar] [CrossRef]
- Rotunno, R.; Emanuel, K.A. An Air-Sea Interaction Theory for Tropical Cyclones. Part II: Evolutionary Study Using a Nonhydrostatic Axisymmetric Numerical Model. J. Atmos. Sci. 1987, 44, 542–561. [Google Scholar] [CrossRef]
- Stern, D.P.; Zhang, F. How does the eye warm? Part I: A potential temperature budget analysis of an idealized tropical cyclone. J. Atmos. Sci. 2013, 70, 73–90. [Google Scholar] [CrossRef]
- Ohno, T.; Satoh, M. On the Warm Core of a Tropical Cyclone Formed near the Tropopause. J. Atmos. Sci. 2015, 72, 551–571. [Google Scholar] [CrossRef]
- Wang, H.; Wang, Y. A Numerical Study of Typhoon Megi (2010). Part I: Rapid Intensification. Mon. Weather Rev. 2014, 142, 29–48. [Google Scholar] [CrossRef]
- Ramsay, H.A. The effects of imposed stratospheric cooling on the maximum intensity of tropical cyclones in axisymmetric radiative-convective equilibrium. J. Clim. 2013, 26, 9977–9985. [Google Scholar] [CrossRef]
- Wang, S.; Camargo, S.J.; Sobel, A.H.; Polvani, L.M. Impact of the tropopause temperature on the intensity of tropical cyclones—An idealized study using a mesoscale model. J. Atmos. Sci. 2014, 71, 4333–4348. [Google Scholar] [CrossRef]
- Ferrara, M.; Groff, F.; Moon, Z.; Robeson, S.; Kieu, C. Large-scale control of the lower stratosphere on variability of tropical cyclone intensity. Geophys. Res. Lett. 2017, 44, 4313–4323. [Google Scholar] [CrossRef]
- Zhang, D.-L.; Chen, H. Importance of the upper-level warm core in the rapid intensification of a tropical cyclone. Geophys. Res. Lett. 2012, 39, L02806. [Google Scholar] [CrossRef]
- Hogsett, W.; Zhang, D.-L. Numerical simulation of hurricane bonnie (1998). Part III: Energetics. J. Atmos. Sci. 2009, 66, 2678–2696. [Google Scholar] [CrossRef]
- Tallapragada, V.; Bernardet, L.; Gopalakrishnan, S.; Kwon, Y.; Liu, Q.; Marchok, T.; Sheinin, D.; Tong, M.; Trahan, S.; Tuleya, R.; et al. Hurricane Weather Research and Forecasting (HWRF) Model: 2013 Scientific Documentation; Developmental Testbed Center: Boulder, CO, USA, 2013; Volume 99. [Google Scholar]
- Tallapragada, V.; Kieu, C.; Kwon, Y.; Trahan, S.; Liu, Q.; Zhang, Z.; Kwon, I.-H. Evaluation of Storm Structure from the Operational HWRF during 2012 Implementation. Mon. Weather Rev. 2014, 142, 4308–4325. [Google Scholar] [CrossRef]
- Gopalakrishnan, S.G.; Marks, F.; Zhang, X.; Bao, J.-W.; Yeh, K.-S.; Atlas, R. The Experimental HWRF System: A Study on the Influence of Horizontal Resolution on the Structure and Intensity Changes in Tropical Cyclones Using an Idealized Framework. Mon. Weather Rev. 2011, 139, 1762–1784. [Google Scholar] [CrossRef]
- Bao, J.-W.; Gopalakrishnan, S.G.; Michelson, S.A.; Marks, F.D.; Montgomery, M.T. Impact of Physics Representations in the HWRFX on Simulated Hurricane Structure and Pressure-Wind Relationships. Mon. Weather Rev. 2012, 140, 3278–3299. [Google Scholar] [CrossRef]
- Gopalakrishnan, S.G.; Marks, F.; Zhang, J.A.; Zhang, X.; Bao, J.-W.; Tallapragada, V. A Study of the Impacts of Vertical Diffusion on the Structure and Intensity of the Tropical Cyclones Using the High-Resolution HWRF System. J. Atmos. Sci. 2013, 70, 524–541. [Google Scholar] [CrossRef]
- Kieu, C.; Tallapragada, V.; Hogsett, W. Vertical structure of tropical cyclones at onset of the rapid intensification in the HWRF model. Geophys. Res. Lett. 2014, 41, 3298–3306. [Google Scholar] [CrossRef]
- Tallapragada, V.; Kieu, C. Real-Time Forecasts of Typhoon Rapid Intensification in the North Western Pacific Basin with the NCEP Operational HWRF Model. Trop. Cyclone Res. Rev. 2014, 3, 63–77. [Google Scholar]
- Hong, S.-Y.; Pan, H.-L. Nonlocal Boundary Layer Vertical Diffusion in a Medium-Range Forecast Model. Mon. Weather Rev. 1996, 124, 2322–2339. [Google Scholar] [CrossRef]
- Reid, G.C.; Gage, K.S. On the Annual Variation in Height of the Tropical Tropopause. J. Atmos. Sci. 1981, 38, 1928–1938. [Google Scholar] [CrossRef]
- Wing, A.A.; Emanuel, K.; Solomon, S. On the factors affecting trends and variability in tropical cyclone potential intensity. Geophys. Res. Lett. 2015, 42, 8669–8677. [Google Scholar] [CrossRef]
- Bister, M.; Emanuel, K.A. Low frequency variability of tropical cyclone potential intensity, 1. Interannual to interdecadal variability. J. Geophys. Res. 2002, 107, 4801. [Google Scholar] [CrossRef]
- Garner, S. The Relationship between Hurricane Potential Intensity and CAPE. J. Atmos. Sci. 2015, 72, 141–163. [Google Scholar] [CrossRef]
- Shen, W.; Tuleya, R.E.; Ginis, I. A sensitivity study of the thermodynamic environment on GFDL model hurricane intensity: Implications for global warming. J. Clim. 2000, 13, 109–121. [Google Scholar] [CrossRef]
- Tuleya, R.E.; Bender, M.; Knutson, T.R.; Sirutis, J.J.; Thomas, B.; Ginis, I. Impact of Upper-Tropospheric Temperature Anomalies and Vertical Wind Shear on Tropical Cyclone Evolution Using an Idealized Version of the Operational GFDL Hurricane Model. J. Atmos. Sci. 2016, 73, 3803–3820. [Google Scholar] [CrossRef]
- Knutson, T.R.; McBride, J.L.; Chan, J.; Emanuel, K.; Holland, G.; Landsea, C.; Held, I.; Kossin, J.P.; Srivastava, A.K.; Sugi, M. Tropical cyclones and climate change. Nat. Geosci. 2010, 3, 157–163. [Google Scholar] [CrossRef] [Green Version]
- Lin, I.-I.; Chan, J.C.L. Recent decrease in typhoon destructive potential and global warming implications. Nat. Commun. 2015, 6, 7182. [Google Scholar] [CrossRef] [PubMed]
- Kieu, C.Q.; Moon, Z. Hurricane Intensity Predictability. Bull. Am. Meteorol. Soc. 2016, 97, 1847–1857. [Google Scholar] [CrossRef]
Figure 1.
Illustrations of two main domains (large boxes) in the WPAC and NATL basins in the CTL experiments, and three corresponding subdomains (small boxes) used in the sensitivity experiments. Filled contours denote the tropopause height (km).
Figure 1.
Illustrations of two main domains (large boxes) in the WPAC and NATL basins in the CTL experiments, and three corresponding subdomains (small boxes) used in the sensitivity experiments. Filled contours denote the tropopause height (km).

Figure 2.
The evolution of the area-averaged temperature profiles (solid lines) within a radius of 500 km from the model storm center that are obtained from the Hurricane Weather Research and Forecasting (HWRF) model with the August mean sounding in (a) the NATL basin, and (b) WPAC basin valid at (black), day (blue), days (green), days (orange), days (red), and 5 days (cyan). Thin lines denote the corresponding tropopause level in each experiments.

Figure 3.
Mean August 2013 sounding profiles for (a) the WPAC basin, and (b) the NATL basin at initial model time that are averaged over a domain given in Table 1 (see Figure 1 for visualization of the spatial domain); (c,d) same as (a,b) but with the relative humidity (RH) profiles of the input soundings switched.

Figure 4.
Time series of the HWRF-simulated minimum central pressure (dotted, hPa) and the maximum surface wind (solid, m s−1) for the WPAC-CTL experiment (black), the NATL-CTL experiment (blue), WPAC experiment with the NATL moisture profile (green), and the NATL experiment with the WPAC moisture profile (red).

Figure 5.
Hovmöller diagrams of the temperature anomaly at the center of the model vortex with respect to the far-field environment (shaded, unit K) for (a) WPAC-CTL; (b) NATL-CTL; (c) WPAC with the NATL moisture profile; and (d) NATL with the WPAC moisture profile. Contours are labeled on the color bar.

Figure 6.
Radius-height cross-sections through the center of the storm of the temperature anomaly (K, shaded) for (a) WPAC-CTL, (b) NATL-CTL, (c) WPAC-RH switched, and (d) NATL-RH switched experiments valid at h. Solid (dotted) line contours are positive (negative) values of radial (in-plane) wind with a contour interval of 5 m s−1, with contours also included.

Figure 7.
Horizontal cross sections of the mean temperature (shaded, K) averaged within a 75–50 hPa layer, and overlaid streamlines representing the upper-level inflow (black lines) in the same layer valid at days into integration for (a) NATL-CTL experiment; (b) WPAC-CTL experiment; (c) NATL-RH switching experiment; and (d) WPAC-RH switching experiment. Red streamlines denote the outflow averaged within the 150–100 hPa layer.
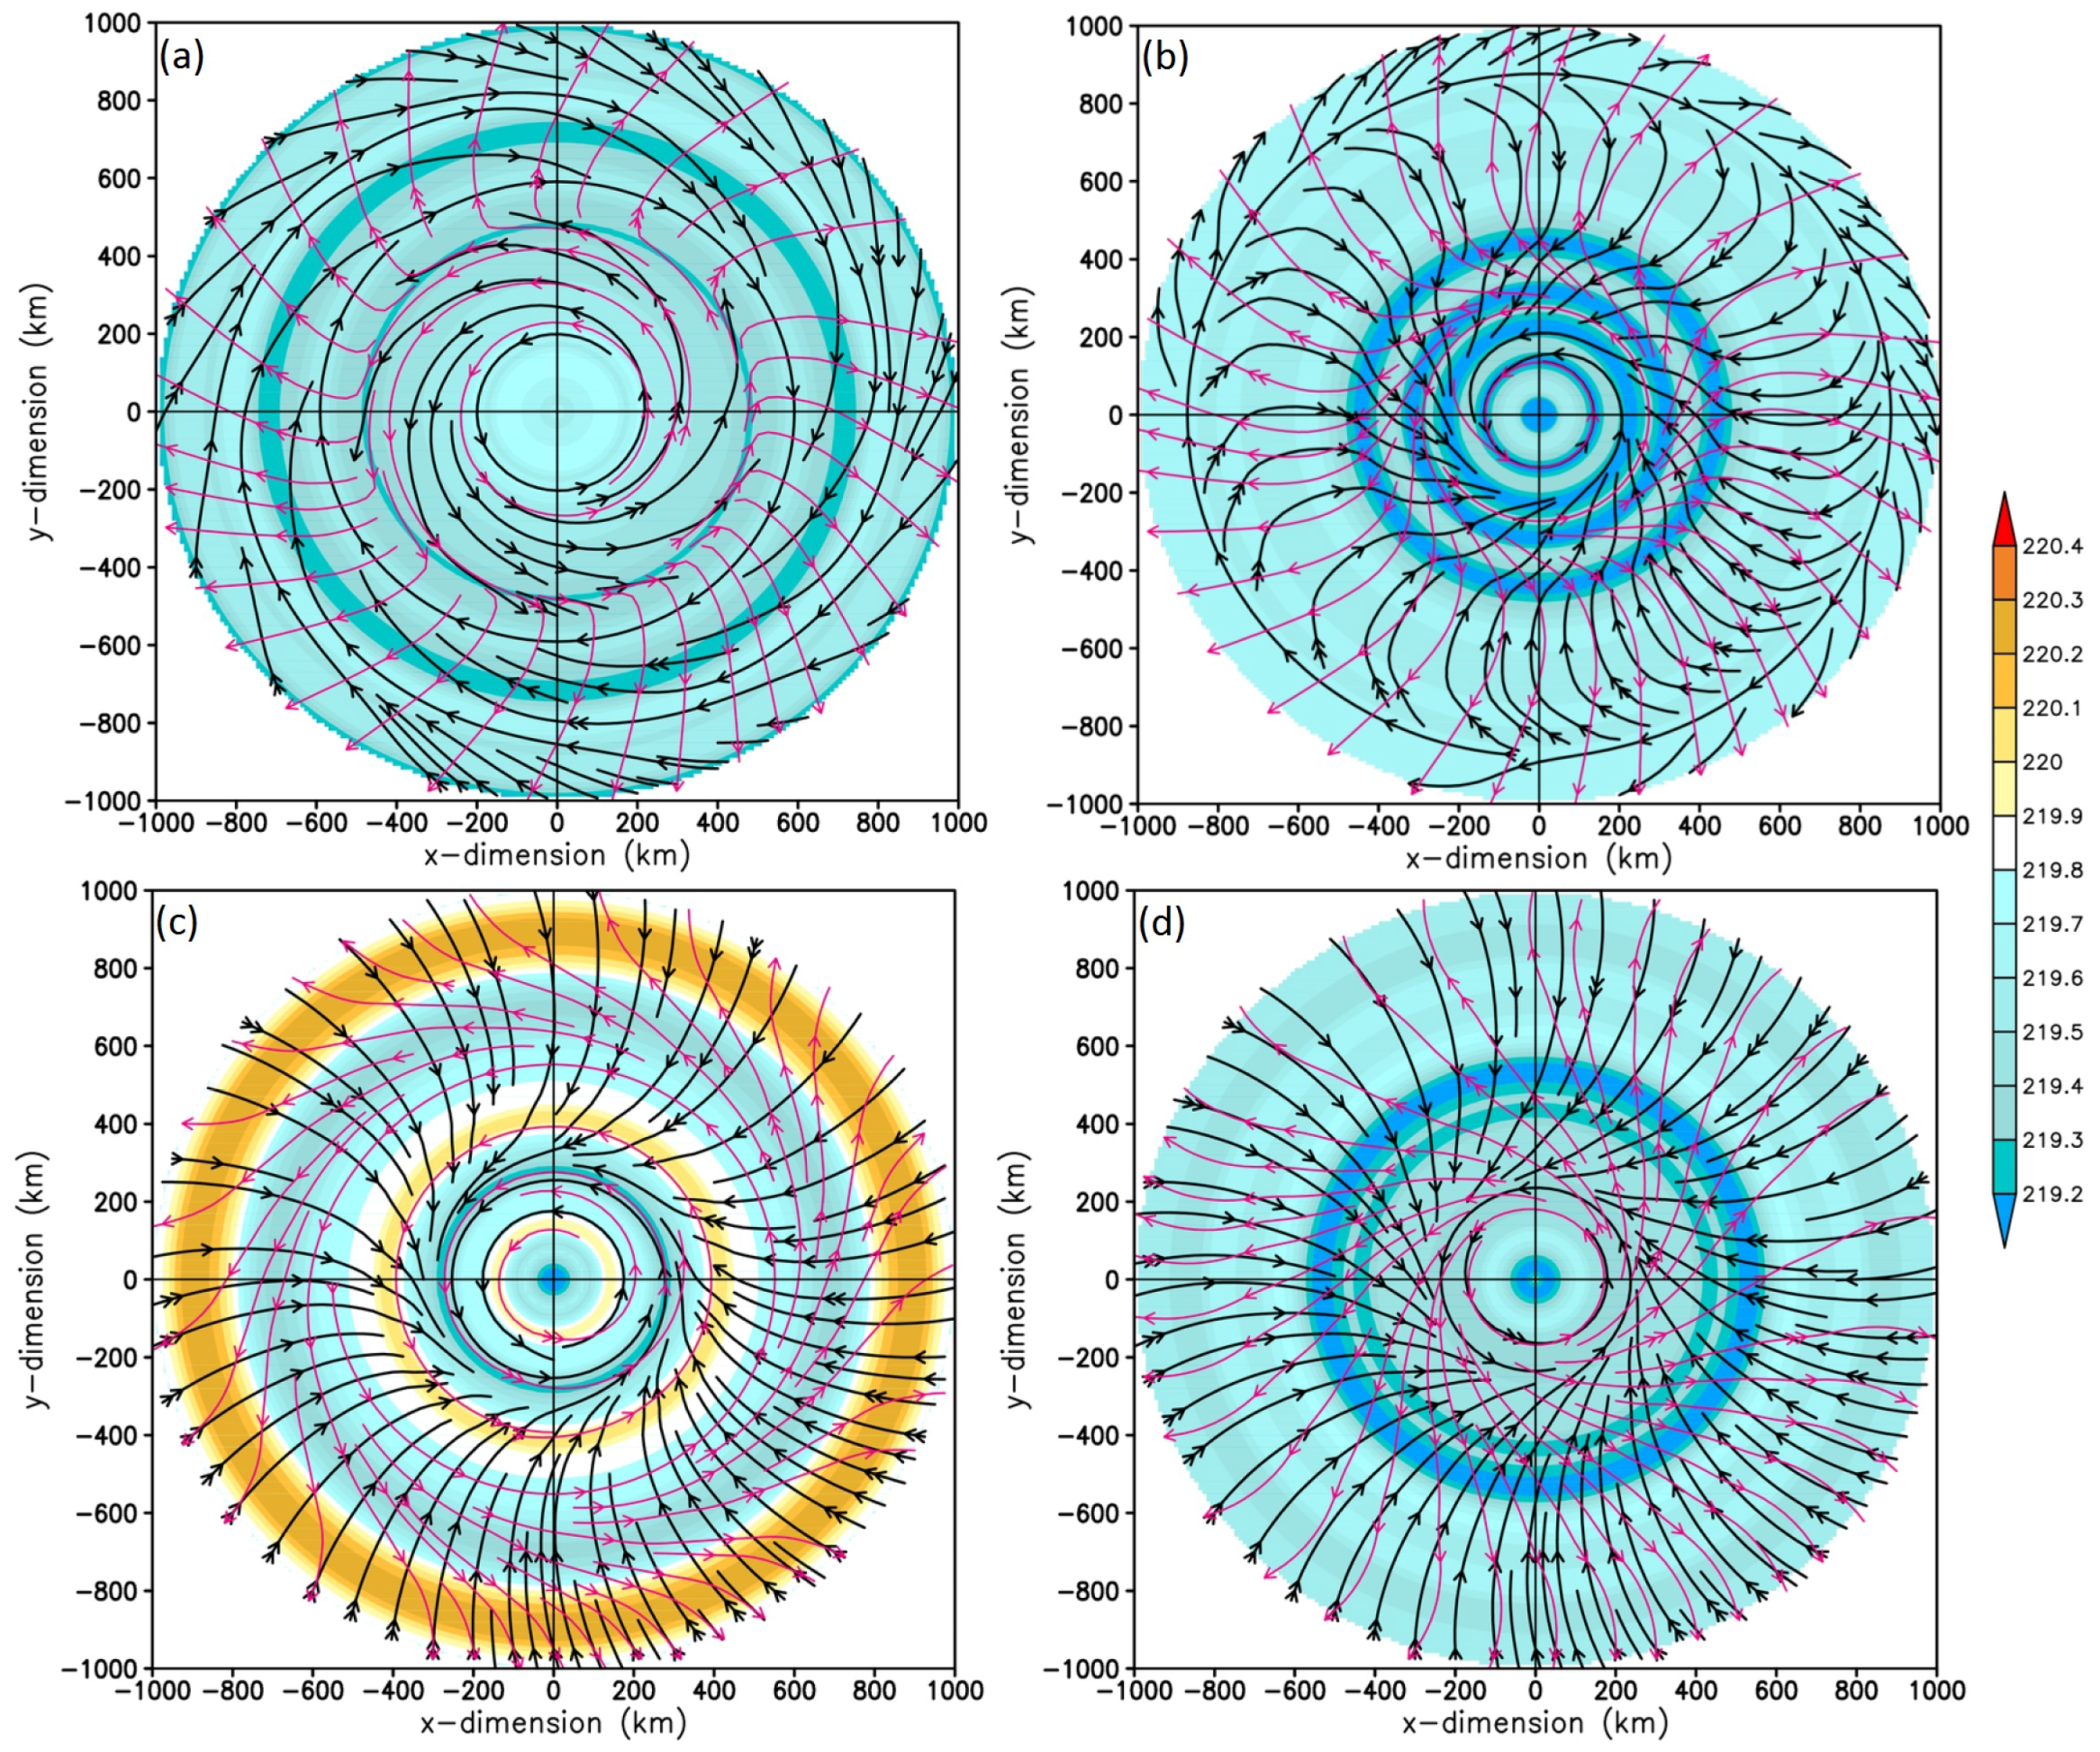
Figure 8.
As in Figure 4 but for the WPAC subdomain 1 (blue lines), subdomain 2 (green lines), and subdomain 3 (orange lines) experiments.
Figure 8.
As in Figure 4 but for the WPAC subdomain 1 (blue lines), subdomain 2 (green lines), and subdomain 3 (orange lines) experiments.
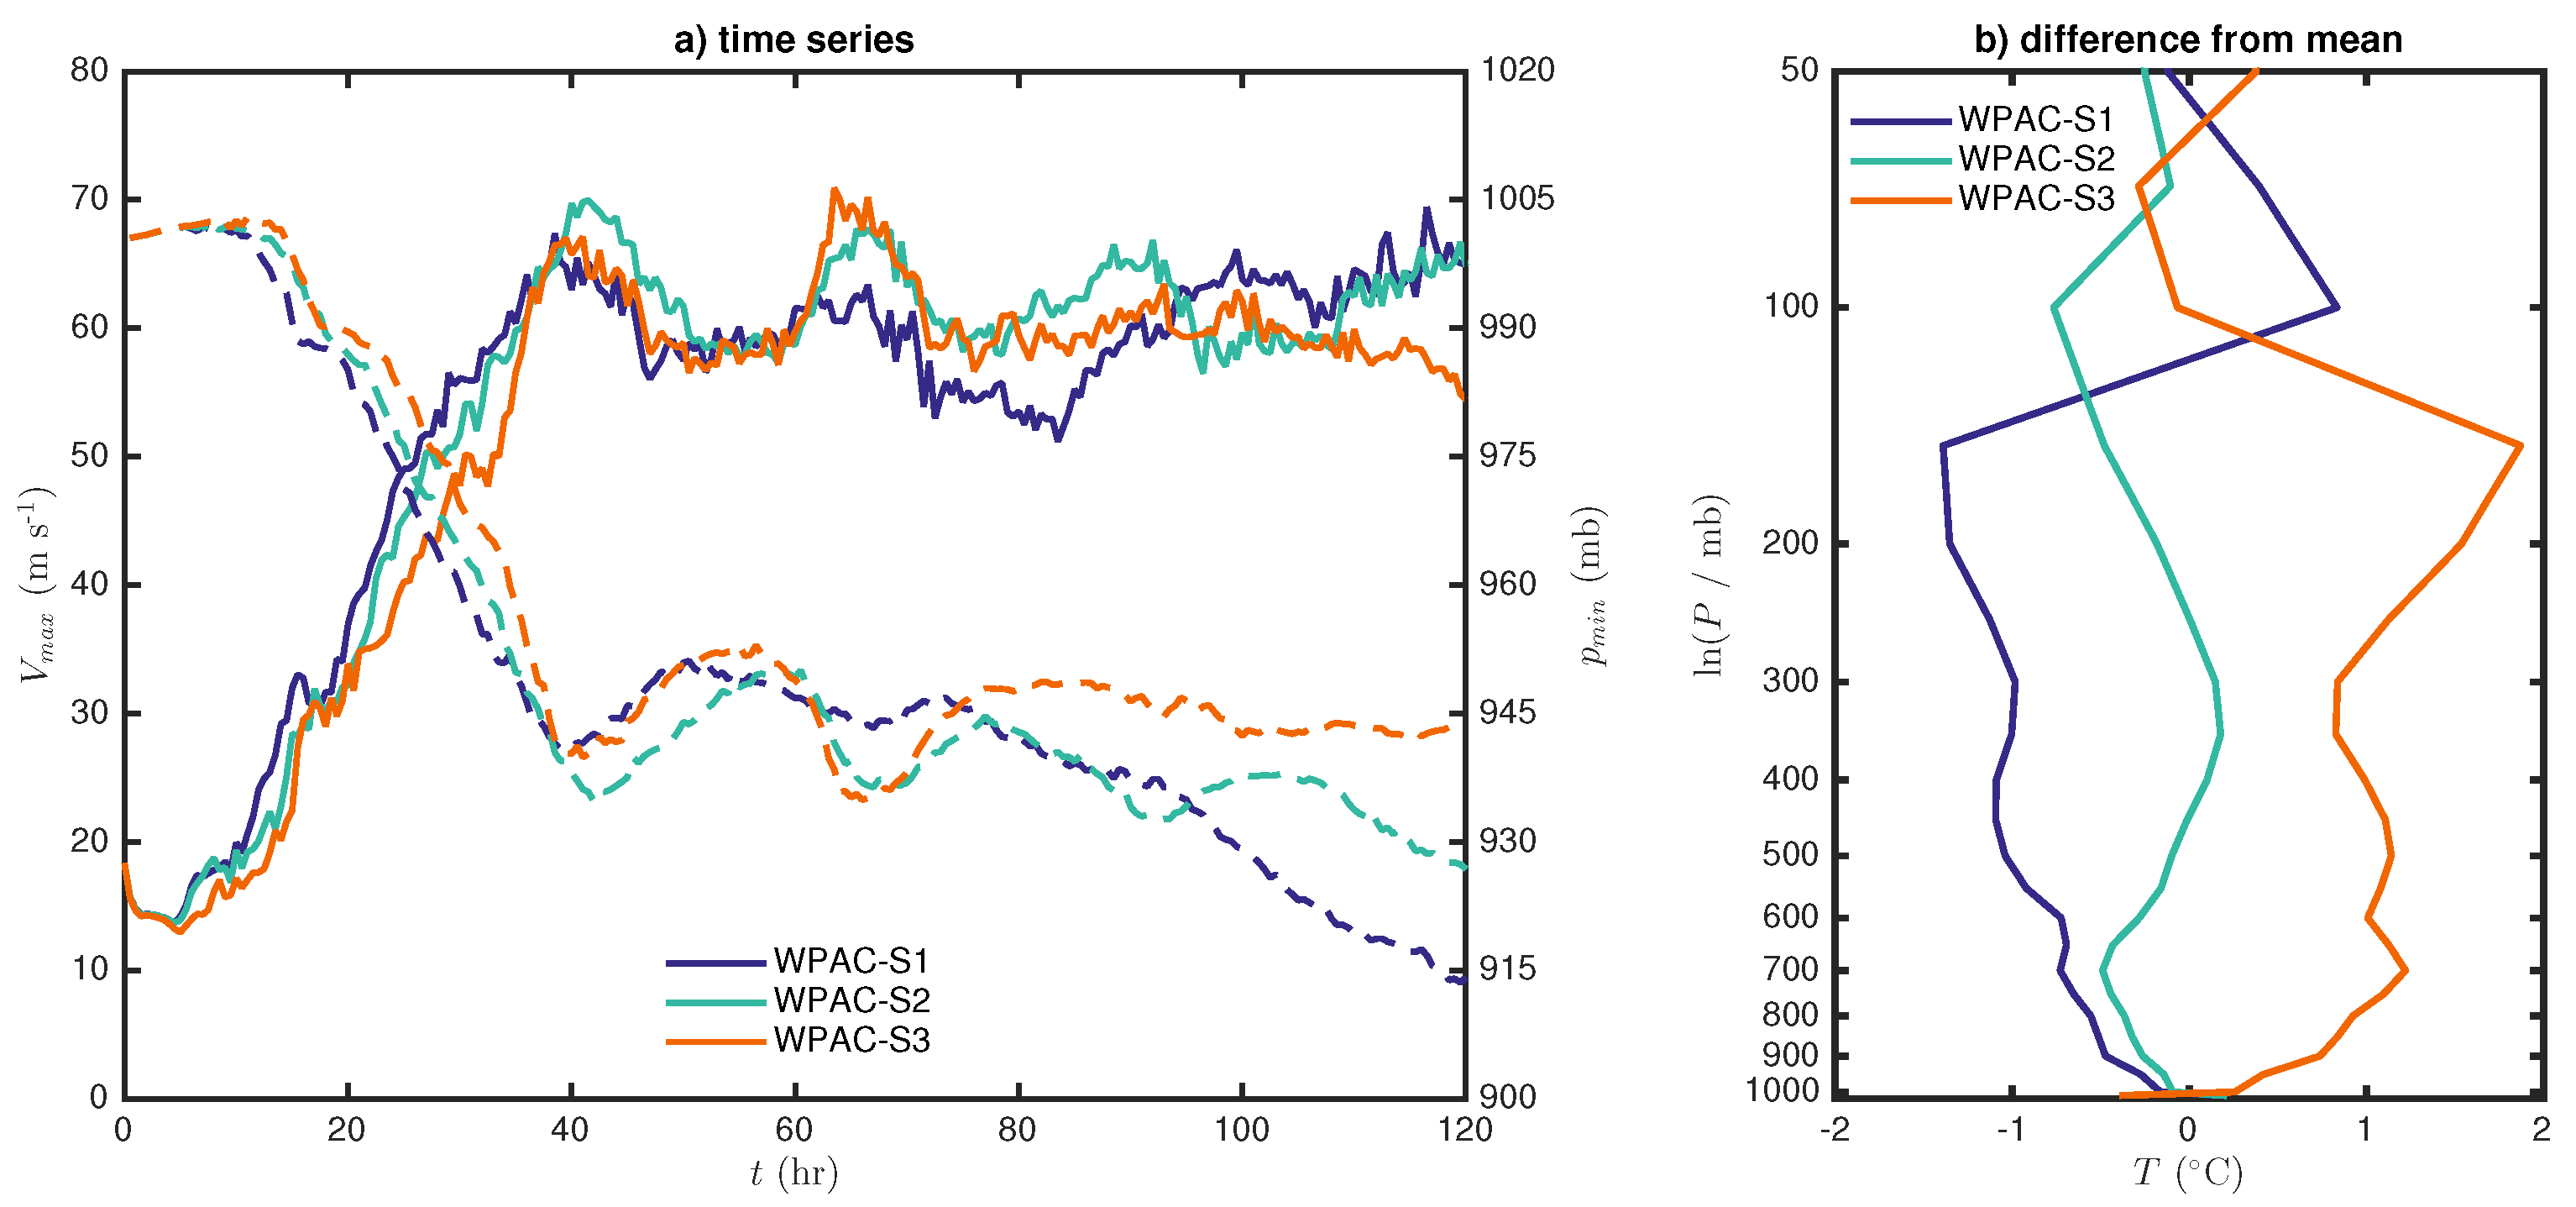
Figure 9.
As in Figure 5 but for the WPAC subdomain experiments.
Figure 9.
As in Figure 5 but for the WPAC subdomain experiments.

Figure 10.
As in Figure 4 and Figure 8 but for the NATL subdomain 1 (blue lines), subdomain 2 (green lines), and subdomain 3 (orange lines) experiments.
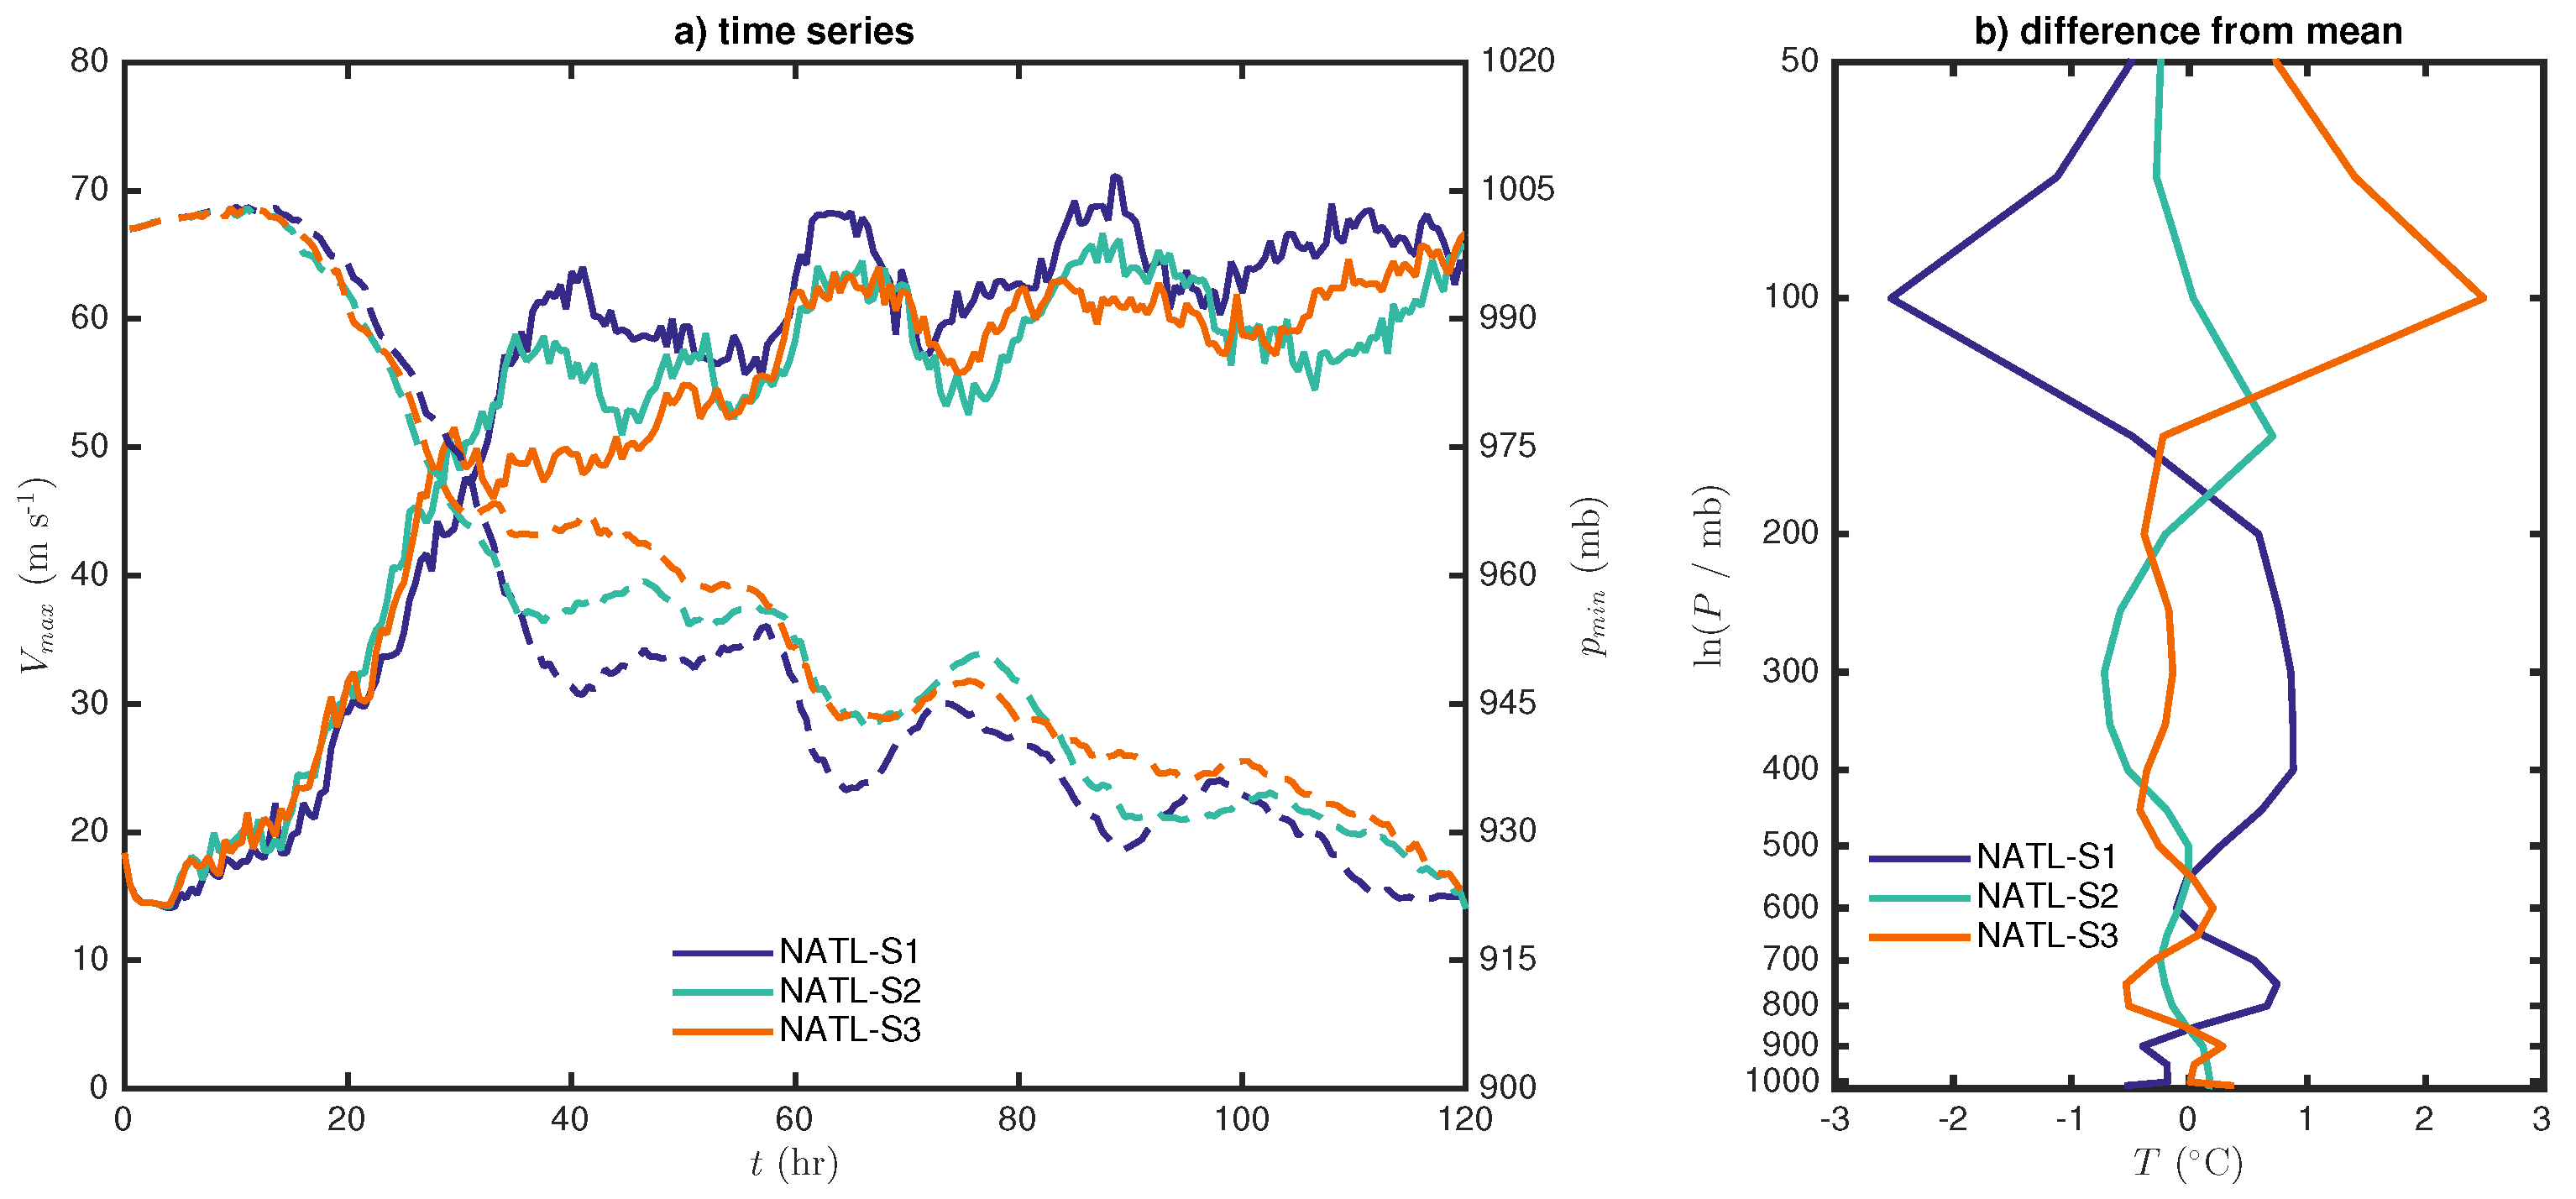

Figure 12.
(a) A range of initial soundings (solid lines) used in the set of experiments, and (b) dependence of the 1000-day mean maximum tangential wind on the mean stratospheric stratification . Dashed line denotes the linear best fit.
Figure 12.
(a) A range of initial soundings (solid lines) used in the set of experiments, and (b) dependence of the 1000-day mean maximum tangential wind on the mean stratospheric stratification . Dashed line denotes the linear best fit.
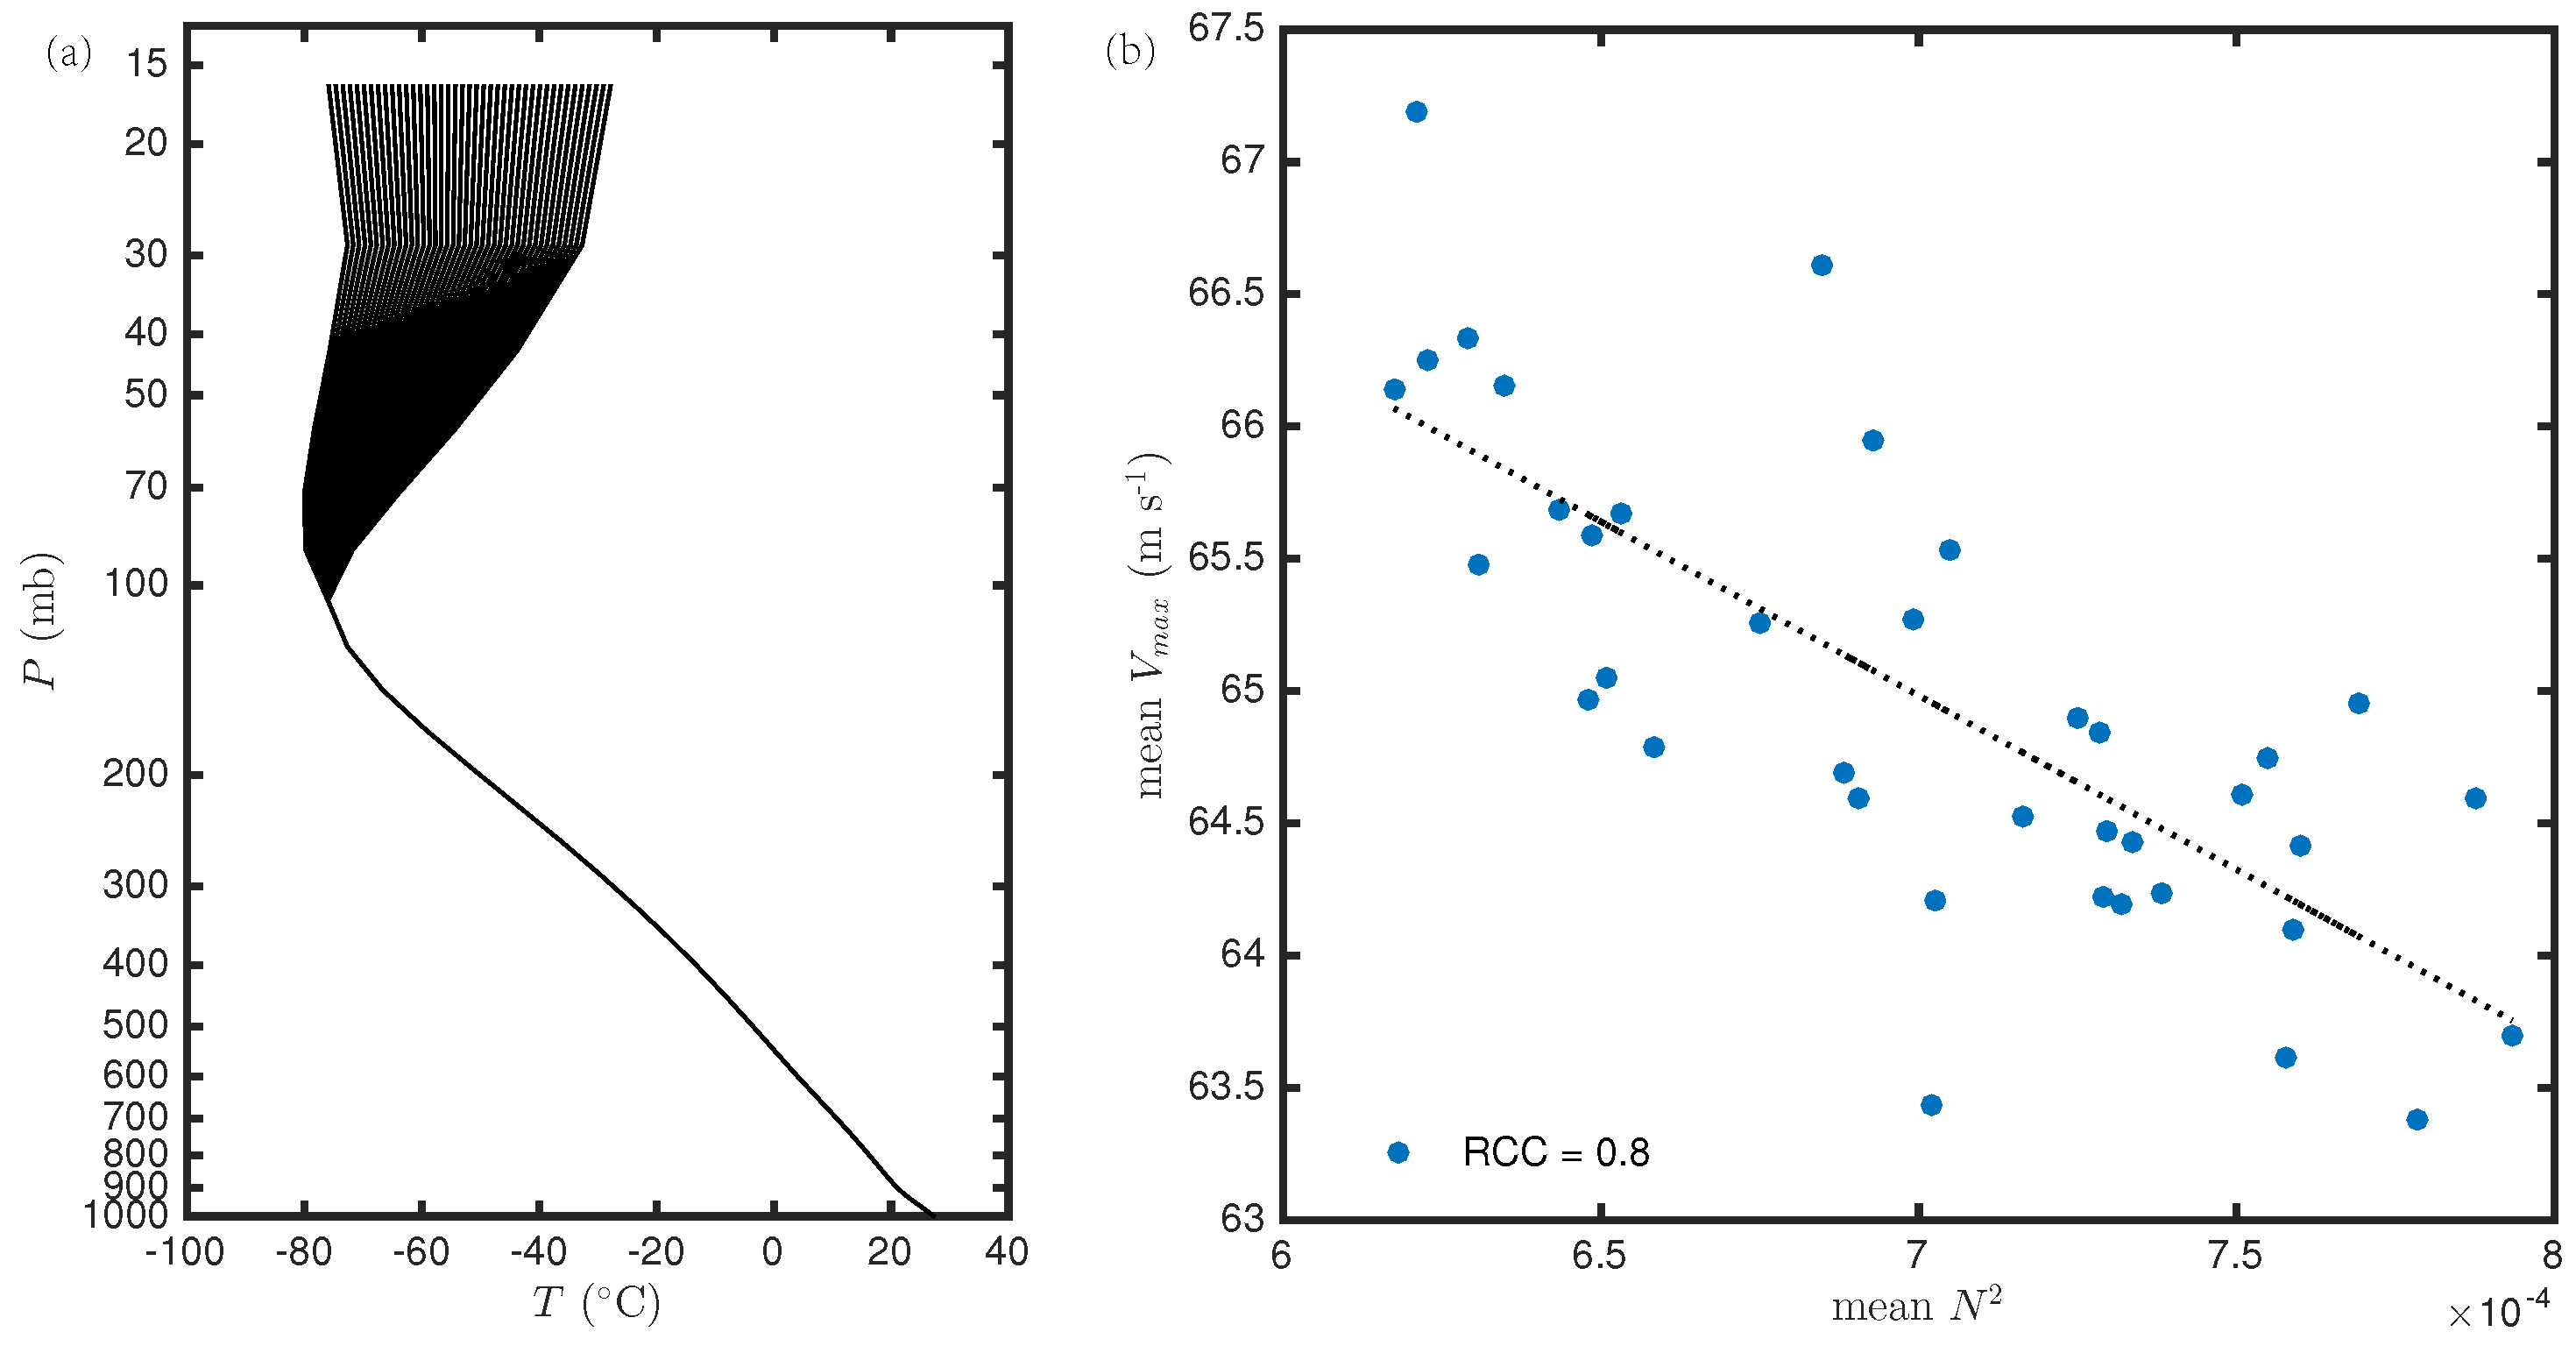
Figure 13.
(a) A range of initial soundings (solid lines) used in the tropopause height experiments with the RE model, and (b) the time series of as a function of simulation time during the first 5 days into integration. hm2 (hp2) denotes the experiment with the lowest (highest) tropopause level.
Figure 13.
(a) A range of initial soundings (solid lines) used in the tropopause height experiments with the RE model, and (b) the time series of as a function of simulation time during the first 5 days into integration. hm2 (hp2) denotes the experiment with the lowest (highest) tropopause level.


Table 1.
Control (CTL) experiments for the Northwestern Pacific (WPAC) and North Atlantic (NATL) basin, along with the relative humidity (RH)-switched experiments.
Table 1.
Control (CTL) experiments for the Northwestern Pacific (WPAC) and North Atlantic (NATL) basin, along with the relative humidity (RH)-switched experiments.
| Exp | Description | Domain |
|---|---|---|
| NATL-CTL | Control experiment for the North Atlantic basin | 15–35° N, 30–70° N |
| NATL-RH switching | Similar to the NATL-CTL exp but using the WPAC-CTL moisture profile | 15–35° N, 30–70° N |
| WPAC-CTL | Control experiment for the north Western Pacific | 15–35° N, 115–160° N |
| WPAC-RH switching | Similar to the WPAC-CTL exp but using the NATL-CTL moisture profile | 15–35° N, 115–160° N |
Table 2.
Basin subdomains and descriptions.
| Exp | Description | Domain |
|---|---|---|
| WS1 | WPAC subdomain 1 temperature profile, WPAC CTL moisture profile | 17–22° N, 145–150° E |
| WS2 | WPAC subdomain 2 temperature profile, WPAC CTL moisture profile | 19–24° N, 135–140° E |
| WS3 | WPAC subdomain 3 temperature profile, WPAC CTL moisture profile | 25–30° N, 125–130° E |
| NS1 | NATL subdomain 1 temperature profile, NATL CTL moisture profile | 17–22° N, 50–55° W |
| NS2 | NATL subdomain 2 temperature profile, NATL CTL moisture profile | 20–25° N, 60–65° W |
| NS3 | NATL subdomain 3 temperature profile, NATL CTL moisture profile | 25–30° N, 70–75° W |
Table 3.
Comparison of the theoretical maximum potential intensity (MPI) limit based on Bister and Emanuel (2002)’s calculation and the actual maximum intensity averaged from h to h obtained from the HWRF model simulations.
Table 3.
Comparison of the theoretical maximum potential intensity (MPI) limit based on Bister and Emanuel (2002)’s calculation and the actual maximum intensity averaged from h to h obtained from the HWRF model simulations.
| Exp | Theoretical MPI Limit | HWRF-Simulated Maximum Intensity |
|---|---|---|
| NATL-CTL | 80.3 | 64.3 |
| NATL-RH switching | 80.0 | 72.9 |
| WPAC-CTL | 74.3 | 61.9 |
| WPAC-RH switching | 74.6 | 60.1 |
© 2017 by the authors. Licensee MDPI, Basel, Switzerland. This article is an open access article distributed under the terms and conditions of the Creative Commons Attribution (CC BY) license (http://creativecommons.org/licenses/by/4.0/).
Share and Cite
MDPI and ACS Style
Moon, Z.; Kieu, C. Impacts of the Lower Stratosphere on the Development of Intense Tropical Cyclones. Atmosphere 2017, 8, 128. https://doi.org/10.3390/atmos8070128
AMA Style
Moon Z, Kieu C. Impacts of the Lower Stratosphere on the Development of Intense Tropical Cyclones. Atmosphere. 2017; 8(7):128. https://doi.org/10.3390/atmos8070128
Chicago/Turabian StyleMoon, Zachary, and Chanh Kieu. 2017. "Impacts of the Lower Stratosphere on the Development of Intense Tropical Cyclones" Atmosphere 8, no. 7: 128. https://doi.org/10.3390/atmos8070128
Note that from the first issue of 2016, this journal uses article numbers instead of page numbers. See further details here.