
Decomposition Kinetics of Non-Volatile Alkanes on Urban Aerosol

1
Department of Environmental Engineering, Democritus University of Thrace, 67100 Xanthi, Greece
2
Department of Petroleum and Natural Gas Engineering, Technological Institute of Kavala, 6400 Kavala, Greece
*
Author to whom correspondence should be addressed.
Atmosphere 2017, 8(5), 89; https://doi.org/10.3390/atmos8050089
Submission received: 22 March 2017
/
Revised: 16 May 2017
/
Accepted: 16 May 2017
/
Published: 19 May 2017
(This article belongs to the Special Issue Tropospheric Ozone and Its Precursors)
Abstract
:The decomposition kinetics of non-volatile n-alkanes that were collected in an urban environment were studied. The quartz filters that they were collected on were exposed in two reactors, in dark and natural light conditions, for four days. Ambient air that was passed through the reactors continuously, ensured a supply of exogenic oxidants to the surface of the filters. The lifetimes of the non-volatile n-alkanes were experimentally determined to be in the order of 3–6 days. The results from the light reactor exhibited approximately a 10% decrease in their lifetime. The results obtained for the prevailing atmospheric conditions and for the duration of the experiments, were in agreement with values from the literature.
1. Introduction
Particulate matter with aerodynamic diameter <2.5 μm (PM2.5) is deleterious to health and is associated with increased human morbidity and mortality [1]. The organic fraction of aerosol, when it is one of its main components and originates from combustion emissions, may affect human health directly, resulting in observed mutagenicity and carcinogenicity [2]. Organic aerosol also has the potential to significantly influence climate change [3,4]. Thus, a better understanding of the composition, decomposition kinetics, and transformation of aerosol in the atmosphere is of great importance in order to develop better emission control strategies. In the present study, however, we have concentrated on the non-volatile alkane’s fraction of urban PM2.5 aerosol.
Previously, we had established the concentrations and the possible sources of semi-volatile and non-volatile alkanes on PM2.5 aerosol, in the Athens urban atmosphere [5]. We had also established oxidation products of these semi- and non-volatile alkanes on urban aerosol, albeit, without being able to comment on their origin [6]. The kinetics of the above mentioned decomposition reactions and the molecular and physicochemical characteristics of the oxidation products are important parameters in the formation of new organic aerosol (OA) with different functionalities, or in the changes in the functionality of existing OAs.
Older studies regarding the lifetime and degradation of aerosol have been conducted on pure particles of known concentration under controlled conditions in the laboratory [7]. Recently, another group investigated the heterogeneous photochemical reaction of ozone with anthracene adsorbed on mineral dust [8]. Anthracene was adsorbed on particles by the impregnation method and O3 was generated by a homemade quartz O3 generator. Another study [9] presented and compared the oxidation kinetics of octacosane and squalane as pure hydrocarbon particles that were formed via homogeneous nucleation. However, due to the fact that ambient aerosol has a very complex chemical composition, the results of these studies may not fully correspond to real ambient conditions. These, and other, studies in laboratory reactors may give an insight into the OH uptake coefficients, the mechanisms of heterogeneous reactions in the gaseous phase near the aerosol surface, and/or the heterogeneous reactions of the gaseous oxidants directly on the aerosol surface. However, these kind of attempts to model the ambient kinetics of aerosol oxidation may or may not help to represent the real ambient conditions [10]. The projected life time of non-volatile alkanes, if one assumes OH uptake coefficient α = 0.1 in this latter study, when applied to the modelled results, gives a better estimation of lifetimes, in the order of 100 h.
The master chemical mechanism, as used and described in the literature [11,12,13], does not involve non-volatile alkanes even though their contribution to O3 production may be minimal, yet unknown.
To shed light on the kinetic and mechanistic behavior of non-volatile alkanes on PM2.5 from a provincial city center, a sampling campaign was organized for Xanthi, Greece, between September 2014 and November 2014 (three samples were examined). The sampling took place near the “breathing zone” (with the sampler positioned 2.5 m above ground level) in the center of the city, where thousands of people move and work on a daily basis. By apportioning the biogenic and anthropogenic origins of the alkanes, it was envisaged to formulate mitigation policies for a city center with a polluted atmosphere. Furthermore, it was anticipated that by determining the products of atmospheric processes in the urban environment, to start determining “near real-time” reaction pathways, even though advection of pollutants from the sampling point may hamper these efforts. A further complication to the above efforts is the limitation of our understanding of heterogeneous reaction pathways and reaction kinetics, especially on non-characterized “real” surfaces. The importance of quantitative determination of the homologous series and all organic compounds of the aerosol organic fraction in an urban environment is evident, if one considers that there exists the possibility of unlocking unknown reaction pathways and kinetics. The latter will assist in obtaining atmospheric lifetimes of certain pollutant compounds and, hence, their transport and dispersion scenarios. The decomposition kinetics would also assist in modelling the dispersion of the sampled alkanes after their lifetimes have been established. Formation or decomposition kinetics could also be established for the new products originating from the decomposition of the original urban aerosol. It is unknown if these products are more deleterious to human health, or not.
The detailed objectives of the present study are to obtain the decomposition kinetics of the non-volatile alkanes contained in real urban aerosol, after collecting and exposing them to natural light and dark conditions. In this way the shortcomings of studying artificial aerosol of known composition in reaction chambers are avoided because real aerosol is used. Pseudo first order reaction kinetics are envisaged to be studied since the concentrations of all oxidant radicals are unknown and in far greater concentrations than the individual alkanes under study. Furthermore, the experiments are planned to take place under the prevailing atmospheric conditions, in the area of aerosol collection. A shortcoming of the present study is that the decomposition kinetics are studied on aerosol collected on quartz fiber filter paper.
2. Experiments
2.1. PM2.5 Collection, Exposure in Reactors, and Ancillary Measurements
In an effort to study the aerosol alkanes decomposition kinetics under near normal conditions, urban aerosol was collected on preconditioned, at 500 °C, quartz fiber filters (8 inches × 10 inches, Whatman International Ltd., Middlesex, UK) of a high volume PM2.5 sampler (TE-6001-2.5-I, Tisch Environmental Inc., Village of Cleves, OH, USA). Two identical reaction boxes, both having their upper surface covered with quartz glass (glass No 9754, Corning Ltd, Bagneaux-sur-Loing, France) were employed for the experiment. The boxes were constructed from polycarbonate glass and had a total volume of 2.1 L. All surfaces were painted black, except the top surface, which was covered by the transparent quartz glass. One reactor box was kept in darkness by covering it with aluminium foil. Ambient air passing through the HEPA-VENT™ filter (Whatman International Ltd., Middlesex, UK), at a flow of ca. 1.5 L·min−1 was swept through the box and the flow was controlled by Sierra 810C-DR3 mass flow controllers (Sierra Instruments, Inc., Monterey, CA, USA). At this flow, the Reynold’s number was calculated to be 50, ensuring a laminar flow, albeit in the absence of a diffusion mesh, in order to minimize gaseous losses. In each box a PT100 thermometer, positioned vertical to the flow, determined the temperature at 1 min intervals. The light permeability of the quartz glass top was experimentally determined by placing the CUV3 radiometer and CMP6 pyranometer (Kipp and Zonen, Delft, The Netherlands) outside and inside the box, alternately, every hour of two chosen days in different seasons and, hence, for different sun zenith angles. The mean percent radiation that passed through the quartz glass was found, by the pyranometer, to be 96% ± 2%.
During the experiments the incoming radiation was continuously recorded by the radiometer and the pyranometer, which were placed in the vicinity of the “reactor” boxes. All ancillary parameters were recorded by a CR10X datalogger (Campbell Scientific, Inc., Logan, UT, USA). A DOAS instrument for the continuous determination of O3, NOx, SO2 and NO2 was also employed in the area of the reactor experiments (SANOA; Environment S.A., Poissy, France). Data were downloaded weekly from the instrument’s computer and used for post experiment assessment. All the above data are presented in Table 1.
The loaded PM2.5 filters were cut into eight equal pieces and two of the 1/8th pieces were analyzed immediately. Of the remaining six pieces, 1/8 of the pieces were placed in the reactor boxes, three in each. Each 1/8 piece of filter from the photo- and dark reactors were analyzed after 1, 2, and 4 days. Experiments were repeated at different times of the year.
2.2. Materials, Extraction, and Analyses
Solvents of Suprasolv grade and silica gel of 230–400 mesh (Merck KGaA, Darmstadt, Germany) were used. The n-alkanes standard mixture consisted of C8 to C40 homologues including phytane and pristane was obtained from Chiron (Chiron AS, Trondheim, Norway). 1-chlorohexadecane (Sigma-Aldrich Chemie GmbH, Buchs, Switzerland) was used as the internal standard. Silica gel and cotton wool were soxhlet-extracted with methanol–acetone and twice with dichloromethane for 24 h before use. All glassware were intensively cleaned and baked at 500 °C for 6 h. Prior to their use, quartz filters were baked at 500 °C for 6 h to eliminate potentially existent organics. Following that, they were stored in aluminum foil packages until their use for sampling.
Samples were extracted in a sonicator bath with dichloromethane 2 × 15 mL × 20 min and then with added methanol 2 × 15 mL × 20 min. In total the final aliquot was 60 mL of mixed solvent and the sonication lasted 80 min. The solvent was evaporated almost to dryness with a rotary evaporator and finally to dryness with the use of a mild flow of nitrogen. The conical flasks were kept at −18 °C and in darkness, until analysis. Each extract was fractionated into compound functionality classes (aliphatic hydrocarbons, polycyclic aromatic hydrocarbons, carbonyl compounds, n-alkanols, fatty acids) using flash chromatography. A 30 × 1 cm column containing 1.5 g of activated silica gel (activated at 150 °C for 3 h) and three solvents of increasing polarity were used to provide three fractions of the extract. i.e., 15 mL hexane for the 1st fraction (aliphatic hydrocarbons), 9.6 mL hexane + 5.4 mL toluene—for the second fraction (PAH) and 7.5 mL hexane + 7.5 mL DCM—for the third fraction (aldehydes and ketones). This study is focusing in the aliphatic fraction of PM2.5. The first fraction was rotary evaporated to dryness with nitrogen and immediately analyzed after the addition of 40 μL of internal standard at 50 ppm (1-chlorohexadecane) and 160 μL methanol.
Analyses of all samples was carried out on a Trace 1300 Series gas chromatograph (GC) interfaced to a DFS™ Magnetic Sector (Thermo Fisher Scientific, Bremen, Germany) with 1 μL injection. Helium was used as the carrier gas with a head pressure 5 kPa and a carrier flow 1 mL·min−1. A Thermo Scientific™ TRACE TR-5MS GC Column (30 m, internal diameter 0.25 mm, film thickness 0.1 μm, Thermo Fisher Scientific, Bremen, Germany) was coupled to the ion source. A 51-min program was set in the GC. The program included: (1) an isothermal hold for 1 min at 60 °C; (2) a temperature ramp of 6 °C·min−1 up to 300 °C; and (3) a final isothermal hold of 10 min. The electron impact ionization mode conditions were: ion energy 70 eV; ion source temperature 300 °C; and a mass scan range of 50–500 amu. Relative response factors were calculated for each individual compound.
3. Results
The alkane compounds that were examined in the present experiments are tabulated in Table 2. They were the most commonly appearing compounds in the three collected samples and, hence, their kinetic fate was followed in the three experiments. Their mass concentration, or more appropriately their availability for oxidation on the aerosol surface, in comparison with the atmospheric concentration of the major radical oxidants (e.g., NO3, OH, Cl) indicate that pseudo-first-order reaction kinetics is the most likely decomposition pathway.
The fundamental reaction kinetics equation was used, whereby:
where “Alkane j” is the concentration of the alkane under study after time t and “Alkane j0” is its initial concentration. The k1 for each alkane resulted from the slope of the plot of ln (Cj/Cj0) versus time. Half-life (t1/2) is the time required for the concentration of a reactant to fall to one-half of its original value, whereas lifetime τ is defined as the time taken for the concentration of a reactant to fall to 1/e of its initial value.
ln[Alkane j/Alkane j0] = −k1 t,
τ = 1/k1,
t1/2 = ln(2)/k1,
Having experimentally obtained k1 (see Figure 1), the pseudo-first-order decomposition constants, the half-lives, and lifetimes of the n-alkanes under study and for the ambient conditions that the experiments were carried out, were established. Table 3 lists the results for the three sampling and reaction periods in the photoreactor and Table 4 lists the results for the parallel dark reactor experiments. The ambient O3, NO2, and SO2 concentrations listed in Table 1, were obtained from the integration of the DOAS values. Whilst, the average diurnal concentrations of OH can be assumed to be constant at the value of 5 × 10⁶ molecules·cm−3 for a suburban area [16], the total concentration of oxidizing radicals was not possible to determine in this experiment.
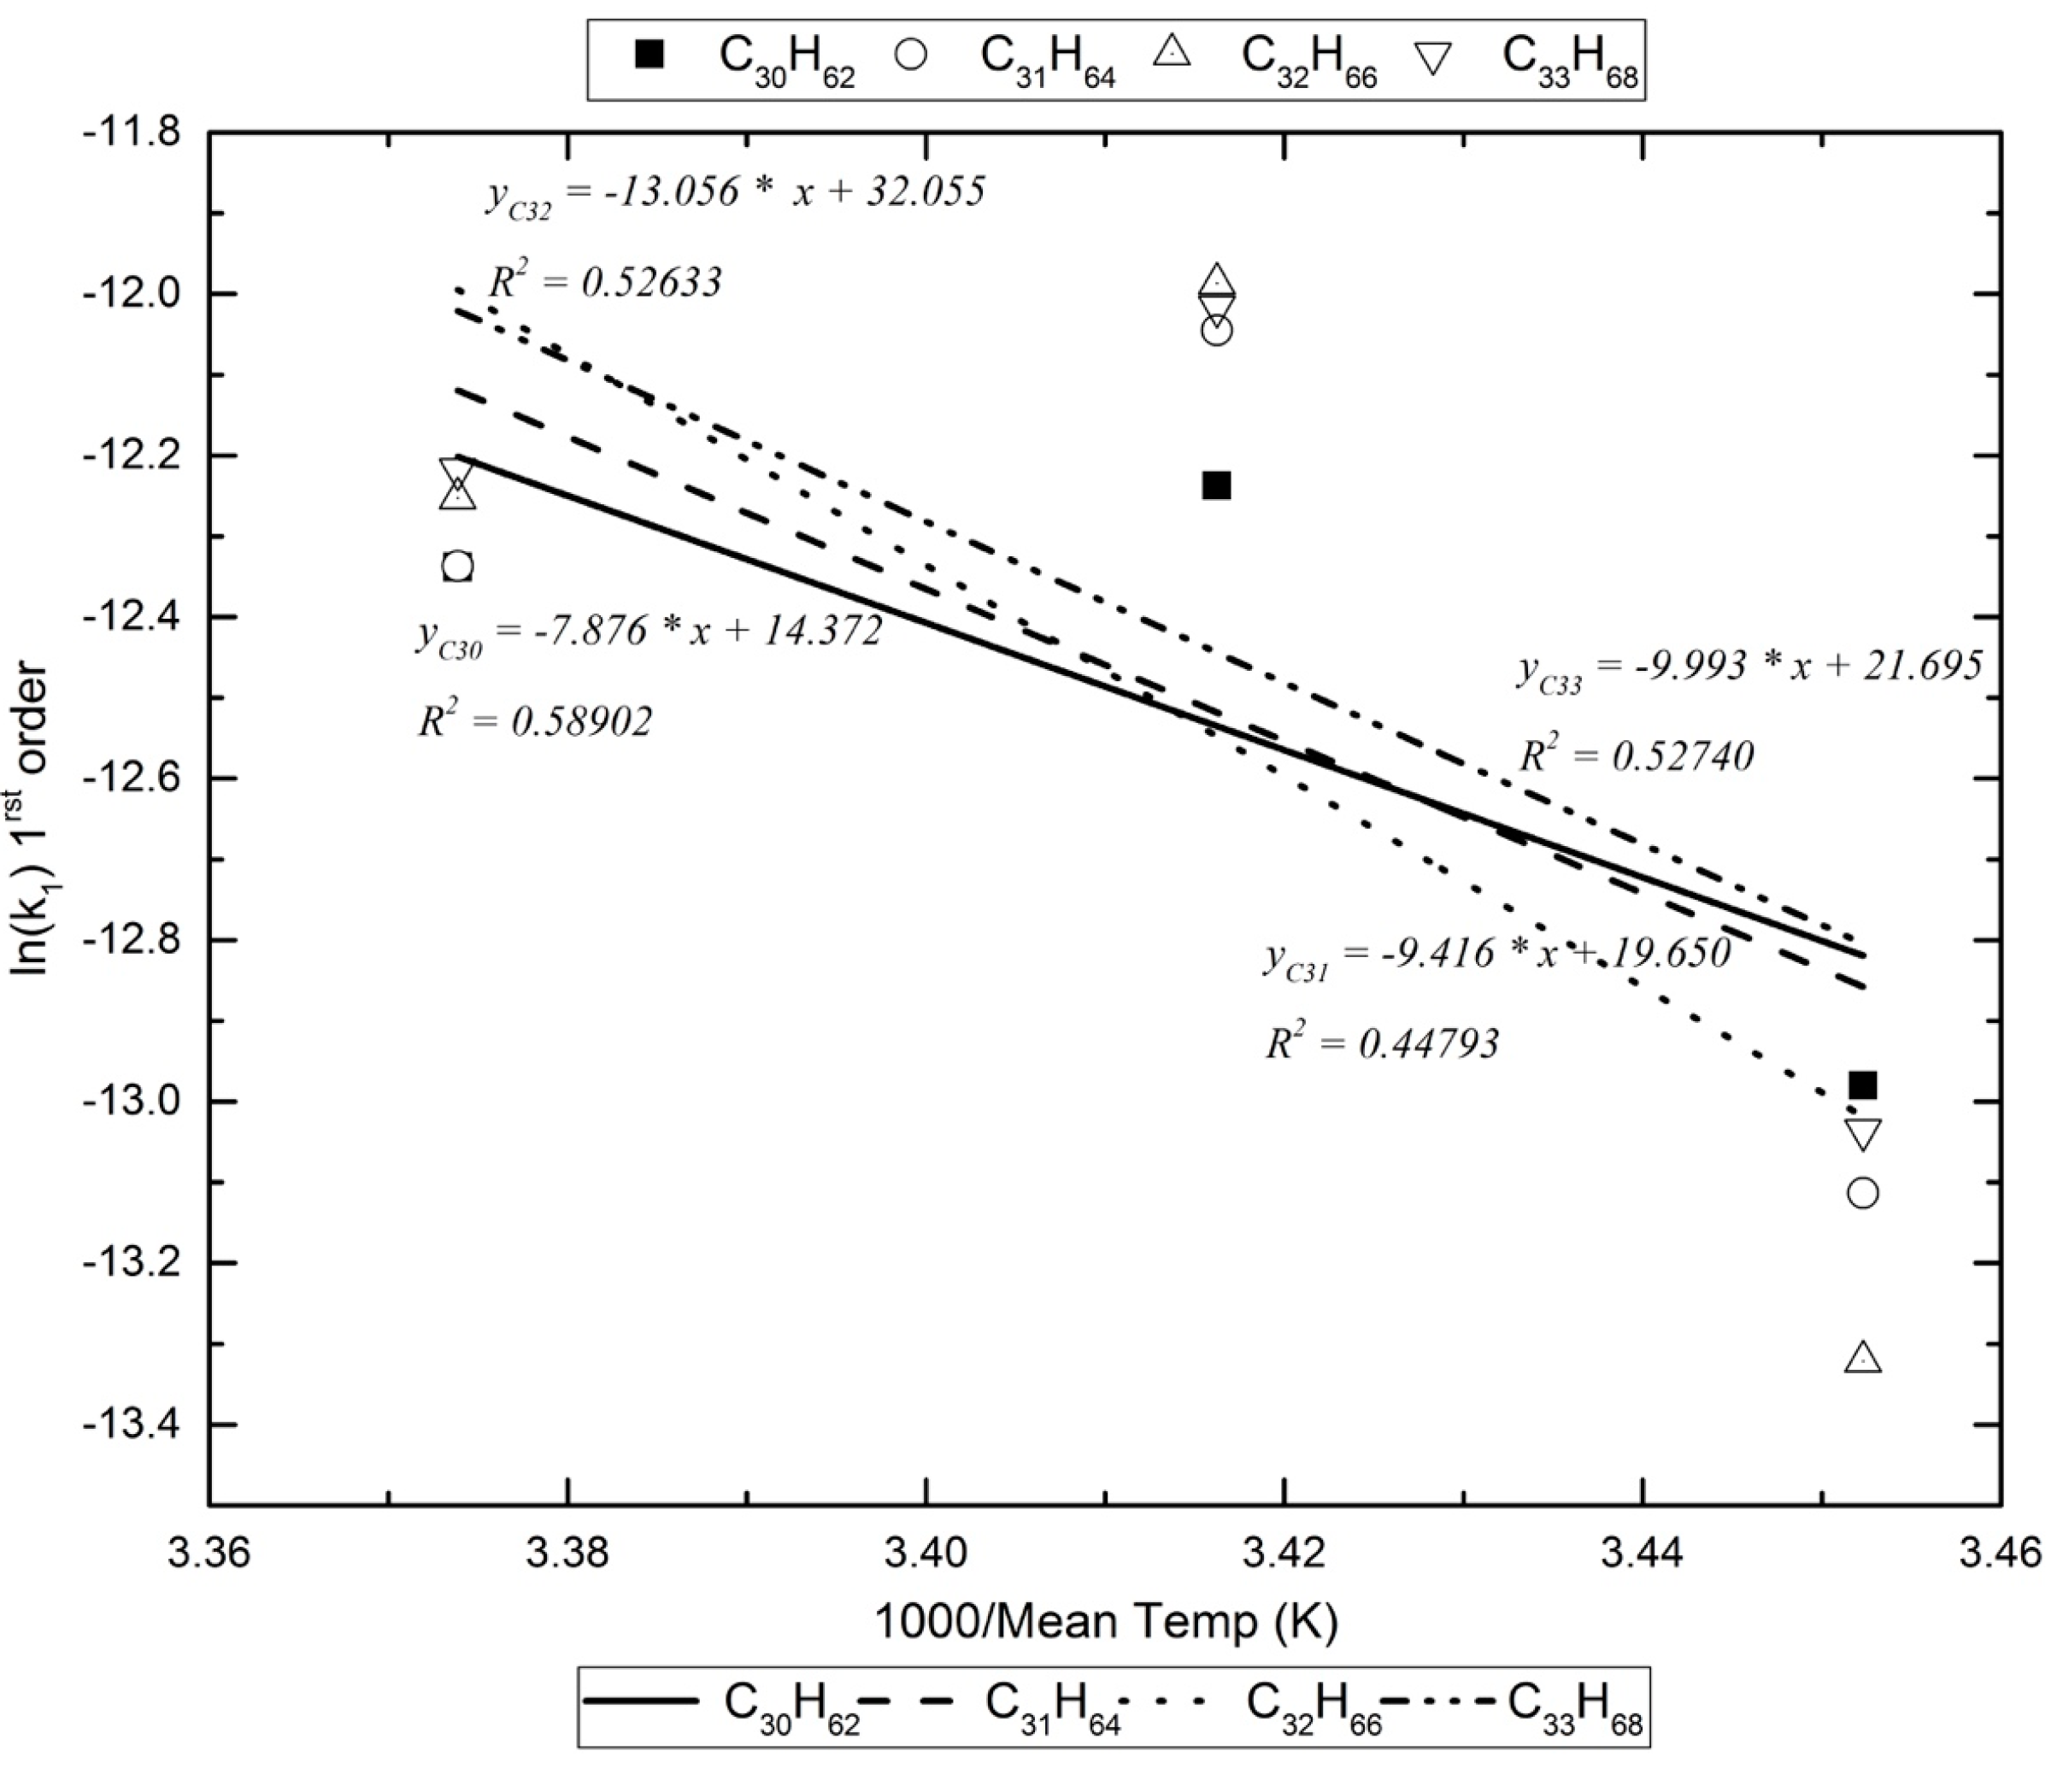
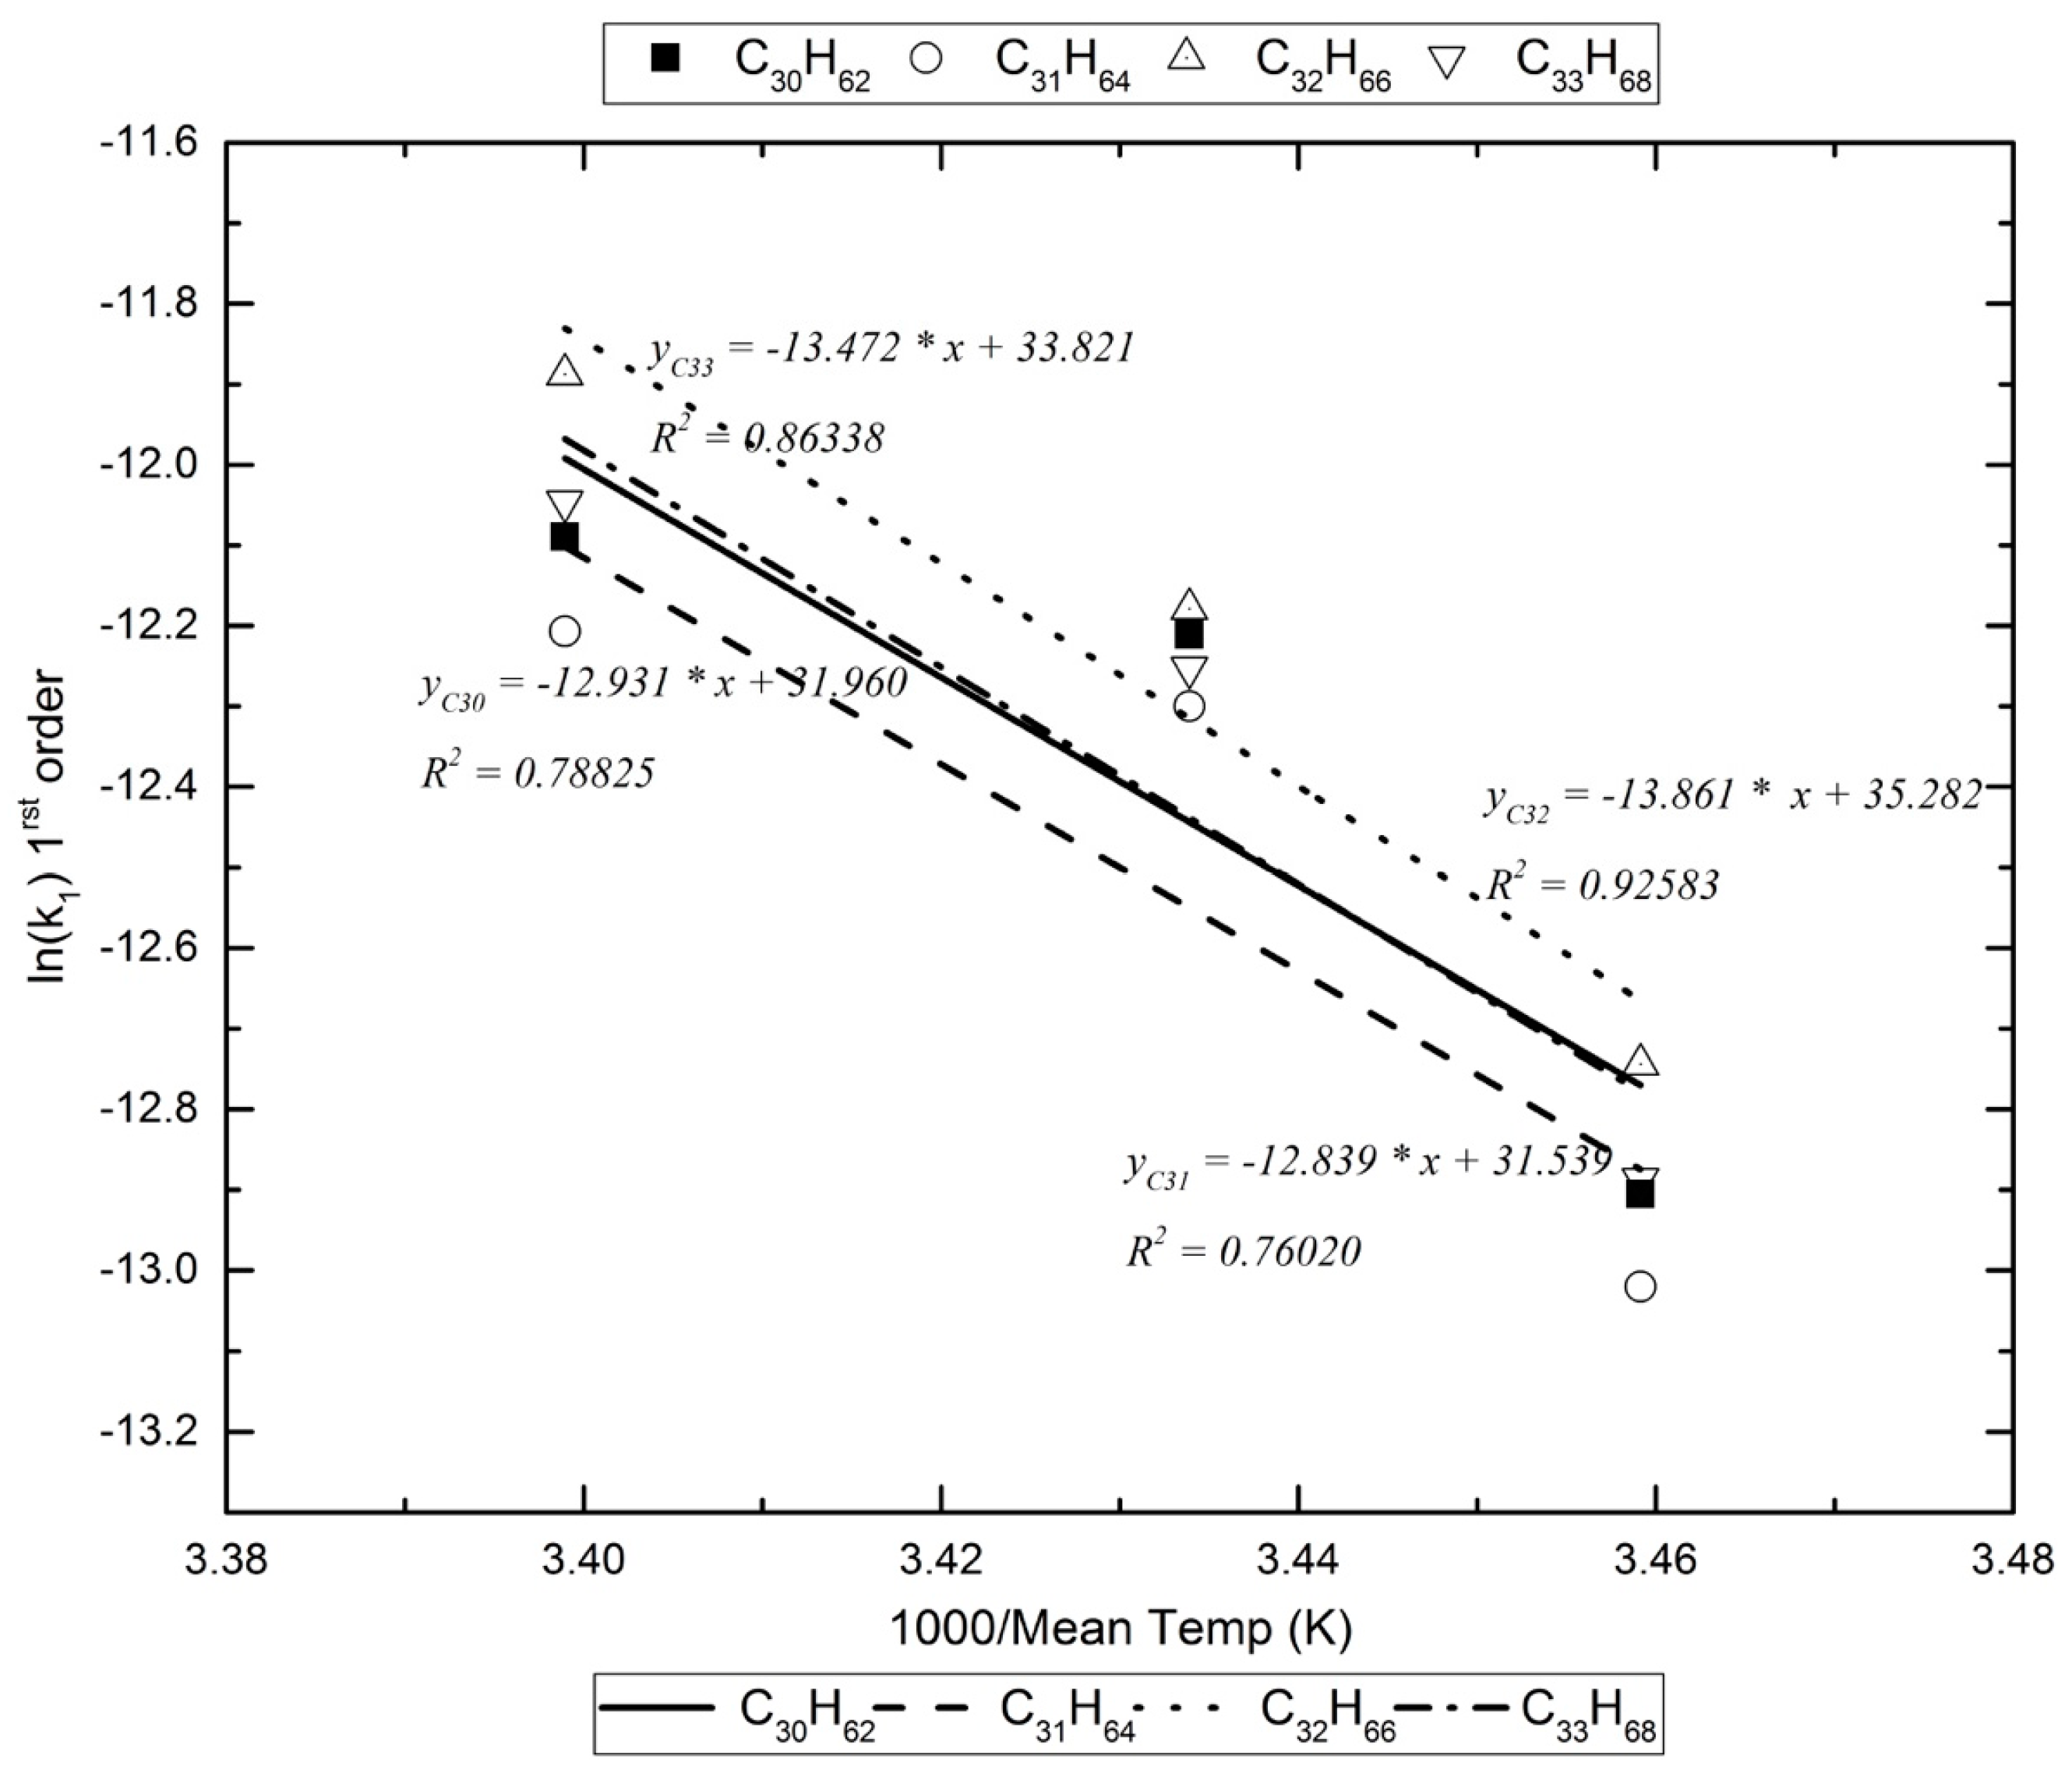
Furthermore, given that the experiments were carried out at different ambient conditions, the mean temperatures were found to differ by at least 10 K. Hence, an attempt to obtain Arrhenius plots for this limited temperature range was made. Examples of these plots are presented in Figure 2 and Figure 3.
Assuming that, in the photoreactor, the reactants with the alkanes are exogenic free radicals and free radicals formed inside the box, Table 5 lists the activation energy for the pseudo-first-order reaction kinetics (vide infra). For the dark reaction box, assuming that only exogenic oxidants react with the alkanes (O3 reacts extremely slowly with alkanes [17]), the activation energy for the pseudo-first-order kinetics are calculated as in Figure 3 and are listed in Table 6.
4. Discussion
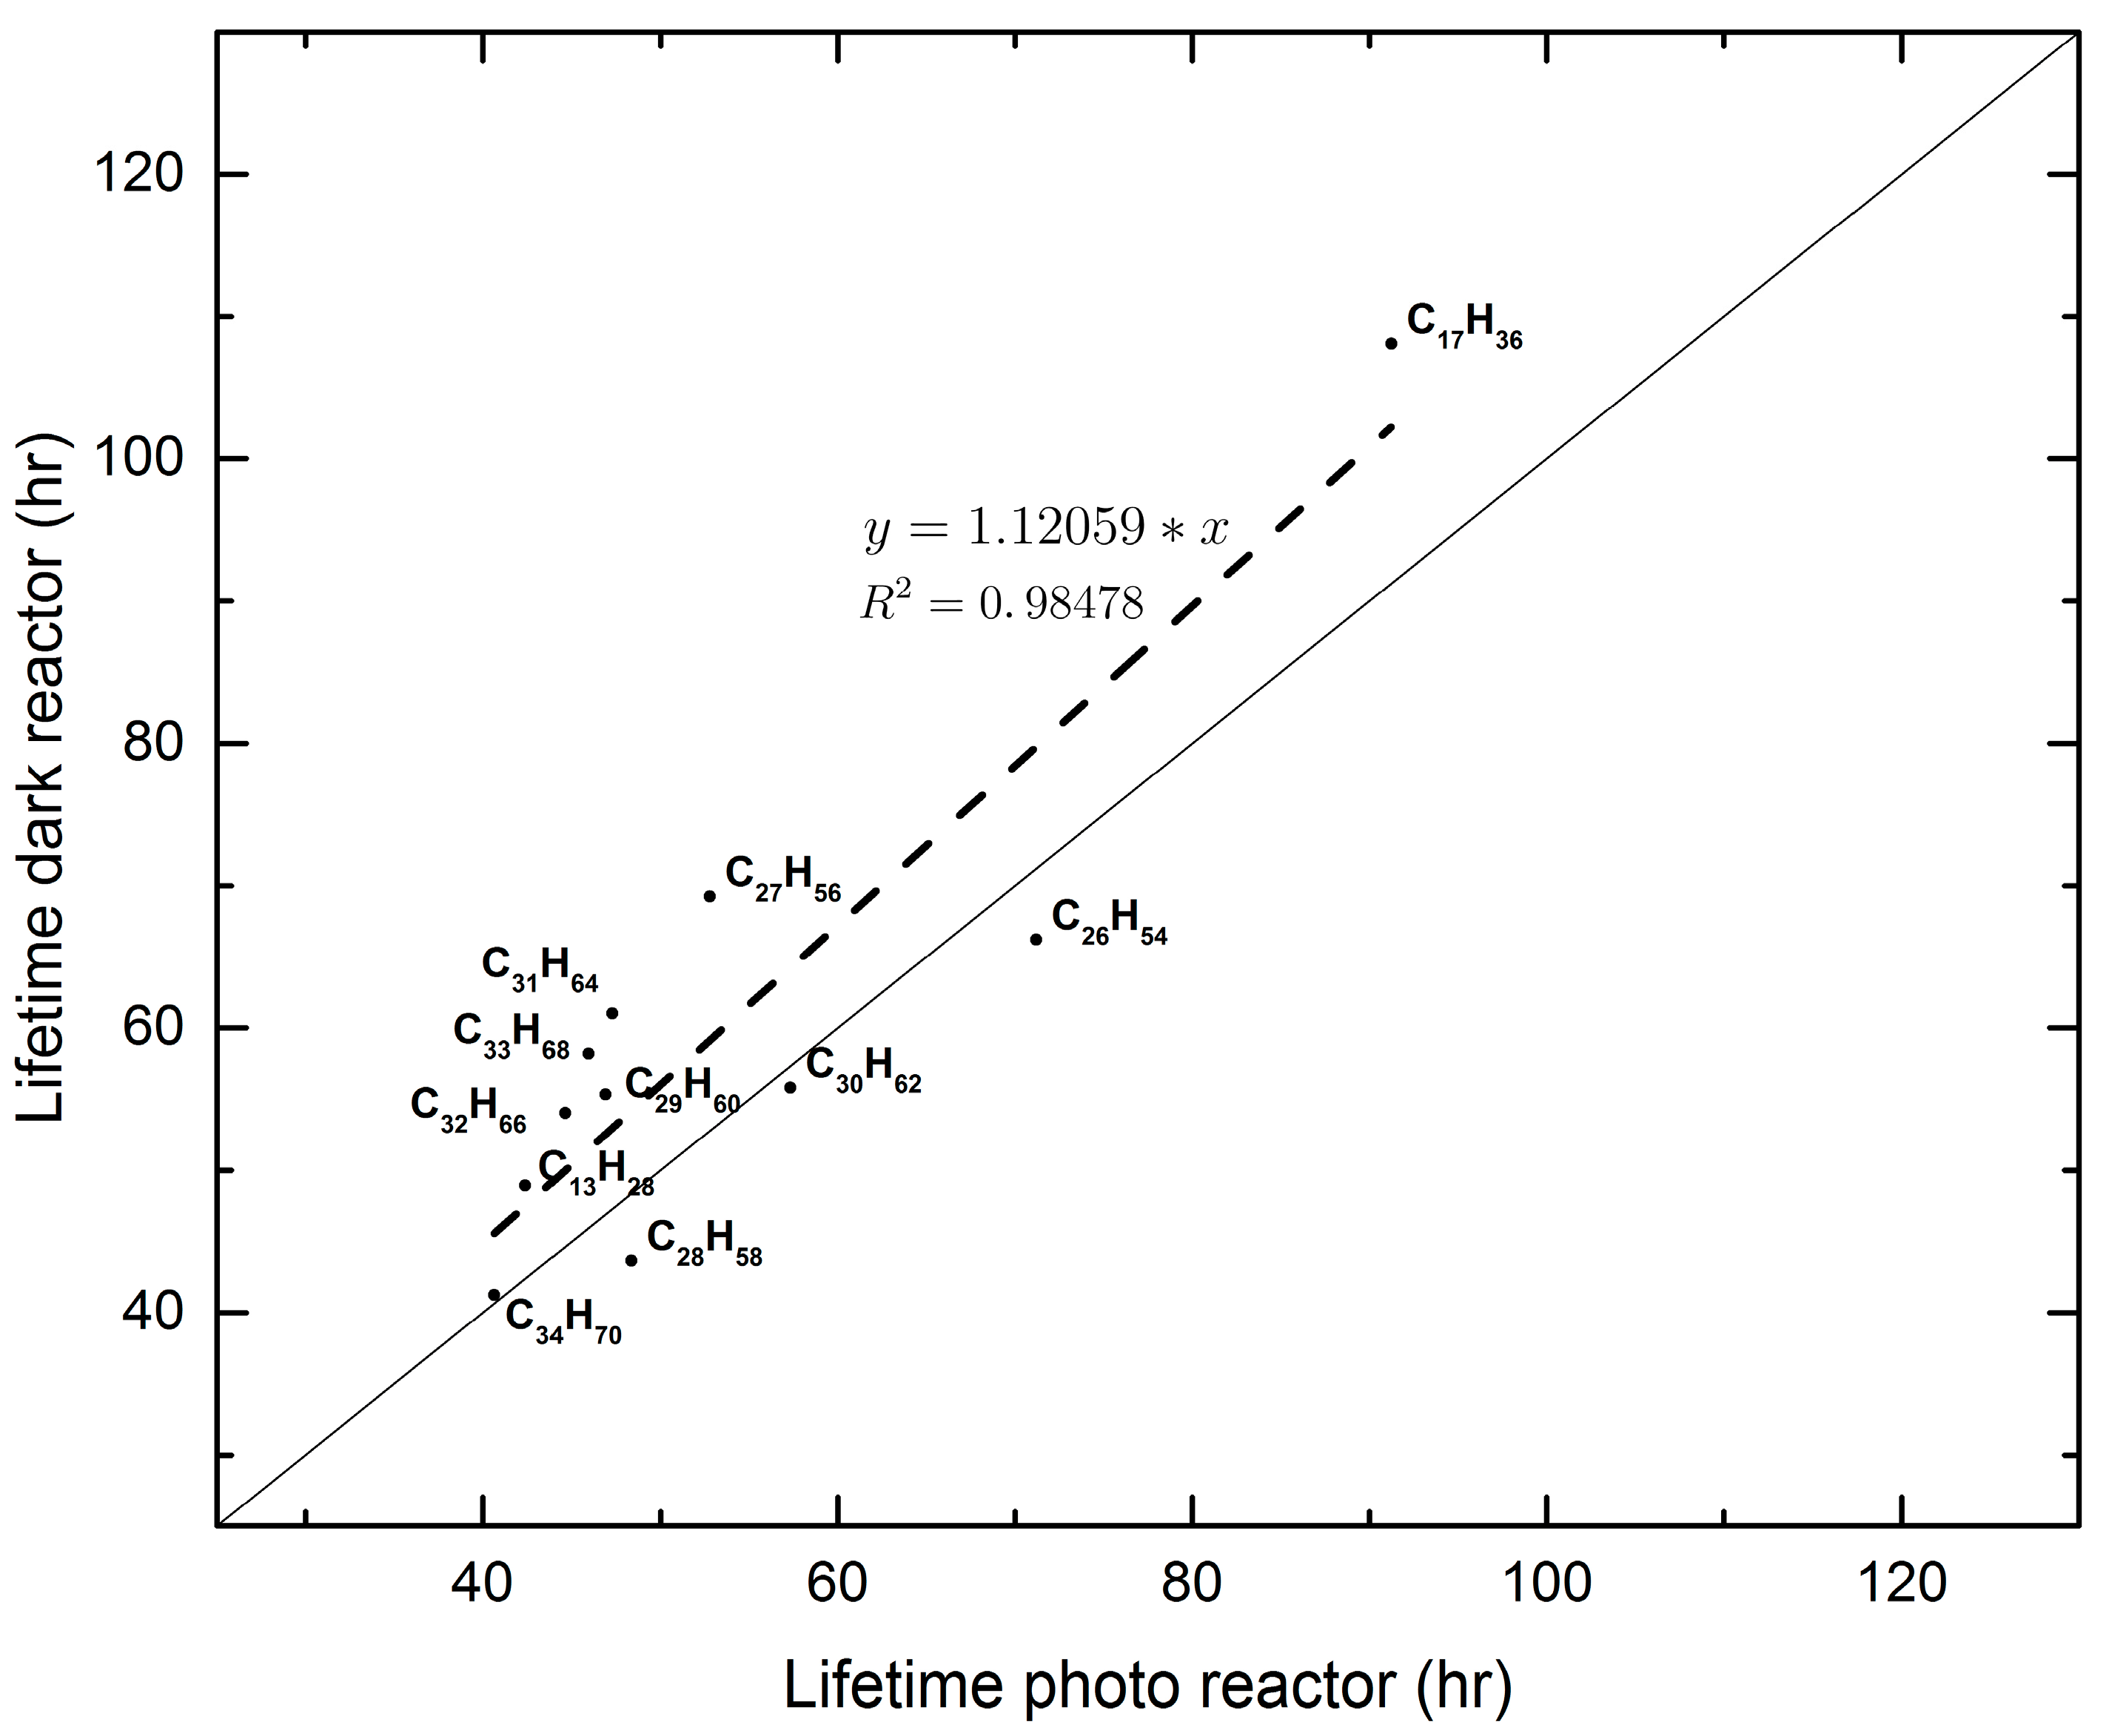
Semi-volatile and non-volatile n-alkanes on PM2.5 were initially collected on quartz filters with a high-volume sampler. After dividing each filter into eight pieces, two pieces were analyzed for the aforementioned alkanes and their concentrations were considered as initial concentrations of the experiments that followed. Of the six remaining pieces, three were placed in the reactor exposed to natural light (photoreactor) and the remaining three were placed in a duplicate reactor covered with aluminum foil so as to prevent light from entering it (dark reactor). Analyses of filter pieces from each reactor were carried out after 1, 2, and 4 days so that decomposition kinetics of the originally-detected compounds could be followed. The experiments were carried out on three different dates, i.e., three different experiments. The dates were chosen so that the week that followed the day of aerosol collection exhibited similar weather conditions, based on the local weather forecast. The obtained results were treated as pseudo-first-order reaction kinetics because it appears that the concentrations of the atmospheric oxidants far exceed the available mass of each individual semi or non-volatile alkanes throughout the experiment. The pseudo-first-order reaction rate coefficients found, resulted in values for the lifetimes of the studied alkanes no different to the ones reported in the literature [10,18,19]. Hence, for ambient conditions, it appears that the lifetimes of these non-volatile alkanes are on the order of 3–6 days. This time scale is long enough, under the appropriate weather conditions and for compounds that are associated with the PM2.5 aerosol, to allow them to disperse at a regional scale. Their contribution to the regional O3 production via their oxidation to RO2 and, subsequently, of NO to NO2, remains to be established. An important finding of the present study is that the results from both reactors are similar, indicating that the oxidants of the alkanes under study have an exogenic origin. The air residence time in each box is on the order of 1–2 min under laminar flow conditions. In this time the free radicals that are formed inside the photoreactor decompose the alkanes faster, by 10% on average, than in the dark reactor (see Figure 4). It was not possible to use a reliable method of analyzing OH radicals before and after the HEPA filters, “on line”. Additionally, we are not aware of any literature reference indicating the percent removal of radicals by the HEPA filters. At steady state flows of 2 L·min−1, in the reactors, one assumes some removal may occur, but this is of unknown importance. In the present experiments we studied the pseudo-first-order reaction kinetics, whereby the exogenic radicals are in a constant supply and in excess of the n-alkane concentrations, no matter how much of these radicals are lost in the HEPA filter. The dark reaction kinetics also indicate the influence of exogenic radicals on the studied reactions. The final results about the lifetime of the alkanes in the present study agree with literature values. This fact verifies the assumption that the radical population depletion by the HEPA filters is not a “significant” parameter.
In all decomposition reactions it is also assumed that the free radicals react via the Langmuir-Hinshelwood and Eley-Rideal mechanism ([20] and references therein).
Given the limited number of experiments and the limited temperature range under which they were performed, the Arrhenius plots obtained would not give accurate pre-exponential constants. The activation energies for each decomposition reaction is also given with some uncertainty. However, the values obtained are no different to values from the literature [19].
In the absence of measurements for free radical concentrations during the experiments, we can only compare our results with the DOAS mean concentrations of O3, NO, NO2, and SO2. No obvious correlations were observed. Additionally, we had no means to test the radical concentration/population on our filters, a fact that would assist in establishing as to whether persistent radicals on our collected aerosol would start reactions catalyzed by the presence of Fe2+ ions [21].
The literature indicates that the lifetimes of n-alkanes could not be determined accurately in reaction simulators that use high concentrations of reactants, but can be modeled to be in the order of 100 h [10], which has been confirmed by the data of the present work.
Acknowledgments
The Ph.D. thesis of Dimitra Karali was internally funded by university funds.
Author Contributions
The experiments and parts of the data treatment were carried out by D.K. as part of her Ph.D. thesis. She also contributed to the authorship of the publication. S.R. carried out the data treatment of the GC-DFS-MS and contributed to the authorship of the publication. A.C. carried out the collection and data treatment from the DOAS and contributed to the authorship of the publication.
Conflicts of Interest
The authors declare no conflict of interest.
References
- Pope, C.A., III; Burnett, R.T.; Thun, M.J.; Calle, E.E.; Krewski, D.; Ito, K.; Thurston, G.D. Lung cancer, cardiopulmonary mortality, and long-term exposure to fine particulate air pollution. JAMA 2002, 287, 1132–1141. [Google Scholar] [CrossRef] [PubMed]
- Lewtas, J. Air pollution combustion emissions: Characterization of causative agents and mechanisms associated with cancer, reproductive, and cardiovascular effects. Mutat. Res. Rev. Mutat. Res. 2007, 636, 95–133. [Google Scholar] [CrossRef] [PubMed]
- Cubison, M.J.; Ervens, B.; Feingold, G.; Docherty, K.S.; Ulbrich, I.M.; Shields, L.; Prather, K.; Hering, S.; Jimenez, J.L. The influence of chemical composition and mixing state of Los Angeles urban aerosol on CCN number and cloud properties. Atmos. Chem. Phys. 2008, 8, 5649–5667. [Google Scholar] [CrossRef]
- Fuzzi, S.; Andreae, M.O.; Huebert, B.J.; Kulmala, M.; Bond, T.C.; Boy, M.; Doherty, S.J.; Guenther, A.; Kanakidou, M.; Kawamura, K.; et al. Critical assessment of the current state of scientific knowledge, terminology, and research needs concerning the role of organic aerosol in the atmosphere, climate, and global change. Atmos. Chem. Phys. 2006, 6, 2017–2038. [Google Scholar] [CrossRef]
- Andreou, G.; Alexiou, S.D.; Loupa, G.; Rapsomanikis, S. Identification, Abundance and Origin of Aliphatic Hydrocarbons in the Fine Atmospheric Particulate Matter of Athens, Greece. Water Air Soil Pollut. Focus 2008, 8, 99–106. [Google Scholar] [CrossRef]
- Andreou, G.; Rapsomanikis, S. Origins of n-alkanes, carbonyl compounds and molecular biomarkers in atmospheric fine and coarse particles of Athens, Greece. Sci. Total Environ. 2009, 407, 5750–5760. [Google Scholar] [CrossRef] [PubMed]
- Behnke, W.; Holländer, W.; Koch, W.; Nolting, F.; Zetzsch, C. A smog chamber for studies of the photochemical degradation of chemicals in the presence of aerosol. Atmos. Environ. 1988, 22, 1113–1120. [Google Scholar] [CrossRef]
- Ma, J.; Liu, Y.; Ma, Q.; Liu, C.; He, H. Heterogeneous photochemical reaction of ozone with anthracene adsorbed on mineral dust. Atmos. Environ. 2013, 72, 165–170. [Google Scholar] [CrossRef]
- Ruehl, C.R.; Nah, T.; Isaacman, G.; Worton, D.R.; Chan, A.W.H.; Kolesar, K.R.; Cappa, C.D.; Goldstein, A.H.; Wilson, K.R. The Influence of Molecular Structure and Aerosol Phase on the Heterogeneous Oxidation of Normal and Branched Alkanes by OH. J. Phys. Chem. A 2013, 117, 3990–4000. [Google Scholar] [CrossRef] [PubMed]
- Zhang, H.; Worton, D.R.; Shen, S.; Nah, T.; Isaacman-VanWertz, G.; Wilson, K.R.; Goldstein, A.H. Fundamental Time Scales Governing Organic Aerosol Multiphase Partitioning and Oxidative Aging. Environ. Sci. Technol. 2015, 49, 9768–9777. [Google Scholar] [CrossRef] [PubMed]
- Derwent, R.G.; Jenkin, M.E.; Saunders, S.M.; Pilling, M.J. Characterization of the Reactivities of Volatile Organic Compounds Using a Master Chemical Mechanism. J. Air Waste Manag. Assoc. 2001, 51, 699–707. [Google Scholar] [CrossRef] [PubMed]
- Derwent, R.G.; Jenkin, M.E.; Saunders, S.M.; Pilling, M.J.; Passant, N.R. Multi-day ozone formation for alkenes and carbonyls investigated with a master chemical mechanism under European conditions. Atmos. Environ. 2005, 39, 627–635. [Google Scholar] [CrossRef]
- Saunders, S.M.; Jenkin, M.E.; Derwent, R.G.; Pilling, M.J. Protocol for the development of the Master Chemical Mechanism, MCM v3 (Part A): Tropospheric degradation of non-aromatic volatile organic compounds. Atmos. Chem. Phys. 2003, 3, 161–180. [Google Scholar] [CrossRef]
- Růžička, K.; Majer, V. Simultaneous Treatment of Vapor Pressures and Related Thermal Data between the Triple and Normal Boiling Temperatures for n-Alkanes C5–C20. J. Phys. Chem. Reference Data 1994, 23, 1–39. [Google Scholar] [CrossRef]
- Cickos, J. Sublimation Vapor Pressures as Evaluated by Correlation-Gas Chromatography. J. Chem. Eng. Data 2010, 55, 1558–1563. [Google Scholar] [CrossRef]
- Finlayson-Pitts, B.J.; Pitts, J.N. Chemistry of the Upper and Lower Atmosphere: Theory, Experiments, and Applications; Elsevier Science: San Diego, CA, USA, 2000. [Google Scholar]
- Atkinson, R.; Carter, W.P.L. Kinetics and mechanisms of the gas-phase reactions of ozone with organic compounds under atmospheric conditions. Chem. Rev. 1984, 84, 437–470. [Google Scholar] [CrossRef]
- Atkinson, R. Gas-phase tropospheric chemistry of organic compounds: A review. Atmos. Environ. 2007, 41, 200–240. [Google Scholar] [CrossRef]
- Calvert, J.G.; Derwent, R.G.; Orlando, J.J.; Tyndall, G.S.; Wallington, T.J. Mechanisms of Atmospheric Oxidation of the Alkanes; Oxford University Press: New York, NY, USA, 2008. [Google Scholar]
- Shiraiwa, M.; Garland, R.M.; Pöschl, U. Kinetic double-layer model of aerosol surface chemistry and gas-particle interactions (K2-SURF): Degradation of polycyclic aromatic hydrocarbons exposed to O3, NO2, H2O, OH and NO3. Atmos. Chem. Phys. 2009, 9, 9571–9586. [Google Scholar] [CrossRef]
- Gehling, W.; Khachatryan, L.; Dellinger, B. Hydroxyl Radical Generation from Environmentally Persistent Free Radicals (EPFRs) in PM2.5. Environ. Sci. Technol. 2014, 48, 4266–4272. [Google Scholar] [CrossRef] [PubMed]
Figure 1.
An example of the way that k1 is calculated for the alkanes under study.
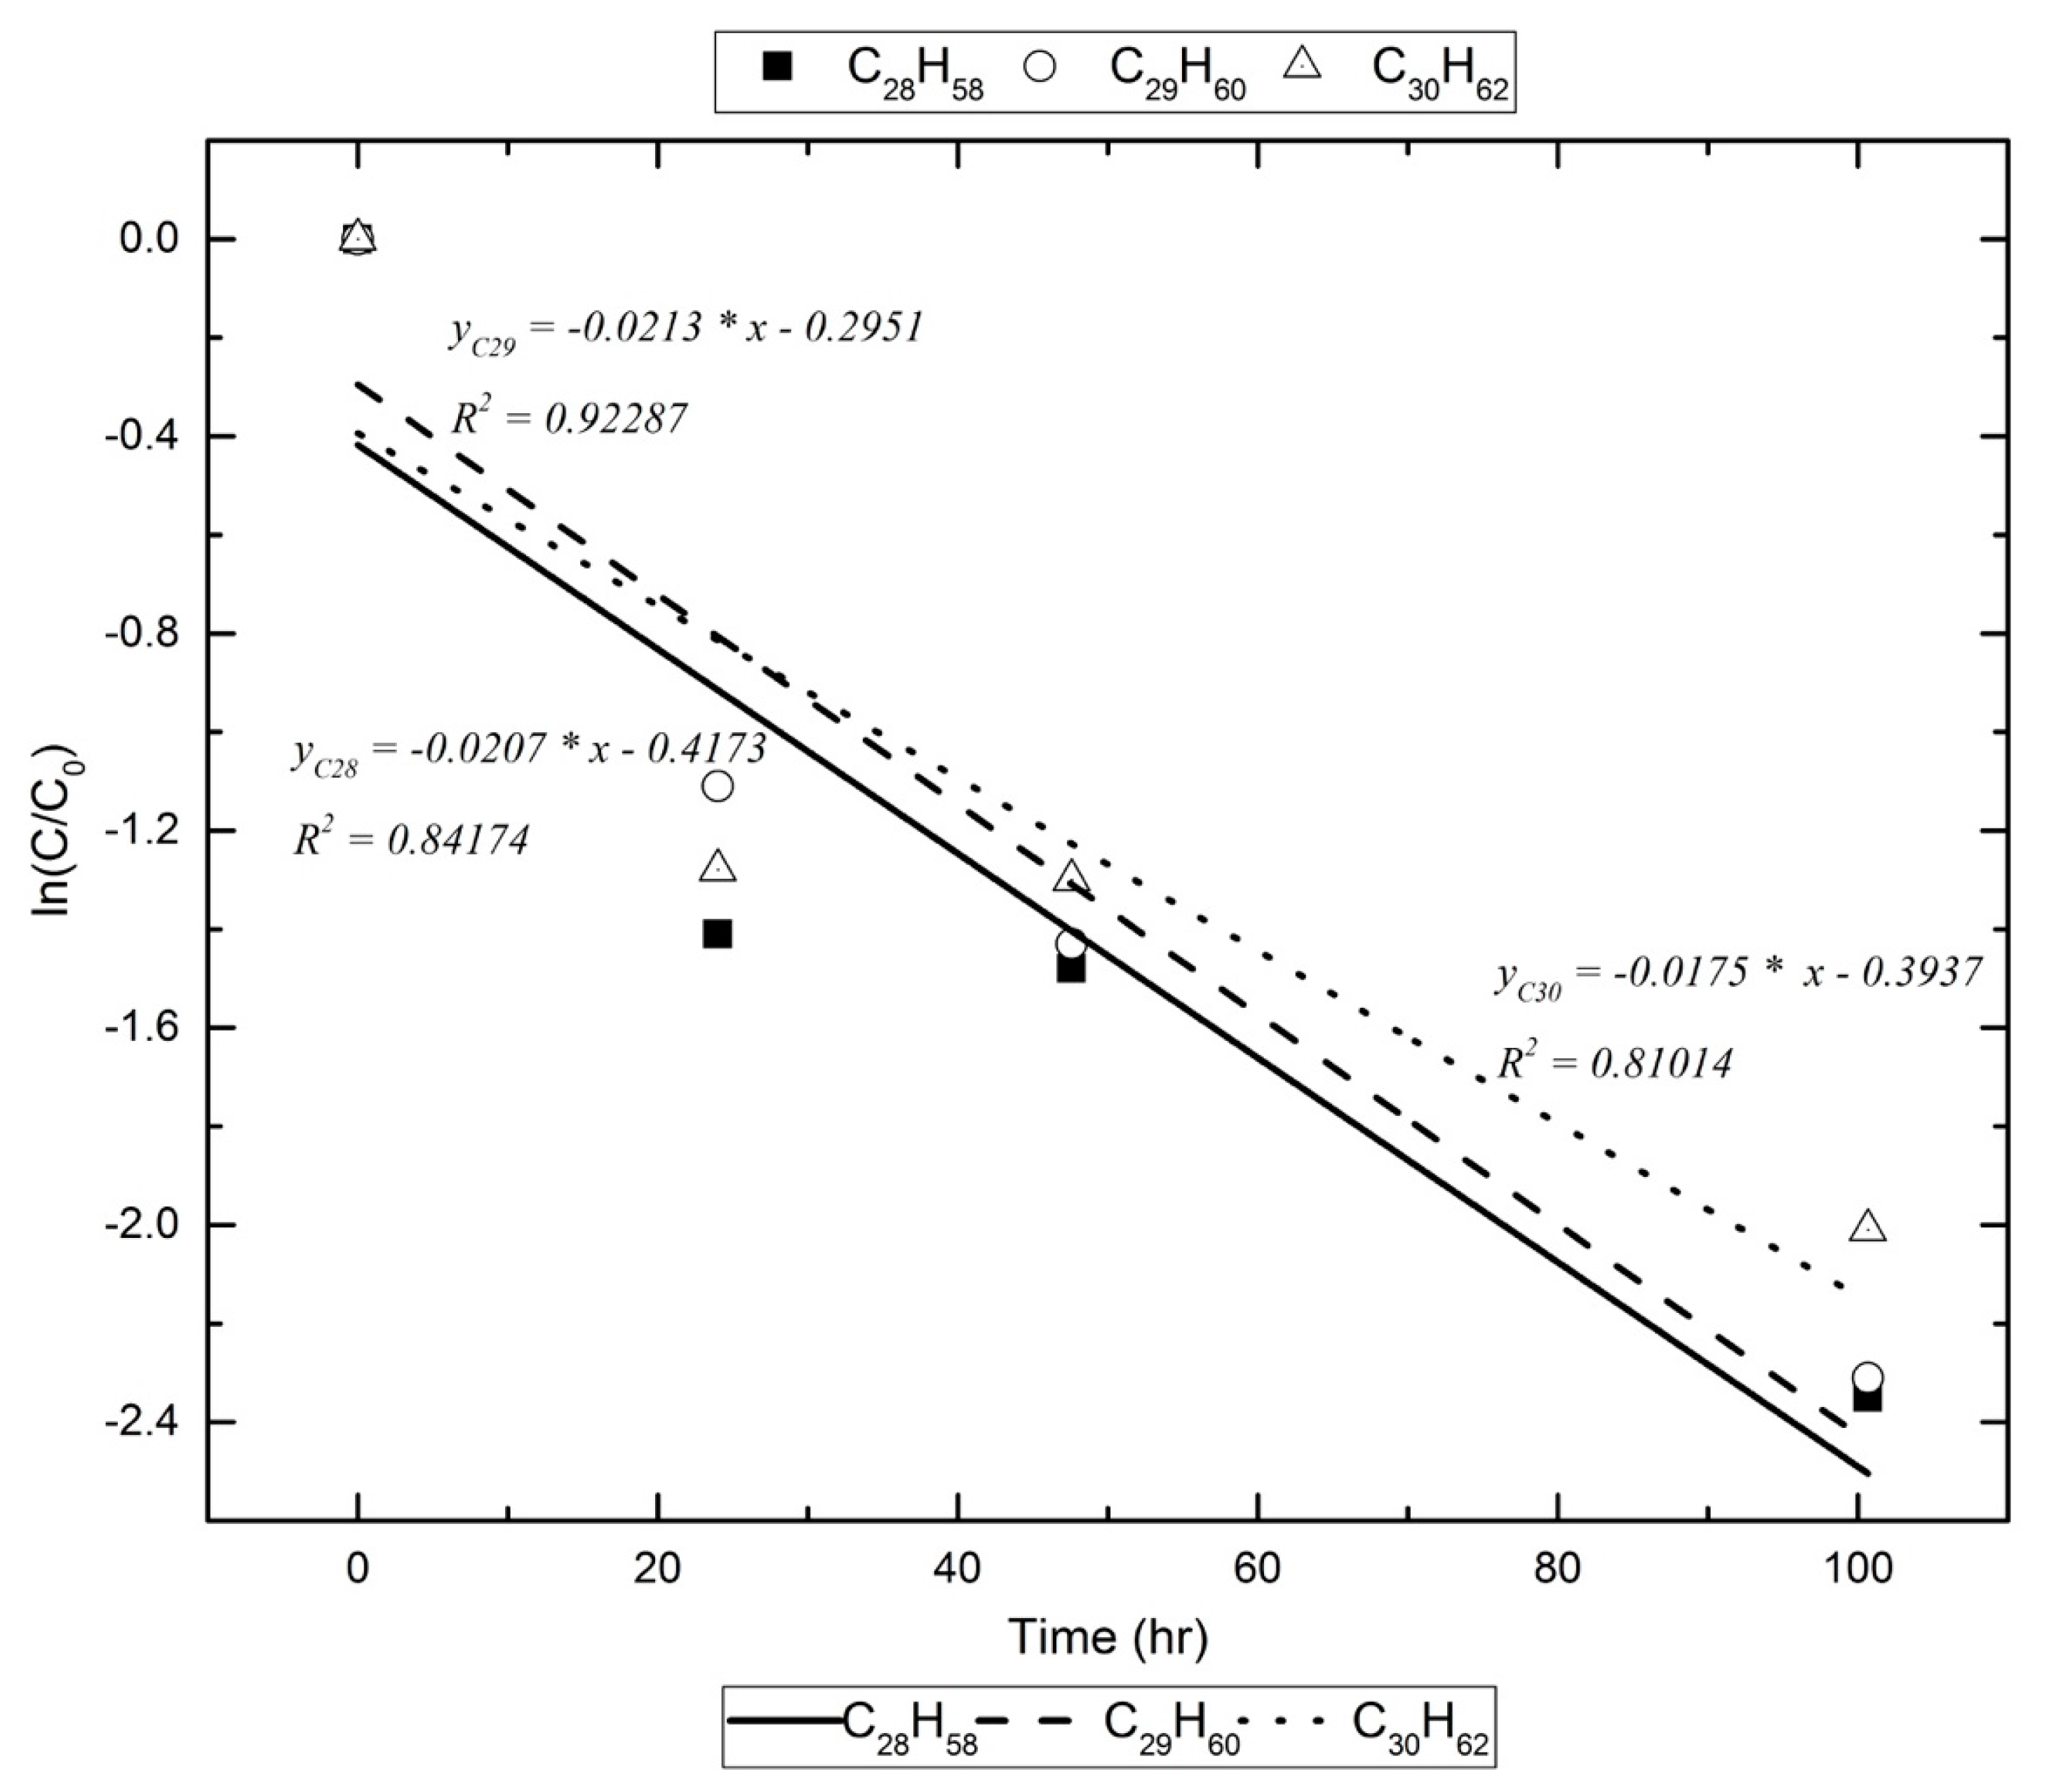
Figure 2.
An example of the Arrhenius plots for the calculation of the decomposition reaction’s energy of activation in the photoreactor.
Figure 2.
An example of the Arrhenius plots for the calculation of the decomposition reaction’s energy of activation in the photoreactor.

Figure 3.
An example of the Arrhenius plots for the calculation of the decomposition reaction’s energy of activation in the dark reactor.
Figure 3.
An example of the Arrhenius plots for the calculation of the decomposition reaction’s energy of activation in the dark reactor.

Figure 4.
An example of the comparison of lifetimes obtained in the two reactors for Experiment 1.

Table 1.
Dates, geographical position, and ancillary data for the experiments.
| Sample | Date | Latitude & Longitude | Zenith Angle (°) | Total Incoming Radiation (W·m−2) | Mean O3 (ppb) | Mean NO2 (ppb) |
|---|---|---|---|---|---|---|
| 1 | 24–28 September 2014 | 41.146458 24.919022 | 41.74 | 1,501,047.498 | 67.645 | 3.618 |
| 2 | 7–11 October 2014 | 46.71 | 853,626.555 | 74.704 | 1.136 | |
| 3 | 6–10 November 2014 | 57.14 | 348,921.870 | 55.322 | 11.645 |
Table 2.
List of n-alkanes studied a.
| Compounds | Formula | Boiling Point (°C at 760 mmHg) | Vapor Pressure (mmHg at 35 °C) | |
|---|---|---|---|---|
| Tridecane | C13H28 | 234.5 ± 3.0 | 4.26 × 10⁻² | Natural |
| Tetradecane | C14H30 | 253.9 ± 3.0 | 1.35 × 10⁻² | Natural |
| Hexadecane | C16H34 | 286.6 ± 3.0 | 1.43 × 10⁻³ | Natural |
| Heptadecane | C17H36 | 301.8 ± 5.0 | 4.61 × 10⁻⁴ | Natural |
| Tetracosane | C24H50 | 391.1 ± 5.0 | 2.25 × 10⁻⁷ | Natural |
| Hexacosane | C26H54 | 412.2 ± 8.0 | 1.27 × 10⁻⁸ | Natural |
| Heptacosane | C27H56 | 422.1 ± 8.0 | 7.05 × 10⁻⁹ | Anthropogenic |
| Octacosane | C28H58 | 431.7 ± 8.0 | 8.25 × 10⁻¹⁰ | Natural |
| Nonacosane | C29H60 | 440.9 ± 8.0 | 2.40 × 10⁻¹⁰ | Anthropogenic |
| Triacontane | C30H62 | 449.8 ± 8.0 | 5.70 × 10⁻¹¹ | Natural |
| Hentriacontane | C31H64 | 458.4 ± 8.0 | 1.20 × 10⁻¹¹ | Anthropogenic |
| Dotriacontane | C32H66 | 466.7 ± 8.0 | 4.30 × 10⁻¹² | Natural |
| Tritriacontane | C33H68 | 474.7 ± 8.0 | 9.00 × 10⁻¹³ | Anthropogenic |
| Tetratriacontane | C34H70 | 482.4 ± 8.0 | 1.88 × 10⁻¹³ | Natural |
| Pentatriacontane | C35H72 | 489.9 ± 8.0 | 5.03 × 10⁻¹⁴ | Anthropogenic |
| Hexatriacontane | C36H74 | 497.1 ± 8.0 | na | Natural |
| Tetracontane | C40H82 | 523.9 ± 13.0 | na | Natural |
| Tritetracontane | C43H88 | 541.9 ± 13.0 | na | Anthropogenic |
Table 3.
Photoreactor pseudo-first-order constants, lifetimes, and half-lives.
| Compounds | Pseudo First Order k1 [s−1] | Life Time τ [h] | Half-Lives t1/2 [h] | ||||||
|---|---|---|---|---|---|---|---|---|---|
| Sample | Sample | Sample | |||||||
| 1 | 2 | 3 | 1 | 2 | 3 | 1 | 2 | 3 | |
| C13H28 | 6.55 × 10⁻⁶ | 42.40 | 29.39 | ||||||
| C14H30 | 7.37 × 10⁻⁷ | 376.99 | 261.31 | ||||||
| C16H34 | 9.10 × 10⁻⁶ | 3.12 × 10⁻⁶ | 30.54 | 88.91 | 21.17 | 61.63 | |||
| C17H36 | 3.04 × 10⁻⁶ | 6.86 × 10⁻⁷ | 91.24 | 404.86 | 63.25 | 280.63 | |||
| C24H50 | 3.84 × 10⁻⁶ | 2.71 × 10⁻⁶ | 72.39 | 102.67 | 50.18 | 71.17 | |||
| C26H54 | 3.90 × 10⁻⁶ | 2.88 × 10⁻⁶ | 2.14 × 10⁻⁶ | 71.19 | 96.53 | 129.63 | 49.34 | 66.91 | 89.85 |
| C27H56 | 5.26 × 10⁻⁶ | 2.69 × 10⁻⁶ | 1.89 × 10⁻⁶ | 52.77 | 103.23 | 146.69 | 36.58 | 71.55 | 101.68 |
| C28H58 | 5.75 × 10⁻⁶ | 2.05 × 10⁻⁶ | 2.00 × 10⁻⁶ | 48.34 | 135.45 | 138.73 | 33.51 | 93.88 | 96.16 |
| C29H60 | 5.92 × 10⁻⁶ | 3.84 × 10⁻⁶ | 1.85 × 10⁻⁶ | 46.89 | 72.35 | 150.54 | 32.50 | 50.15 | 104.34 |
| C30H62 | 4.85 × 10⁻⁶ | 4.38 × 10⁻⁶ | 2.31 × 10⁻⁶ | 57.31 | 63.42 | 120.46 | 39.73 | 43.96 | 83.50 |
| C31H64 | 5.88 × 10⁻⁶ | 4.39 × 10⁻⁶ | 2.02 × 10⁻⁶ | 47.28 | 63.33 | 137.65 | 32.77 | 43.90 | 95.41 |
| C32H66 | 6.23 × 10⁻⁶ | 4.77 × 10⁻⁶ | 1.64 × 10⁻⁶ | 44.62 | 58.21 | 169.50 | 30.93 | 40.35 | 117.49 |
| C33H68 | 6.05 × 10⁻⁶ | 4.94 × 10⁻⁶ | 2.18 × 10⁻⁶ | 45.93 | 56.21 | 127.38 | 31.84 | 38.96 | 88.29 |
| C34H70 | 6.83 × 10⁻⁶ | 5.93 × 10⁻⁶ | 2.28 × 10⁻⁶ | 40.65 | 46.85 | 121.98 | 28.18 | 32.47 | 84.55 |
| C35H72 | 2.34 × 10⁻⁶ | 118.89 | 82.41 | ||||||
| C36H74 | 5.07 × 10⁻⁶ | 2.07 × 10⁻⁶ | 54.83 | 134.40 | 38.01 | 93.16 | |||
| C40H82 | 1.93 × 10⁻⁶ | 143.63 | 99.56 | ||||||
| C43H88 | 2.87 × 10⁻⁶ | 96.83 | 67.12 | ||||||
Table 4.
Dark reactor pseudo-first-order constants, lifetimes, and half-lives.
| Compounds | Pseudo First Order k1 [s−1] | Life Time τ [h] | Half-Lives t1/2 [h] | ||||||
|---|---|---|---|---|---|---|---|---|---|
| Sample | Sample | Sample | |||||||
| 1 | 2 | 3 | 1 | 2 | 3 | 1 | 2 | 3 | |
| C13H28 | 5.68 × 10⁻⁶ | 3.78 × 10⁻⁶ | 48.92 | 73.45 | 33.91 | 50.91 | |||
| C14H30 | 2.70 × 10⁻⁶ | 103.08 | 71.45 | ||||||
| C16H34 | 2.22 × 10⁻⁶ | 2.01 × 10⁻⁶ | 3.36 × 10⁻⁶ | 125.04 | 137.91 | 82.70 | 86.67 | 95.59 | 57.33 |
| C17H36 | 2.57 × 10⁻⁶ | 1.91× 10⁻⁶ | 108.10 | 145.67 | 74.93 | 100.97 | |||
| C24H50 | 8.27 × 10⁻⁶ | 5.15 × 10⁻⁶ | 2.55 × 10⁻⁶ | 33.57 | 53.99 | 108.79 | 23.27 | 37.42 | 75.41 |
| C26H54 | 4.20 × 10⁻⁶ | 3.99 × 10− | 1.82 × 10⁻⁶ | 66.22 | 69.68 | 152.57 | 45.90 | 48.30 | 105.75 |
| C27H56 | 4.01 × 10⁻⁶ | 2.43 × 10⁻⁶ | 1.55 × 10⁻⁶ | 69.24 | 114.26 | 179.70 | 47.99 | 79.20 | 124.56 |
| C28H58 | 6.36 × 10⁻⁶ | 3.66 × 10⁻⁶ | 2.03 × 10⁻⁶ | 43.65 | 75.97 | 136.62 | 30.26 | 52.66 | 94.69 |
| C29H60 | 5.02 × 10⁻⁶ | 4.48 × 10⁻⁶ | 2.33 × 10⁻⁶ | 55.35 | 62.06 | 119.25 | 38.36 | 43.02 | 82.66 |
| C30H62 | 4.98 × 10⁻⁶ | 5.62× 10⁻⁶ | 2.48 × 10⁻⁶ | 55.83 | 49.45 | 111.81 | 38.70 | 34.27 | 77.50 |
| C31H64 | 4.55 × 10⁻⁶ | 5.00 × 10⁻⁶ | 2.22 × 10⁻⁶ | 61.02 | 55.60 | 125.39 | 42.30 | 38.54 | 86.92 |
| C32H66 | 5.14 × 10⁻⁶ | 6.88 × 10⁻⁶ | 2.92 × 10⁻⁶ | 54.05 | 40.41 | 95.14 | 37.47 | 28.01 | 65.94 |
| C33H68 | 4.77 × 10⁻⁶ | 5.87 × 10⁻⁶ | 2.53 × 10⁻⁶ | 58.20 | 47.34 | 109.76 | 40.34 | 32.81 | 76.08 |
| C34H70 | 6.73 × 10⁻⁶ | 5.01 × 10⁻⁶ | 3.23 × 10⁻⁶ | 41.26 | 55.40 | 86.07 | 28.60 | 38.40 | 59.66 |
| C35H72 | 2.57 × 10⁻⁶ | 108.15 | 74.97 | ||||||
| C36H74 | 4.89 × 10⁻⁶ | 3.08 × 10⁻⁶ | 56.82 | 90.17 | 39.39 | 62.50 | |||
| C40H82 | 2.06 × 10⁻⁶ | 134.80 | 93.44 | ||||||
| C43H88 | 2.76 × 10⁻⁶ | 100.49 | 69.65 | ||||||
Table 5.
Photoreactor, results of Arrhenius plots.
| Compounds | ln(k1) 1st Order | RSQ | Slope = −[Ea·R−1] | Ea [kJ·mol−1] | ||
|---|---|---|---|---|---|---|
| Sample 1 | Sample 2 | Sample 3 | ||||
| C13H28 | NSD | NSD | NSD | NSD | NSD | NSD |
| C14H30 | NSD | NSD | NSD | NSD | NSD | NSD |
| C16H34 | NSD | NSD | NSD | NSD | NSD | NSD |
| C17H36 | NSD | NSD | NSD | NSD | NSD | NSD |
| C24H50 | NSD | NSD | NSD | NSD | NSD | NSD |
| C26H54 | NSD | NSD | NSD | NSD | NSD | NSD |
| C27H56 | NSD | NSD | NSD | NSD | NSD | NSD |
| C28H58 | NSD | NSD | NSD | NSD | NSD | NSD |
| C29H60 | NSD | NSD | NSD | NSD | NSD | NSD |
| C30H62 | −12.237 | −12.338 | −12.980 | 0.589 | −7876.237 | 65.487 |
| C31H64 | NSD | NSD | NSD | NSD | NSD | NSD |
| C32H66 | −11.987 | −12.253 | −13.322 | 0.526 | −13,056.140 | 108.555 |
| C33H68 | −12.016 | −12.218 | −13.036 | 0.527 | −9993.166 | 83.088 |
| C34H70 | −11.894 | −12.036 | −12.993 | 0.596 | −11,753.232 | 97.722 |
| C35H72 | NSD | NSD | NSD | NSD | NSD | NSD |
| C36H74 | NSD | NSD | NSD | NSD | NSD | NSD |
| C40H82 | NSD | NSD | NSD | NSD | NSD | NSD |
| C43H88 | NSD | NSD | NSD | NSD | NSD | NSD |
NSD = Not Sufficient Data.
Table 6.
Dark reactor, results of Arrhenius plots.
| Compounds | ln(k1) 1st Order | RSQ | Slope = −[Ea·R−1] | Ea [kJ·mol−1] | ||
|---|---|---|---|---|---|---|
| Sample 1 | Sample 2 | Sample 3 | ||||
| C13H28 | NSD | NSD | NSD | NSD | NSD | NSD |
| C14H30 | NSD | NSD | NSD | NSD | NSD | NSD |
| C16H34 | NSD | NSD | NSD | NSD | NSD | NSD |
| C17H36 | NSD | NSD | NSD | NSD | NSD | NSD |
| C24H50 | NSD | NSD | NSD | NSD | NSD | NSD |
| C26H54 | −12.382 | −12.433 | −13.216 | 0.614 | −12,124.477 | 100.809 |
| C27H56 | NSD | NSD | NSD | NSD | NSD | NSD |
| C28H58 | NSD | NSD | NSD | NSD | NSD | NSD |
| C29H60 | −12.202 | −12.317 | −12.970 | 0.530 | −9974.793 | 82.935 |
| C30H62 | −12.211 | −12.090 | −12.905 | 0.788 | −12,930.895 | 107.514 |
| C31H64 | −12.300 | −12.207 | −13.020 | 0.760 | −12,839.333 | 106.753 |
| C32H66 | −12.179 | −11.888 | −12.744 | 0.926 | −13,860.788 | 115.246 |
| C33H68 | −12.253 | −12.046 | −12.887 | 0.863 | −13,471.609 | 112.010 |
| C34H70 | NSD | NSD | NSD | NSD | NSD | NSD |
| C35H72 | NSD | NSD | NSD | NSD | NSD | NSD |
| C36H74 | NSD | NSD | NSD | NSD | NSD | NSD |
| C40H82 | NSD | NSD | NSD | NSD | NSD | NSD |
| C43H88 | NSD | NSD | NSD | NSD | NSD | NSD |
NSD = Not Sufficient Data.
© 2017 by the authors. Licensee MDPI, Basel, Switzerland. This article is an open access article distributed under the terms and conditions of the Creative Commons Attribution (CC BY) license (http://creativecommons.org/licenses/by/4.0/).
Share and Cite
MDPI and ACS Style
Karali, D.; Rapsomanikis, S.; Christoforidis, A. Decomposition Kinetics of Non-Volatile Alkanes on Urban Aerosol. Atmosphere 2017, 8, 89. https://doi.org/10.3390/atmos8050089
AMA Style
Karali D, Rapsomanikis S, Christoforidis A. Decomposition Kinetics of Non-Volatile Alkanes on Urban Aerosol. Atmosphere. 2017; 8(5):89. https://doi.org/10.3390/atmos8050089
Chicago/Turabian StyleKarali, Dimitra, Spyridon Rapsomanikis, and Achilleas Christoforidis. 2017. "Decomposition Kinetics of Non-Volatile Alkanes on Urban Aerosol" Atmosphere 8, no. 5: 89. https://doi.org/10.3390/atmos8050089
Note that from the first issue of 2016, this journal uses article numbers instead of page numbers. See further details here.