Article

Evaluation of Five Grid Datasets against Radiosonde Data over the Eastern and Downstream Regions of the Tibetan Plateau in Summer

1
Institute of Plateau Meteorology, China Meteorological Administration/Heavy Rain and Drought-Flood Disaster in Plateau and Basin Key Laboratory of Sichuan Province, Chengdu 610072, China
2
School of Atmospheric Sciences, Chengdu University of Information Technology, Chengdu 610225, China
3
Collaborative Innovation Center on Forecast and Evaluation of Meteorological Disasters, Nanjing University of Information Science & Technology, Nanjing 210044, China
4
Rural Economic Information Center of Sichuan, Chengdu 610072, China
5
Sichuan Meteorological Observation Data Center, Chengdu 610072, China
*
Author to whom correspondence should be addressed.
Atmosphere 2017, 8(3), 56; https://doi.org/10.3390/atmos8030056
Submission received: 8 December 2016 / Revised: 9 March 2017 / Accepted: 11 March 2017 / Published: 15 March 2017

Abstract

:
In this study, horizontal wind (U and V), air temperature (T), and relative humidity (RH) modelled by the European Centre for Medium-Range Weather Forecasts Reanalysis Interim (ERA-Interim), the National Aeronautics and Space Administration (NASA) Modern Era Retrospective Analysis for Research and Applications (MERRA), the Japanese 55-year Reanalysis (JRA-55), the National Centers for Environmental Prediction (NCEP) Climate Forecast System Version 2 (CFSv2), and the NCEP Final Operational Global Analysis data and the NCEP Final Operational Global Analysis data (NCEP-FNL) products have been compared with observations at 11 radiosonde stations over the eastern and downstream regions of the Tibetan Plateau (TP) from late June until the end of July during 2011 to 2015. The mean bias of all variables for the five gridded datasets (GDs) in the Sichuan Basin (SCB) is larger than that for the TP. The mean values of U, V, and T from each grid dataset are generally consistent with the radiosonde values, whereas considerable bias in the mean RH exists at upper levels. The diurnal variation of the mean bias and root-mean-square (RMS) error in the basin are stronger than those in the TP and the negative/positive peak usually occurs at 06:00 UTC and 18:00 UTC in the basin or at 12:00 UTC in the TP. The inter-annual variations in the basin are significantly stronger, and the maximum values of the variations usually occur at upper levels or near the surface, except for V. The weather conditions have a crucial influence on the performance of the gridded datasets. The mean bias and RMS error of T in the TP on cloudy days are obviously larger than those during sunny conditions. Considerable but unsteady differences occur in the mean bias and RMS error of U and V in different weather conditions. On average, the four variables in the TP are more sensible to the weather conditions.

1. Introduction

The Western Sichuan Plateau (WSCP) and the Sichuan Basin (SCB) are the main components of the Eastern and Downstream Tibetan Plateau (EDTP). The topography over the WSCP is complicated by a huge elevation drop, whereas the SCB is surrounded by mountains in which the atmospheric circulation is affected by their own terrain and by that of the TP [1]. Furthermore, the WSCP is upstream of many of China’s great rivers and the most important tectonic unit in the northeastern margin of the TP.
Early research on the TP was based on observation data tracing back to the 1950s (e.g., [2,3]). Since that time, a network of surface and upper-air stations on the TP has been continuously expanded by the Chinese government. However, the complex topography, severe weather, and harsh environmental conditions over the TP limit the ability to directly conduct continuous in situ measurement in this region. In order to obtain meteorological observation data over the TP, China organized two large-scale meteorological observation experiments, the first and second Tibetan Plateau Experiments, in the 1970s and 1990s, respectively. However, most of the observation sites in the two experiments were arranged in the main area of the TP; enhanced radiosonde observations in the EDTP were almost non-existent until 2010.
Over the past recent decades, grid data has found widespread application in many areas of research to compensate for the lack of direct observations in and around the TP. Grid dataset (GD) products are generated by assimilation of observational data over a given period. The employed data source is one of three main reasons for uncertainties in GDs; the two other factors are the forecast model and data assimilation. In order to reduce the bias and error in GDs and improve the forecast skills, researchers have been committed to developing advanced data assimilation, model physics, and better resolution. However, the performances of the forecast models are still not good over the EDTP.
In comparison with the main body of the TP, the EDTP is influenced by more weather systems, such as westerlies, shear lines, and fronts over East Asia. Two other sub-synoptic-scale shallow cyclones recognized by Chinese meteorologists, the southwest vortex and the Tibetan Plateau vortex, are the main triggers of many heavy rainfall events over the EDTP (e.g., [4,5]); however, their development mechanisms remain unclear. More recently, a new thermally driven weather phenomena known as east-west mountain-plain solenoids (e.g., [6,7]) proved to be associated with diurnal rainfall in the SCB. Because the thermal and dynamic effect of the TP and adjacent regions affects the free atmosphere gradually through the lower layers and the boundary layer [8], the thermal and dynamic process are highly complex owing to the varied topography mentioned. Therefore, complex physical process and various weather system are the most important factors which cause error in the GDs.
Although GDs are important foundations of many studies conducted on weather and climate over the EDTP, the uncertainties and reliability of the GDs in that region remain unclear, and are thus the main constraints of numerical weather prediction. This limitation creates controversy in many research results. Many scholars do a lot of useful research and exploration in the TP (e.g., [9,10,11]). Although few papers focus in the EDTP, a common point in such research is that false results or great error are more likely to occur over the EDTP compared with other regions of the TP. Therefore, it is essential to assess the quality of GDs over the EDTP, where observational data are sparse. Several studies have compared GDs from different sources in different regions (e.g., [12,13,14,15]). In particular, Wang and Zeng [16] and Bao and Zhang [17] examined the quality of GD products on surface and above ground variables in the TP, respectively. Such research reported good agreement between GDs and radiosonde data over simple terrain, including flatlands and the ocean, but a large uncertainty in weather conditions over complex topography. Although GDs are potentially applicable for studying large-scale weather systems, caution should be used for data application at the regional scale. To the best of our knowledge, systematic evaluation of the quality of these GDs over the EDTP is almost non-existent.
Performing quantitative evaluation on the difference between the GD and radiosonde data is very helpful for choosing or improving the parameterization and parameter optimization. The complex geography over the EDTP is assumed to be one of the main factors in the aforementioned uncertainty in resources and in addition, analysis based on observation data shows that the structure of the atmospheric boundary layer in drought years displays characteristics that differ from those occurring in flood years [18]. Therefore, we assumed that obvious inter-annual variation and diurnal variation are the general features of GDs and that the weather conditions may have some degree of influence on the quality of the GD.
The southwest vortex, one of the strongest storm systems in China (e.g., [19,20,21]), occurs in the summertime. This season is the most frequent period of southwest vortex and meteorological disasters [22], which make the weather conditions over the SBC and its adjacent region complex and difficult to predict. In this study, we extensively intercompare five GDs including those of the National Centers for Environmental Prediction (NCEP) reanalysis version 2 coupled forecast system model (CFSv2), the National Aeronautics and Space Administration (NASA) Modern Era Retrospective Analysis for Research and Applications (MERRA), the European Centre for Medium-Range Weather Forecasts Reanalysis Interim (ERA-Interim), the NCEP Final Operational Global Analysis data (NCEP-FNL), and the Japanese 55-year Reanalysis (JRA-55) and evaluate them by using extensive radiosonde data and satellite-derived cloud total amount (CTA) for summertime. The primary objective of this study is to understand the quality and utility of the five GDs over the EDTP. Section 2 introduces the datasets and methods. In Section 3.1, an intercomparison of the five GDs is discussed to elucidate the quality and utility mainly in terms of mean bias and root-mean-square (RMS) error. Section 3.2 evaluates the diurnal and inter annual variability of the mean bias and RMS error. Section 3.3 evaluates the variations of the RMS errors and biases of the five GDs against the radiosonde data in different weather conditions. The summary remarks are given in Section 4.

2. Data Sets

By using elementary quality-control measures, we acquired four fundamental atmospheric variables such as components of horizontal wind (U and V), temperature (T), and relative humidity (RH) at twenty-eight standard vertical levels including eleven in the TP at 600–100 hPa with intervals of 50 hPa and seventeen in the basin at 900–100 hPa with intervals of 50 hPa to compare the GD with discrete radiosonde data. We performed simple bilinear interpolation on GD products for each of the observation stations at the same synoptic times and standard pressure levels. We used mean value, standard deviation (STD), mean bias, and RMS error to measure the quality of the GDs. All of these statistical measurements are widely used in similar research. Smaller differences in mean value and STD between GD and radiosonde data relate more accurate representation of the climate characteristics of the atmosphere. The mean bias is a critical index for evaluating the accuracy of GDs. In theory, a smaller mean bias in the simulation relates to more effective results. However, mean bias is not a constant value; hence, RMS error is imported to represent the variation degree in the mean bias. Excessive values of RMS error can decrease the quality of GDs extensively, which is a limitation in revealing scientific laws.

2.1. Grid Datasets

As previously mentioned, this study is based on the GD products of CFSv2, ERA-Interim, MERRA, NCEP-FNL, and JRA-55. ERA-Interim uses four-dimensional (4D)-variational analysis on a spectral grid with triangular truncation of 255 waves corresponding to approximately 80 km and a hybrid vertical coordinate system with 60 levels [23]. JRA-55 employs 4D-variational data assimilation (4DVAR) with variational bias correction for satellite radiances [24,25]. CFSv2 and MERRA apply three-dimensional (3D)-variational data assimilation (3DVAR) based on grid point statistical interpolation (GSI), with flow dependence for background error variances [26,27,28,29]. FNL is from the Global Data Assimilation System (GDAS), which continuously collects observational data from the Global Telecommunications System (GTS). The spatial resolution of the GD is 0.5° × 0.5° except for NCEP-FNL, which is 1° × 1°. The temporal resolution of the GD is 6 h.

2.2. Satellite Data

The cloud total amount (CTA) data were obtained from the FY-2E meteorological satellite (http://satellite.cma.gov.cn/portalsite/default.aspx) with spatial (temporal) resolution of 0.1° × 0.1° (1 h). These CTA data represent the standard for classification of weather in this paper. We interpolated the CTA data with simple bilinear interpolation for each of the observation stations at the same synoptic times. On the basis on the CTA value (0%–100%), we divided the weather conditions into sunny and cloudy with CTA < 30% and CTA > 70%, respectively [30].

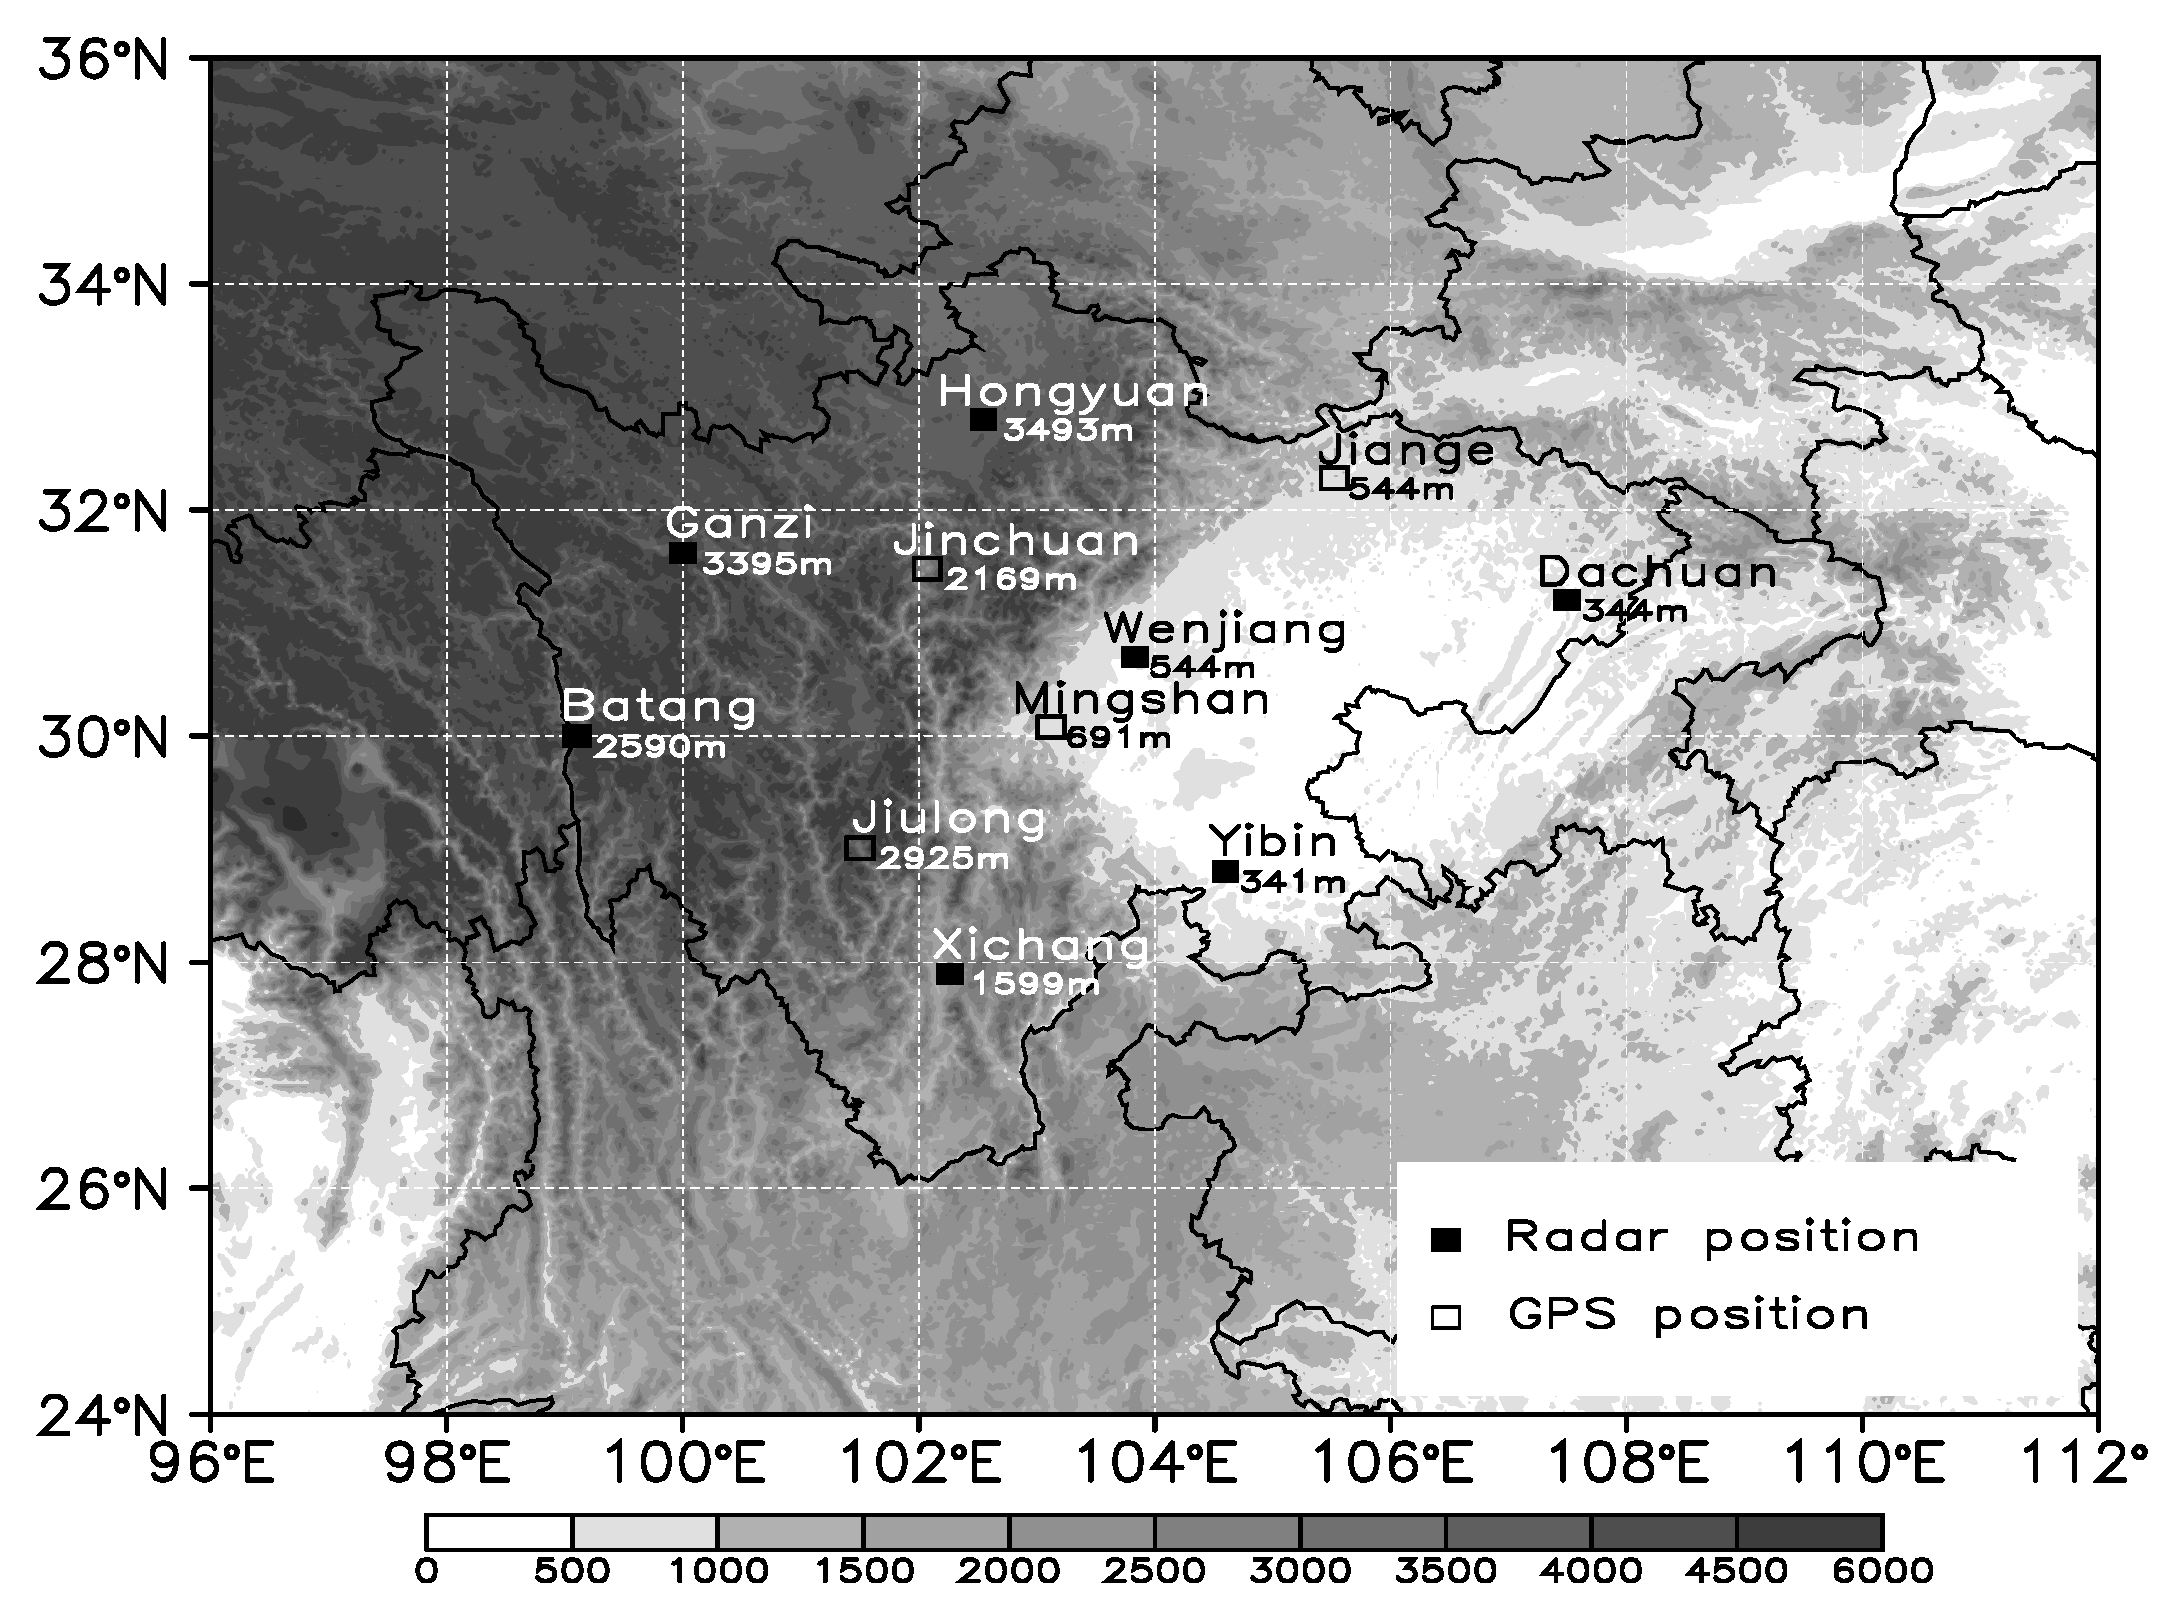
2.3. Radiosonde Data

The intensive observation experiment of the southwest vortex in Sichuan province was conducted by the Institute of Plateau Meteorology (IPM) from 2010 to 2015 and covered about 40 days from late June to early August of each year. Eleven sites including five sites in the basin and six sites in TP, were determined on the basis of the model sensor locations. All the eleven sites were divided into two categories: radar-based stations and Global Positioning System (GPS)-based stations (Figure 1). The temporal resolution of the radiosonde data was 1 s except for that at the GPS-based stations in 2014 and 2015, which was 2 s. All of the soundings were conducted four times each day, at 05:15, 11:15, 17:15, and 23:15 UTC. All of the observation sites were completely independent and were not assimilated in each GD as part of the standard observing network.
The radar-based stations were equipped with the China Meteorological Administration’s (CMA) new-generation sounding instruments, including a GTS1 electronic sounding sensor and a GFE(L)1 Windfinding radar. The standard uncertainty of the T was less than 0.3 °C; and that of RH was less than 5% (10%) for temperatures higher (lower) than 25 °C; The standard uncertainty of pressure measurements was less than 2 hPa (1 hPa) for pressures higher (lower) than 500 hPa, and the velocity (directional) measurement uncertainty was about 0.3 m/s (3°) [31]. These measurement precisions meet requirements of the World Meteorological Organization (WMO). Further information on the instruments can be found at their official websites [32,33].
The GPS-based stations are equipped with Vaisala Radiosonde RS41, the key characteristics of which are its excellent repeatability and reliability in all sounding conditions. More than 1000 test soundings, numerous laboratory tests, and in-depth uncertainty analyses have been conducted during the product development phase. The combined uncertainty in sounding 0–16 km (above 16 km) of the T was about 0.3 °C (0.4 °C); the combined uncertainty in the sounding of RH was about 4%; and the velocity (directional) measurement uncertainty was about 0.15 m/s (2°).

3. Results

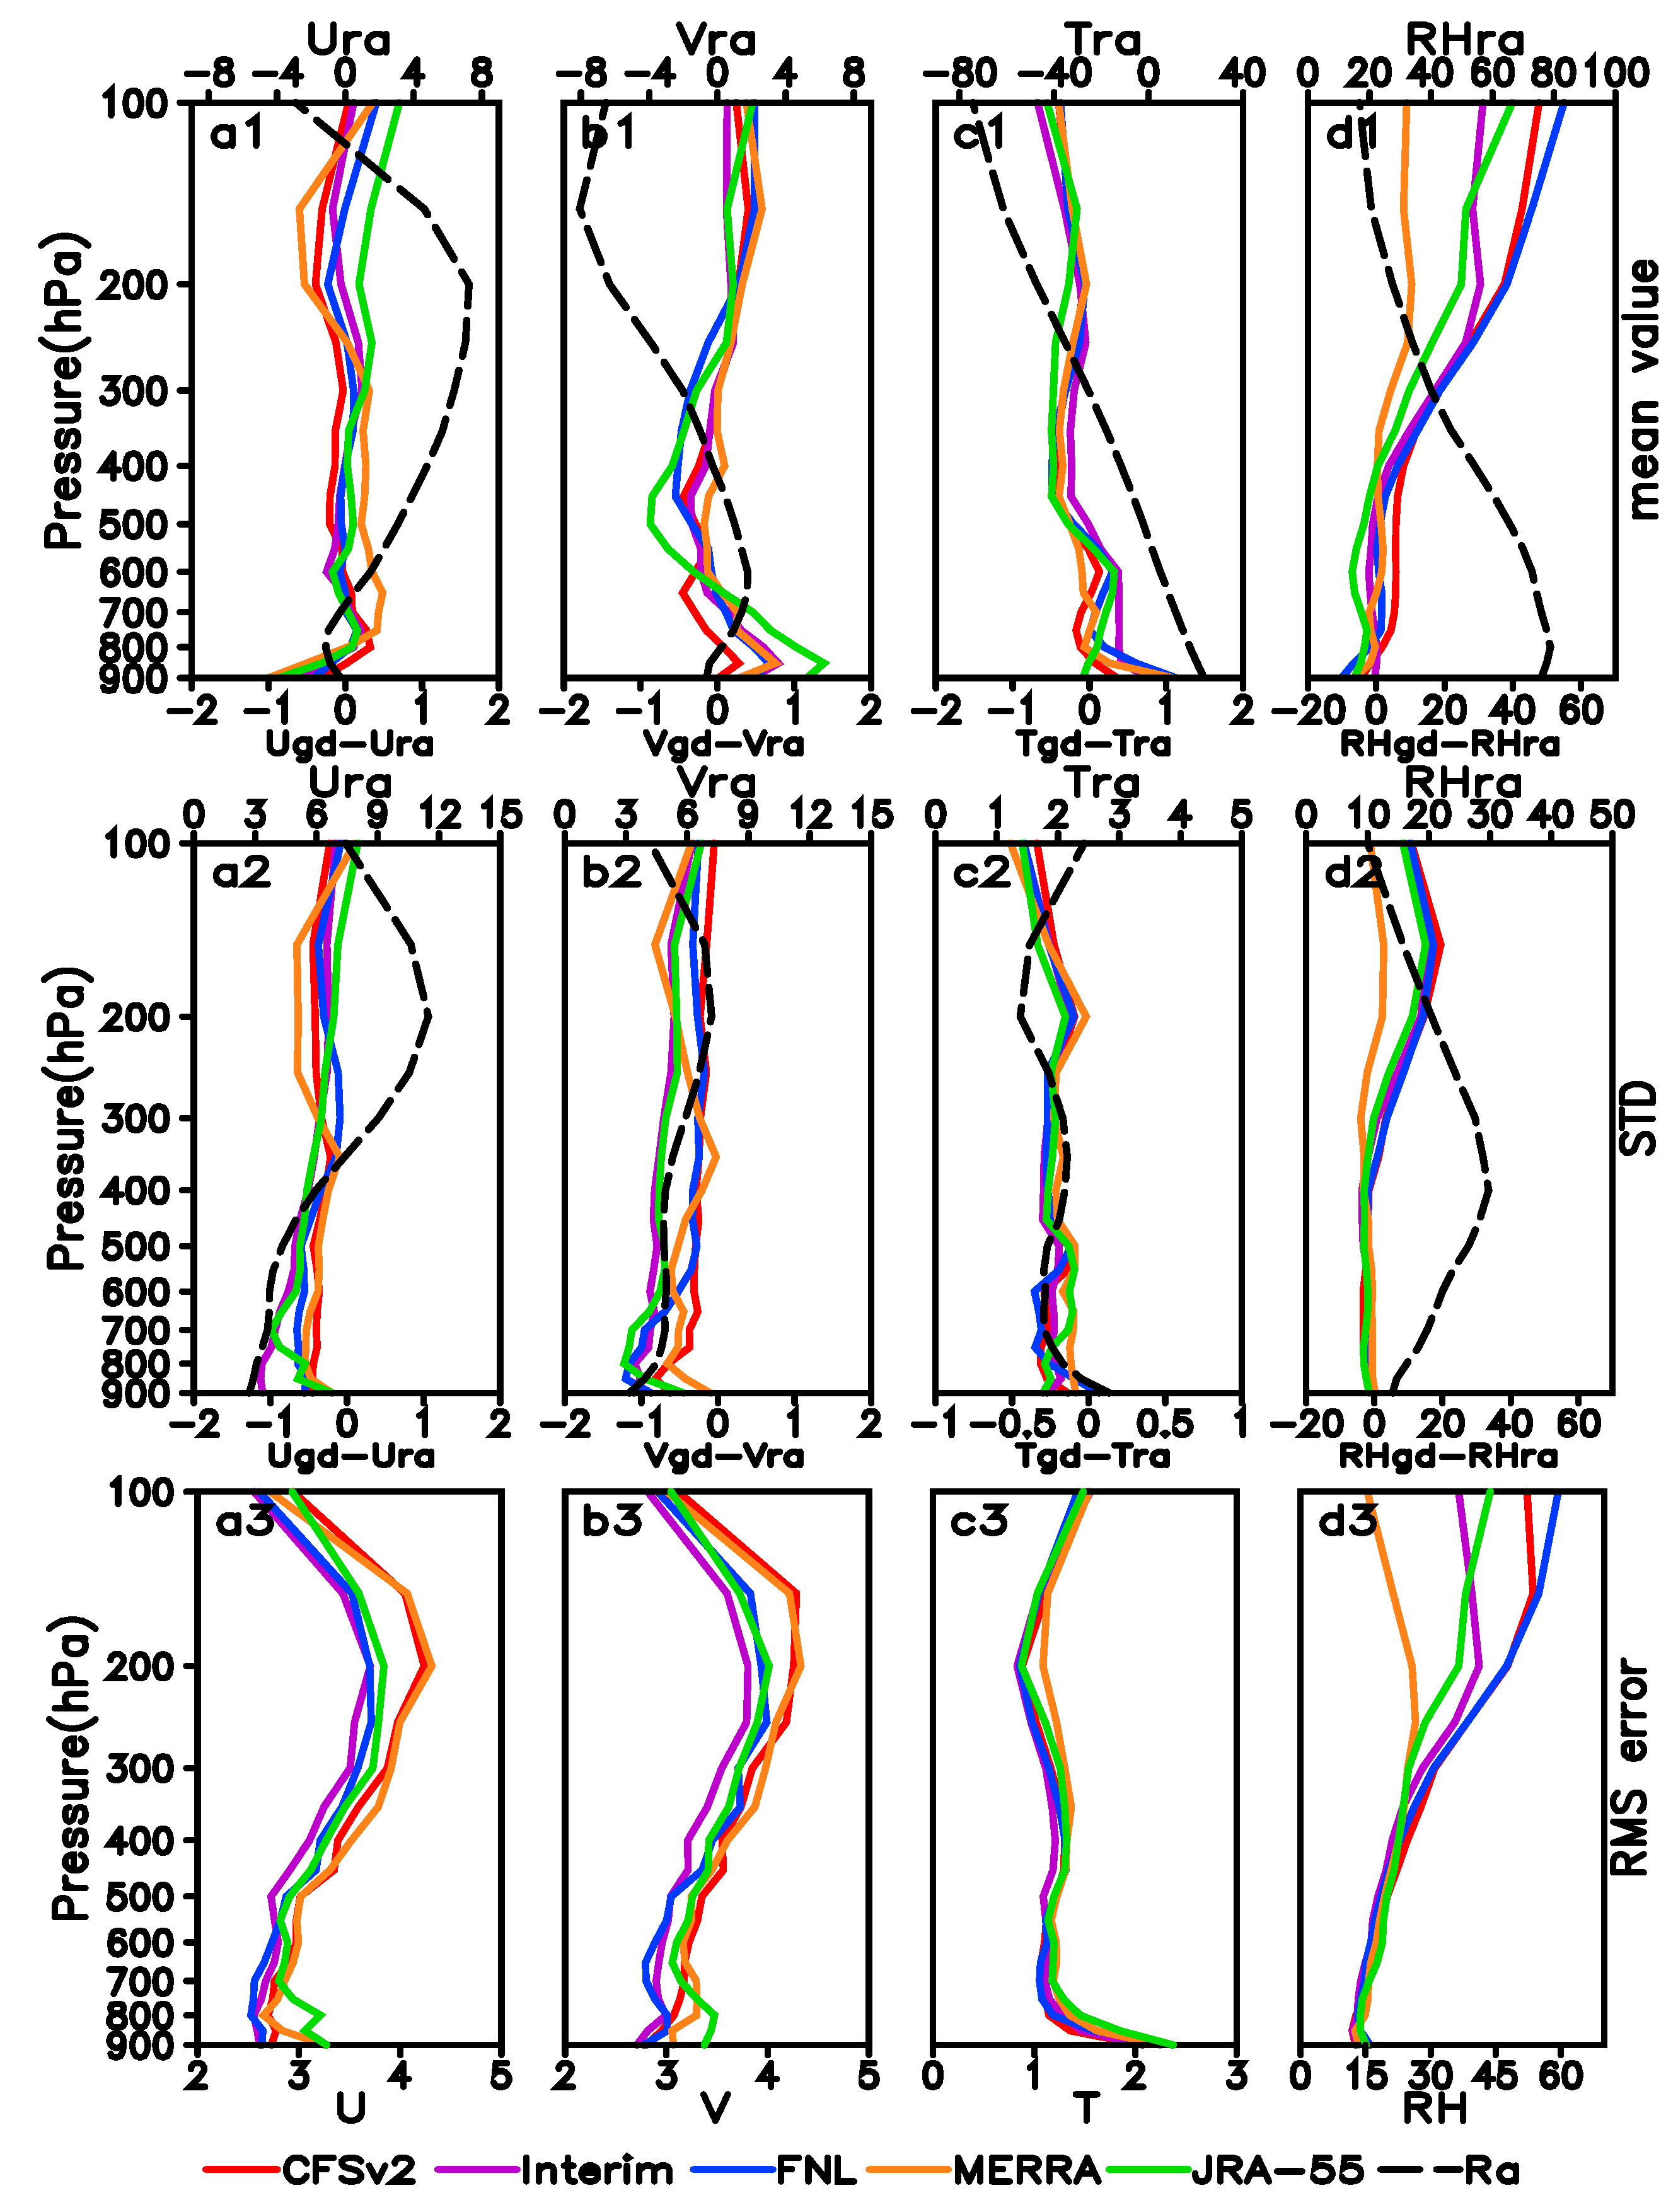
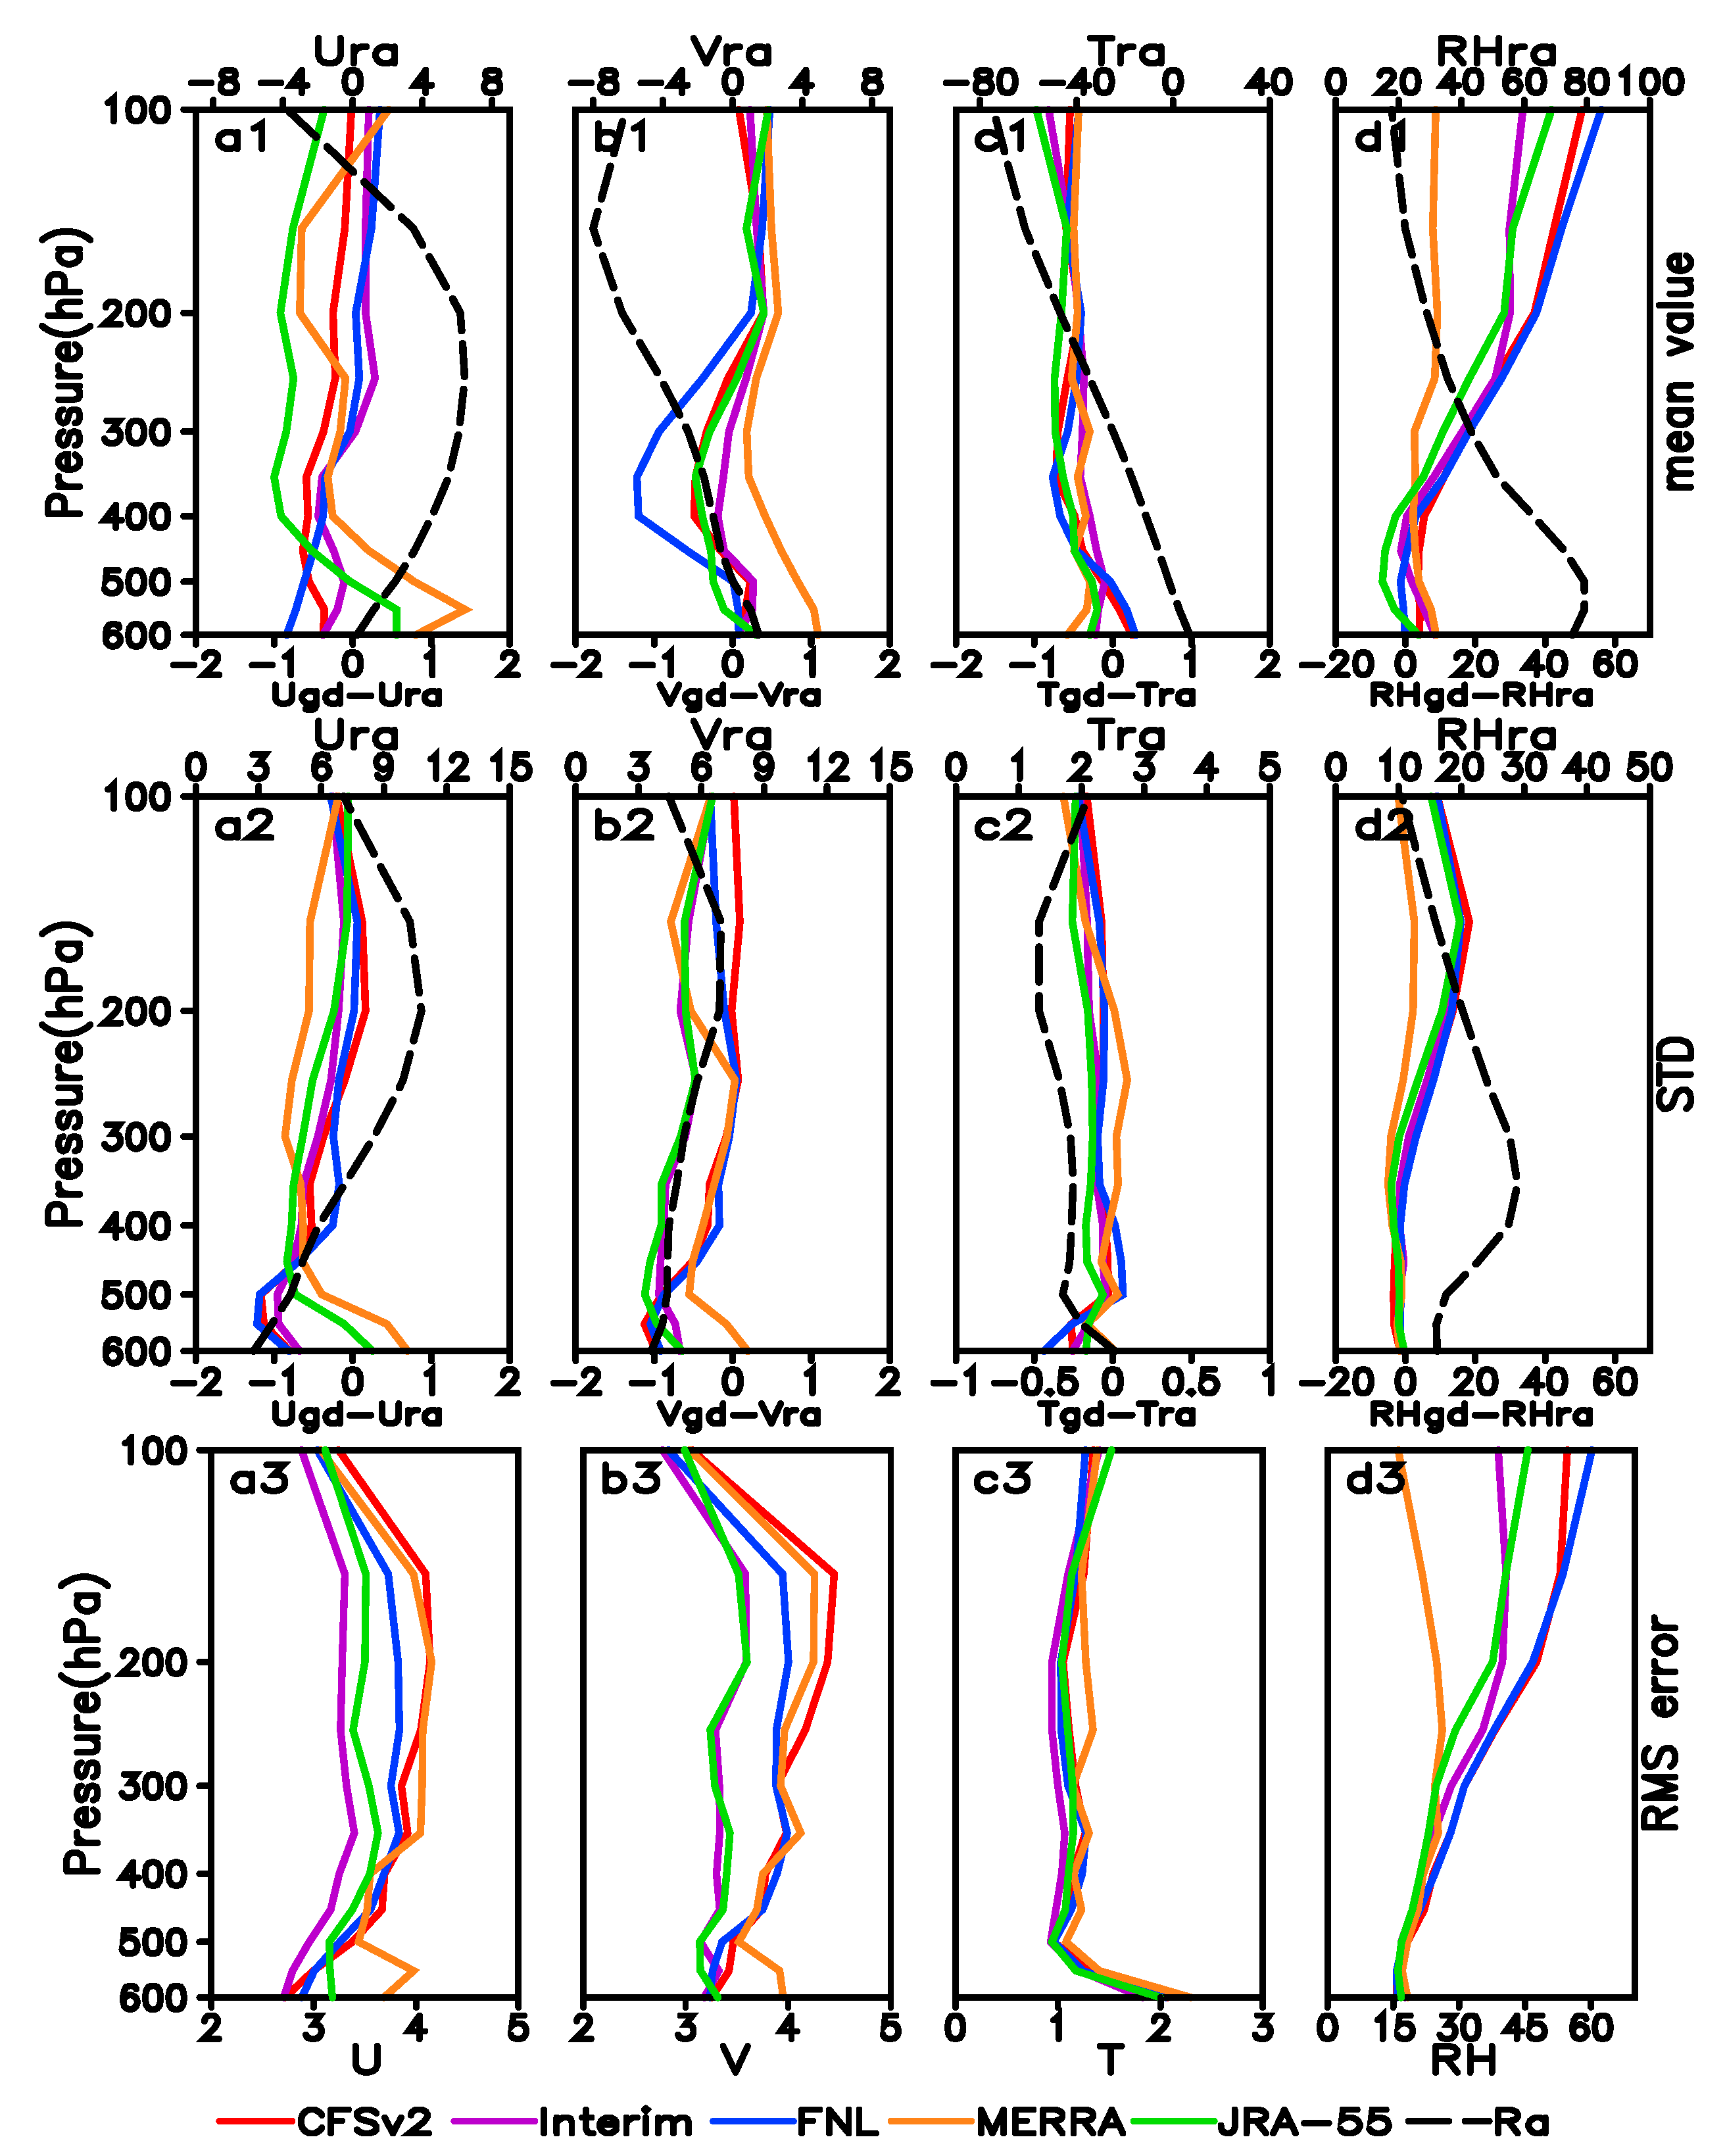
3.1. Overall RMS Error and Mean Bias

To further clarify the quality and utility of the five GDs over the EDTP in terms of RMS error and mean bias, the GDs were verified against the data of all independent radiosonde observation sites. Figure 2 shows the mean difference of the mean value STD of radiosonde data and GDs, mean bias, and RMS error averaged over the sites in the basin.
Analysis of about 1500 samples revealed that mean zonal wind (U) increased with height from about −0.5 m/s at 900 hPa to about 8 m/s at 200 hPa (Figure 2a1). The meridional wind (V) was southerly at mid to lower levels with a peak of about 2 m/s at 750 hPa and northerly above 400 hPa (Figure 2b1). The mean values of U(V) from the five GDs and radiosonde data showed evident divergence under 800 hPa (400 hPa), with the largest difference shown in MERRA (JRA-55). The evident divergence of STD of U(V) from the five datasets was under 600 hPa and between 250 hPa and 150 hPa (between 900 hPa and 100 hPa). On average, all of the GDs underestimated the STD of U(V) from the radiosonde data. Among these, Interim and MERRA (Interim) showed the most underestimation under 600 hPa and 250 hPa to 150 hPa (under 200 hPa) and MERRA (CFSv2) gave the least underestimation under 350 hPa (between 900 hPa and 100 hPa; Figure 2a2,b2).
The mean bias of U and V of GDs against radiosonde data are plotted in Figure 2a1,b1. The U value generally showed mean bias of ±0.5 m/s, except at the ground layer (Figure 2a1). The mean bias of the V value was greater than that of U and was mostly within ±1 m/s (Figure 2b1). At higher levels, the mean bias profile of U diverged largely between the five GDs, with the largest negative (smallest positive) mean bias shown in MERRA (JRA-55). The mean bias profile of V also diverged greatly between the five GDs, with the largest negative and positive bias in JRA-55 and the smallest positive bias in CFSv2 at lower levels.
Figure 2a3,b3 shows that the RMS error of U and V in the five GDs was about 2.6–4.3 m/s. The RMS error increased with height at mid-levels (700 hPa–200 hPa), but decreased under 700 hPa or above 200 hPa. On average, Interim gave the smallest value of RMS error in the entire layer. For CFSv2 and MERRA, the RMS error of U and V from the GDs verified against the radiosonde data was the largest among the five GDs, at 4.2 m/s at about 200 hPa; therefore, it is important to verify daily weather in the basin when using these two analyses.
In addition to U and V, T and RH were evaluated for a comprehensive determination of GD quality. Figure 2c1 shows that the mean T decreases with height and with a strong vertical gradient. Figure 2c2 shows that the five GDs underestimated the STD of the radiosonde data through the troposphere. Figure 2c1 shows that the five GDs had a warm (cold) bias under (above) about 500 hPa except for JAR-55 near the surface and CFSv2 at about 750 hPa. Evident divergence of the mean bias of T from the five datasets occurred at lower levels (under about 600 hPa). Near the surface, the difference between the largest (Interim, FNL, and MERRA) and smallest (JRA-55) mean bias of T was more than 1 °C. Figure 2c3 shows that the RMS error of T was about 2.5 °C near the surface and decreased to 1.1 °C at 800 hPa. The RMS error of the T remained stable at mid-levels and increased relatively fast at upper levels, with little difference among the GDs. The largest error was present in JRA-55 at lower levels and in MERRA at mid- and upper levels, whereas the smallest error occurred in CFSv2 near the surface and in Interim above 700 hPa.
Figure 2d1 shows that RH increased from about 75% near the surface to about 85% at 800 hPa and decreased from about 85% at 800 hPa to 17% at 100 hPa. The GDs showed small underestimation except for CFSv2 under 400 hPa and large overestimation except for MERRA above 300 hPa. Figure 2d2 shows that the STD of RH increased from about 5% near the surface to 35% at 400 hPa, then decreased from 35% at 400 hPa to 0% at 100 hPa. The difference between the GDs and radiosonde data was very small under 400 hPa. For the RH bias (Figure 2d1), CFSv2 (JRA-55 and MERRA) showed an obvious wet (dry) bias under 400 hPa. In particular, MERRA was the closest to the radiosonde data in the entire layer. Figure 2d3 shows that the RMS error in the GDs usually increased with height from about 14% at 900 hPa to about 27% (positive peak) at 250 hPa, and showed the most stability from 900 hPa to 100 hPa.
Compared with those in the basin, many new characteristics of the four variables were discovered in the TP (Figure 3). Firstly, the divergence of the mean values from the five GDs become larger, particularly in U and V. The highest mean bias of V at the low layer (about 400 hPa) was 1.5 m/s greater than the lowest one, which is more than twice that in the basin. Secondly, the mean value of T near the surface was underestimated partly by Interim, MERRA, and JAR-55 compared with that for the radiosonde data. The STD of T near the surface became larger, and the warm bias disappeared. It is worth mentioning that the performance of Interim in the EDTP is similar to the performance for the main area of the TP according to the study of Bao and Zhang (2013) [17]. They found that Interim correlated better to the sounding observations for the main area of the TP. We deduced that Interim is more suitable for high mountain regions.
The GDs were sensitive to the changes in terrain. The mean value, STD, mean bias, and RMS error in MERRA were overestimated in the TP, but were underestimated in the basin near the surface. The mean bias of V in FNL at about 400 hPa reached the negative peak in the TP (Figure 3b1), but was not obvious in the basin.

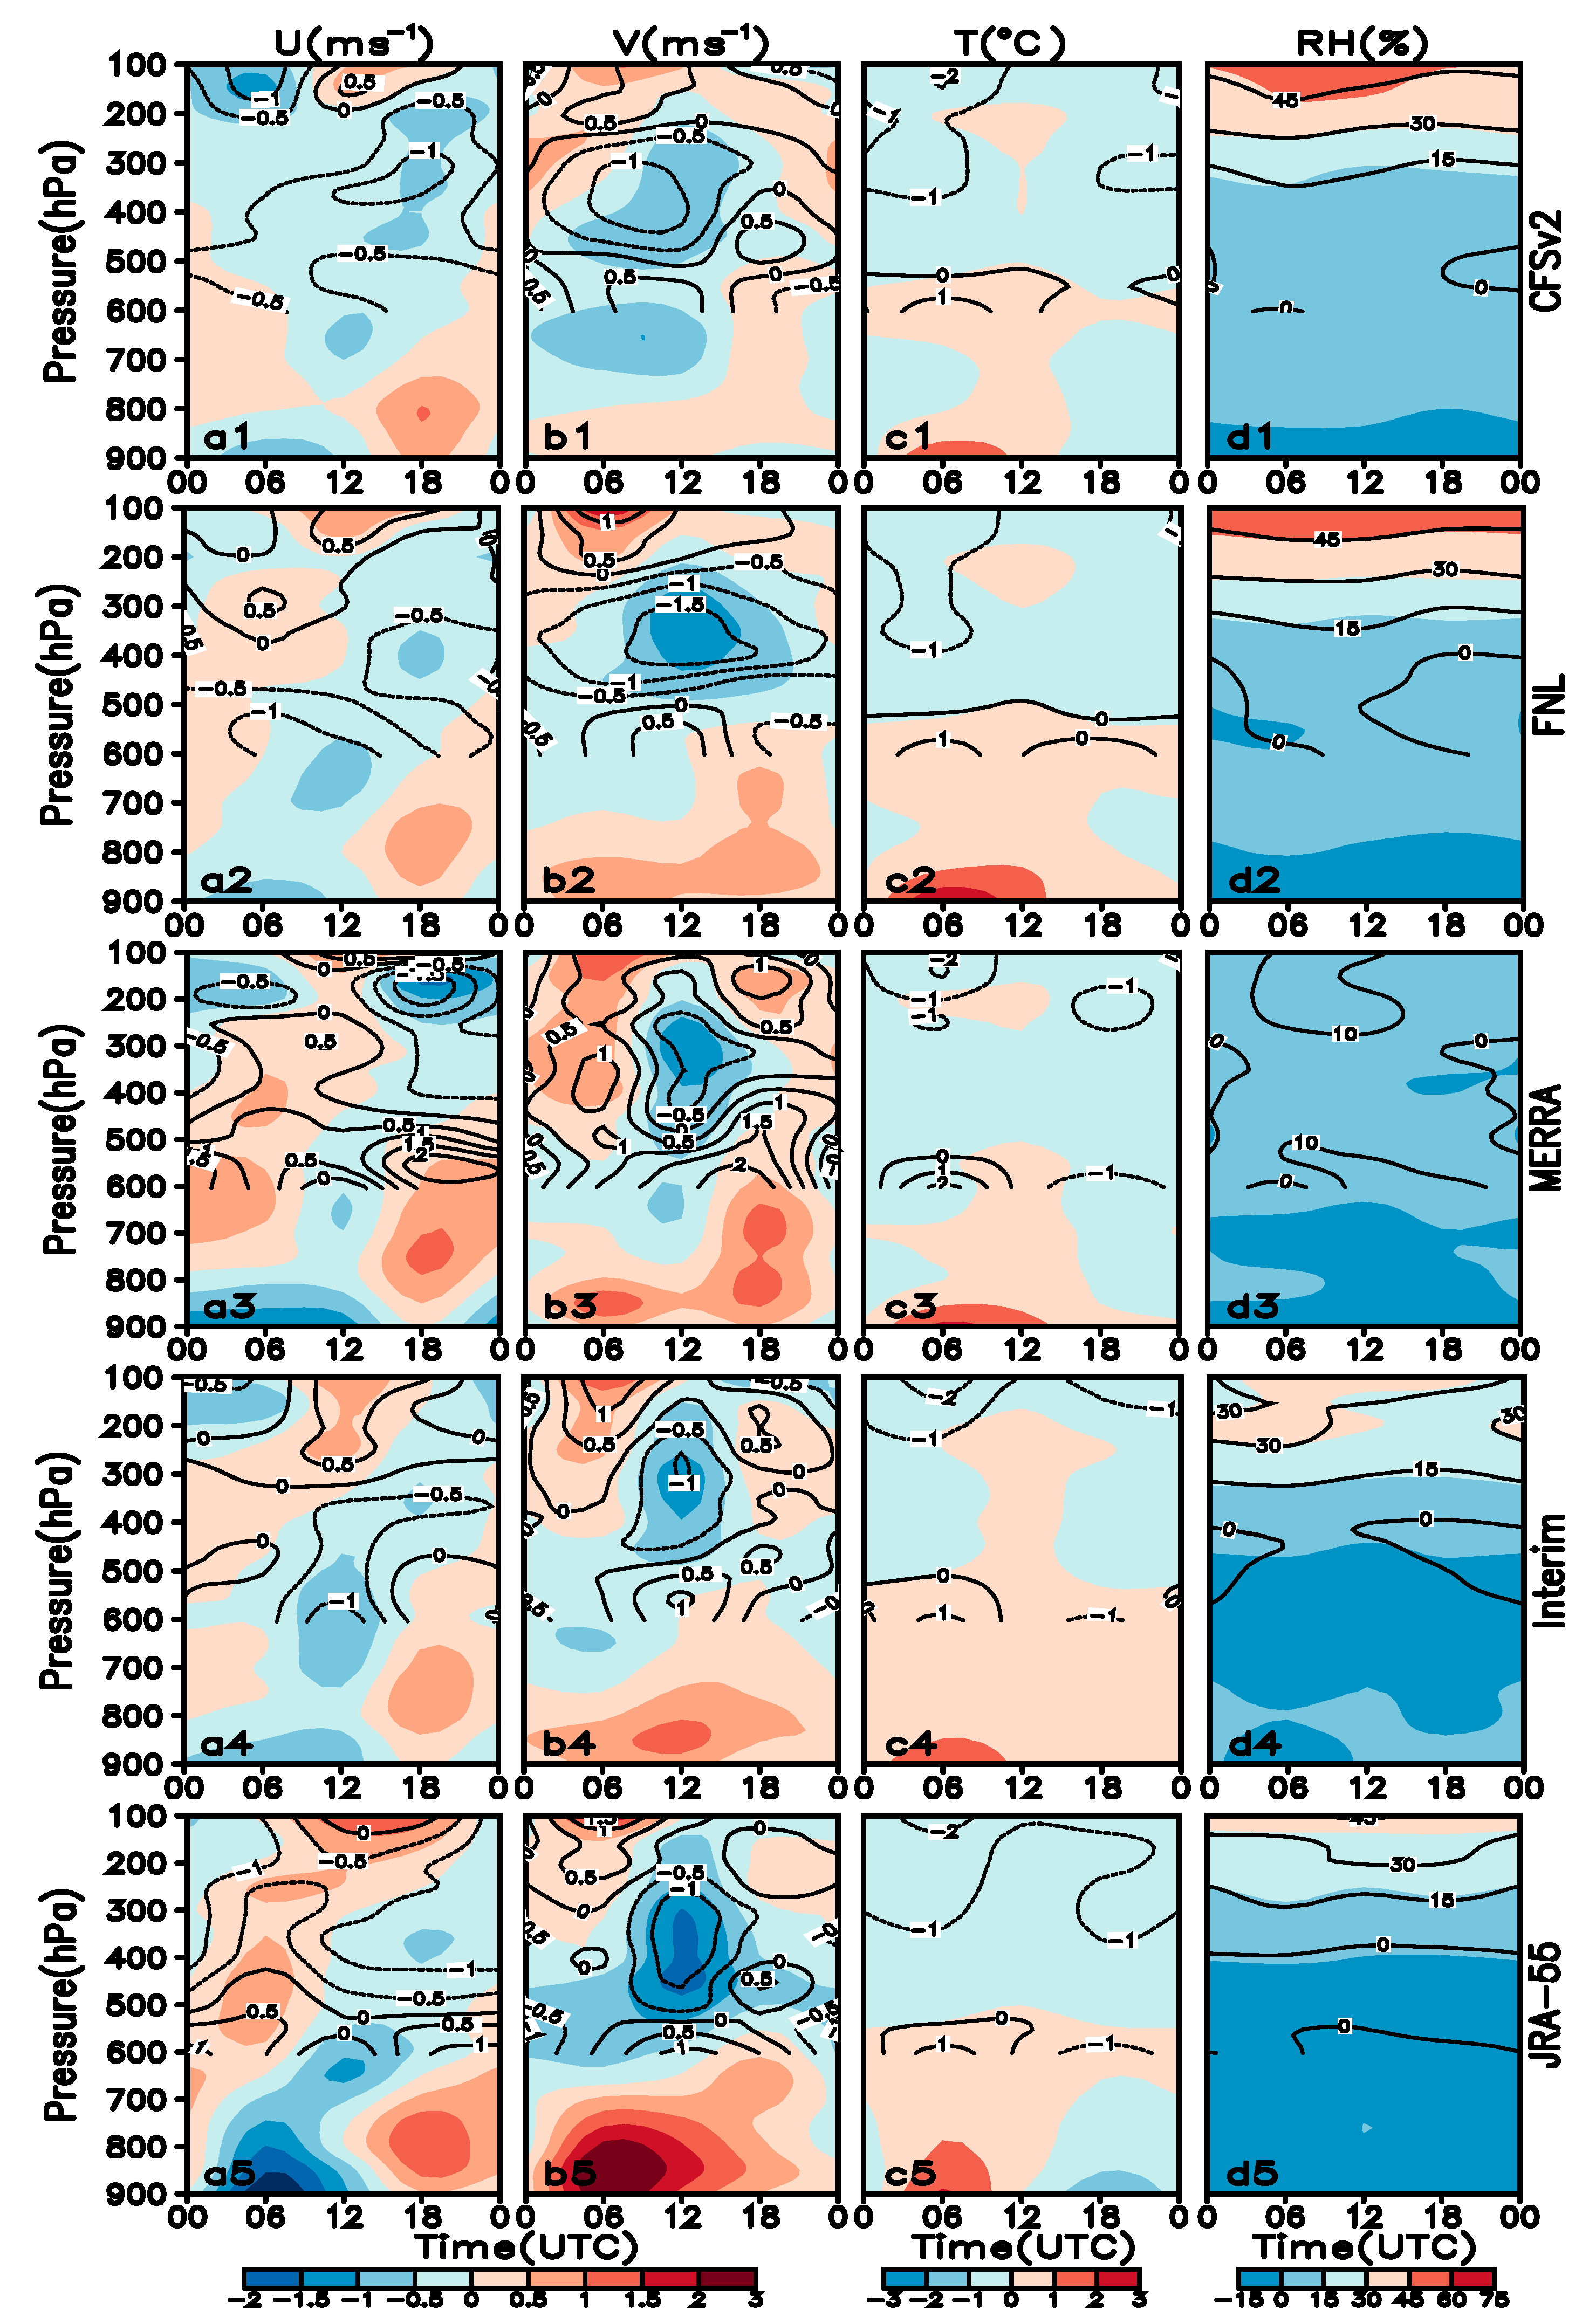
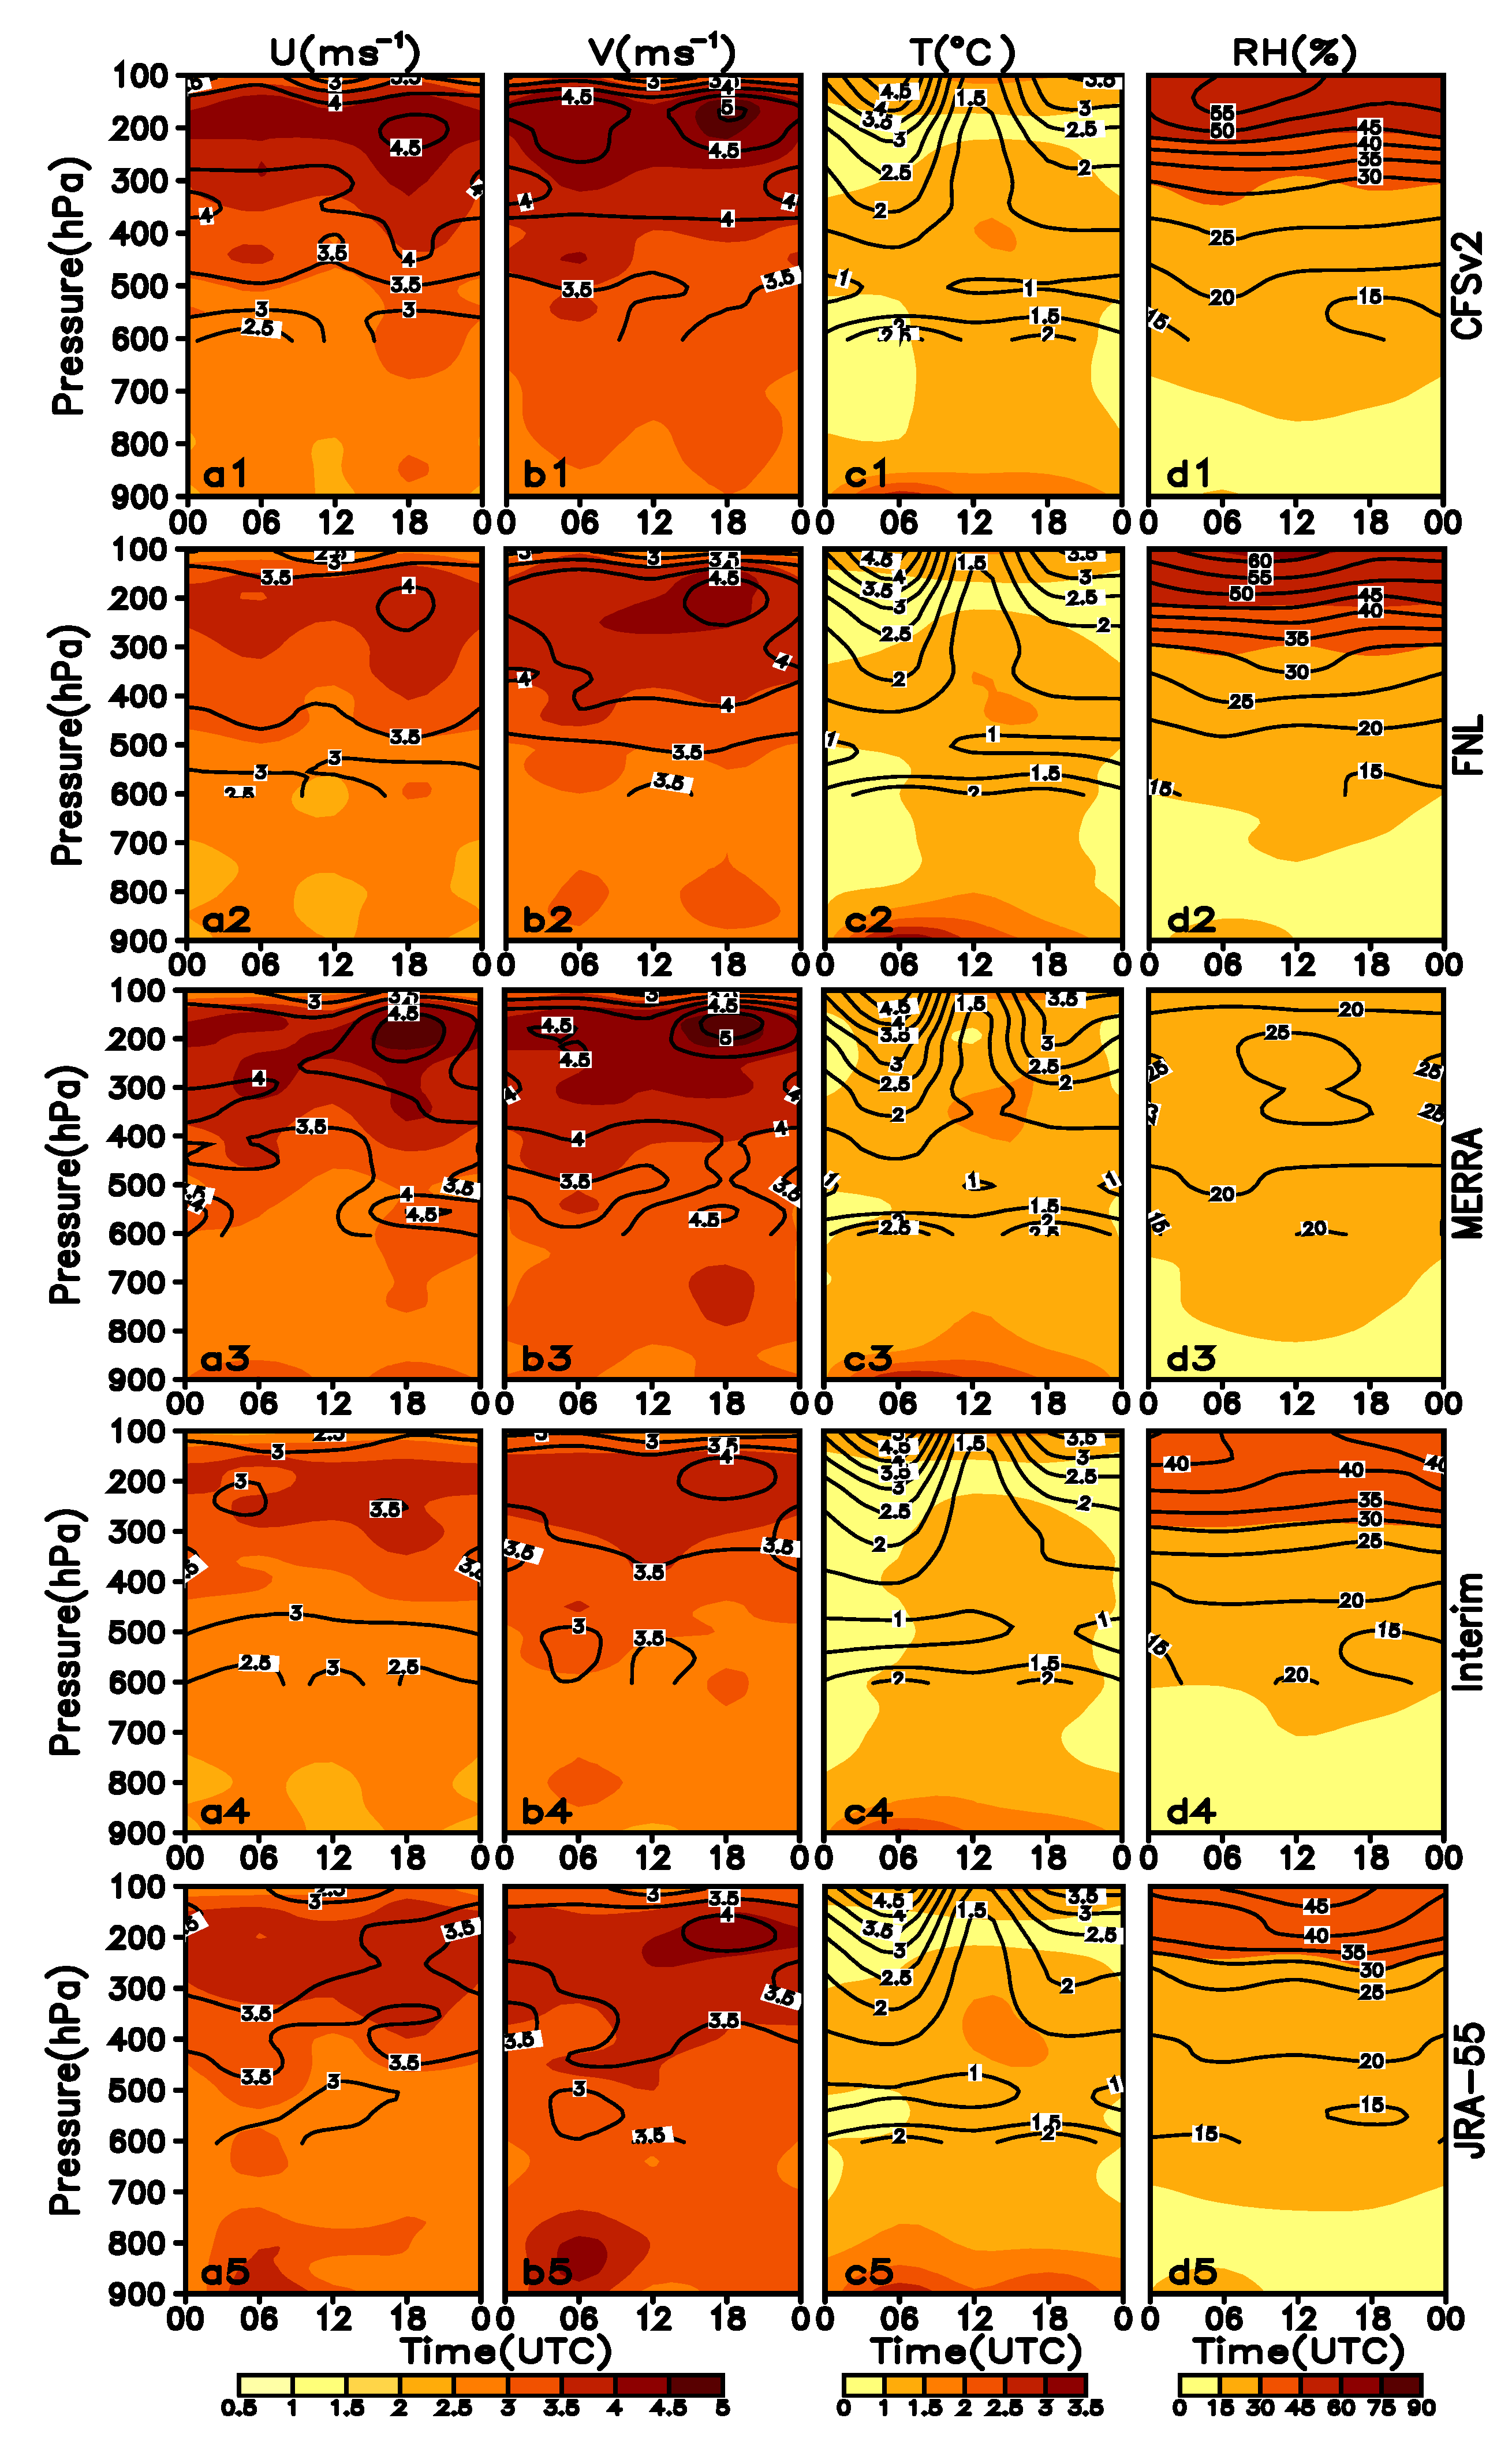
3.2. Diurnal and Interannual Variations of the Mean Bias and RMS Error

Diurnal variations in RMS error and mean bias can enable further understanding of the uncertainties in the GD and the regional-scale diurnal cycles [34]. Figure 4 and Figure 5 show that there are strong diurnal variations in both mean bias and RMS error in the five GDs, as also noted in a study by Bao and Zhang (2013) [17]. However, the time when the peak occurred is different between in the EDTP and in the main area of the TP. The degree of diurnal variation also differed greatly at different pressure levels for different GDs.
The 6-h variations of mean bias for the GDs are shown in Figure 4. For JRA-55, the mean U(V) bias showed the strongest diurnal variations among five GDs and a positive peak at 18:00 UTC (06:00 UTC) and a negative peak at 06:00 UTC (12:00 UTC). The predominant peak usually occurred near the surface except for the negative peak for V at about 400 hPa. In the TP, however, the strong negative U peak near the surface did not occur at 06:00 UTC, although the positive one occurred at 12:00 UTC (Figure 4a5,b5). The mean bias profiles of U and V for Interim (Figure 4a4,b4) were very similar to, but much weaker than, those of JRA-55. The mean bias profiles for V for CFSv2, FNL, and MERRA (Figure 4a1,b1,a2,b2,c1,c2) differed from those for Interim and JRA-55, which had predominant positive peaks at 18:00 UTC. The peak that occurred in the basin may not have occurred at the same time (Figure 4b2,b5) or may not existed at all (Figure 4a1,a4,a5) in the TP.
The diurnal variations in the mean bias of T were very obvious with little difference shown among five GDs (Figure 4c1–c4). The positive peak occurred at about 06:00 UTC near the surface, and the negative peak occurred at about 18:00 UTC in JRA-55. The warm bias usually occurred near the surface, whereas the cold bias occurred at upper levels. The difference in the mean bias profiles for T between the basin and plateau were not obvious.
For the diurnal range of RH in the basin between 00:00 UTC and 18:00 UTC, a good agreement with the radiosonde data was maintained in CFSv2 and JRA-55 (Figure 4d1,d5). The strong diurnal variations in the mean bias of RH in FNL, MERRA, and Interim usually occurred in the daytime (Figure 4d2–d4). The value of the difference between the wet and dry peaks was about 0%–30%.
Figure 5 shows the 6-h variations of RMS error for the GDs. Different from the mean bias of U and V, the large value usually occurred at the upper level at 18:00 UTC (Figure 5a1–a5,b1–b5) except for the JRA-55, in which the maximum value center (MVC) occurred at the lower level at about 06:00 UTC (Figure 5a5,b5). The RMS error of T showed the predominate peak near the surface during 06:00–18:00 UTC, which is consistent with that in the basin and the plateau. The MVC of the RMS error of T in the basin always occurred at 06:00 UTC near the surface, but at 06:00 UTC and 18:00 UTC, respectively, in the TP.
The diurnal variation of the RMS error of RH was particularly obvious near the surface in the TP, and the MVC could have occurred at any time (Figure 5d1–d5). The MVC occurred during 06:00 UTC to 18:00 UTC at mid-levels only in MERRA (Figure 5d3). In the basin, obvious MVC occurred at 06:00 UTC near the surface in FNL and JRA-55 (Figure 5d2,d5).
Compared with the diurnal variations of the mean bias, the peak values of the RMS error usually occurred at upper levels and the obvious diurnal variations occurred near the surface. The results for CFSv2, FNL, and MERRA and for Interim and JRA-55 were closer to each other, respectively, with consistent peak values occurring at the same time in the basin and in the TP.
It is worth noting that although the degree of diurnal variation differed significantly for the five GDs, almost all of the peak values occurred essentially at the same time particularly for U and T. However, such strong diurnal variations cannot be generalized to other seasons owing to the finite number of samples.
The statistical indicators shown in Table 1 reveal that the largest interannual variation of mean bias (LIAVMB) of U(V) was about 1.1 m/s (1.3 m/s) at 200 hPa (900 hPa) in CFSv2 (JRA-55) and that the largest interannual variation of RMS error (LIAVRMS) of U(V) was about 1.1 m/s (1.8 m/s) at 900 hPa (200 hPa) in JRA-55 (Interim) in the basin. In the TP (Table 2), MERRA showed LIAVMB (1.0 m/s) and LIAVRMS (1.4 m/s) of U at 200 hPa and LIAVMB (1.1 m/s) and LIAVRMS (1.2 m/s) of V at 600 hPa. The large values (mean bias and RMS error) of U are more likely to occur at upper levels, whereas those of V usually occurred at mid or lower levels among the five GDs.
JRA-55 showed LIAVMB (0.7 °C) and LIAVRMS (0.9 °C) of T at 900 hPa and 600 hPa, respectively, in the basin, and Interim had LIAVMB (0.5 °C) and LIAVRMS (0.4 °C) of T at 200hPa in the Tibetan Plateau. The large values of RMS error of T were more likely to occur at 200 hPa, which is the same as that in the TP, whereas the large values of mean bias of T usually occurred at 900 hPa.
MERRA showed LIAVMB (10%) and LIAVRMS (7%) of RH at 200 hPa in the basin. The LIAVMB (8%) of RH occurred at 200 hPa for MERRA, Interim, and JRA-55, and the LIAVRMS (8%) of RH occurred at 200 hPa in Interim and JRA-55 in the TP. The interannual variation in RH in MERRA was the most obvious among the five GDs in the entire layer in the basin.
Similar to that in the diurnal variations, the peak values of the interannual variations are usually concentrated (not shown) in 2012, 2012, and 2013. However, the inter-annual variations of mean bias and RMS error showed poor agreement between the basin and the slope because the peak values did not occur in the same year. For example, the positive peak of mean bias of V occurred in 2013 in the basin and in 2014 and 2015 in the TP.

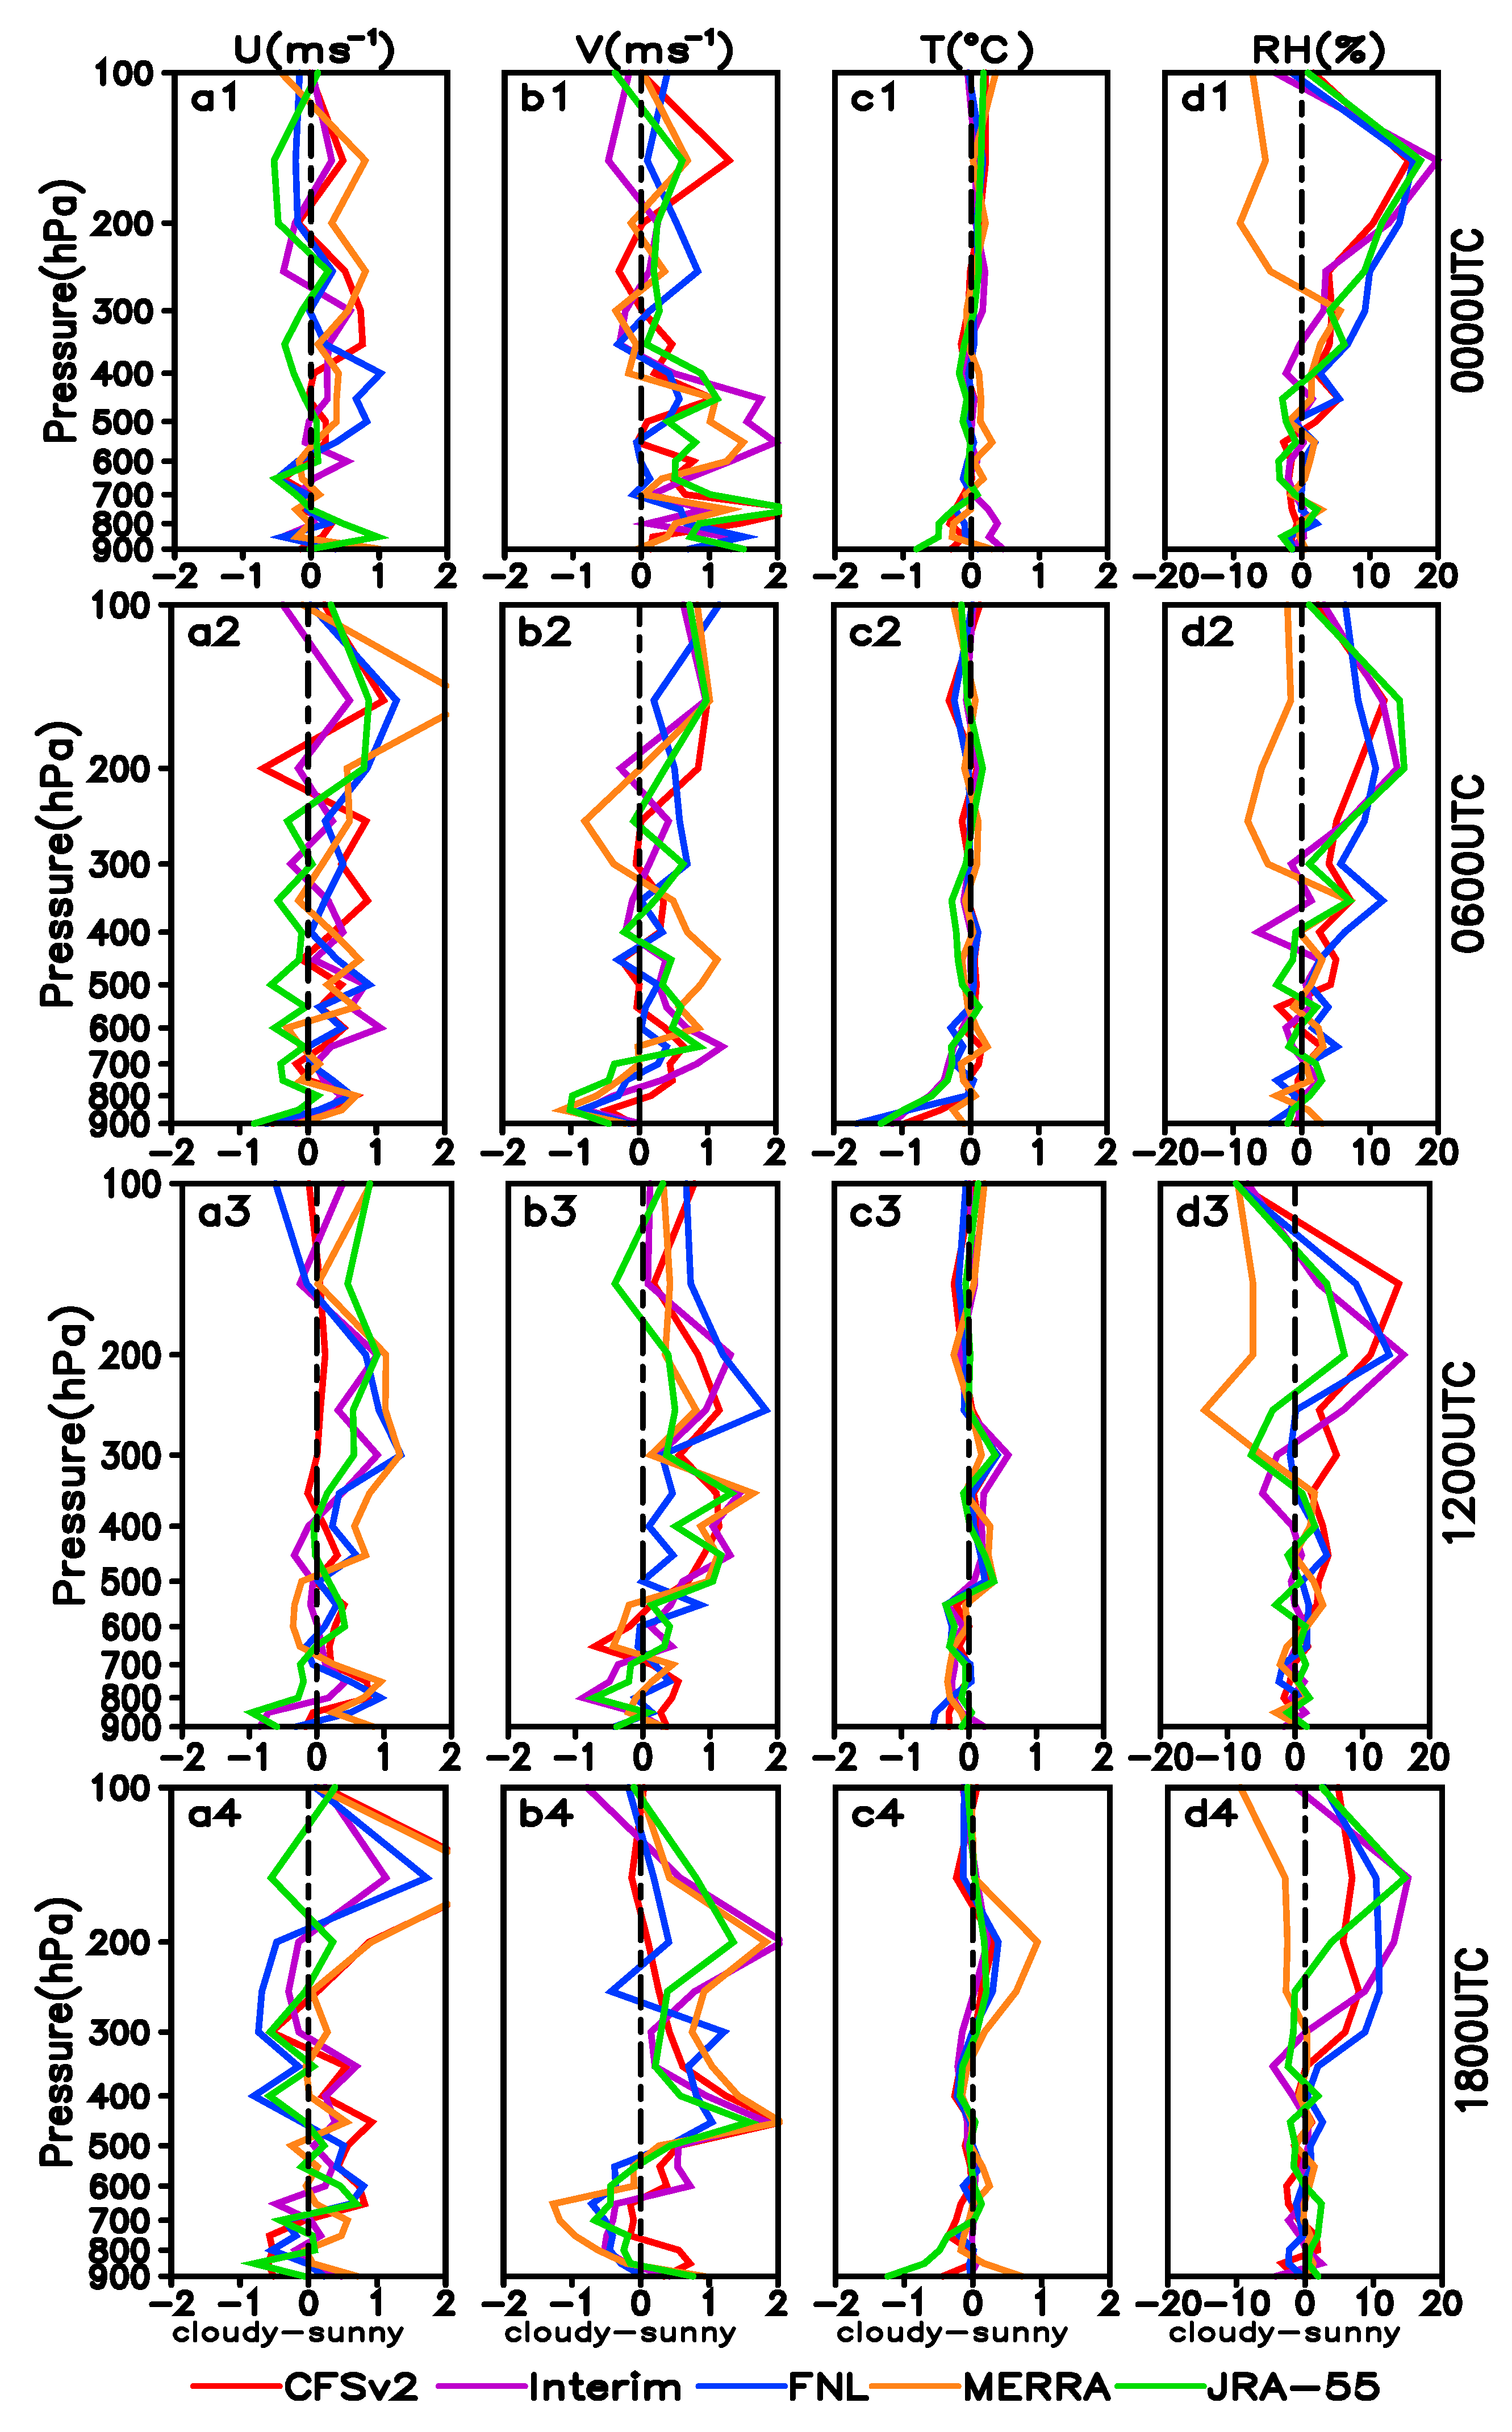
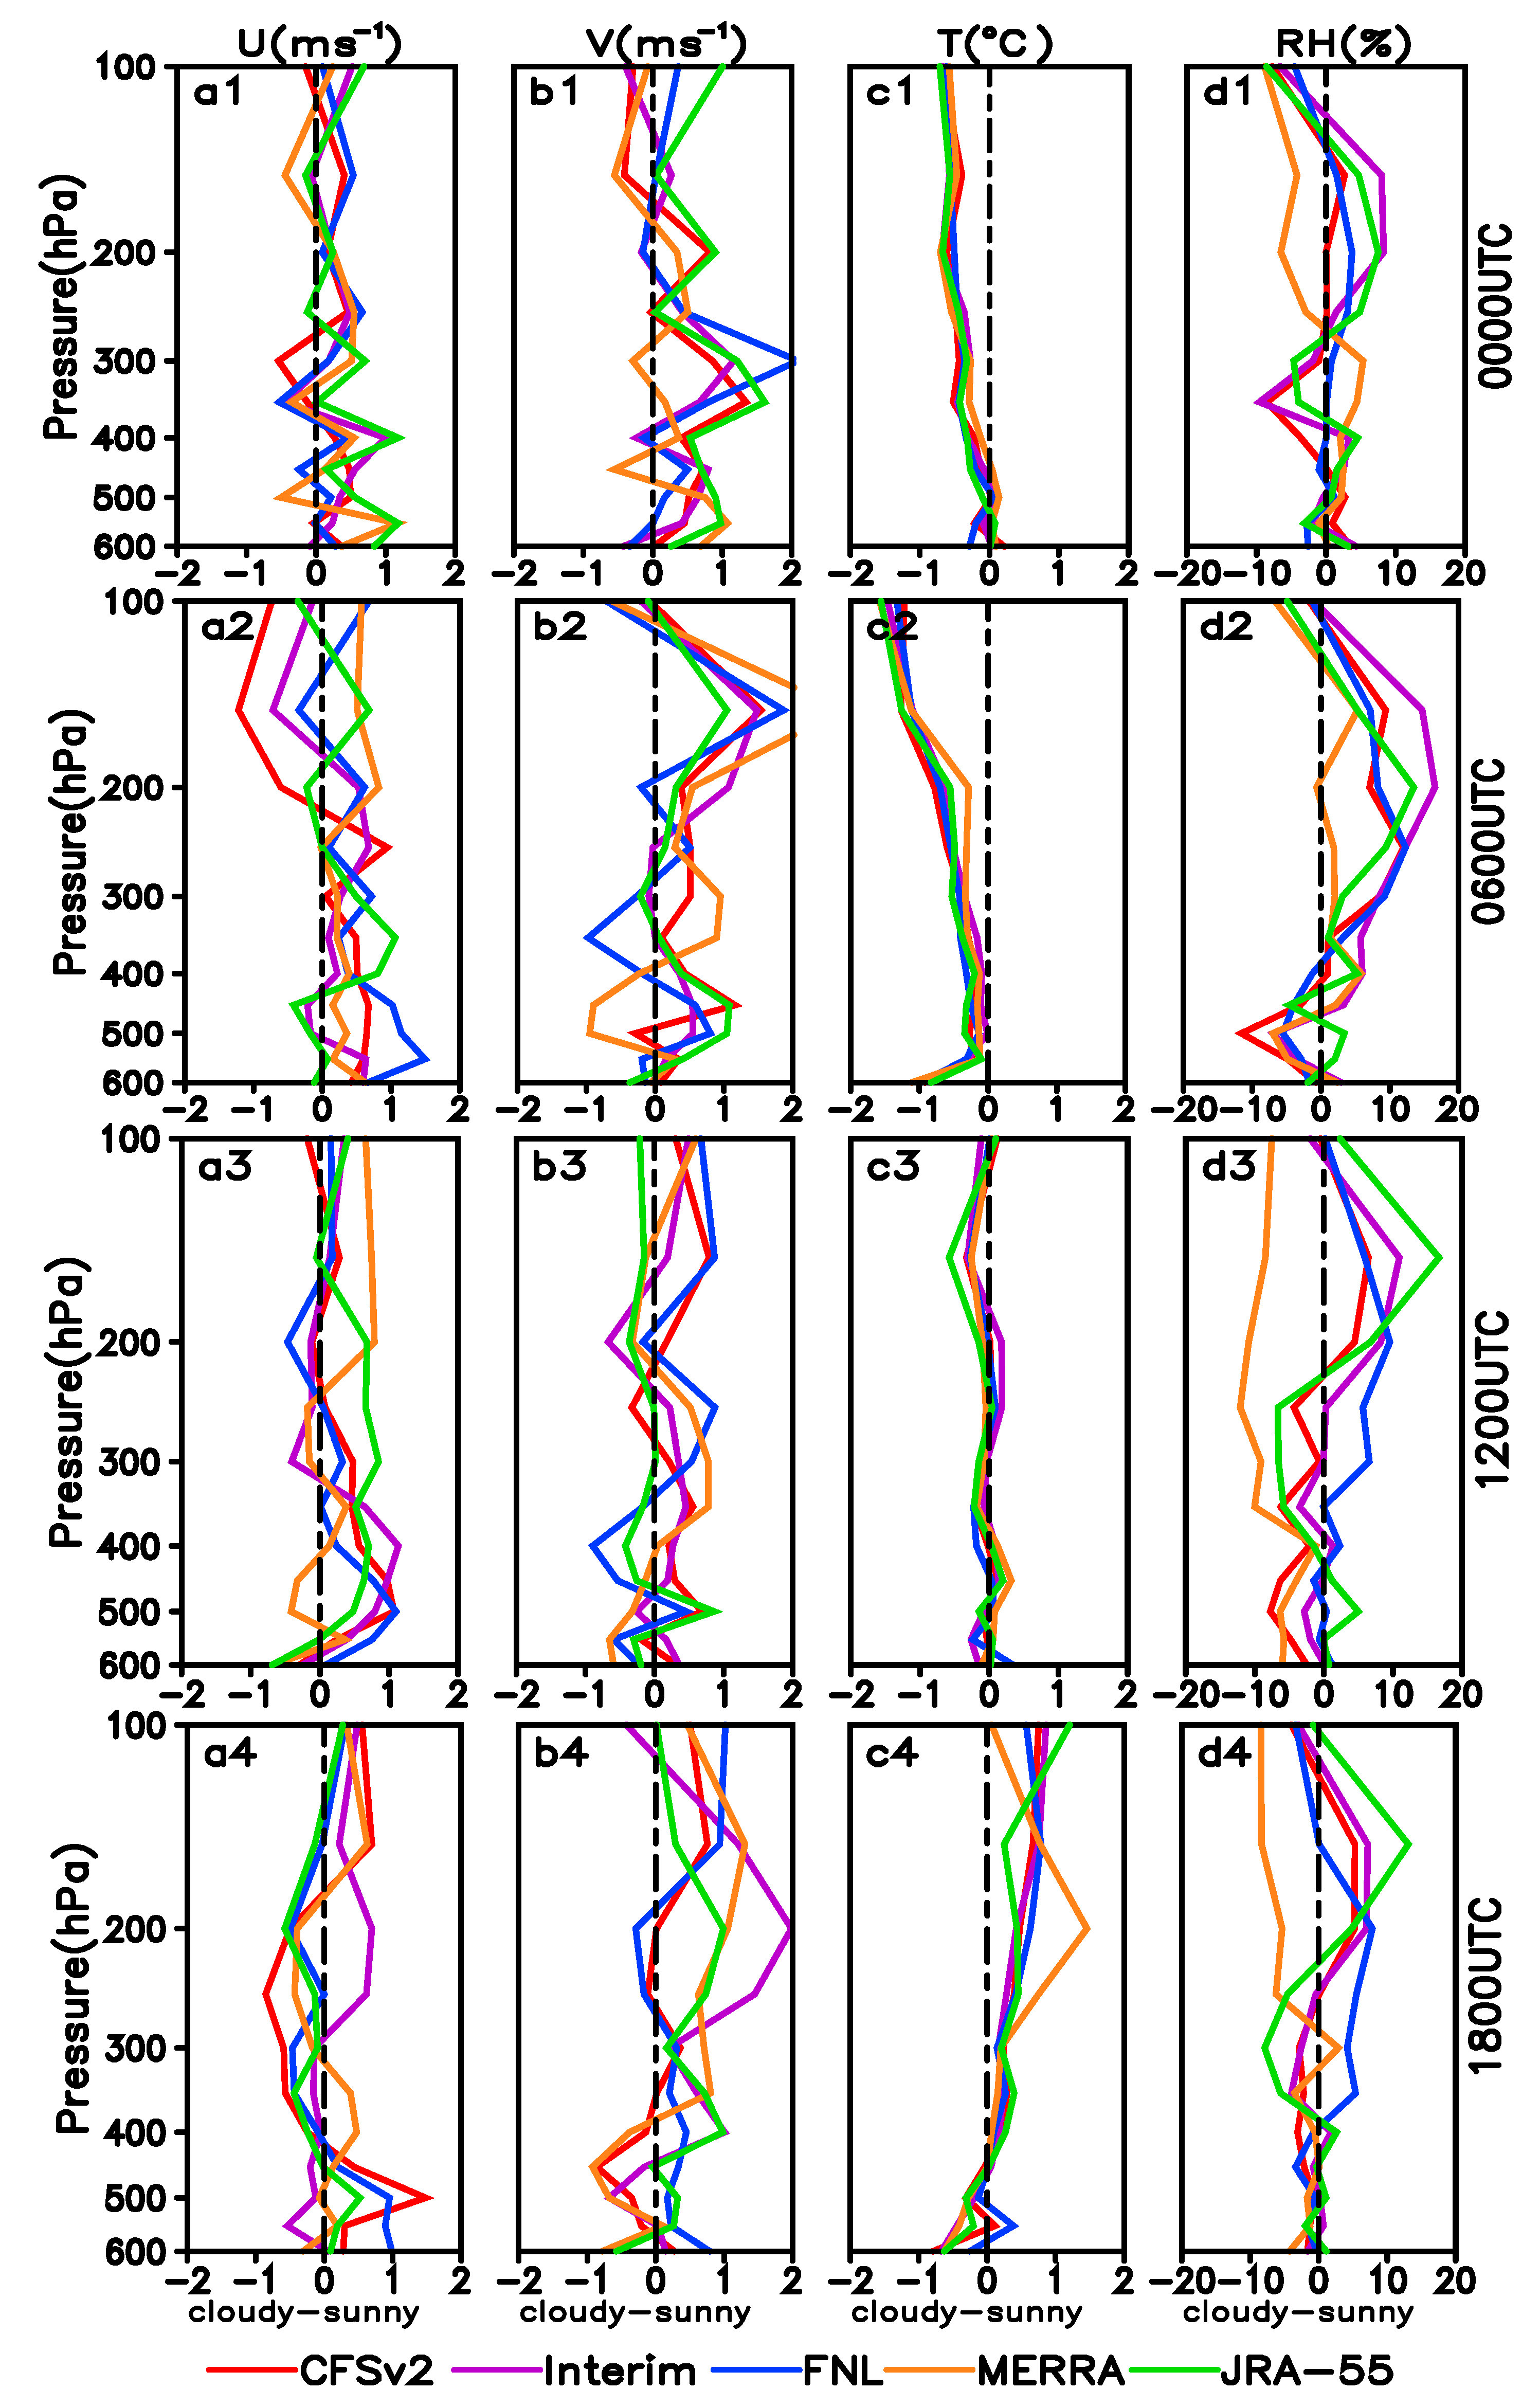
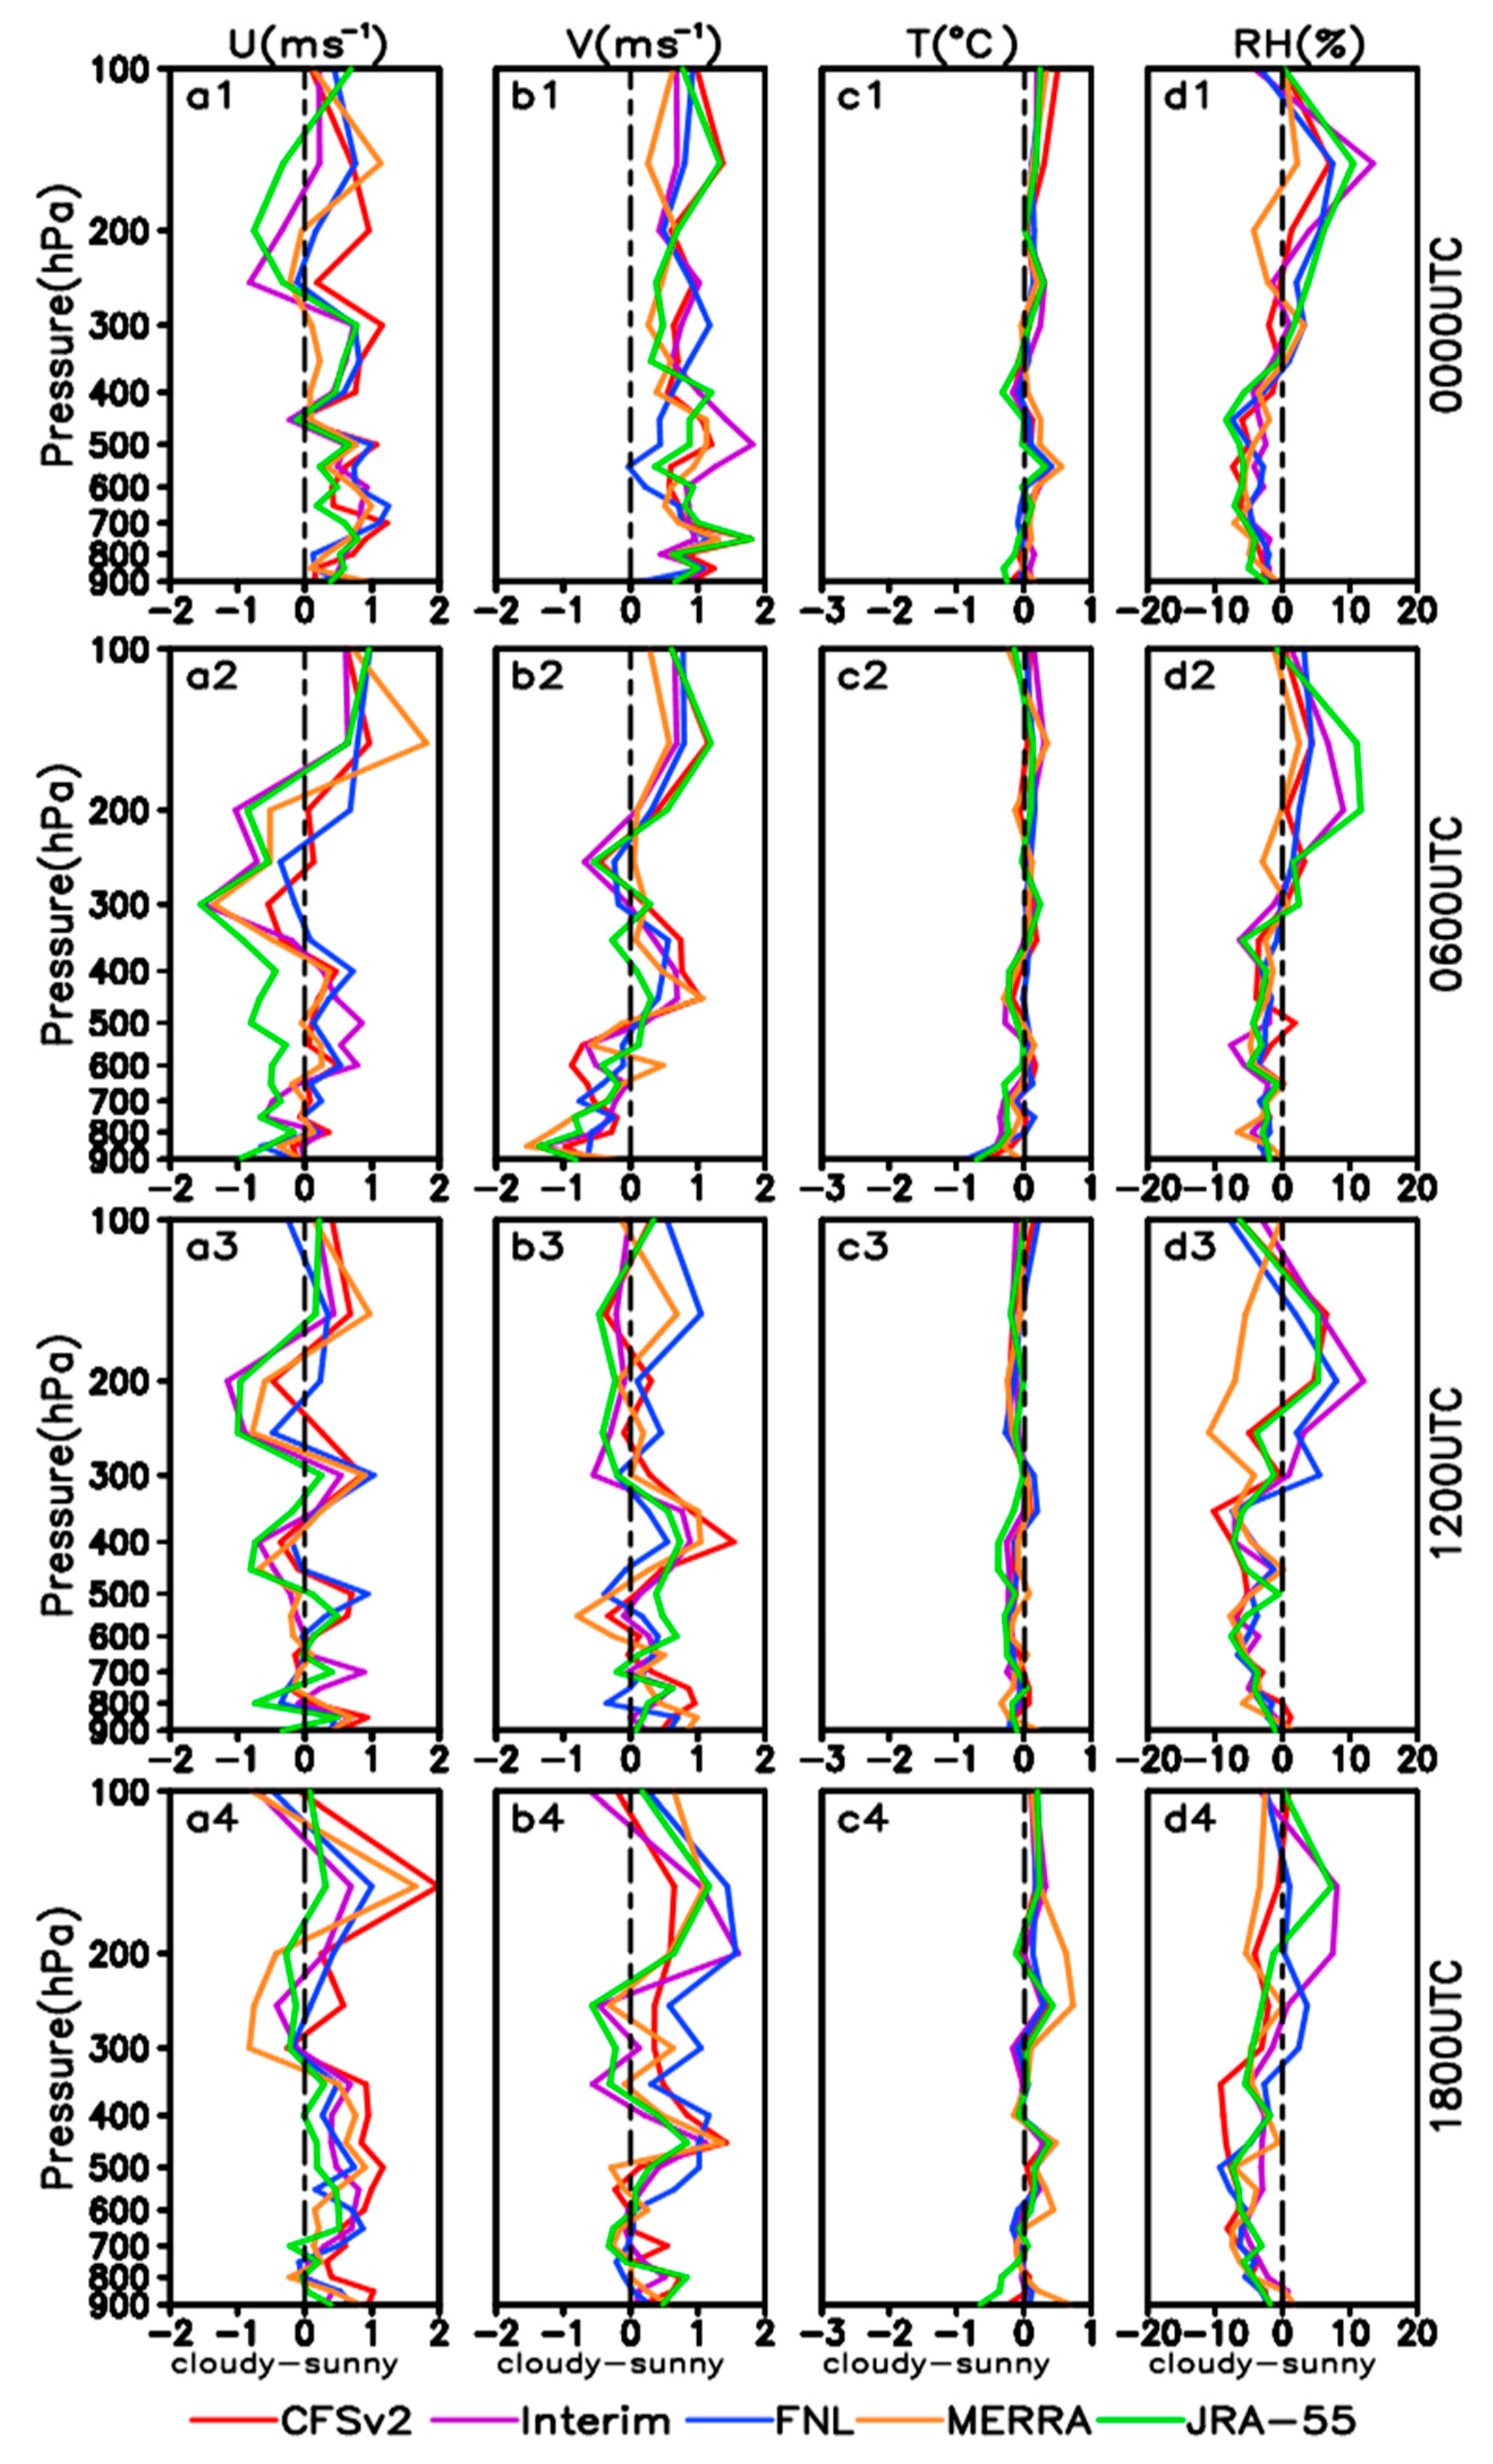
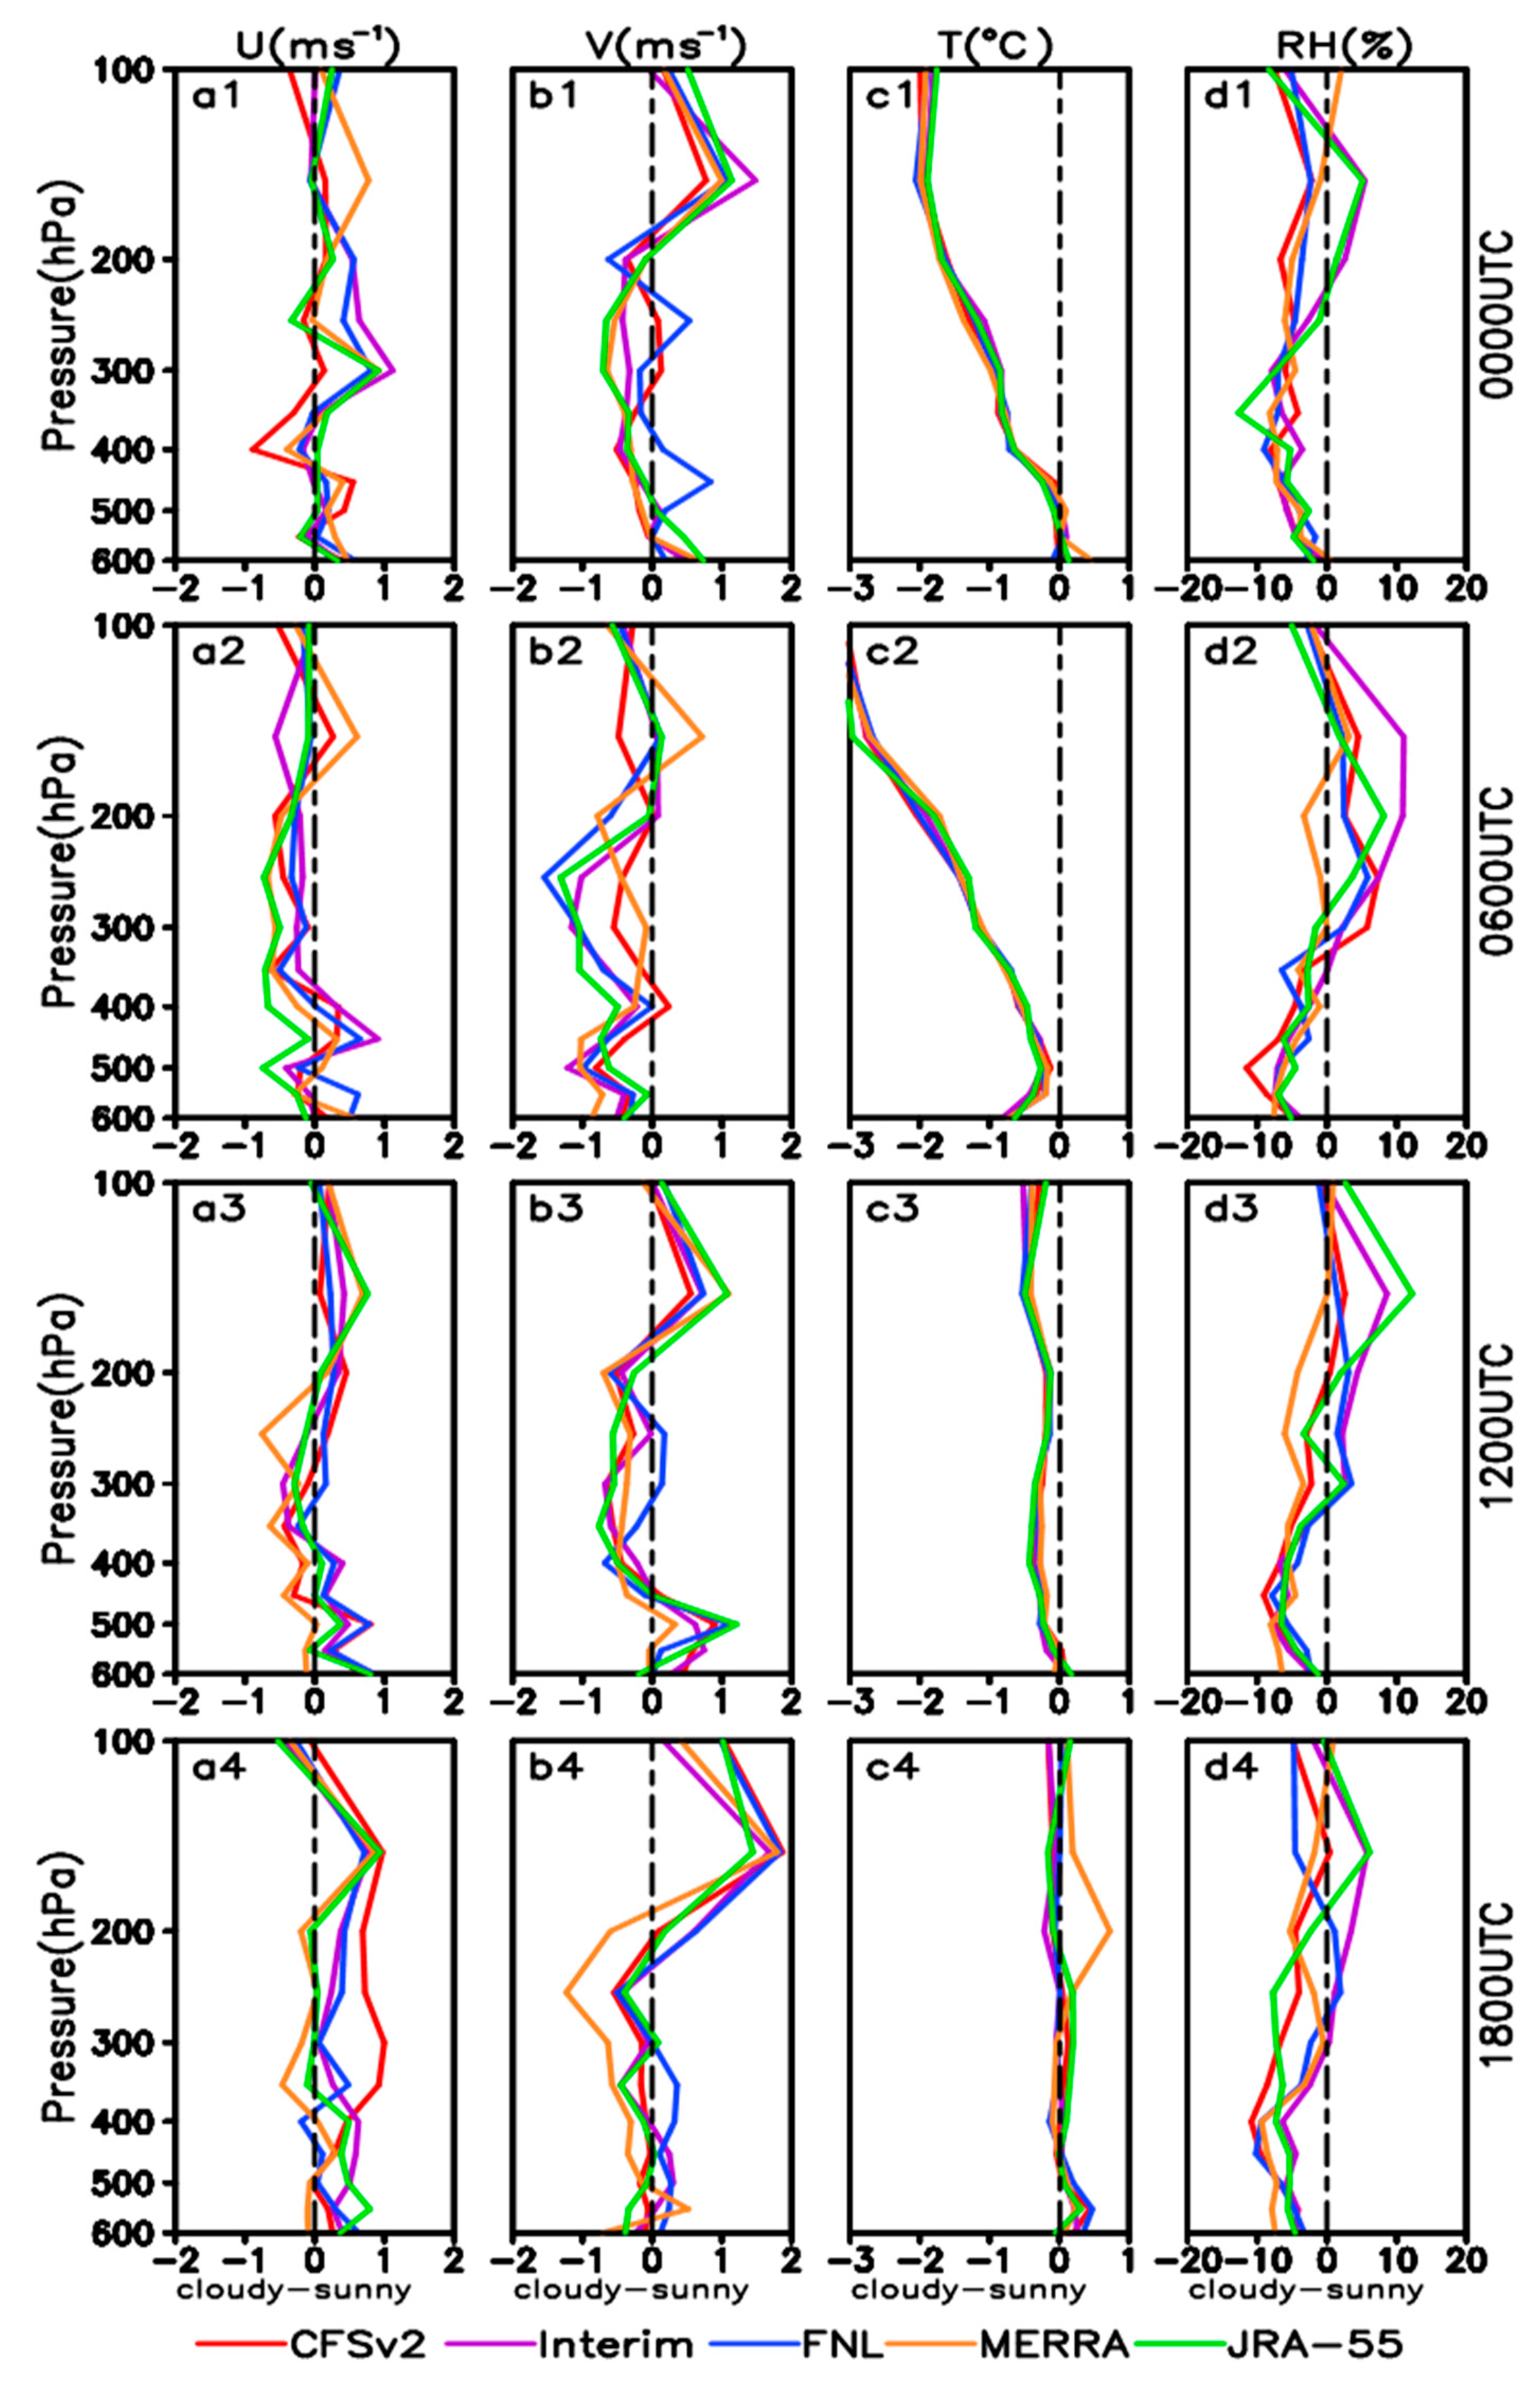
3.3. Variations of RMS Error and Bias in Different Weather Conditions

On the basis of the CTA, we divided the weather conditions into sunny (CTA < 30%) and cloudy (CTA > 70%) conditions. Because the diurnal variability of the weather in the region was very obvious, we gathered statistics on mean bias and RMS error at 00:00 UTC, 06:00 UTC, 12:00 UTC, and 18:00 UTC. The number of samples is shown in Table 3.
We tried different threshold values (values of CTA) for sunny conditions in different observation sites to make the number of samples for sunny conditions roughly equal to the number of samples for cloudy conditions. Experiments have proven that the differences in the statistics between sunny vs. cloudy days do exist. In most cases, the differences between sunny vs. cloudy days become more obvious when sample sizes of the two weather conditions roughly equal each other (figures are not shown).
Figure 6 shows the difference in the absolute value of mean bias (AVMB) on sunny and cloudy days. For U, the absolute value of mean bias on sunny days (ABMBS)was less than the absolute value of mean bias on cloudy days (AVMBC) in most GDs above 700 hPa at 00:00 UTC, 06:00 UTC, and 12:00 UTC (Figure 6a1–a4) with small divergences shown among the five GDs (Figure 6a4). Similar characteristics were shown for V, although the influence of weather on V was stronger than that on U (Figure 6b1–b4). The AVMB of T in cloudy weather was less than that in sunny weather near the surface, whereas the influence of weather on the ABMB of T in the basin at the mid- and upper levels was extremely limited (Figure 6c1–c4). No significant difference was indicated in the mean bias of RH in different weather conditions under 300 hPa. However, the AVMB of RH in sunny weather was more than that in cloudy weather above 300 hPa, with great divergence shown between MERRA and the other models (Figure 6d1–d4).
For U and V, the AVMB in sunny weather was generally less than that in the TP in cloudy conditions, which is similar to the profiles in the basin. Compared with the results for the basin, the most important characteristic in the TP is that the influence of weather on T is very strong particularly at 00:00 UTC, 06:00 UTC, and 18:00 UTC (Figure 7c1,c2,c4). The AVMB of T in cloudy weather was less than that in sunny conditions at 00:00 UTC and 06:00 UTC; however, it was more than that in sunny weather at 18:00 UTC. This suggests that the mean bias of T varies in different weather conditions and also at different times. In fact, the difference in AVMB between sunny and cloudy weather for all of the variables showed some degree of diurnal variation. The apparent divergence among the five GDs coupled with the strong diurnal variation creates difficulties in drawing definite conclusions on the influence of weather on RH in the TP (Figure 7d1–d4). In general, the AVMB of RH in cloudy weather at mid- and upper levels, at about 400 hPa to about100hPa, was greater than that in sunny weather for most of the GDs. Near the surface, the AVMB of RH in cloudy conditions is less than that in sunny weather at 06:00 UTC and 12:00 UTC. However, the differences became small at 00:00 UTC and 18:00 UTC.
The difference in RMS error (DRMS) of U and V in the two types of weather is plotted in Figure 8a1–a4,b1–b4. The DRMS of U was generally positive under 400 hPa at 00:00 UTC and 18:00 UTC (Figure 8a1,a4), but negative between 300 hPa and 200 hPa at all times. The DRMS of V was positive in the entire layer at 00:00 UTC, with slight differences shown among the five GDs (Figure 8b1). However, a negative value appeared near the surface that increased with height and turned positive at about 500 hPa at 06:00 UTC (Figure 8b2). Owing to the obvious value fluctuations corresponding with height and diurnal variations at other levels and times, it is difficult to reach a consensus which agrees with all the GDs.
The influence of weather on T in the basin was very small (Figure 8c1–c4). The relatively large DRMS of T occurred usually at upper levels or near the surface at about ±0.5 °C. The value on cloudy days was larger than in sunny weather above 200 hPa at 00:00 UTC (Figure 8c1); however, it was lower near the surface at 06:00 UTC and 12:00 UTC (Figure 8c2,c3).
The DRMS of RH under 400 hPa was negative at all times with small differences shown among the five GDs (Figure 8d1–d4), which means the RH in the cloudy conditions is more reliable than that in sunny weather. At the upper levels, the DRMS of RH was always positive for Interim, FNL, and JRA-55; however, it was negative for MERRA with some exceptions (Figure 8d1).
The difference in DRMS for the four variables under different weather conditions in the TP is shown in Figure 9. According to the research results of this study, the mechanism for the influence of weather on U and V is highly complex, and its characteristics may vary at different times or levels even in the same GD. For example, the DRMS of U was positive at mid-levels in JRA-55, although that of V was negative (Figure 9a1,b1). For FNL, the DRMS of V was positive at about 400 hPa at 00:00 UTC and 18:00 UTC (Figure 9b1,b4), although the value was negative at the same levels at 06:00 UTC and 12:00 UTC (Figure 9b2,b3).
Even though the DRMS of U and V under different weather conditions was very obvious, it is difficult to reach a definite conclusion on the results. Similar to the DRMS of T in the basin, the weather in the TP has a strong impact on the RMS of T, particularly at 00:00 UTC and 06:00 UTC (Figure 9c1,c2), and the DRMS of T was less by about 3 °C on cloudy days than that in sunny weather (Figure 9c2).
Figure 9d1–d4 shows the DRMS of RH at different times. The DRMS of T under 400 hPa was always negative, with small differences shown among the five GDs. However, the value turned positive above 300 hPa for Interim and JRA-55 at the four times. Because the data may not be very accurate in the upper levels, more attention should be paid to the characteristics of the DRMS above 400 hPa.

4. Discussion and Conclusions

In this study, the quality and reliability of the GDs of CFSv2, FNL, MERRA, Interim, and JRA-55 products were compared with radiosonde data recorded at 11 sites in 6-h increments. The analysis of more than 1000 samples revealed that each GD produced mean values consistent with the radiosonde data for U, V, and T under 400 hPa. Hence, for a relatively long time scale, few differences were apparent among the five GDs in the cases of these three variables. However, large differences in RH were obvious at upper levels above 400 hPa, which indicates large uncertainty in representing the water vapor condition over the EDTP. Large changes in elevation may be responsible for the bias/error of the water vapor above 400 hPa. This level is very close to the plateau’s underlying surface, although that of the basin is very high at about 7000 m. These large changes in elevation create difficulties in developing a forecast model for simulating the variation in the water vapor. In comparison, the mean bias and RMS error were less evident in MERRA. Correspondingly, MERRA was effective for capturing the individual records of RH at upper levels.
The GDs were evaluated with extensive radiosonde data in summers of 2011–2015; it was found that the GDs are sensitive to changes of terrain. The differences in mean value, STD, mean bias, and RMS error in the TP became larger than those in the basin among the five GDs. The large value of the mean bias and RMS error of U and V usually occurred above 400 hPa, particularly at about 200 hPa. Compared with that in the basin, the mean bias and RMS error of U and V became more evident in the TP, and the differences among five GDs increased significantly. JRA-55 and FNL (JRA-55) showed obvious negative bias of V in the TP (basin). In comparison, the RMS error was more evident in CFSv2 and MERRA in the TP and basin. Therefore, Interim is a good choice for describing the wind cycle over the EDTP.
Strong diurnal variations were found in mean bias and RMS error with great divergence shown among the five GDs at different levels. Moreover, the characteristics of the diurnal variation in the basin differed slightly from those in the TP. These findings strongly suggest that the different preferences of GD at the diurnal time scale and their related effects are important when using GD to describe the atmospheric conditions over the EDTP. U (m·s−1), V (m·s−1), T (°C), and RH (%) in the five GDs showed maximum inter-annual differences of 1.1 (1.1), 1.3 (1.8), 0.7 (0.9), and 10 (7) on the mean bias (RMS error); the maximum values usually occurred in CFSv2, JRA-55, Interim, and MERRA. The strong interannual variations were more likely to have occurred at the ground layer or at 200 hPa. It is interesting to note that the resolutions of CFSv2, JRA-55, Interim, and MERRA were all higher than that of FNL. This indicates that although an increase in resolution can help to reduce the bias/error [35], it may also cause obvious interannual variation.
The weather condition had an influence on the mean bias and RMS error of all variations to varying degrees. The influence on U and V was obvious, although it varied in different GDs at different levels and times. The influence on T in the TP was significantly larger than that in the basin, particularly at 00:00 UTC, 06:00 UTC, and 18:00 UTC. The bias/error of the GDs under different weather conditions resulted in uncertainty in the forecast models. Obvious differences were noted in the dynamic and thermodynamic structures under cloudy and sunny weather conditions, which creates difficulties in selecting a forecast model with a parameterization scheme suited to all weather conditions. Therefore, caution should be heeded when applying GDs, particularly in the EDTP.
The study region is so unique that the current error statistics may not be generalized to regions outside the EDTP. Thus, it is not clear whether such error statistics are the same as those in other seasons or other climate regimes owing to the limited samples.

Acknowledgments

This work was supported by the Special Fund for Meteorological Research in the Public Interest (Grant No. GYHY201206042), and the National Natural Science Foundation of China (Grant No. 41675057, 91337215).

Author Contributions

Guoping Li and Yuanchang Dong conceived and designed the experiments; Yuanchang Dong performed the experiments; Xiaolin Xie and Meng Yuan analyzed the data; Yuan Meng contributed reagents/materials/analysis tools; Yuanchang Dong wrote the paper.

Conflicts of Interest

The authors declare no conflict of interest.

References

  1. Jiang, X.; Li, Y.; Zhao, X. Characteristics of the Summertime Boundary Layer and Atmospheric Vertical Structure over the Sichuan Basin. J. Meteorol. Soc. Jpn. 2012, 90, 33–54. [Google Scholar] [CrossRef]
  2. Yeh, T.C.; Lo, S.W.; Chu, P.C. On the heat balance and circulation structure in troposphere over Tibetan Plateau. Acta Meteor. Sin. 1957, 28, 108–121. (In Chinese) [Google Scholar]
  3. Flohn, H. Large-scale aspects of the ‘summer monsoon’ in South and East Asia. J. Meteorol. Soc. Jpn. 1957, 75, 180–186. [Google Scholar]
  4. Zhou, X.-P.; Hu, X.-F. A brief analysis and numerical simulation of the Sichuan extraordinarily heavy rainfall event. In Proceedings of the First Sino-American Workshop on Mountain Meteorology, Beijing, China, 18–23 May 1982.
  5. Kuo, Y.-H.; Cheng, L.; Anthes, R.A. Mesoscale analyses of the Sichuan flood catastrophe. Mon. Rev. 1986, 114, 1984–2003. [Google Scholar] [CrossRef]
  6. Bao, X.; Zhang, F.; Sun, J. Diurnal variations of warm season precipitation east of the Tibetan Plateau over China. Mon. Weather Rev. 2011, 139, 2790–2810. [Google Scholar] [CrossRef]
  7. Qian, T.; Zhao, P.; Zhang, F.; Bao, X. Rainy-Season Precipitation over the Sichuan Basin and Adjacent Regions in Southwestern China. Mon. Weather Rev. 2015, 143, 383–394. [Google Scholar] [CrossRef]
  8. Yanai, M.; Li, C.; Song, Z. Seasonal heating of the Tibetan Plateau and its effects on the evolution of the Asian summer monsoon. J. Meteorol. Soc. Jpn. 1992, 70, 319–351. [Google Scholar]
  9. Xu, X.; Chen, L.; Zhou, M. The Second Tibetan Plateau Experiment of Atmospheric Sciences: TIPEX-GAME/TIBET; China Meteorological Press: Beijing, China, 2002; p. 236. (In Chinese)
  10. Zhou, M.; Xu, X.; Bian, L.; Chen, J.; Liu, H.; Zhang, Y.; Li, S.; Zhao, Y. Observations, Diagnostics, and Dynamics of the Atmospheric Boundary Layer over the Tibetan Plateau during TIPEX 1998; China Meteorological Press: Beijing, China, 2000; p. 125. (In Chinese)
  11. Li, Y.; Gao, W. Atmospheric boundary layer circulation on the eastern edge of the Tibetan Plateau, China, in summer. Arct. Antarct. Alp. Res. 2007, 39, 708–713. [Google Scholar] [CrossRef]
  12. Betts, A.K.; Köhler, M.; Zhang, Y. Comparison of river basin hydrometeorology in ERA-Interim and ERA-40 reanalysis with observations. J. Geophys. Res. 2009, 114. [Google Scholar] [CrossRef]
  13. Mao, J.; Shi, X.; Ma, L.; Kaiser, D.P.; Li, Q.; Thornton, P.E. Assessment of reanalysis daily extreme temperatures with China’s homogenized historical dataset during 1979–2001 using probability density functions. J. Clim. 2010, 23, 6605–6623. [Google Scholar] [CrossRef]
  14. Mooney, P.A.; Mulligan, F.J.; Fealy, R. Comparison of ERA-40, ERA-Interim and NCEP/NCAR reanalysis data with observed surface air temperatures over Ireland. Int. J. Clim. 2010, 31, 545–557. [Google Scholar] [CrossRef]
  15. Zhao, T.; Fu, C. Comparison of products from ERA-40, NCEP-2, and CRU with station data for summer precipitation over China. Adv. Atmos. Sci. 2006, 23, 593–604. [Google Scholar] [CrossRef]
  16. Wang, A.; Zeng, X. Evaluation of multireanalysis products with in situ observations over the Tibetan Plateau. J. Geophys. Res. 2012, 117, 214–221. [Google Scholar] [CrossRef]
  17. Bao, X.; Zhang, F. Evaluation of NCEP-CFSR, NCEP-NCAR, ERA-Interim, and ERA-40 reanalysis datasets against independent sounding observations over the Tibetan Plateau. J. Clim. 2013, 26, 206–214. [Google Scholar] [CrossRef]
  18. Jiang, X.; Li, Y.; He, G. The Climate Characteristics Analysis of Radiosonde Data over East Part of Tibetan Plateau. Plateau Mt. Meteorol. Res. 2008, 28, 1–9. [Google Scholar]
  19. Lu, J. Overview of Southwest Vortex; China Meteorology Press: Beijing, China, 1986; pp. 1–270. (In Chinese)
  20. Tao, S. Rainstorm in China; Science Press: Beijing, China, 1980; pp. 196–199. (In Chinese) [Google Scholar]
  21. Cheng, L. The vorticity change rate and its heat source for development of Meso-αscale vortex during a persistent heavy rain of 14–22 August 1981. Plateau Meteorol. 1991, 10, 337–350. [Google Scholar]
  22. Chen, Z.; Min, W.; Cui, C. New Advances in SouthWest China Vortex Research. Plateau Meteotol. 2004, 23, 1–5. [Google Scholar]
  23. Simmons, A.; Uppala, S.; Dee, D.; Kobayashi, S. ERA-Interim: New ECMWF reanalysis products from 1989 onwards. ECMWF Newsl. 2006, 110, 26–35. [Google Scholar]
  24. Ebita, A.; Kobayashi, S.; Ota, Y.; Moriya, M.; Kumabe, R.; Onogi, K.; Harada, Y.; Yasui, S.; Miyaoka, K.; Takahashi, K.; et al. The Japanese 55-Year Reanalysis “JRA-55”: An interim report. SOLA 2011, 7, 149–152. [Google Scholar] [CrossRef]
  25. Dee, D.P.; Uppala, S.M.; Simmons, A.J.; Berrisford, P.; Poli, P.; Kobayashi, S.; Andrae, U.; Balmaseda, M.A.; Balsamo, G.; Bauer, P.; et al. The ERA-Interim reanalysis: Configuration and performance of the data assimilation system. Quart. J. R. Meteorol. Soc. 2011, 137, 553–597. [Google Scholar] [CrossRef]
  26. Wu, W.-S.; Purser, R.J.; Parrish, D.F. Three-dimensional variational analysis with spatially inhomogeneous covariances. Mon. Weather Rev. 2002, 130, 2905–2916. [Google Scholar] [CrossRef]
  27. Purser, R.J.; Wu, W.-S.; Parrish, D.F.; Roberts, N.M. Numerical aspects of the application of recursive filters to variational statistical analysis. Part I: Spatially homogeneous and isotropic Gaussian covariances. Mon. Weather Rev. 2003, 131, 1524–1535. [Google Scholar] [CrossRef]
  28. Saha, S.; Moorthi, S.; Pan, H.-L.; Wu, X.; Wang, J.; Nadiga, S.; Tripp, P.; Kistler, R.; Woollen, J.; Behringer, D.; et al. The NCEP Climate Forecast System Reanalysis. Bull. Am. Meteorol. Soc. 2010, 91, 1015–1057. [Google Scholar] [CrossRef]
  29. Rienecker, M.M.; Suarez, M.J.; Gelaro, R.; Todling, R.; Bacmeister, J.; Liu, E.; Bosilovich, M.G.; Schubert, S.D.; Takacs, L.; Kim, G.-K.; et al. MERRA: NASA’s Modern Era Retrospective Analysis for Research and Applications. J. Clim. 2011, 24, 3624–3648. [Google Scholar] [CrossRef]
  30. Shou, S. Synoptic Analysis, 2nd ed.China Meteorological Press: Beijing, China, 2006; p. 322. (In Chinese)
  31. Li, F. New Developments with Upper-Air Sounding in China; Instruments and Observing Methods Report No. 94; WMO/TD No. 1354; WMO: Geneva, Switzerland, 2006. [Google Scholar]
  32. NanJing DaQiao Machine Co. Available online: http://www.njdaqiao.com/ (accessed on 15 March 2017).
  33. Shanghai Changwang Meteotech Co. Available online: http://www.cwqx.com/ (accessed on 15 March 2017).
  34. He, H.; Zhang, F. Diurnal variations of warm-season precipitation over Northern China. Mon. Weather Rev. 2010, 138, 1017–1025. [Google Scholar] [CrossRef]
  35. Chen, G.; Iwasaki, T.; Qin, H.; Sha, W. Evaluation of the Warm-Season Diurnal Variability over East Asia in Recent Reanalyses JRA-55, ERA-Interim, NCEP CFSR, and NASA MERRA. Am. Meteorol. Soc. 2014, 27, 5517–5537. [Google Scholar] [CrossRef]
Figure 1. Map plot of terrain elevations over the East and downstream of the Tibetan Plateau, and locations of the radiosonde sites. Heights are in meters above mean sea level (MSL).
Atmosphere 08 00056 g001
Figure 2. (Top row) Vertical profiles of mean difference (mean bias, color line) between radiosonde data (Ura, Vra, Tra, RHra; black dotted line) and gridded datasets (GDs) (Ugd, Vgd, Tgd, RHgd) in the basin (a1) U (m/s), (b1) V (m/s), (c1) T (°C), (d1) RH (%), all the data ae averaged over five independent radiosonde sites in the basin during late June to the end of July (2011–2015); (second row) Vertical profiles of difference between mean standard deviation (STD) between radiosonde data and GD (a2) U, (b2) V, (c2) T, (d2) RH for radiosonde and five GDs products; (bottom) Vertical profiles of the root-mean-square (RMS) errors for each of GDs verifying against the radiosonde data (radiosonde data) for (a3) U, (b3) V, (c3) T, and (d3) RH. CFSv2, Climate Forecast System Version 2; Interim, European Centre for Medium-Range Weather Forecasts Reanalysis Interim; FNL, NCEP Final Operational Global Analysis; MERRA, Modern Era Retrospective Analysis for Research and Applications; JRA-55, the Japanese 55-year Reanalysis.
Atmosphere 08 00056 g002
Figure 3. (Top row) Vertical profiles of mean difference (mean bias, color line) between radiosonde data (Ura, Vra, Tra, RHra; black dotted line) and gridded datasets (GDs) (Ugd, Vgd, Tgd, RHgd) in the TP (a1) U (m/s), (b1) V (m/s), (c1) T (°C), (d1) RH (%), all the data ae averaged over six independent radiosonde sites in the TP during late June to the end of July (2011–2015); (second row) Vertical profiles of difference between mean standard deviation (STD) between radiosonde data and GD (a2) U, (b2) V, (c2) T, (d2) RH for radiosonde and five GDs products; (bottom) Vertical profiles of the root-mean-square (RMS) errors for each of GDs verifying against the radiosonde data (radiosonde data) for (a3) U, (b3) V, (c3) T, and (d3) RH.
Atmosphere 08 00056 g003
Figure 4. The diurnal variations of the mean bias of U (a1a5), V (b1b5), T (c1c5), and RH (d1d5) in the five GDs against the radiosonde data, averaged over sounding five sites in the basin (shaded) and six sites in the TP (contour) during late June–early August (2011–2015).
Atmosphere 08 00056 g004
Figure 5. The diurnal variations of the RMS error of U (a1a5), V (b1b5), T (c1c5), and RH (d1d5) in the five GDs against the radiosonde data, averaged over sounding five sites in the basin (shaded) and six sites in the TP (contour) during late June–early August (2011–2015).
Atmosphere 08 00056 g005
Figure 6. The difference of absolute values of the mean bias of U (a1a4), V (b1b4), T (c1c4), and RH (d1d4) between those occurring on cloudy days and on sunny days in the GDs against the radiosonde data, averaged over sounding five sites in the basin.
Atmosphere 08 00056 g006
Figure 7. The difference of absolute values of the mean bias of U (a1a4), V (b1b4), T (c1c4), and RH (d1d4) between those occurring on cloudy days and on sunny days in the GDs against the radiosonde data, averaged over sounding six sites in the TP.
Atmosphere 08 00056 g007
Figure 8. The difference of the RMS errors of U (a1a4), V (b1b4), T (c1c4), and RH (d1d4) between those occurring on cloudy days and on sunny days in the GDs against the radiosonde data, averaged over sounding five sites in the basin.
Atmosphere 08 00056 g008
Figure 9. The difference of the RMS errors of U (a1a4), V (b1b4), T (c1c4), and RH (d1d4) between those on cloudy days and on sunny days in the GDs against the radiosonde data, averaged over sounding six sites in the TP.
Atmosphere 08 00056 g009
Table 1. The largest difference of mean bias/RMS error in the GD against the radiosonde data during five years in the basin.
Mean Bias/
RMS Error
U (m·s−1)V (m·s−1)
CFSv2FNLMERRAInterimJRA-55CFSv2FNLMERRAInterimJRA-55
200 hPa1.1/0.80.6/0.80.6/0.50.9/0.80.8/1.00.3/0.70.3/0.80.6/0.70.6/1.80.9/0.9
500 hPa0.2/0.40.5/0.30.5/0.20.2/0.50.3/0.30.3/0.20.3/0.40.4/0.20.6/0.30.2/0.4
600 hPa0.1/0.40.2/0.40.5/0.90.1/0.50.2/0.80.2/1.10.7/1.20.4/1.40.3/1.60.2/1.1
700 hPa0.3/0.40.1/0.40.6/0.70.2/0.70.3/0.20.6/1.00.7/1.00.7/0.80.4/0.80.4/0.5
850 hPa0.1/0.30.3/0.40.4/0.40.2/0.50.5/0.40.8/0.50.7/1.10.4/0.30.8/0.51.1/1.1
900 hPa0.1/0.20.7/0.40.4/0.30.2/0.70.7/1.10.5/0.70.6/0.50.4/0.40.7/0.51.3/0.6
Mean Bias/
RMS error
T (°C)RH (%)
CFSv2FNLMERRAInterimJRA-55CFSv2FNLMERRAInterimJRA-55
200 hPa0.2/0.10.3/0.10.5/0.10.2/0.10.2/0.17/23/610/65/67/7
500 hPa0.3/0.50.4/0.70.4/0.60.4/0.70.4/0.61/44/42/34/33/6
600 hPa0.2/0.90.3/0.60.2/0.50.3/0.70.1/0.94/48/64/62/42/5
700 hPa0.3/0.20.3/0.50.2/0.50.2/0.60.4/0.46/65/63/64/42/4
850 hPa0.3/0.30.2/0.30.4/0.20.2/0.50.6/0.21/22/16/32/14/2
900 hPa0.5/0.40.4/0.30.7/0.50.4/0.40.7/0.42/04/18/31/04/1
Table 2. The largest difference of mean bias/RMS error in the GDs against the radiosonde data during five years in the TP.
Mean Bias/
RMS Error
U (m·s−1)V (m·s−1)
CFSv2FNLMERRAInterimJRA-55CFSv2FNLMERRAInterimJRA-55
200 hPa0.6/0.50.3/0.41.0/1.40.6/0.90.5/0.50.7/0.40.1/0.70.8/0.50.5/0.40.3/0.4
500 hPa0.4/0.50.7/0.40.5/0.20.8/0.40.2/0.60.9/0.40.5/0.30.8/0.30.8/0.30.3/0.4
600 hPa0.3/0.60.3/0.50.7/0.70.6/0.40.2/0.61.0/0.30.5/1.01.1/1.20.5/0.50.2/0.2
Mean Bias/
RMS error
T (°C)RH (%)
CFSv2FNLMERRAInterimJRA-55CFSv2FNLMERRAInterimJRA-55
200 hPa0.4/0.30.4/0.30.5/0.30.5/0.40.2/0.32/43/78/68/88/8
500 hPa0.1/0.00.5/0.20.1/0.10.1/0.30.1/0.24/67/32/52/72/4
600 hPa0.3/0.30.1/0.20.2/0.10.4/0.30.4/0.12/42/52/42/33/2
Table 3. The number of samples on sunny/cloudy days in the Sichuan Basin (SCB) and in the TP for summertime during five years.
Number of SamplesSCBTP
SunnyCloudySunnyCloudy
00:00 UTC4719866273
06:00 UTC3488554884
12:00 UTC48662498204
18:00 UTC43868510154

