Article

Total Lightning Flash Activity Response to Aerosol over China Area

1
Plateau Atmosphere and Environment Key Laboratory of Sichuan Province, College of Atmospheric Science, Chengdu University of Information Technology, Chengdu 610225, China
2
Collaborative Innovation Center on Forecast and Evaluation of Meteorological Disasters, Nanjing University of Information Science & Technology, Nanjing 210044, China
3
Guangzhou Institute of Tropical and Marine Meteorology, China Meteorological Administration, Guangzhou 510080, China
4
Heavy Rain and Drought-Flood Disasters in Plateau and Basin Key Laboratory of Sichuan Province, Chengdu 610072, China
5
Climate Center of Sichuan Province, Chengdu 610072, China
6
Key Laboratory for Aerosol-Cloud-Precipitation of China Meteorological Administration, Nanjing University of Information Science & Technology, Nanjing 210044, China
*
Author to whom correspondence should be addressed.
Atmosphere 2017, 8(2), 26; https://doi.org/10.3390/atmos8020026
Submission received: 16 October 2016 / Revised: 19 January 2017 / Accepted: 23 January 2017 / Published: 26 January 2017

Abstract

:
Twelve years of measurements of aerosol optical depth (AOD), cloud fraction, cloud top height, ice cloud optical thickness and lightning flash density from 2001 to 2012 have been analyzed to investigate the effect of aerosols on electrical activity over an area of China. The results show that increasing aerosol loading inspires the convective intensity, and then increases the lightning flash density. The spatial distribution of the correlation between aerosol loading and electrical activity shows a remarkable regional difference over China. The high-correlation regions embody the positive aerosol microphysical effect on the intensity of the electrical activity, while the large-scale processes may play the main role in convection development and producing lightning in low-correlation regions.

1. Introduction

Aerosols that serve as cloud condensation nuclei (CCN) and cloud ice nuclei (IN) affect cloud microphysical properties such as the cloud droplet size distribution, collision efficiency, evaporation and condensation efficiency, and generation of ice particles [1,2]. Some simulation studies [3,4,5] showed that enhancing the concentration of aerosols resulted in delaying the precipitation start time, stimulating the convection, and forming more big ice particles. Lightning intensity was closely linked with convection intensity. The strong updraft, a deep ice water mixing region, and large ice particles’ flux may enhance lightning activities of a thunderstorm [6,7,8]. The intimate connection between electrical activity and some factors in the mixed-phase region was mainly due to the non-inductive charging process where rebounding collisions between big and small ice particles lead to appreciable charge separation. The magnitude and sign carried by ice particles relied on the droplet size spectrum, cloud water content, rime accretion rate, temperature and so on [9,10].
Westcott [11] was the first to indicate the relationship between the lightning flash density and anthropogenic aerosols; the results showed the enhancement of lightning over big cities and downwind areas because of anthropogenic aerosol emissions. Thereafter, several studies [12,13,14,15,16,17,18,19], in view of the relationship between urbanization and cloud-to-ground (CG) lightning activity, showed that the urban heat island circulation and air pollution played prime roles in the enhancement of CG lightning density. Recent studies conducted by Farias et al. [20], Kar et al. [15] and Kar and Liou [16] suggested that CG lightning activity has a positive correlation with PM10 and SO2 over Sao Paulo, Taiwan, and South Korea. The study of CG lightning over Atlanta conducted by Stallins et al. [21] showed that a larger CG lightning flash frequency around Atlanta was presented under weekday aerosol concentrations. The correlation of lightning activity and aerosol optical depth (AOD) over four metropolitan cities of India, analyzed by Lal and Pawar [22], suggested that lightning shows a sharp enhancement due to the combined positive effect of thermodynamics and aerosols over the inland cities, while the effect of aerosols on lightning were not obvious in the coastal cities. The studies reported by Wang et al. [23] and Tan et al. [24] focused on the Pearl River Delta region and Nanjing, China. They found a positive and a negative correlation between aerosols and lightning in the Pearl River Delta region and Nanjing, respectively.
The effects of smoke aerosols produced by biomass burning on cloud properties and lightning activity have been discussed in previous observational studies. Lyons et al. [25] and Murray et al. [26], who studied the effect of smoke produced by forest fires in southern Mexico, transported into the U.S. southern plains from April to June 1998, on CG lightning flash, indicated that smoke aerosols inspired the intensity of the lightning and enhanced the percentage and peak current of positive-polarity CG lightning. Fernandes et al. [27] and Altaratz et al. [28] found the influence of smoke from fires on the CG lightning characteristics, which showed that the increase in smoke aerosol loading led to an increase in electrical activity, and an extremely high concentration of smoke aerosols would result in a weakening in convective intensity and electrical activity. Lang and Rutledge [29] suggested that the effects of smoke aerosols on the polarity of CG lightning were not deterministic.
Several observational studies on the effect of anthropogenic aerosols on lightning activity were found in the literature over tropical areas and in the United States, compared with a smaller number of studies related to China and the neighboring areas. In order to reveal the effect of aerosols on electrical activity in thunderstorms, we discussed the lightning flash density, cloud fraction, cloud top height, ice cloud optical thickness, and AOD measured with the Tropical Rainfall Measuring Mission (TRMM) satellite and Moderate Resolution Imaging Spectroradiometer (MODIS) onboard the Aqua satellite for 12 years (2001–2012) over China and the neighboring area.

2. Data and Methodology

The measured data of cloud fraction, cloud top height, ice cloud optical thickness and Aerosol Optical Depth (AOD) (at 550 nm) were taken from MODIS, which includes clouds and surrounding aerosols information. The data were downloaded from a level-3 gridded atmosphere monthly 1 × 1 degree global joint product “MOD08_M3” (http://modis-atmos.gsfc.nasa.gov/). The inversion AOD data MODIS is validity in most observation regions, and the average error is about 15% [30,31,32]. The lightning density data that includes intracloud (IC) lightning and cloud-to-ground (CG) lightning is compounded from the Lightning Imaging Sensor (LIS) and Optical Transient Detector (OTD) (https://ghrc.nsstc.nasa.gov/home/documentation/lisotd-25-degree-low-resolution-time-series-lrts). The detection efficiency of LIS is 73% and 93% in daytime and nighttime separately, and the detection efficiency of OTD is 44% and 56% in daytime and nighttime separately [33]. The lightning data quality has been checked by Global Hydrology Resource Center (GHRC). LIS/OTD data have been widely used to analyze the spatial and temporal distribution characteristics of lightning activities over China [34,35,36,37,38,39]. Therefore, it is reasonable to use the LIS/OTD data in our study. The lightning density distribution was showed by using LIS/OTD 0.5 × 0.5 degree high resolution full climatology (HRFC) data. The lightning time series were analyzed by using LIS/OTD 2.5 × 2.5 degree low resolution monthly time series (LRMTS) data from 2001 to 2012. The study area over China was bounded between latitudes 18.75° N–51.25° N and longitudes 78.25° E–131.25° E. Owing to analyzing the correlation between aerosol and lightning, the resolution of AOD data was interpolated into 2.5 × 2.5 degree, just as the same as which of the monthly lightning data (LRMTS). In this study, we examined the relationships between cloud properties, AOD and lightning flash density in the period from June to September when lightning strikes most frequently [40] and the statistical significance tests for correlations were considered if the significance is at 5% level.

3. Results

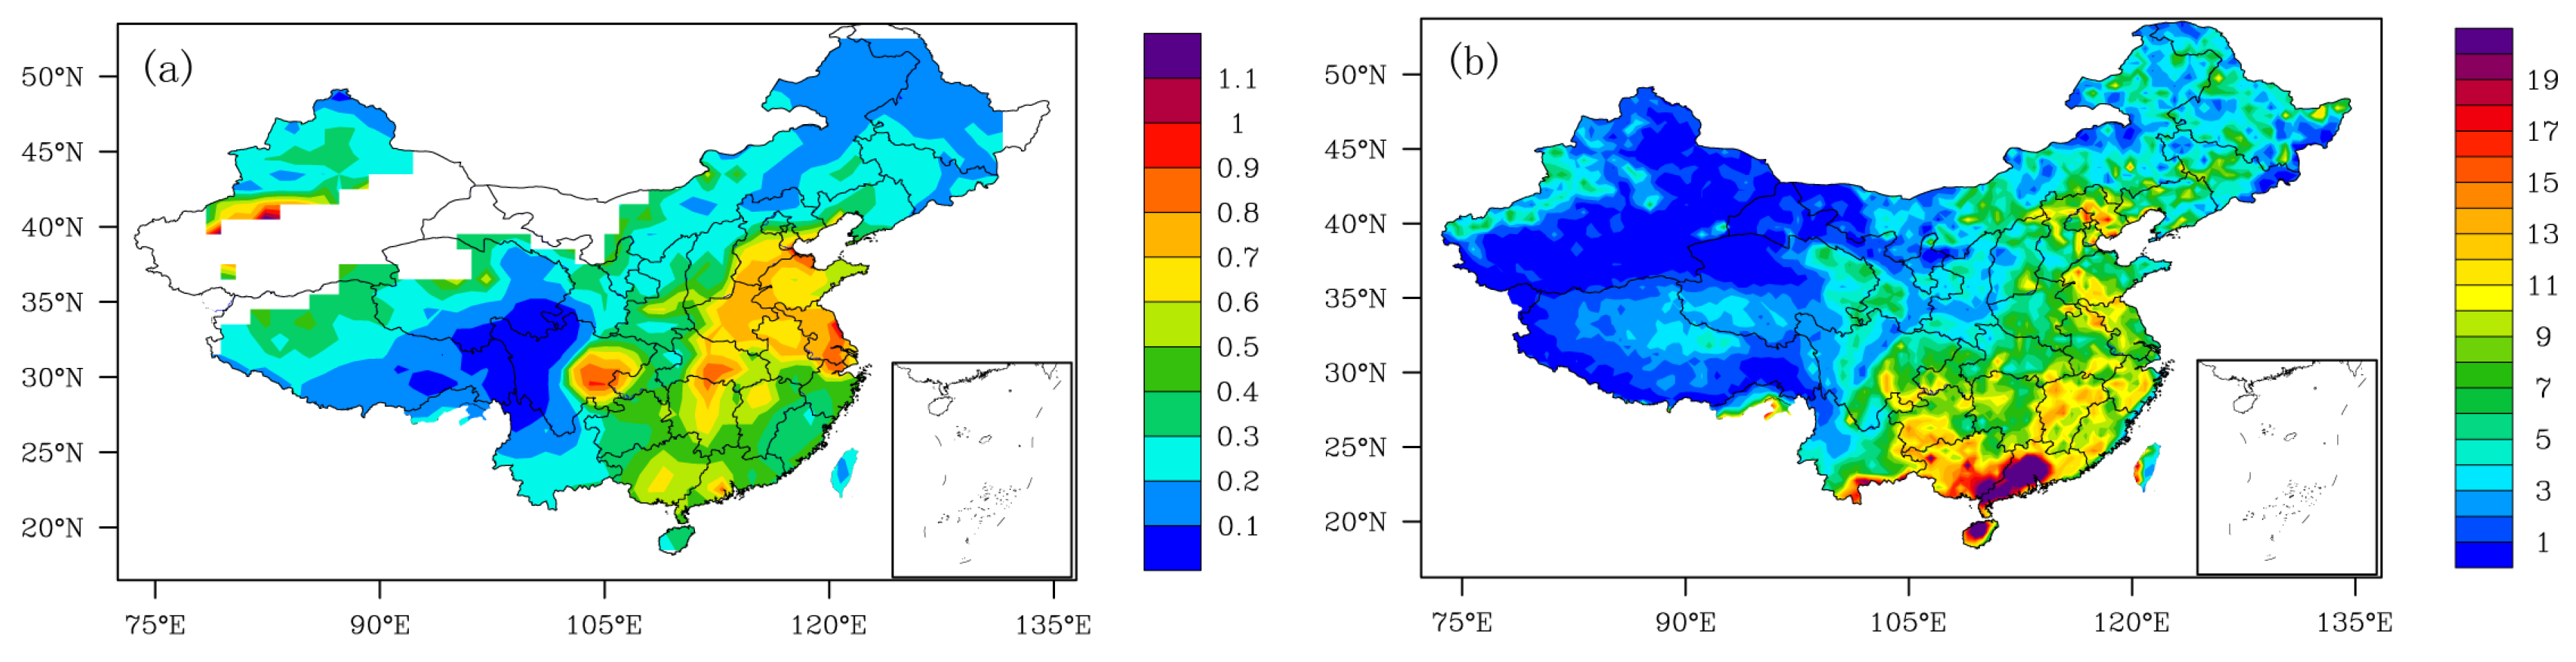
3.1. Spatial and Temporal Distributions of AOD and Lightning Flash Density

AOD and lightning flash denstiy measurements from a period covering 2001 to 2012 were analyzed to investigate the relationship between aerosols and electrical activity over an area of China. Figure 1a shows the spatial distribution of the annual mean AOD, showing that some areas of northeast and southwest China have smaller aerosol loadings with AOD values smaller than 0.3, compared with other regions of China; on the other hand, north China, the Pearl River Delta, the Yangtze River Delta, the eastern part of the Sichuan basin, and some regions in Xinjiang have larger aerosol loadings with AOD values smaller than 0.6, in agreement with the previous studies [41]. The higher AOD values in north China, the Pearl River Delta, the Yangtze River Delta, and the Sichuan basin are connected with a higher human population density and advanced industrialization [42]. The higher AOD value in Xinjiang is connected with frequent sandy and dusty weather and a lower annual rainfall [43]. The lower AOD value regions, such as northeast China and western China, have lower population densities and anthropogenic aerosol emissions [44]. Figure 1b shows the annual averaged lightning flash density distribution with a spatial resolution of 0.5 × 0.5 degrees over China. The lightning spatial distribution shows a low flash density in northeast and west China, and a high flash density in Beijing–Tianjin and the northern Hebei megacity region, south China and the coastal areas, particularly in Guangdong Province and Guangxi Province. The comparison between the AOD and lightning flash density shows that the spatial distributions of the two elements have similar features over Beijing–Tianjin and the northern Hebei megacity region, the eastern part of Sichuan, Guangdong Province and Guangxi Province, with larger values. The other regions of China do not show similar spatial distributions between the AOD and lightning flash density. The lower AOD values appear over Zhejiang and Fujian Province but with larger lightning flash densities. The lower AOD value is attributed to the dilution effect of clean air from the southeast sea areas and efficient rainfall; meanwhile, the abundant water vapor mainly contributes to frequent lightning activities in this region. Continual sandy and dusty weather and a lower annual rainfall result in a higher AOD value, and the dry weather conditions suppress the occurrence of convective systems.
To analyze the variation trend of the AOD and lightning flash density over China from 2001 to 2012, the regional annual averaged values for the AOD and lightning flash density are plotted in Figure 2. The time series of the MODIS AOD and LIS/OTD lightning flash density were calculated by averaging from the mean monthly data based on the entire period from January 2001 to December 2012 over all grids of the study area. The results show that throughout the 12 years, the regional annual mean values of AOD fluctuate between 0.275 and 0.335, and show a maximum and a minimum in 2003 and 2012, respectively. The time series of the regional annual mean AOD displays a generally upward trend before 2008, but a generally downward trend from 2008 to 2012. Zheng et al. [41] analyzed the climatic characteristics of AOD from 2000 to 2010 over China. They found a generally upward trend before 2008, but a generally downward trend after 2008, and the variation of the trend of the AOD is the inverse bwteen eastern China and western China. The East Asian monsoon circulation could have a potential impact on the variation trend of aerosols in China [45]. Especially in strong East Asian winter monsoon years, the vertical shear of zonal winds and near-surface winds recedes, and the weakened surface winds recede the outward diffusion of aerosols [46]. The strong East Asian winter monsoon resulted in higher AOD values in 2003 and 2008 over China. The regional annual mean values of the lightning flash density fluctuated between 0.275 and 0.335 flashes year−1·km−2, and showrf a maximum and a minimum in 2006 and 2009, respectively. The time series of the regional annual mean lightning flash denstiy display a generally upward trend before 2006, but a generally downward trend from 2006 to 2012. Zhang et al. [47] analyzed the regional climate characteristics of lightning over China from 1998 to 2003. They found that the lightning frequency displayed an upward trend from 1998 to 2003, consistent with our results before 2006. Xia et al. [40] found a slow downward trend of CG lightning strokes across China during the period covering 2008 to 2013. Overall, the time series of the annual mean data of the AOD and lightning flash density in the period covering 2001 to 2012 over China both showed a generally downward trend. The lightning frequency is significantly linked to the extreme convection system. The intensive rainstorm frequency led to a higher lightning density over China in 2006 and 2010 [48].
All the correlations were implemented grid to grid in our study. The missing data has already been removed before calculation and analysis. Moreover, the lightning activities are mainly located in Beijing–Tianjin and the northern Hebei megacity region, south China and the coastal areas, where there are no missing data. Therefore, the missing data will have little effect on the final result.

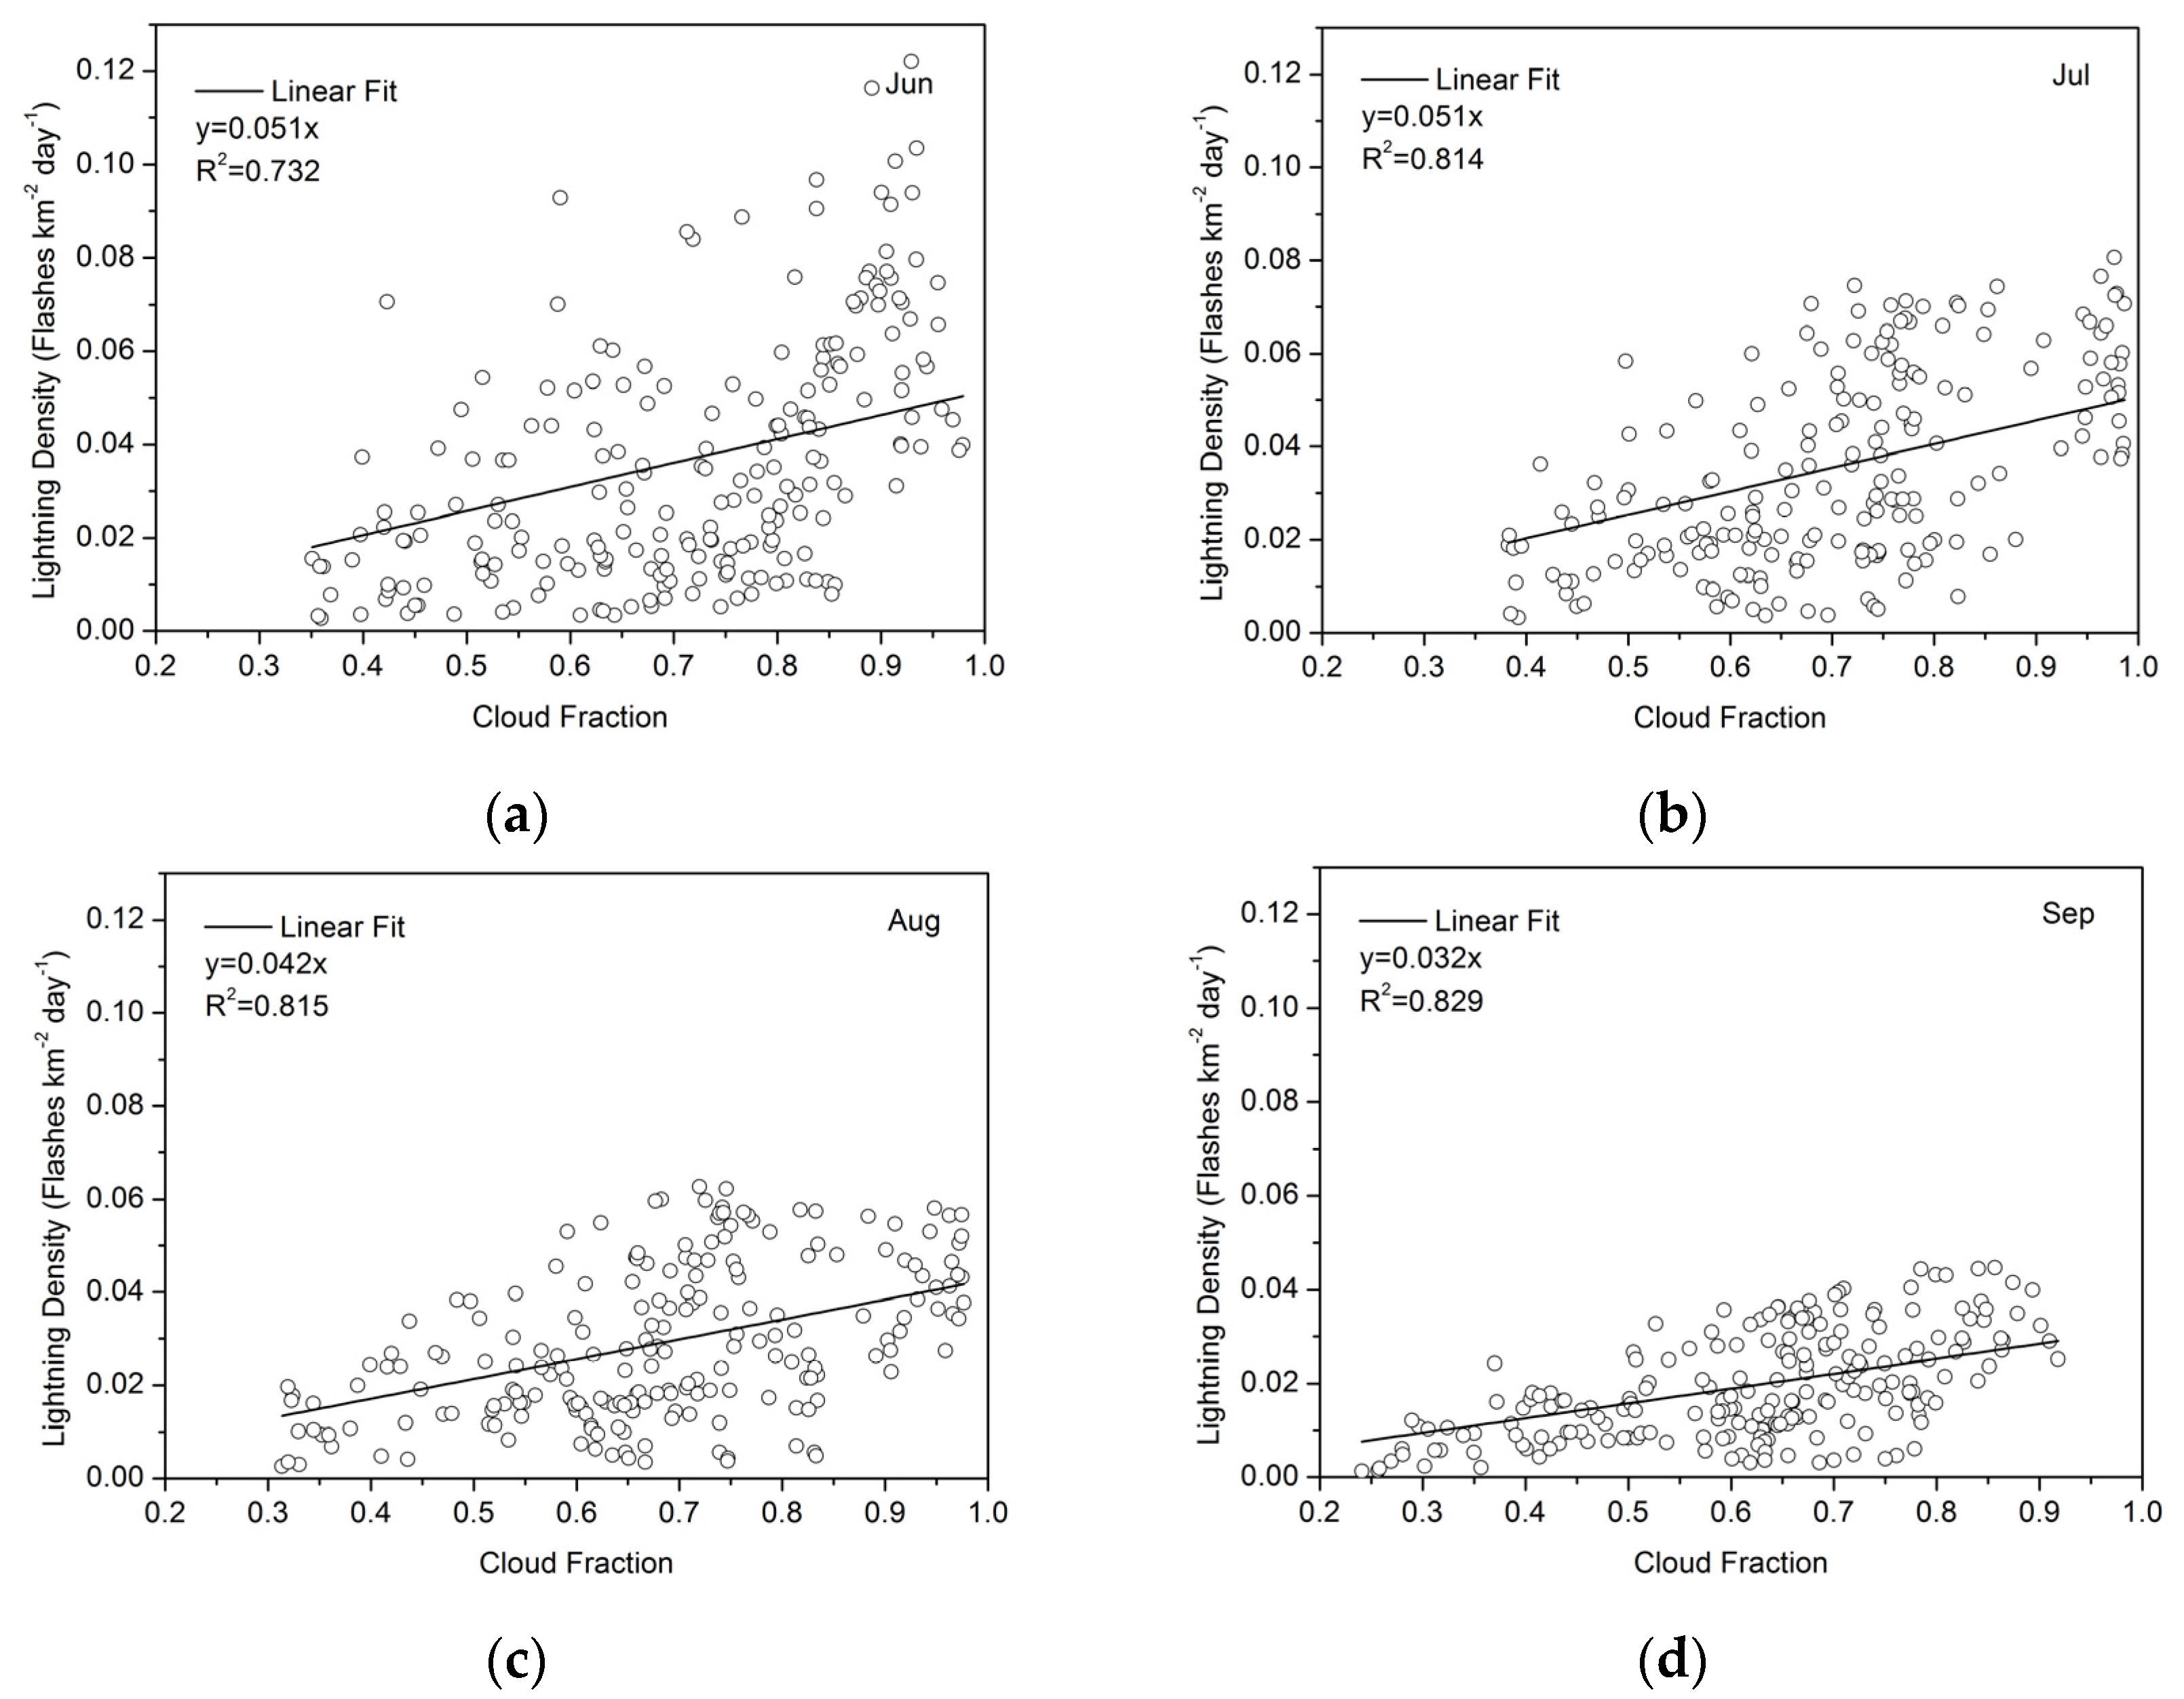
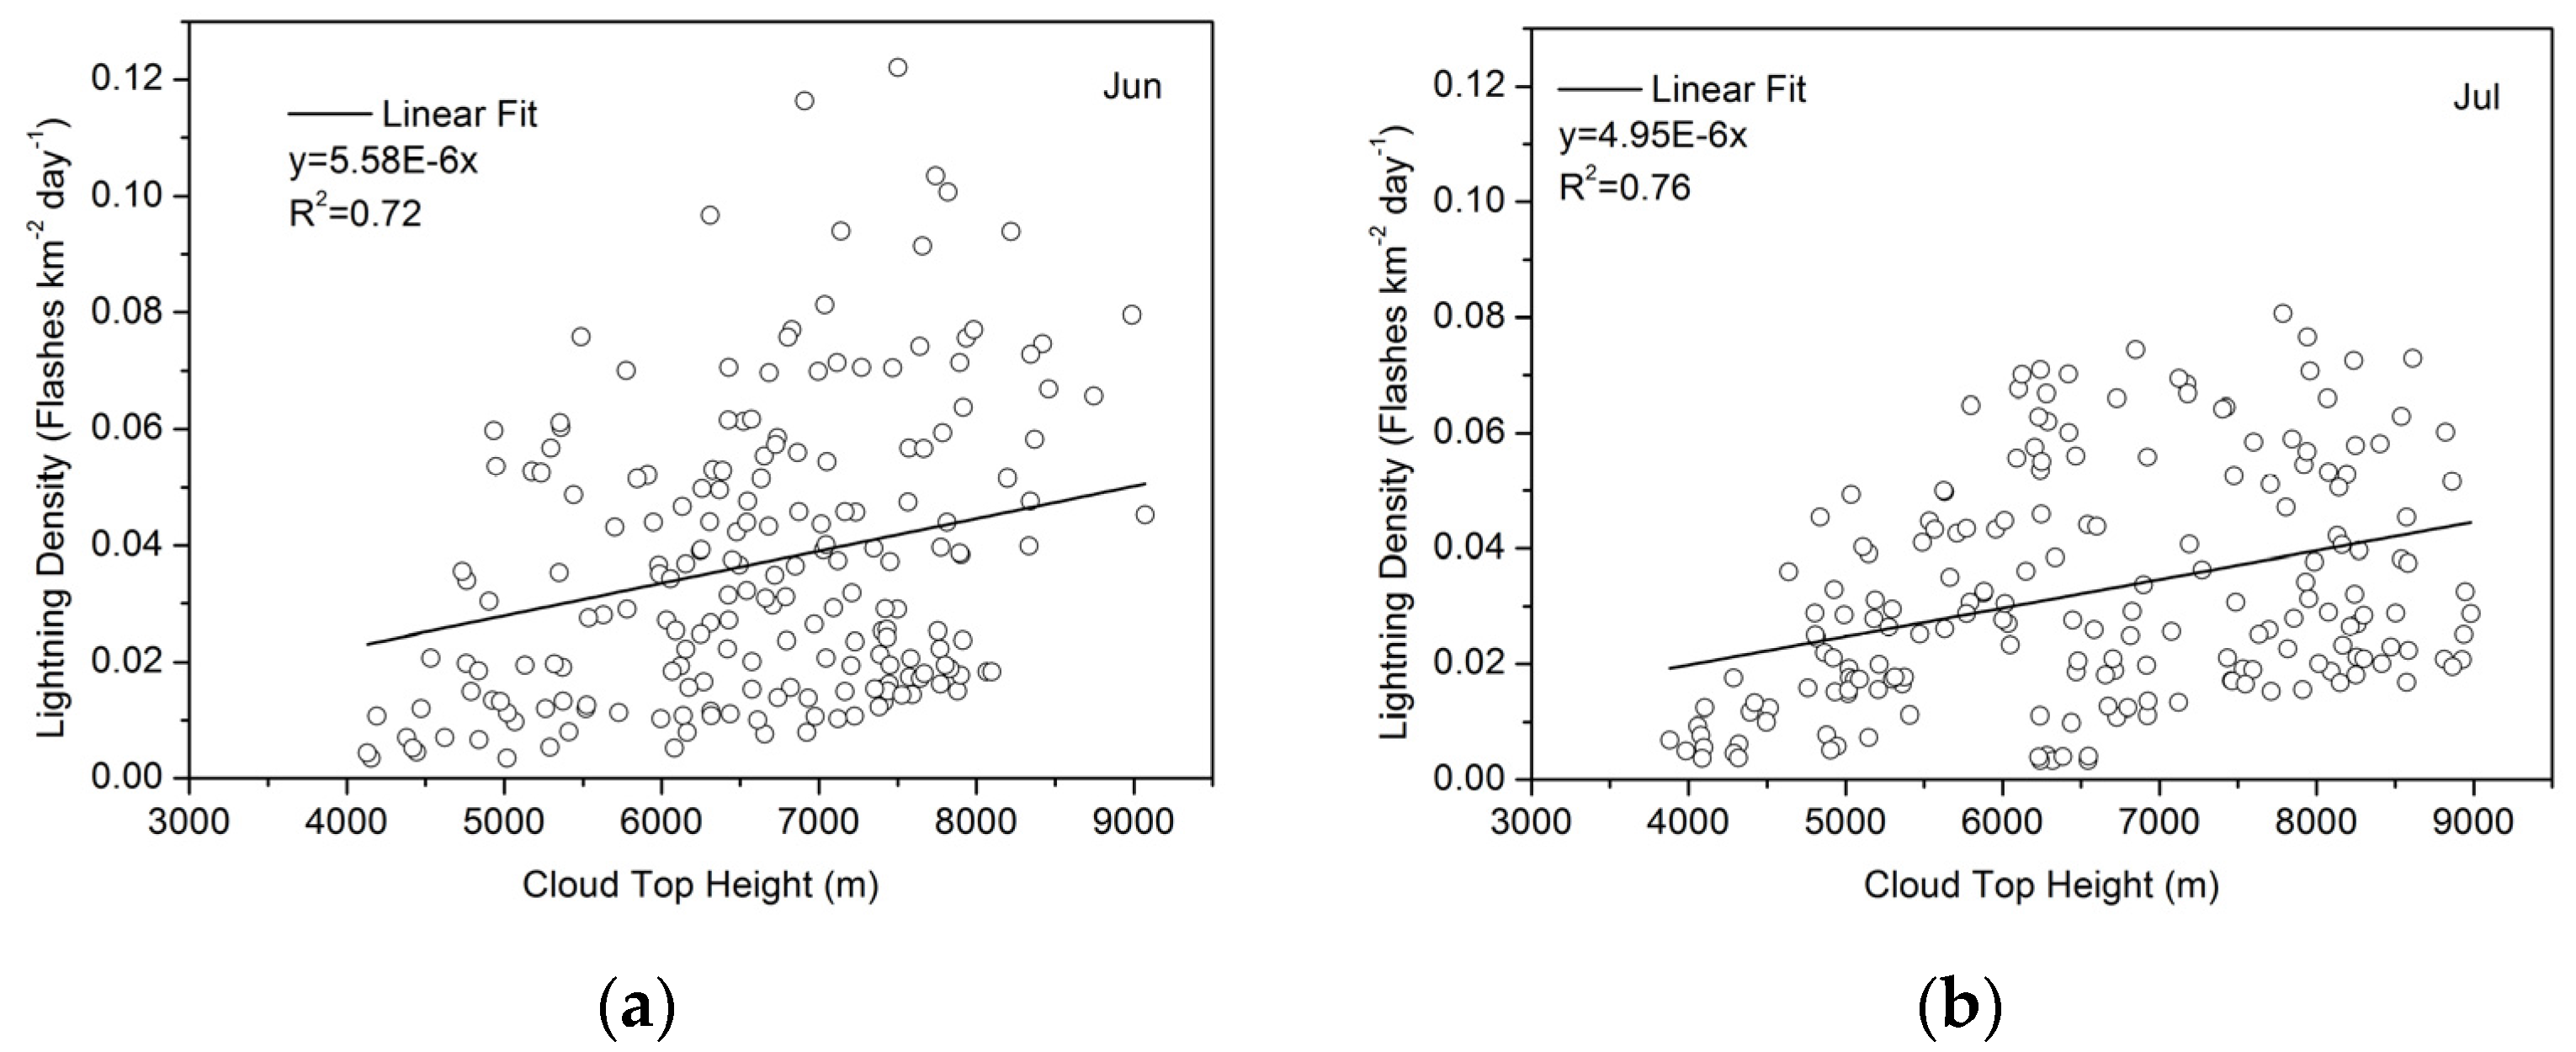
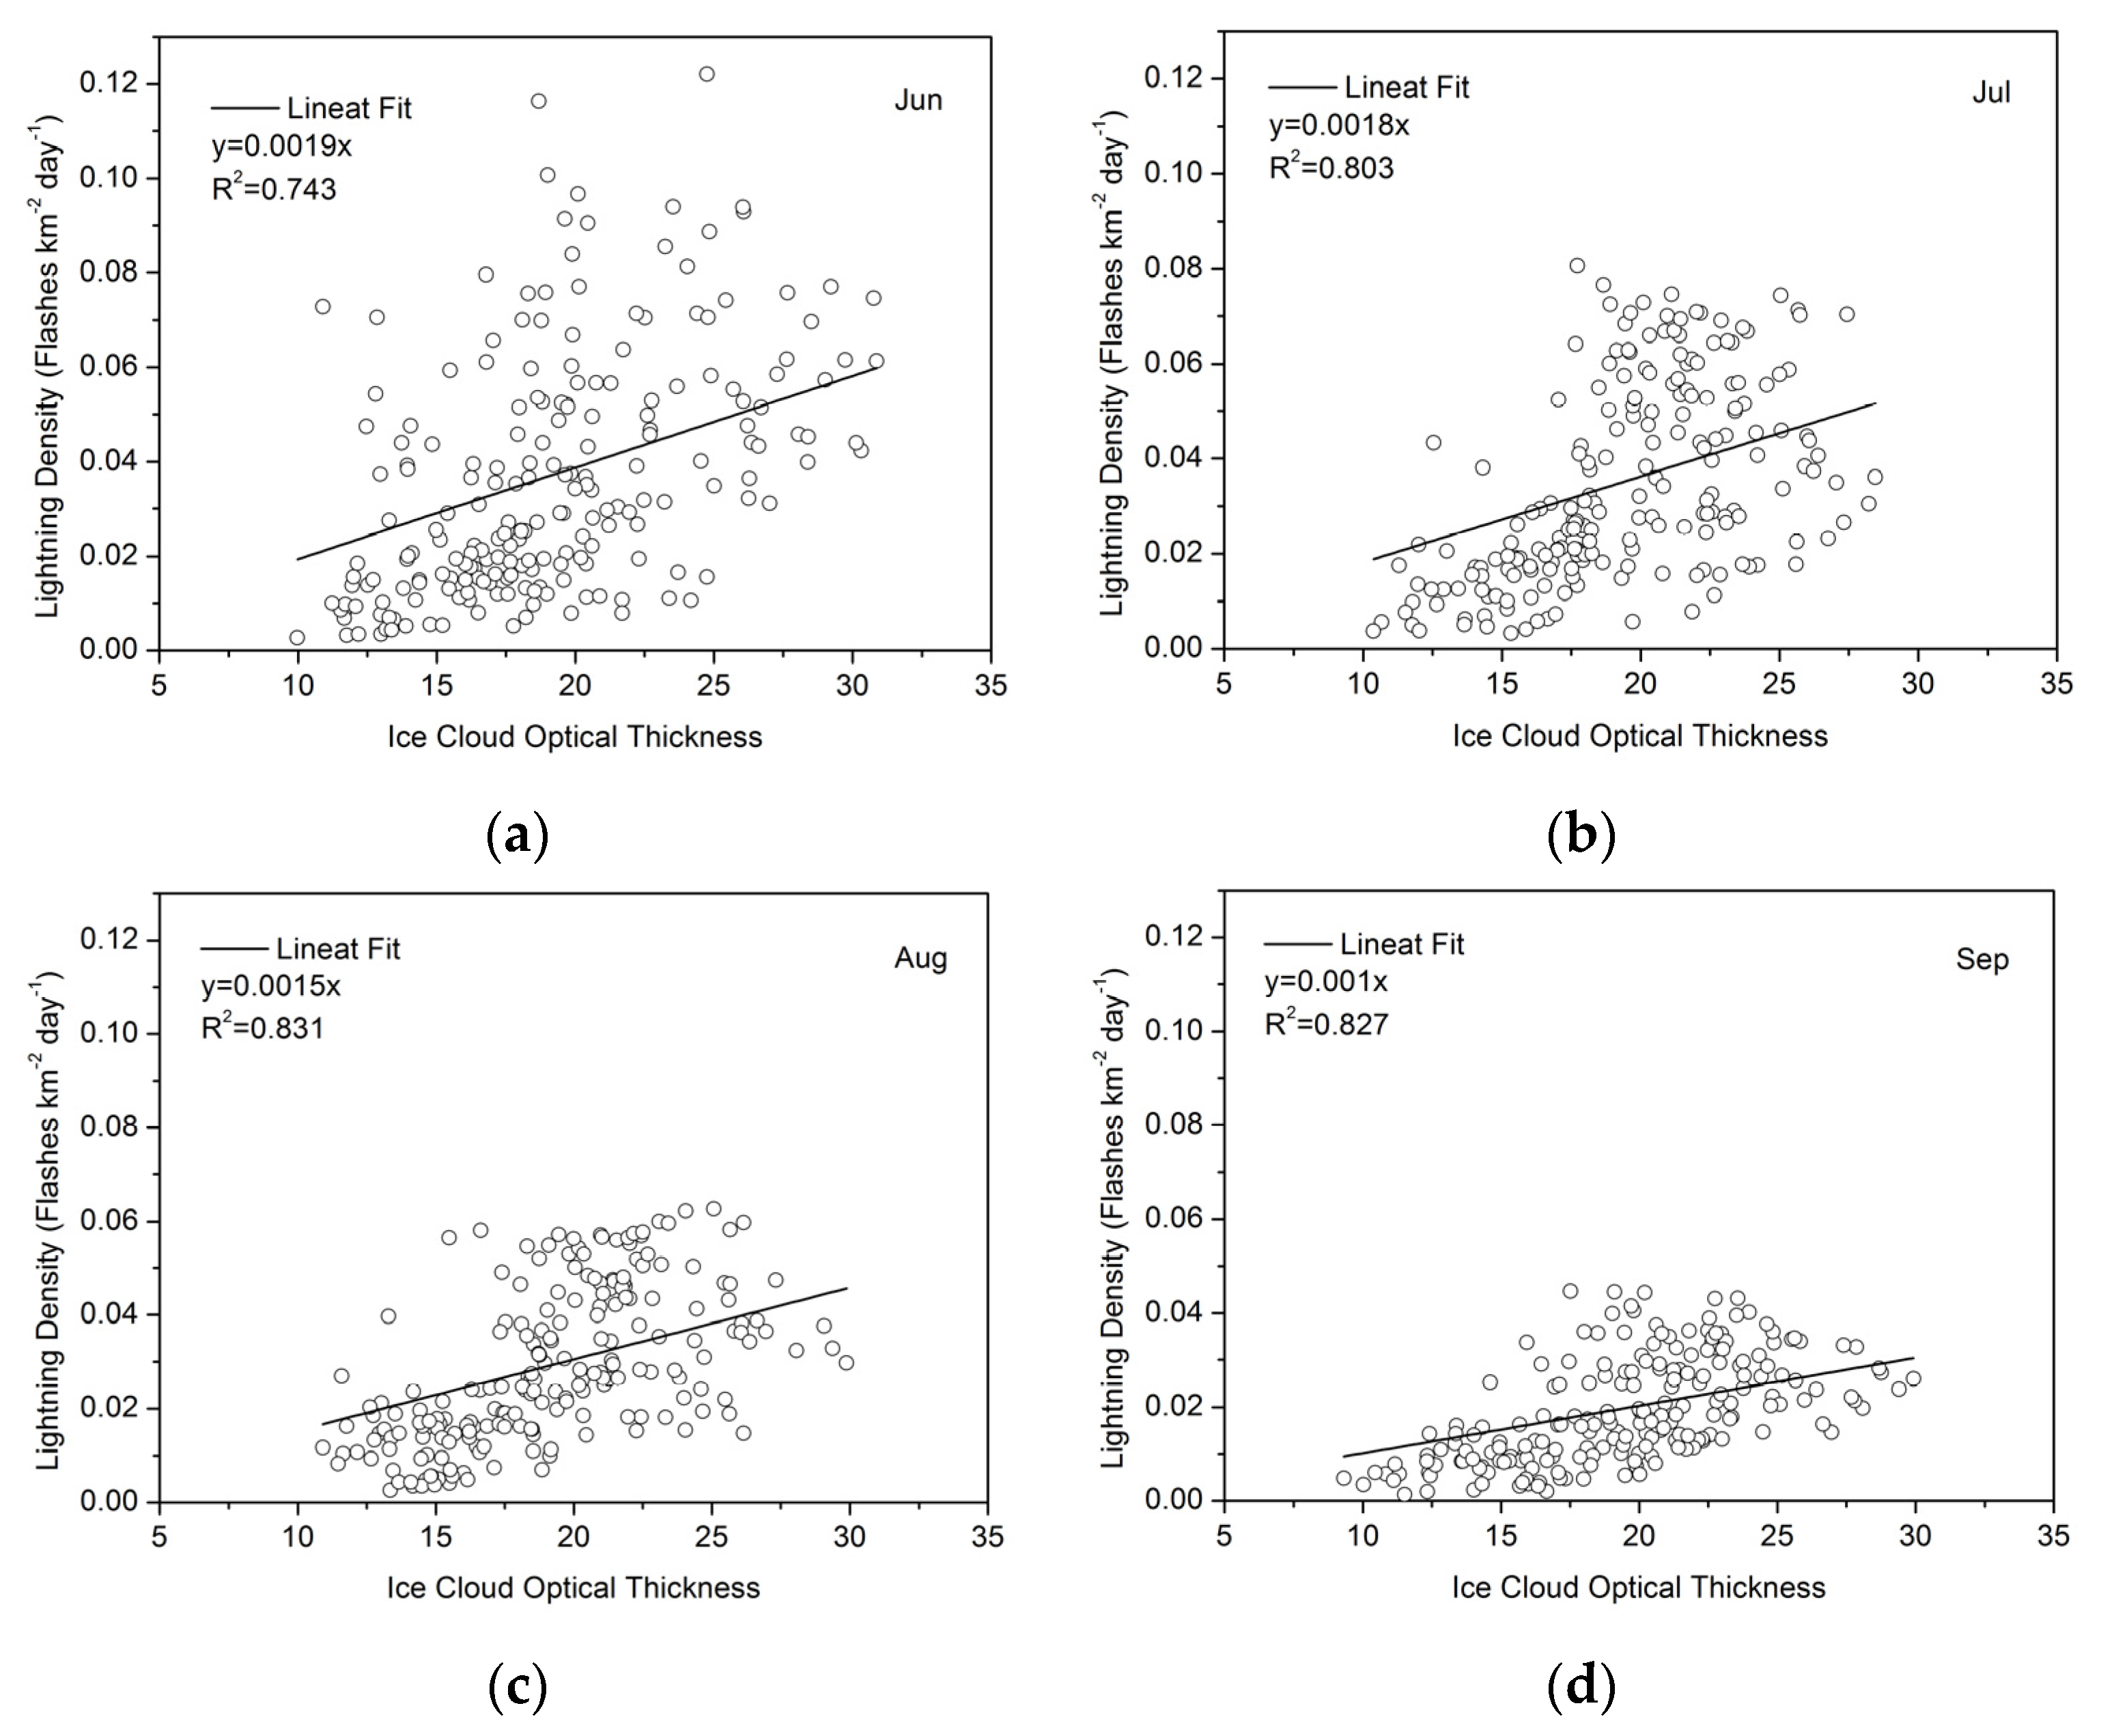
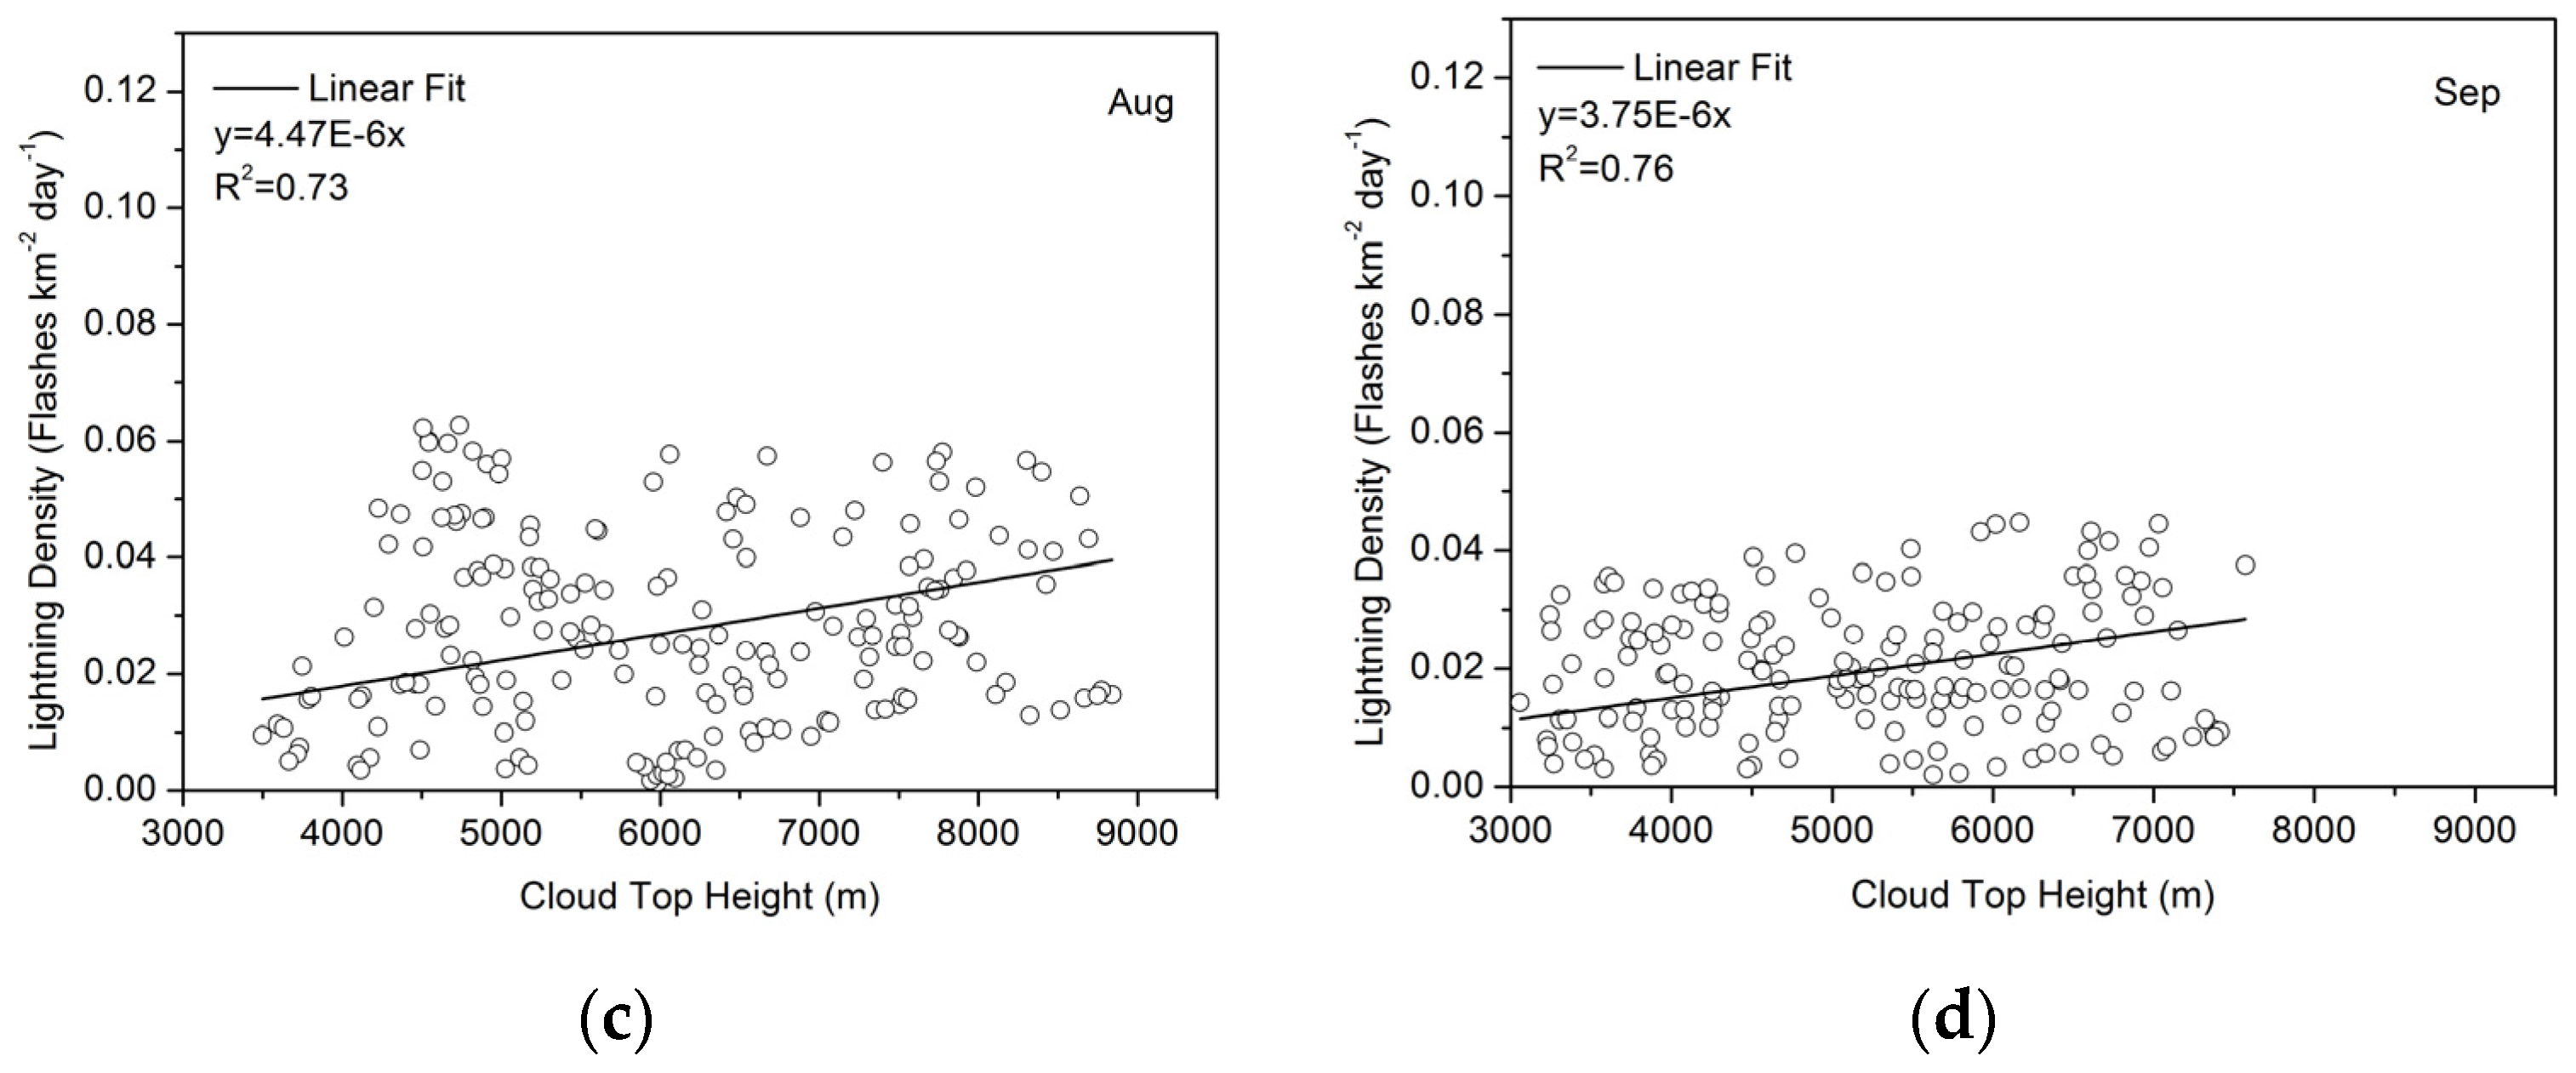
3.2. Relationships between Lightning Density and Cloud Properties

The previous simulation studies on the effect of aerosols on lightning activities [49,50,51,52,53,54] showed that increasing aerosol concentrations led to numerous small droplets, suppressing the collision-coalescence process and the formation of raindrops, and then were transported above the freezing level to form more ice particles. More ice particles participated in the electrification process, resulting in an enhancement in the lightning activity. To analyze the relationship between the AOD and lightning density, the interdependence of the cloud fraction, cloud top height and ice cloud optical thickness and lightning were examined primarily. Figure 3 shows the mean monthly (June, July, August and September, hereafter referred to as JJAS) correlation between the cloud fraction and lightning density over China from 2001 to 2012. The results show that the lightning density was positively correlated with the cloud fraction during the period from June to September over China, especially in September (R = 0.85 for June, R = 0.9 for July, R = 0.9 for August and R = 0.91 for September). In other words, the larger-coverage clouds produced more severe lightning activities.
Figure 4 shows the mean monthly (JJAS) relationship between the cloud top height and lightning flash density over China. The obviously positive correlation is revealed between the cloud top height and lightning flash density (R = 0.84 for June, R = 0.87 for July, R = 0.85 for August and R = 0.87 for September). The clouds with a higher cloud top height characterized by strong convection had a higher capability to produce more lightning flashes. The previous studies [55] indicated that lightning activity is linked closely with the cloud top height, and the flash rate increases with the cloud height as a power law. The results (Figure 3 and Figure 4) are consistent with the previous studies of Altaratz et al. [28] which discussed the effects of smoke aerosol loading on the convection intensity and lightning activities of thunderstorms over the Amazon by using World-Wide Lightning Location Network (WWLLN) lightning data and MODIS cloud and aerosol data. They found that the clouds with a higher cloud top height and larger cloud coverage are closely associated with stronger convection and electrical activity.
The ice particle content in thunderstorms is one of the important factors that affects electrical activity. The production of lightning is mainly dependent on charge seperation resulting from rebounding collisions between big and small ice particles in the mixed-phase region in thunderstorms. Yair et al. [56] indicated that the content of ice crystals, snow and graupel particles promises the intensity and distribution of lightning. The positive correlation between the ice cloud optical thickness and lightning density in the period of JJAS is represented in Figure 5; one can see that the positive correlation is more significant in August and September (R = 0.86 for June, R = 0.89 for July, R = 0.91 for August and R = 0.91 for September). This proves previous simulation studies [49,50,51,52,53,54] that showed the enhancement in lightning activity results from more ice particles participating in the electrification process. The similar results reported by Williams [57] found that severe lightning activity must be linked with the presence of mixed-phase hydrometeors together above freezing level, and the thunderstorm must have strong vertical motion and a higher cloud top height.
One can see that the cloud coverage, cloud top height and ice cloud optical thickness are closely associated with electrical activity (Figure 3, Figure 4 and Figure 5). The strong updraft in severe thunderstorms transports more liquid water to the mixed-phase region to form more ice particles. The participation of more ice particles in the electrification results in an enhancement of the lightning activity. An increase in the aerosol loading leads to the development of convection and enhances the ice-phase microphysical processes, resulting in increasing the intensity of the electrical activity of thunderstorms. The higher R values in September of Figure 3, Figure 4 and Figure 5 relate to the rapid southward withdrawal of the East Asian summer monsoons. In the summer, East Asian summer monsoons transport abundant water vapor to land, which is favorable for several kinds of precipitation systems, such as stratus, cumulus and convective-stratiform mixed clouds [58]. The complex cloud formations lead to a lower correlation between the cloud fraction, cloud top height, ice cloud optical thickness and lightning density in summer. In September, the larger cloud fraction, cloud top height and ice cloud optical thickness relate to the local convections, resulting in higher R values.

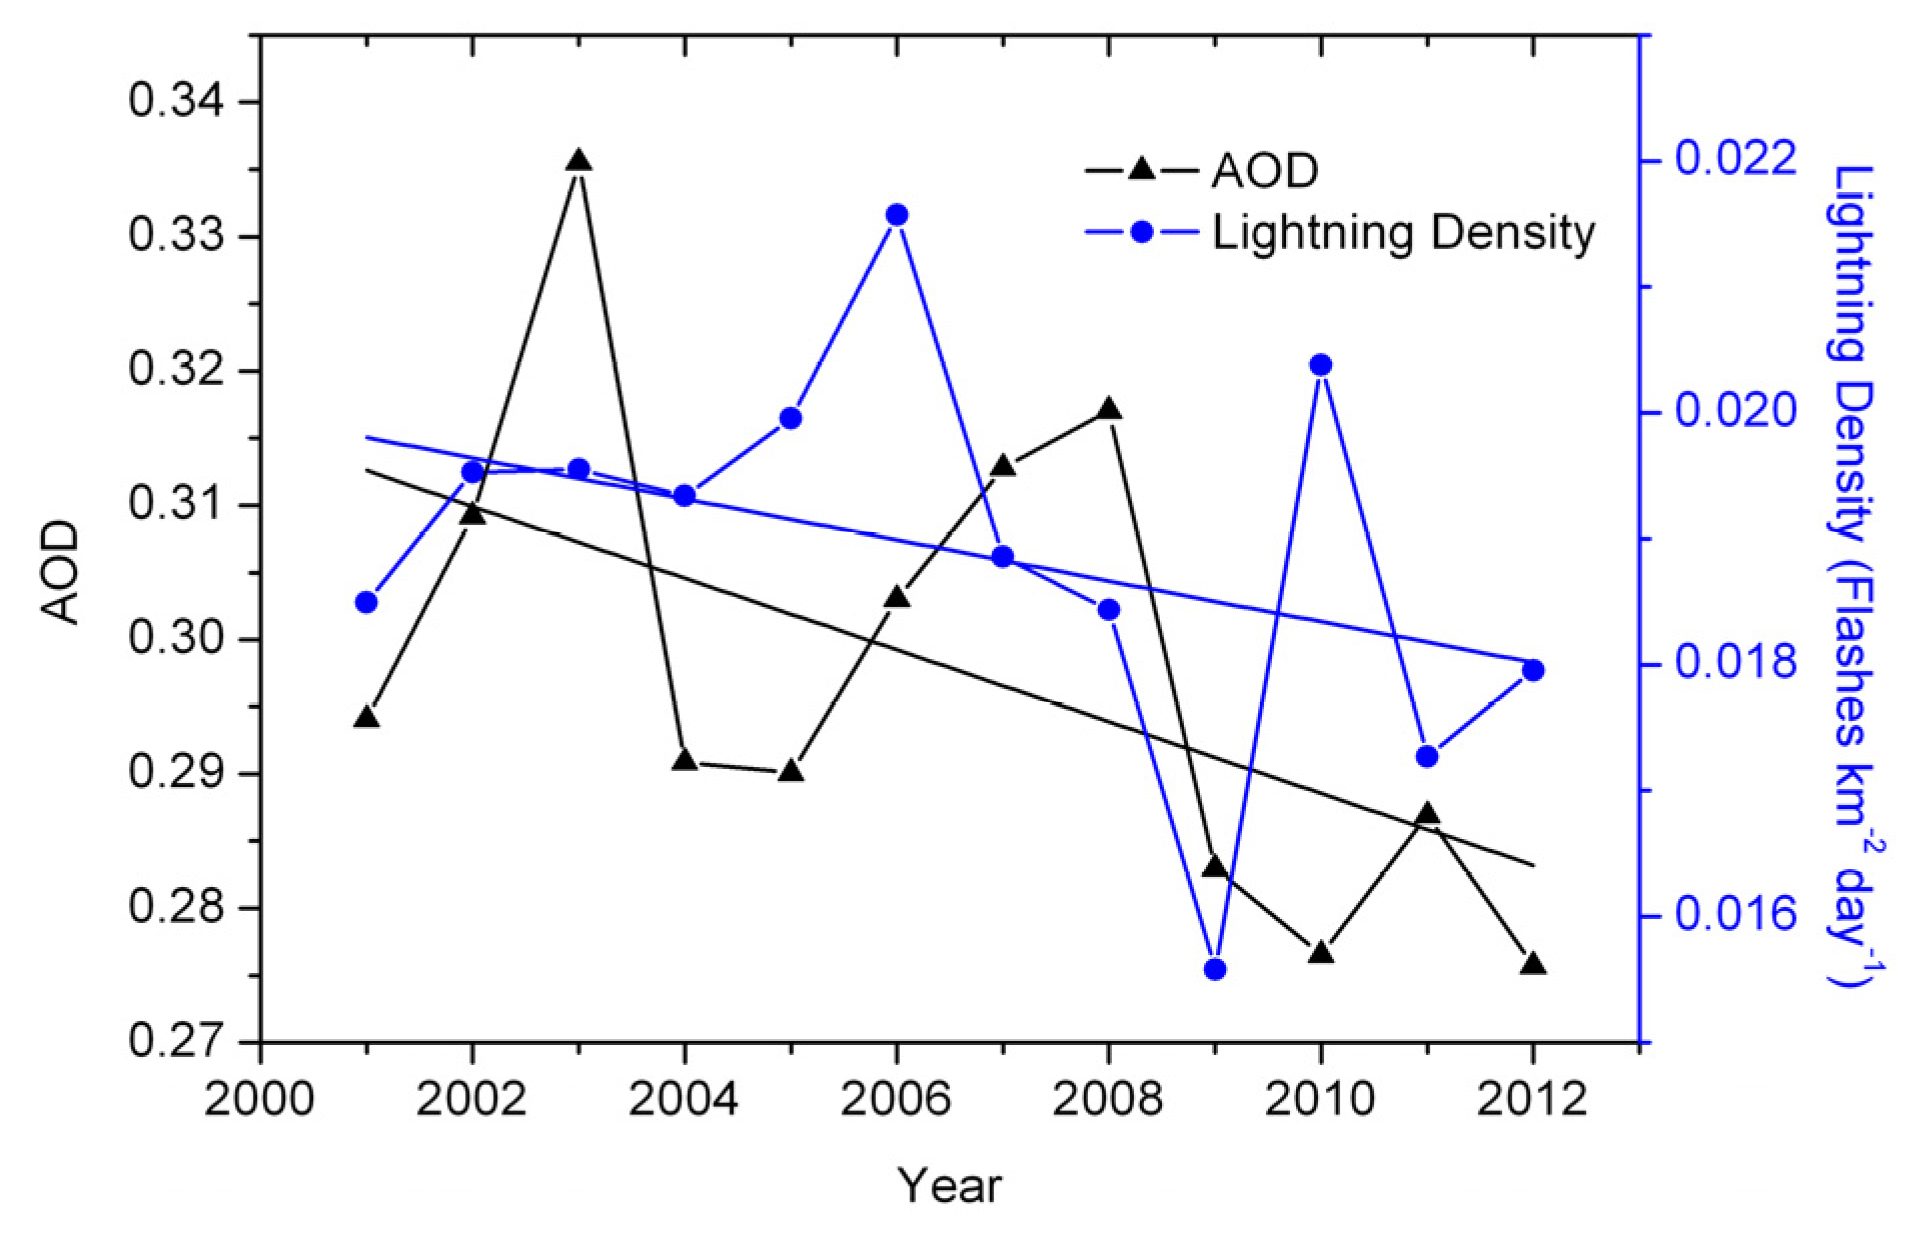
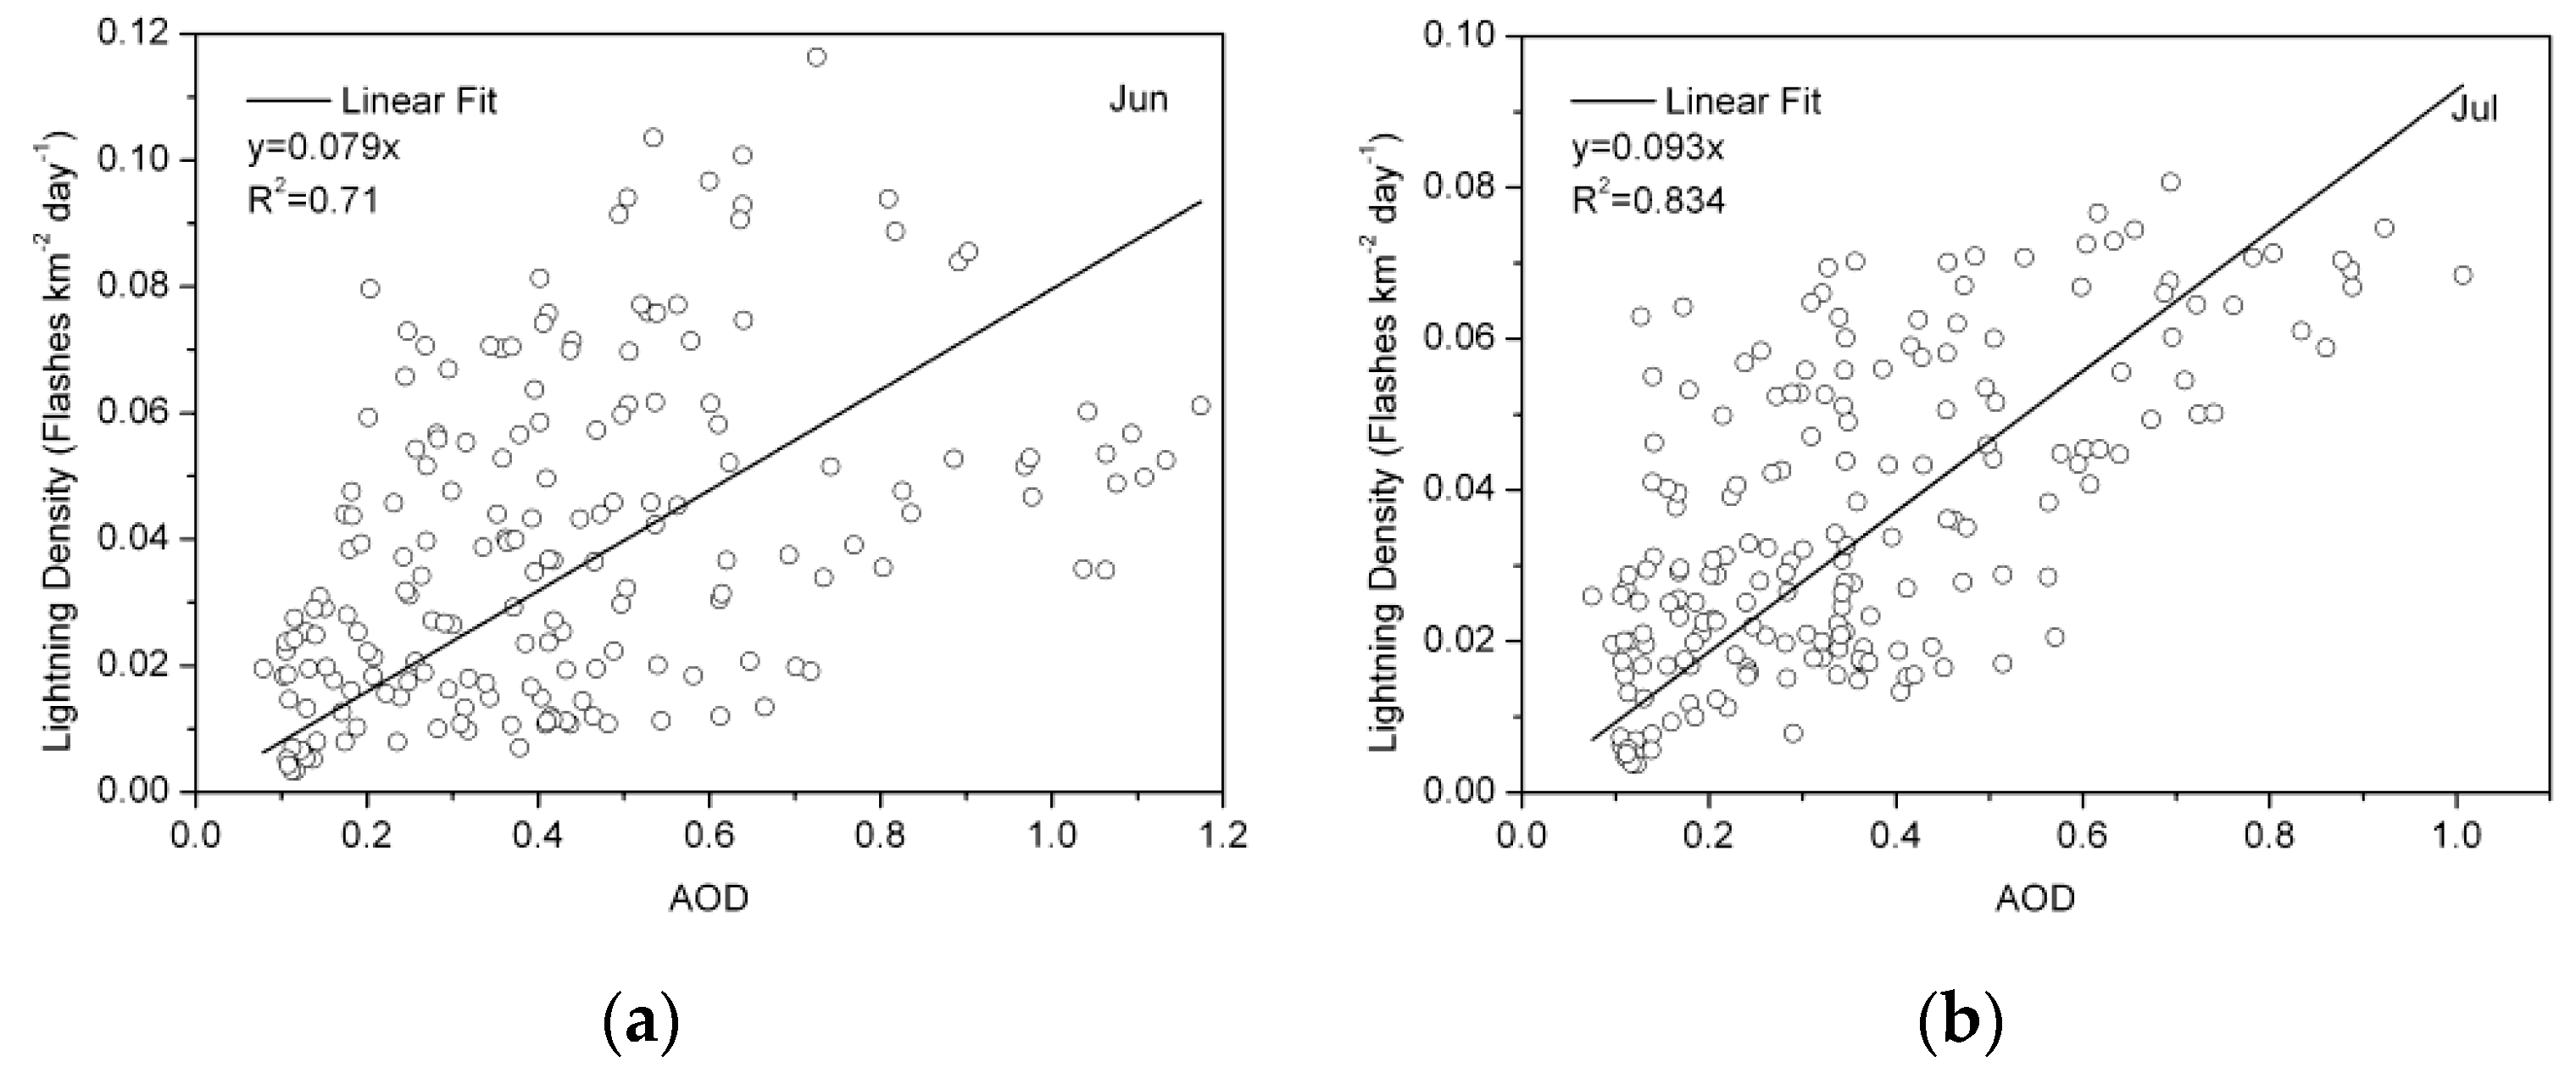
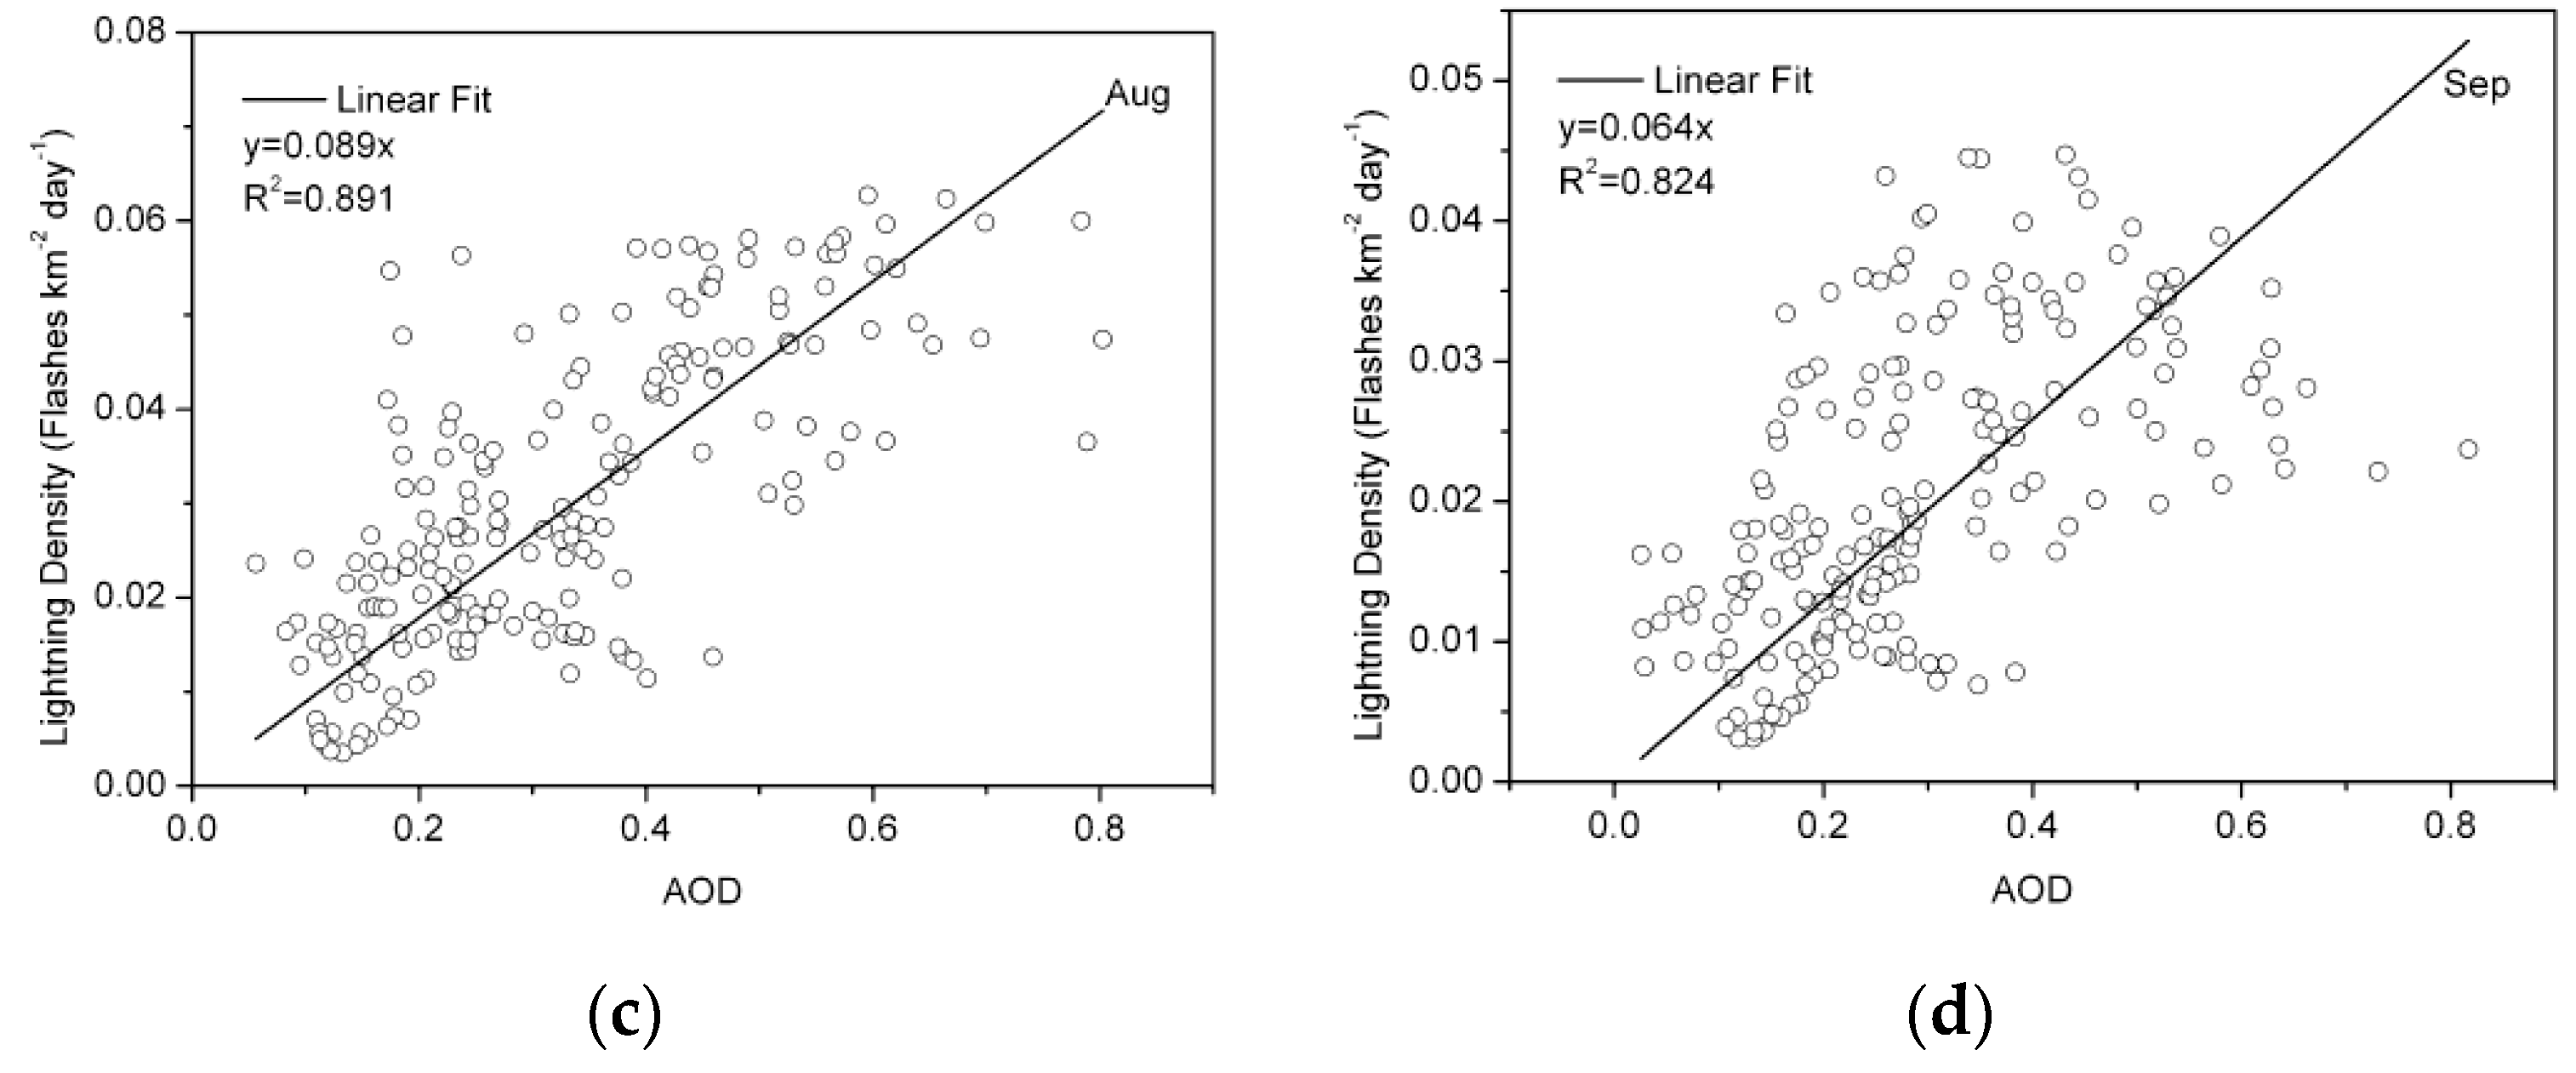
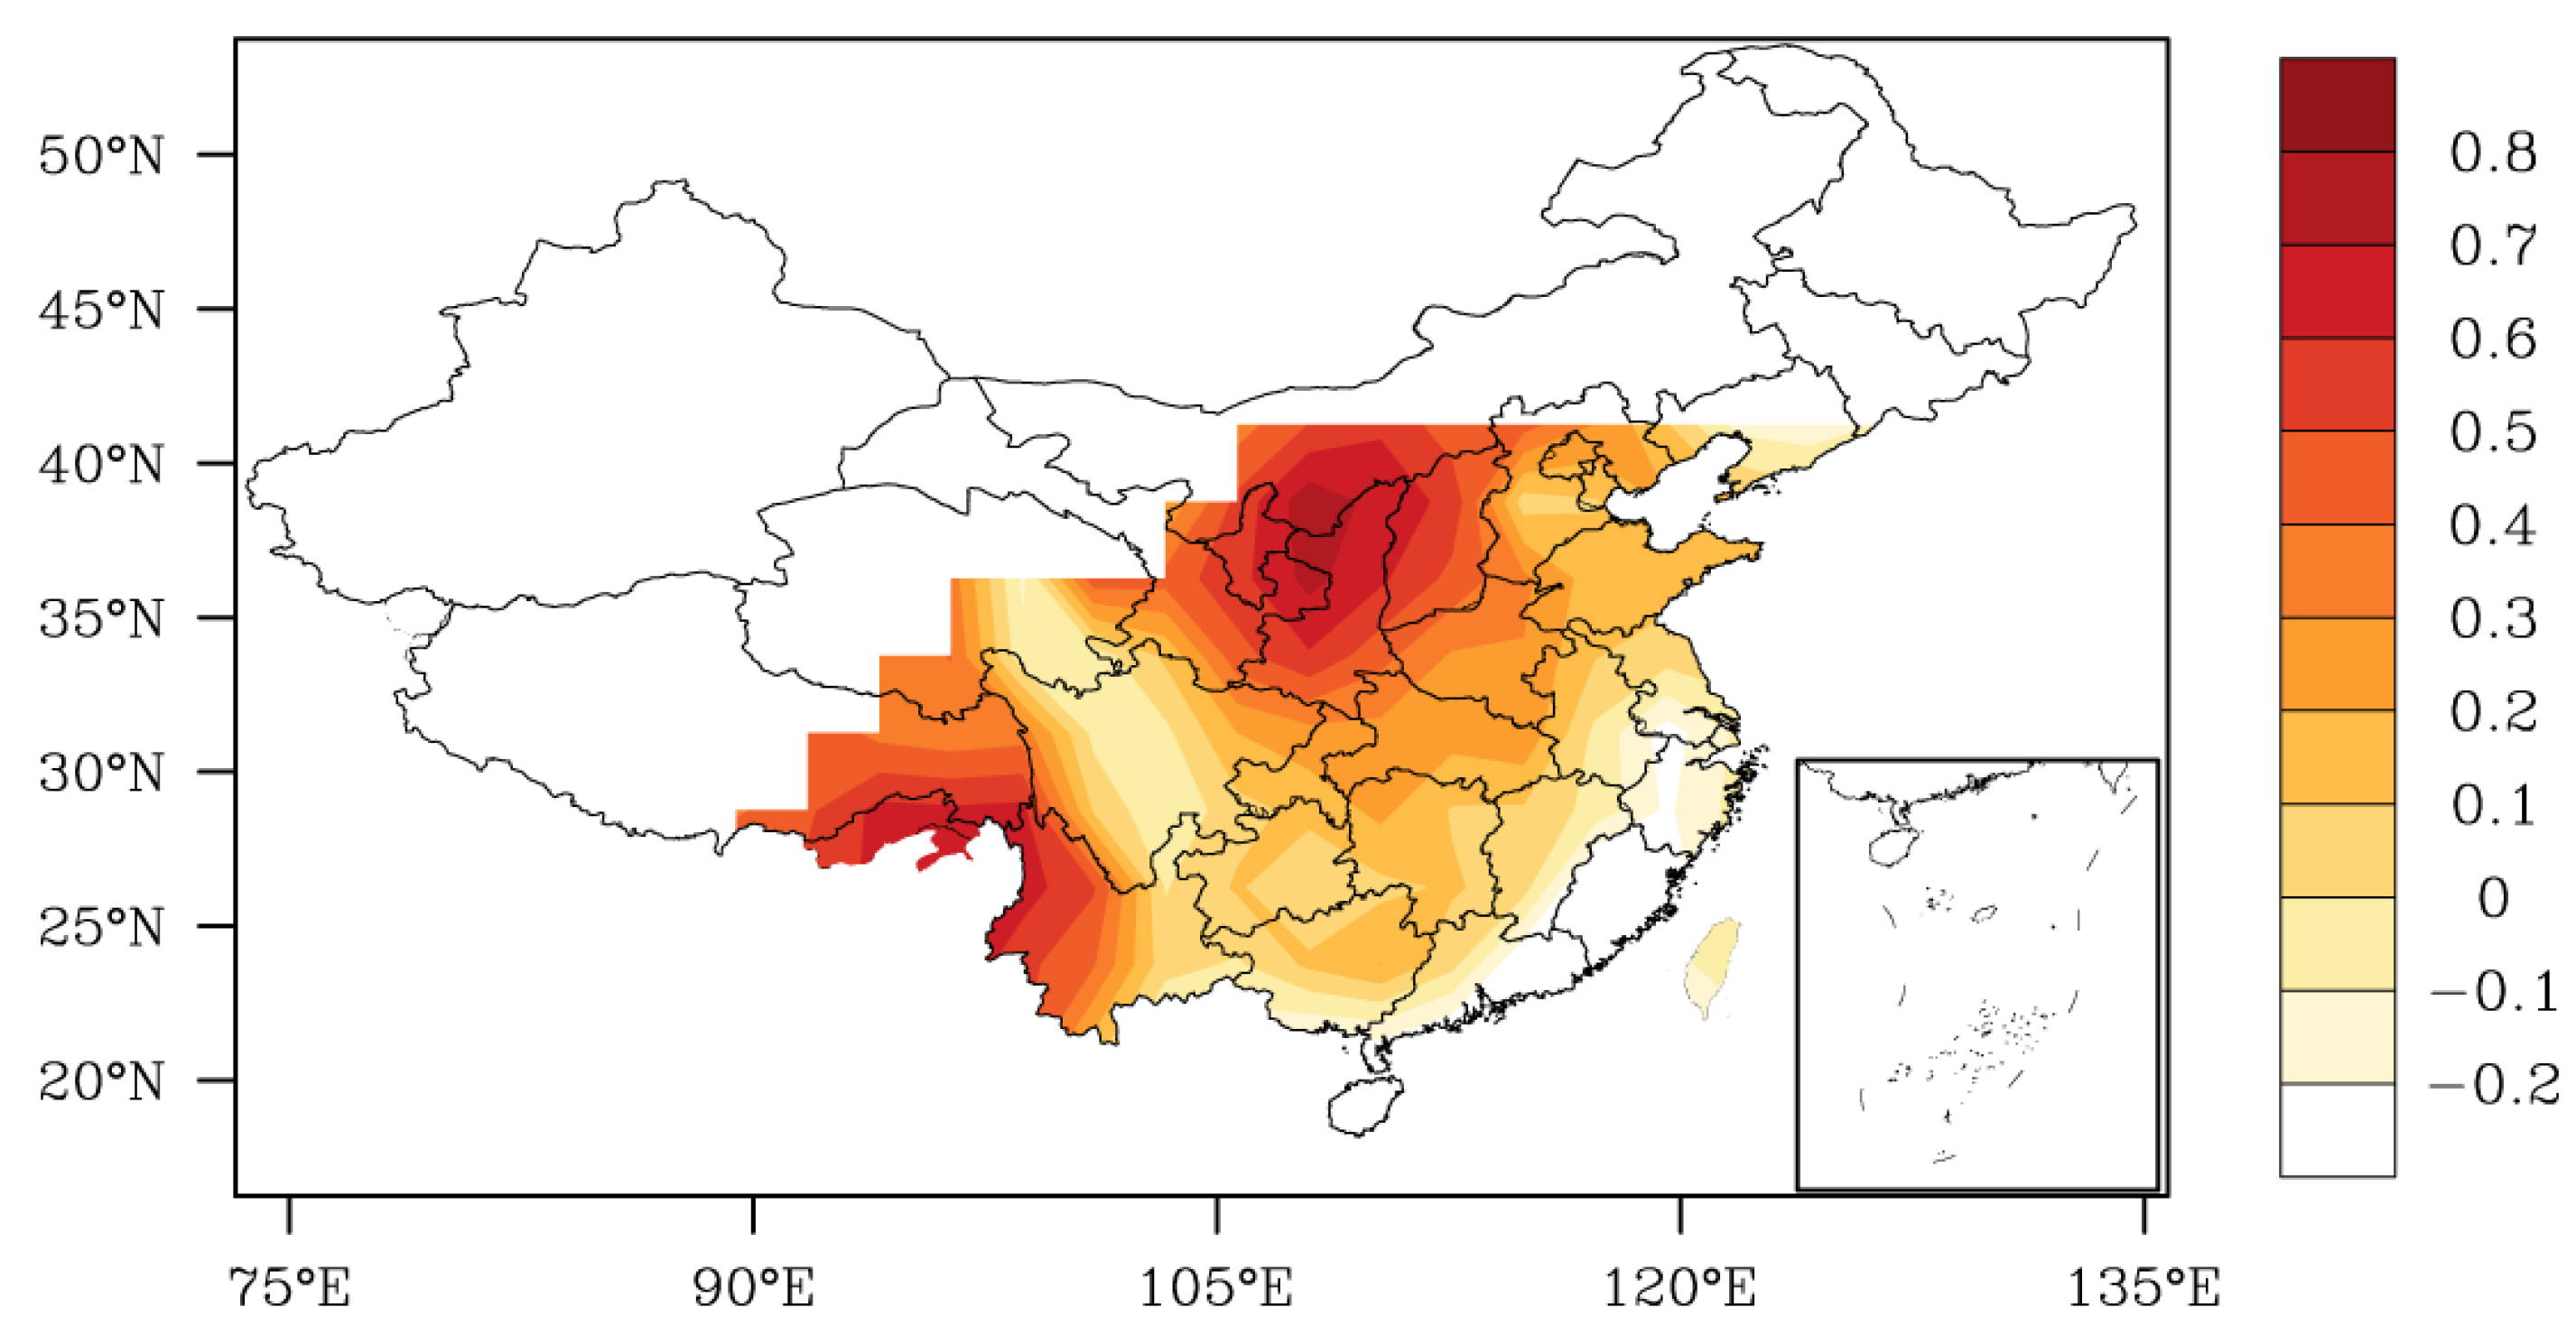
3.3. Relationship between Lightning Flash Density and AOD

The lightning flash density detected by LIS/OTD was used as a measure for the convection intensity (based on the results shown in Figure 3, Figure 4 and Figure 5). Figure 6 presents the correlation between the AOD and lightning flash density for JJAS. The results show that the lightning flash density was positively correlated with the AOD (R = 0.84 for June, R = 0.91 for July, R = 0.94 for August and R = 0.9 for September), which is in accordance with some earlier studies [12,13,14,15,16,17,18,19,20,21,22,23,24]. The dependence of the electrical activity and AOD displays a positive correlation, which suggests that the enhanced aerosol loading is one of the important reasons for the increase in lightning activity. One can see that the positive link between the lightning flash density and AOD is more pronounced in July and August, when the thunderstorms are more intense [47]. The scatter of the lightning flash density and AOD in JJAS shows that the enhancement of lightning activity with the increasing AOD is not linear. Altaratz et al. [28] indicated that the lightning stroke number increased with the aerosol loading for low AOD values, while the stroke number decreased with the increasing AOD for larger AOD values.
The effects of aerosols on the lightning flash density in different months are different, and they are decided by the intensity of the electrical activity in the thunderstorm. The positive correlation between the AOD and lightning flash density is more pronounced in the period when the lightning activity is more frequent. Our results support the aerosol hypothesis as applied to lightning in the previous modeling studies [49,50,51,52,53,54] which discussed the effect of atmosphere aerosols on the microphysical process and electrical activity. They indicated that an increasing aerosol loading delayed the warm rain formation and increased the convection intensity due to the decrease of the cloud droplet size, where numerous smaller droplets were transported to the freezing region by the stronger updraft to form more ice particles, and more ice particles participated in the electrification process, resulting in more exuberant lightning activities of the thunderstorms.
To discuss the relationship between the AOD and lightning flash density in different regions of China, we calculated the Pearson correlation coefficient by utilizing the monthly mean data of the AOD and lighting flash density in the period covering 2001 to 2012. The Pearson correlation coefficient that describes the linear correlation level between the two variables is obtained by Equation (1):
r = N X Y X Y N X 2 ( X ) 2 N Y 2 ( Y ) 2
The spatial distribution of the Pearson correlation coefficient between the lightning flash density and AOD over China is shown in Figure 7. We ignored the blank space in Figure 7 caused by the missing data of the AOD or lightning flash density. One can see that the relationship between the aerosols and electrical activity expresses obvious regional differences over most regions over China. Two centers of obvious positive correlation exist, including the northern inland regions and part of the southwest regions, while the low-correlation regions are located at the central Sichuan basin and the coastal areas. The previous studies [59] indicated that the lightning activities over land regions were more active than those over ocean regions due to the sea-land thermal difference and the aerosol concentration difference. The abundant water vapor and thermal conditions benefit the convection development and lightning production in coastal regions. The low correlation between aerosols and lightning activity in coastal regions mainly results from two reasons: one is the significant scavenging effect of the land-sea breeze on aerosol particles, and the other is that the stimulation effect of the thermal condition on electrical activity is more prominent than the aerosol stimulation effect on lightning activity. This proves the previous studies conducted by Lar and Pawar [22] who examined the relationship between aerosols and lightning in inland and coastal metropolitan cities of India. They found that aerosols played a major part in increasing the electrical activity over inland cities. The results also indicated that the lightning and rainfall were controlled by large-scale processes and the effect of aerosols on lightning was not remarkable in coastal cities.

4. Summary and Discussion

The Aqua-MODIS cloud and aerosol data together with the LIS/OTD onboard TRMM satellite lightning measurements in the period covering June to September over China for the years 2001 to 2012 were used to discuss the relationships between cloud properties and their lightning activities and to investigate the intricate aerosols’ effect on the electrical processes of thunderstorms. The annual mean values of the AOD and lightning flash density both present a downward trend in the study period and area. The results showed that the cloud coverage, cloud top height, and ice cloud optical thickness are closely associated with the lightning activity. A larger cloud with a bigger cloud fraction, a higher vertical dimension and a larger content of ice particles produces more lightning flashes. The lightning flash density is a direct measurement for the intensity of convective clouds. The obvious positive correlation between the AOD and lightning flash density proves the previous simulation studies [49,50,51,52,53,54]. This indicates that increasing aerosol loading inspires the development of convection, and then the stronger updraft transports numerous smaller droplets above the freezing level to form more ice particles, resulting in more ice particles participating in the electrification process and producing more lightning activities.
The spatial distribution of the relationship between aerosol loading and electrical activity shows a remarkable regional difference over China. The high-positive-correlation centers are situated at the northern inland regions and part of the southwest regions, and the low-correlation regions are located at the central Sichuan basin and coastal areas. The low correlation in the coastal areas indicates that lightning activity is mainly controlled by large-scale processes, and hence the aerosol effect is not remarkable in the coastal regions. This agrees with the studies of Lal and Pawar [22].
The effects of aerosol loading on the intensity of convection and lighting activity have two opposite aspects. One of them is the indirect microphysical effect that inspires the intensity of the convective cloud and the electrical activity. The inverse aspect is the direct radiative effect that suppresses the development of convection and the production of lightning [24,28]. The complex physical processes of the aerosol effect on clouds result in the uncertainty of the aerosol effect on electrical activity. In this paper, we mainly discussed the aerosol microphysical effect on the intensity of convection and electrical activity. However, the limitation of the spatial resolution of data constraints further detailed study of the aerosol effect on lightning in different small regions with distinguishing meteorological and geographical conditions over China. Therefore, the observational studies on aerosols and lightning with longer time series and higher spatial resolution, and simulation studies considering detailed meteorological and geographical backgrounds, are required in the future.

Acknowledgments

The Scientific Research Foundation of CUIT (KYTZ201601), the National Basic Research and Development (973) Program of China (2014CB441401, 2014CB441403), the Science and Technology Achievements Transformation Program of Sichuan Provincial Department of Education (16CZ0021), and the Key Program of Beijing Municipal Natural Science Foundation (8141002) are gratefully acknowledged.

Author Contributions

Pengguo Zhao, Yunjun Zhou conceived and designed the article; Pengguo Zhao, Hui Xiao, Jia Liu, Jinhui Gao and Fei Ge analyzed the data and wrote the paper. All authors have read and approved the final manuscript.

Conflicts of Interest

The authors declare no conflict of interest.

References

  1. Twomey, S. Influence of pollution on the short-wave albedo of clouds. J. Atmos. Sci. 1977, 34, 1149–1152. [Google Scholar] [CrossRef]
  2. Rosenfeld, D.; Lohmann, U.; Raga, G.B.; O’Dowd, C.D.; Kulmala, M.; Fuzzi, S.; Reissell, A.; Andreae, M.O. Flood or drought: How do aerosols affect precipitation? Science 2008, 321, 1309–1313. [Google Scholar] [CrossRef] [PubMed]
  3. Yin, Y.; Levin, Z.; Reisin, T.; Tzivion, S. The effects of giant cloud condensation nuclei on the development of precipitation in convective clouds—A numerical study. Atmos. Res. 2000, 53, 91–116. [Google Scholar] [CrossRef]
  4. Khain, A.; Rosenfeld, D.; Pokrovsky, A. Aerosol impact on the dynamics and microphysics of convective clouds. Q. J. R. Meteorol. Soc. 2005, 131, 2639–2663. [Google Scholar] [CrossRef]
  5. Van den Heever, S.C.; Carrio, G.G.; Cotton, W.R.; DeMott, P.G.; Prenni, A.J. Impacts of nucleating aerosol on Florida storms. Part I: Mesoscale Simulations. J. Atmos. Sci. 2006, 63, 1752–1775. [Google Scholar] [CrossRef]
  6. Deierling, W.; Petersen, W.A. Total lightning activity as an indicator of updraft characteristics. J. Geophys. Res. 2008, 113. [Google Scholar] [CrossRef]
  7. Deierling, W.; Petersen, W.; Latham, A.; Ellis, S.; Christian, H. The relationship between lightning activity and ice fluxes in thunderstorms. J. Geophys. Res. 2008, 113. [Google Scholar] [CrossRef]
  8. Yoshida, S.; Morimoto, T.; Ushio, T.; Kawasaki, Z. A fifth-power relationship for lightning activity from Tropical Rainfall Measuring Mission satellite observations. J. Geophys. Res. 2009, 114. [Google Scholar] [CrossRef]
  9. Takahashi, T. Riming electrification as a charge generation mechanism in thunderstorms. J. Atmos. Sci. 1978, 35, 1536–1548. [Google Scholar] [CrossRef]
  10. Saunders, C.P.R.; Keith, W.D.; Mitzeva, R.P. The effect of liquid water on thunderstorm charging. J. Geophys. Res. 1991, 96, 11007–11017. [Google Scholar] [CrossRef]
  11. Westcott, N.E. Summertime cloud-to-ground lightning activity around major Midwestern urban areas. J. Appl. Meteorol. 1995, 34, 1633–1642. [Google Scholar] [CrossRef]
  12. Orville, R.R.; Huffines, G.; Gammon, J.N.; Zhang, R.; Ely, B.; Steiger, S.; Phillips, S.; Allen, S.; Read, W. Enhancement of cloud-to-ground lightning over Houston, Texas. Geophys. Res. Lett. 2001, 28, 2597–2600. [Google Scholar] [CrossRef]
  13. Soriano, L.R.; Pablo, F. Effect of small urban areas in central Spain on the enhancement of cloud-to-ground lightning activity. Atmos. Environ. 2002, 36, 2809–2816. [Google Scholar] [CrossRef]
  14. Steiger, S.M.; Orville, R.E.; Huffines, G. Cloud-to-ground lightning characteristics over Houston, Texas: 1989–2000. J. Geophys. Res. 2002, 107. [Google Scholar] [CrossRef]
  15. Kar, S.K.; Liou, Y.A.; Ha, K.J. Aerosol effects on the enhancement of cloud-to-ground lightning over major urban areas of South Korea. Atmos. Res. 2009, 92, 80–87. [Google Scholar] [CrossRef]
  16. Kar, S.K.; Liou, Y.A. Enhancement of cloud-to-ground lightning activity over Taipei, Taiwan in relation to urbanization. Atmos. Res. 2014, 147–148, 111–120. [Google Scholar] [CrossRef]
  17. Coquillat, S.; Boussaton, M.; Buguet, M.; Lambert, D.; Ribaud, J.; Berthelot, A. Lightning ground flash patterns over Paris area between 1992 and 2003: Influence of pollution? Atmos. Res. 2013, 122, 77–92. [Google Scholar] [CrossRef]
  18. Farias, W.R.G.; Pinto, O., Jr.; Pinto, I.R.C.A.; Naccarato, K.P. The influence of urban effect on lightning activity: Evidence of weekly cycle. Atmos. Res. 2014, 135–136, 370–373. [Google Scholar] [CrossRef]
  19. Proestakis, E.; Kazadzis, S.; Lagouvardos, K.; Kotroni, V.; Kazantzidis, A. Lightning activity and aerosols in the Mediterranean region. Atmos. Res. 2016, 170, 66–75. [Google Scholar] [CrossRef]
  20. Farias, W.R.G.; Pinto, O., Jr.; Naccarato, K.P.; Pinto, I.R.C.A. Anomalous lightning activity over the Metropolitan Region of São Paulo due to urban effects. Atmos. Res. 2009, 91, 485–490. [Google Scholar] [CrossRef]
  21. Stallins, J.A.; Carpenter, J.; Bentley, M.L.; Ashley, W.S.; Mulholland, J.A. Weekend-weekday aerosols and geographic variability in cloud-to-ground lightning for the urban region of Atlanta, Georgia, USA. Reg. Environ. Chang. 2013, 1, 137–151. [Google Scholar] [CrossRef]
  22. Lal, D.M.; Pawar, S.D. Effect of urbanization on lightning over four metropolitan cities of India. Atmos. Environ. 2011, 45, 191–196. [Google Scholar] [CrossRef]
  23. Wang, Y.; Wan, Q.; Meng, W.; Liao, F.; Tan, H.; Zhang, R. Long-term impacts of aerosols on precipitation and lightning over the Pearl River Delta megacity area in China. Atmos. Chem. Phys. 2011, 11, 12421–12436. [Google Scholar] [CrossRef]
  24. Tan, Y.B.; Peng, L.; Shi, Z.; Chen, H.R. Lightning flash density in relation to aerosol over Nanjing (China). Atmos. Res. 2016, 174–175, 1–8. [Google Scholar]
  25. Lyons, W.A.; Nelson, T.E.; Williams, E.R.; Cramer, J.; Turner, T. Enhanced positive cloud- to-ground lightning in thunderstorms ingesting smoke. Science 1998, 282, 77–81. [Google Scholar] [CrossRef] [PubMed]
  26. Murray, N.D.; Orville, R.E.; Huffines, G.R. Effect of pollution from Central American fires on cloud-to-ground lightning in May 1998. Geophys. Res. Lett. 2000, 27, 2249–2252. [Google Scholar] [CrossRef]
  27. Fernandes, W.A.; Pinto, I.R.C.A.; Pinto, O., Jr.; Longo, K.M.; Freitas, S.R. New findings about the influence of smoke from fires on the cloud-to-ground lightning characteristics in the Amazon region. Geophys. Res. Lett. 2006, 33, L20810. [Google Scholar] [CrossRef]
  28. Altaratz, O.; Koren, I.; Yair, Y.; Price, C. Lightning response to smoke from Amazonian fires. Geophys. Res. Lett. 2010, 37, L07801. [Google Scholar] [CrossRef]
  29. Lang, T.J.; Rutledge, S.A. Cloud-to-ground lightning downwind of the 2002 Hayman forest fire in Colorado. Geophys. Res. Lett. 2006, 33. [Google Scholar] [CrossRef]
  30. Mi, W.; Li, Z.Q.; Xia, X.G.; Holben, B.; Levy, R.; Zhao, F.S.; Chen, H.B.; Cribb, M. Evaluation of the Moderate Resolution Imaging Spectroradiometer aerosol products at two Aerosol Robotic Network stations in China. J. Geophys. Res. 2007, 112. [Google Scholar] [CrossRef]
  31. Kaufman, Y.J.; Boucher, O.; Tanre, D.; Chin, M.; Remer, L.A.; Takemura, T. Aerosol anthropogenic component estimated from satellite data. Geophys. Res. Lett. 2005, 32. [Google Scholar] [CrossRef]
  32. Levy, R.C.; Remer, L.A.; Mattoo, S.; Vermote, E.F.; Kaufman, Y.J. Second-generation operational algorithm: Retrieval of aerosol properties over land from inversion of Moderate Resolution Imaging Spectroradiometer spectral reflectance. J. Geophys. Res. 2007, 112. [Google Scholar] [CrossRef]
  33. Cecil, D.J.; Buechker, D.E.; Blakeslee, R.J. Gridded lightning climatology from TRMM-LIS and OTD: Dataset description. Atmos. Res. 2014, 135–136, 404–414. [Google Scholar] [CrossRef]
  34. Dai, J.; Wang, Y.; Chen, L.; Tao, L.; Gu, F.; Wang, J.; Xu, X.; Lin, H.; Gu, Y. A comparison of lightning activity and convective indices over some monsoon-prone areas of China. Atmos. Res. 2009, 91, 438–452. [Google Scholar] [CrossRef]
  35. Ma, M.; Tao, S.; Zhu, B.; Lu, W. Climatological distribution of lightning density observed by satellites in China and its circumjacent regions. Sci. China 2005, 48, 219–229. [Google Scholar] [CrossRef]
  36. Pan, L.; Liu, D.; Qie, X.; Wang, D.; Zhu, R. Land-sea contrast in the lightning diurnal variation as observed by the WWLLN and LIS/OTD data. Acta Meteor. Sin. 2013, 27, 591–600. [Google Scholar] [CrossRef]
  37. Qie, X.; Toumi, R.; Yuan, T. Lightning activities on the Tibetan Plateau as observed by the lightning imaging sensor. J. Geophys. Res. 2003, 108. [Google Scholar] [CrossRef]
  38. Yuan, T.; Qie, X. Study on lightning activity and precipitation characteristics before and after the onset of the South China Sea summer monsoon. J. Geophys. Res. 2008, 113. [Google Scholar] [CrossRef]
  39. Wang, Y.; Chen, W.; Liu, J. Temporal and spatial distributions of lightning activity in South China from TRMM satellite observations. J. Trop. Meteor. 2009, 25, 228–233. (In Chinese) [Google Scholar]
  40. Xia, R.; Zhang, D.; Wang, B. A 6-yr Cloud-to-Ground lightning climatology and its relationship to rainfall over Central and Eastern China. J. Appl. Meteor. Climatol. 2015, 54, 2443–2460. [Google Scholar] [CrossRef]
  41. Xu, H.; Guang, J.; Xue, Y.; Leeuw, G.; Che, Y.H.; Guo, J.; He, X.W.; Wang, T.K. A consistent aerosol optical depth (AOD) dataset over mainland China by integration of several AOD products. Atmos. Environ. 2015, 14, 48–56. [Google Scholar] [CrossRef]
  42. Zheng, X.; Luo, Y.; Zhao, T.; Chen, J.; Kang, W. Geographical and climatological characterization of aerosol distribution in China. Sci. Geogr. Sin. 2012, 32, 225–272. [Google Scholar]
  43. Zhao, T.; Gong, S.; Zhang, X.; Blanchet, J.; McKendry, I.; Zhou, Z. A simulated climatology of Asian dust aerosol and its trans-Pacific transport. Part I: Mean climate and validation. J. Clim. 2006, 19, 88–103. [Google Scholar] [CrossRef]
  44. Wang, G.; Lu, Q. Migration of rural population in recent years in China. Sci. Geogr. Sin. 2007, 27, 630–635. (In Chinese) [Google Scholar]
  45. Wu, G.X.; Li, Z.Q.; Fu, C.B. Advances in studying interactions between aerosols and monsoon in China. Sci. China Earth. Sci. 2016, 59, 1–16. [Google Scholar] [CrossRef]
  46. Li, Q.; Zhang, R.; Wang, Y. Interannual variation of the wintertime fog–haze days across central and eastern China and its relation with East Asian winter monsoon. Int. J. Climatol. 2016, 36, 346–354. [Google Scholar] [CrossRef]
  47. Zhang, H.; Cheng, G.; Zhang, T. Characteristics of lightning distribution and lightning climate for China region. Arid Meteor. 2004, 22, 17–25. (In Chinese) [Google Scholar]
  48. Zhao, Y.; Xu, X.; Zhao, T.; Xu, H.; Mao, F.; Sun, H.; Wang, Y. Extreme precipitation events in East China and associated moisture transport pathways. Sci. China Earth. Sci. 2016, 59, 1854–1872. [Google Scholar] [CrossRef]
  49. Mitzeva, R.P.; Latham, J.; Petrova, S. A comparative modeling study of the early electrical development of maritime and continental thunderstorms. Atmos. Res. 2006, 82, 26–36. [Google Scholar] [CrossRef]
  50. Mansell, E.R.; Ziegler, C.L. Aerosol Effects on Simulated Storm Electrification and Precipitation in a Two-Moment Bulk Microphysics Model. J. Atmos. Sci. 2013, 70, 2032–2050. [Google Scholar] [CrossRef]
  51. Zhao, P.; Yin, Y.; Xiao, H. The effects of aerosol on development of thunderstorm electrification: A numerical study. Atmos. Res. 2015, 153, 376–391. [Google Scholar] [CrossRef]
  52. Zhao, P.; Yin, Y.; Xiao, H.; Zhou, Y.; Liu, J. Role of water vapor content in the effects of aerosol on the electrification of thunderstorms: A numerical study. Atmosphere 2016, 7, 137. [Google Scholar] [CrossRef]
  53. Shi, Z.; Tan, Y.; Tang, H.; Sun, J.; Yang, Y.; Peng, L.; Guo, X. Aerosol effect on the land-ocean contrast in thunderstorm electrification and lightning frequency. Atmos. Res. 2015, 164–165, 131–141. [Google Scholar] [CrossRef]
  54. Shi, Z.; Tan, Y.; Tang, H.; Yang, Y.; Peng, L.; Guo, X.; Chen, H. A numerical study of aerosol effects on the electrification and flash rate of thunderstorms. Chin. J. Atmos. Sci. 2015, 39, 941–952. [Google Scholar]
  55. Ushio, T.; Heckman, S.J.; Boccippio, D.J.; Christian, H.J.; Kawasaki, J.I. A survey of thunderstorm flash rates compared to cloud top height using TRMM satellite data. J. Geophys. Res. 2001, 106, 24089–24095. [Google Scholar] [CrossRef]
  56. Yair, Y.; Lynn, B.; Price, C.; Kotroni, V.; Lagouvardos, K.; Morin, E.; Mugnai, A.; Llasat, M.C. Predicting lightning density in Mediterranean storms based on the WRF model dynamic and microphysical fields. J. Geophys. Res. 2010, 115, D04025. [Google Scholar] [CrossRef]
  57. Williams, E.R. The Electrification of Severe Storms; American Meteorological Society: Washington, DC, USA, 2001; pp. 527–561. [Google Scholar]
  58. Chen, J.; Zheng, Y.; Zhang, X.; Zhu, P. Analysis of the climatological distribution and diurnal variation of the short-duration heavy rain and its relation with diurnal variations of the MCSs over China during the warm season. Acta Meteorol. Sin. 2013, 71, 367–382. (In Chinese) [Google Scholar]
  59. Williams, E.; Chan, T.; Boccippio, D. Islands as miniature continents: Another look at the land-ocean lightning contrast. J. Geophys. Res. 2011, 109. [Google Scholar] [CrossRef]
Figure 1. Annual mean (a) aerosol optical depth at 550 nm (AOD) and (b) lightning flash density (flashes km−2·year−1) over China calculated from 2001 to 2012.
Atmosphere 08 00026 g001
Figure 2. Variation of regional annual mean AOD and lightning flash density (flashes km−2·year−1) over China from 2001 to 2012.
Atmosphere 08 00026 g002
Figure 3. Correlation between lightning flash density (flashes km−2·year−1) and cloud fraction for June to September over China. (a) June; (b) July; (c) August; (d) September.
Atmosphere 08 00026 g003
Figure 4. Correlation between lightning flash density (flashes km−2·year−1) and cloud top height (m) for June to September over China area. (a) June; (b) July; (c) August; (d) September.
Atmosphere 08 00026 g004aAtmosphere 08 00026 g004b
Figure 5. Correlation between lightning flash density (flashes km–2·year–1) and ice cloud optical thickness for June to September over China. (a) June; (b) July; (c) August; (d) September.
Atmosphere 08 00026 g005
Figure 6. Correlation between lightning flash density (flashes km−2·year−1) and AOD for June to September over China. (a) June; (b) July; (c) August; (d) September.
Atmosphere 08 00026 g006aAtmosphere 08 00026 g006b
Figure 7. Spatial distribution of Pearson correlation coefficient between lightning flash density and AOD over China.
Atmosphere 08 00026 g007

