Modeling the Stepping Process of Negative Lightning Stepped Leaders


Department of Engineering Sciences, Uppsala University, 75121 Uppsala, Sweden
*
Author to whom correspondence should be addressed.
Atmosphere 2017, 8(12), 245; https://doi.org/10.3390/atmos8120245
Submission received: 22 August 2017
/
Revised: 22 November 2017
/
Accepted: 30 November 2017
/
Published: 7 December 2017
Abstract
:A physical model based on the mechanism observed in experimental investigations is introduced to describe the formation of negative leader steps. Starting with a small length of a space leader located at the periphery of the negative streamer system of the stepped leader, the model simulates the growth and the subsequent formation of the leader step. Based on the model, the step length, the step forming time, and the propagation speed of stepped leaders as a function of the prospective return stroke peak current are estimated. The results show that the step length and the leader speed increase with increasing prospective return stroke current. The results also show that the speed of the stepped leader increases as it approaches the ground. For prospective return stroke currents in the range of 15 kA–60 kA, the step lengths lie within the range 5 m–100 m, the step forming times lie within the range 10 μs–250 μs, and the leader speed lies within the range 105 m/s −1.5 × 10⁶ m/s. The results obtained are in reasonable agreement with the experimental observations.
1. Introduction
About 90% of lightning ground flashes transport negative charge to Earth; these are called negative ground flashes. The first return strokes of negative ground flashes are initiated by stepped leaders that travel from cloud to ground. Photographic evidence shows that these leaders travel towards the ground in intermittent steps, and experimental data on the time intervals between the steps and the lengths of the individual steps are available in the literature [1,2]. The available information shows that the time intervals between steps span from 10 µs to 100 µs and the lengths of the steps span from 5 m to about 200 m [1,2,3,4]. More recently, the detailed development of the stepping process in negative lightning leaders has been observed using high-speed photography [4].
The first detailed information concerning the development of negative leaders in laboratory sparks was obtained by the group of scientists working at Renardieres [5]. More details concerning the development of negative leaders were obtained in experiments conducted by Castellani et al. [6], in which the bi-directional development of the leader steps was identified. Based on the experimental data obtained at Renadieres [5], Bacchiega [7] developed the first theoretical model of the stepped leader in long air gaps. The first application of the available experimental data to develop a negative lightning stepped leader model was conducted by Lalande et al. [8]. In that study, the negative stepped leader model was used to simulate the properties of the negative section of a bidirectional leader in altitude-triggered lightning. Based on the work of Bacchiega [7] and Lalande et al. [8], Mazur [9] developed a stepped leader model to study the attachment of negative ground flashes to grounded structures. However, in that study, no information concerning the step lengths and time interval between steps is presented. The theory developed by Lalande et al. [8] was used by Arevalo and Cooray [10] to develop a model for negative leaders in laboratory sparks. In this model, a novel procedure was used to calculate the charge in the negative streamer region of the negative stepped leader. Another study to simulate the negative lightning leader was introduced by Beroual et al. [11]. In this study, the stepped leader was simulated by an RLC electrical network, the parameters of which were extracted from electromagnetic wave propagation and experimentally observed properties of the negative leaders.
There are several leader progression models that have been developed to analyze the attachment of stepped leaders to grounded structures. These models treat the stepped leader as a charged channel that propagates continuously from cloud to ground [12,13,14]. Further development of these models requires more detailed representation of the stepped leader, including its stepping process.
As mentioned earlier, the parameters that can be extracted from photography and electric field measurements are the average speed of leaders, the step lengths, and the time interval between steps. The review of current literature given above shows that none of the modelling work pertinent to lightning leaders presented so far has provided information concerning these parameters that could be tested easily against available experimental data. The goal of the present study is to introduce a stepped leader model based on the experimental observations to study how the parameters of stepped leaders, such as the average speed, the step length, and the interval between steps of stepped leaders, vary as a function of stepped leader length and the prospective return stroke current (i.e., the current in the return stroke that will result from the stepped leader) of the stepped leader.
The paper is organized as follows: First, a description of the mechanism of laboratory and lightning stepped leaders observed experimentally is provided. This section is followed by a detailed description of the model to be used in extracting lightning leader parameters. In the third section, the model is exercised to generate parameters pertinent to stepped leaders and a comparison of these parameters with experimental observations is provided. This section is followed by a conclusion.
2. Mechanism of the Stepping Process of the Stepped Leader
Information gathered from long sparks shows that the stepping process in negative leaders is mediated by space stems and space leaders that do not exist in the positive breakdown [5]. The mechanism is the following: Together with the formation of a negative leader step, a burst of negative streamer discharges extends from the tip of the newly created leader step. Close to the extremity of the streamer region, a bright spot appears—this is called a space stem. From this space stem, streamers of both polarities develop in opposite directions. The positive streamers propagate towards the tip of the negative leader, and the negative streamers propagate in the opposite direction. The positive streamers from the space stem are actually propagating through the negative streamer region generated during the formation of the last step of the stepped leader. The energy dissipated by the cumulative current of these streamer discharges flowing through the space stem will convert the space stem to a space leader. The space leader elongates, with the aid of negative and positive streamer bursts generated from its ends, in both directions with one end travelling towards the tip of the negative stepped leader (i.e., tip of the last step) and the other end away from it. As the space leader approaches the tip of the negative leader, its speed increases exponentially. The connection of the space leader with the tip of the stepped leader is accompanied by a simultaneous illumination of the whole space leader channel starting from the meeting point. This illumination is associated with a process that transforms the space leader into a part of the stepped leader channel. As a result, the negative leader length increases by an amount roughly equal to the length of the space leader. During this conversion process, a burst of negative streamers emanates from the new tip of the negative leader (i.e., the rear end of the space leader that travelled away from the stepped leader). At the extremity of this streamer region, a new space stem is created and the process is repeated.
Recently, the stepping process in negative stepped leaders in the laboratory was studied with extremely high resolution in a study conducted by Kochkin et al. [15]. This study confirms the bidirectional nature of the discharge. Moreover, the study shows that fully extended negative streamers leave behind luminous regions (called beads in that study) on their path, and some of these beads give rise to the space stems.
Recent experimental data show that a mechanism similar to what is being observed in laboratory sparks is also active in lightning stepped leaders [3,4]. The data shows that a lightning leader step is also created by a space leader that starts ahead of the current head of the negative leader. When this space leader meets the existing stepped leader, a new step is created. This process is shown in Figure 1 which was adapted from reference [4]. This photograph shows clearly the development of the space leader and the subsequent development of the step.
3. The Model
As observed in the experiments and described in the last section, the stepping process of the negative stepped leader starts with the creation of a space stem. The space stem will generate both negative and positive streamers and their cumulative action leads to a bidirectional space leader, the positive end of which travels towards the tip of the stepped leader. The stepping process will be completed when the space leader reaches the tip of the negative stepped leader. To the best of our knowledge, the exact mechanism that gives rise to the space stem and the subsequent space leader is not known. Moreover, sufficient experimental data that can be used to create and test a model for the space stem and its subsequent conversion to the space leader is not available. For this reason, in the model, the presence of a short length space leader is assumed a priori.
The simulation starts when the down-coming stepped leader has extended to a given length, say Ll, below the negative charge centre. The various steps of the simulation are the following (Figure 2 illustrates two stages of the simulation):
- (1)
- Assuming that the leader channel is straight and vertical, the charge deposited along the length Ll of the leader channel is estimated using the analytical equations given in Cooray et al. [16] (see also [17,18]; note that in the equations given in these references there is a typo, namely, should be replaced by ). These analytical equations provide the distribution of the linear charge density along the channel of a stepped leader with a given prospective return stroke current. Using this charge distribution, the electric field ahead of the stepped leader channel is estimated.
- (2)
- The experimental data show that negative streamers require a background electric field of about (1–2) × 106 V/m for stable propagation [5]. In the simulations, this field is assumed to be either 1.0 × 10⁶ V/m or 2 × 10⁶ V/m. Based on the charge distribution of the stepped leader as specified in [16,17,18], the electric field ahead of the stepped leader channel is calculated. Since the charge on the stepped leader channel is negative, this electric field is directed towards the tip of the stepped leader. From the calculated electric field distribution ahead of the leader tip, the point where the electric field decreases beyond the value 1.0 × 10⁶ V/m (or 2.0 × 10⁶ V/m) is obtained. It is assumed that this point defines the boundary of the negative streamer region. Let us represent the distance from the tip of the leader to this point by Ls.
- (3)
- In the next simulation step, the presence of a small conducting channel of length l, which represents the first stage of the space leader, located at the boundary of the negative streamers of the stepped leader is assumed. No attempt is made either to separate the space stem from the space leader or to model the origin of the space stem. The initial length l assumed for the space leader is 0.05 m and the radius of the space leader is assumed to be 0.001 m. These values are sufficient to locally enhance the electric field such that negative streamers can exist ahead of the space leader. However, our calculations show that the final results to be presented later are not significantly influenced even if the initial value of the space leader is increased to 0.5 m and the radius of the space leader is increased to about 0.01 m. Since the space leader is located in the electric field of the stepped leader, it will be polarized and electrical charges will be accumulated at its ends, increasing the local electric field in their vicinity. The electric field in the vicinity of the ends of the space leader is estimated using a charge simulation method. In the calculation, the potential of the space leader is assumed to be equal to the unperturbed potential at the centre point of the space leader. In the next simulation step, it is assumed that this field enhancement will first give rise to a negative streamer burst from the end of the space leader which is located away from the negative stepped leader.
- (4)
- The negative streamers emanating from the negative space leader tip maintain a constant potential gradient in the negative streamer region. Experimental data show that this potential gradient is also equal to about (1–2) × 106 V/m [5,19]. Based on this, in the simulation, we assume that the potential gradient has a value equal to either 1.0 × 10⁶ V/m or 2 × 10⁶ V/m in the negative streamer region (marked in Figure 2). In the analysis, it is assumed that the electron avalanche will be converted to a streamer when the number of positive ions at the head of the avalanche exceeds about 108 [19].
- (5)
- The charge in the negative streamer burst generated from the space leader is calculated following the procedure outlined in references [14]. The charge associated with these streamer bursts is calculated using a distance–voltage diagram with the origin at the tip of the space leader, as follows. The procedure is illustrated in Figure 3. The streamer zone is assumed to maintain a constant potential gradient Estr. In the distance–voltage diagram, this is represented by a straight line. On the same diagram, the background potential produced by the thundercloud and the downward moving stepped leader at the current time is depicted. If the area between the two curves up to the point where they cross is (see Figure 3), the charge in the streamer zone is given bywhere is a geometrical factor. Becerra and Cooray [14] estimated its value to be about 3.5 × 10⁻¹¹ C/V m.
- (6)
- The currents associated with the streamers convert their stem into a hot channel and it becomes part of the space leader. This leads to the elongation of the space leader. Following the procedure introduced in reference [19], the extension of the negative tip of the space leader is assumed to be , where is the charge necessary to thermalize a unit length of the leader channel. Based on the theory of Gallimberti [19], it is assumed to be equal to 60 µC/m.
- (7)
- The negative streamers will charge the space leader with positive charge with a magnitude equal to . It is assumed that the positive streamer burst that follows the negative streamer burst will take this positive charge away from the space leader, making its charge equal to zero. The length of the positive streamer burst is assumed to be the same as the negative streamer burst. The extension of the positive space leader tip due to the energy dissipated by the positive streamer currents is also assumed to be . Since there is no source for the charges that are being deposited in the streamer channels created by the space leader, the discharge propagates as a bi-directional leader with a net zero charge. For example, the charge necessary for the propagation of positive streamers is provided by the negative streamers which remove negative charge from the space leader and leave behind positive charge that is being utilized in the creation of positive streamers. Thus, the charging of the space leader due to the removal of negative charge from the negative streamer burst will give rise to a burst of positive streamers. Assuming net zero charge on the space leader, the charge associated with the positive streamer burst, Qps, is assumed to be equal to Qns.
This completes one cycle of the numerical simulation. The time taken for this cycle is estimated by taking into consideration the length of the negative and positive streamer bursts from the space leader and dividing these distances respectively by the speed of negative and positive streamers. The experimental data obtained with high speed cameras shows that in virgin air fully developed positive streamers can propagate at speeds close to about 4 × 10⁶ m/s and that the speed of negative streamers is about four times less than the speed of positive streamers [15]. Since the streamers in streamer bursts associated with lightning are rather long, in the simulation we assume the positive and negative streamer speeds to be 4 × 10⁶ m/s and 106 m/s, respectively. Observe that positive streamers are propagating in over-voltage condition because they are moving in a region where the electric field is larger than the electric field necessary for stable positive streamer propagation. Their propagation is limited only by the charge made available by the negative streamers. Assuming that the positive streamers start after the negative streamers have reached their full length, i.e., when the positive charge accumulated in the space leader is maximum, the time necessary for this cycle of physical process, i.e., from one inception of negative streamer burst from the negative tip of the space leader to the next negative streamer inception, is given by
In the above equation, and are the lengths of negative and positive streamer bursts (i.e., distance to the crossing point of the two curves from the tip of the space leader in Figure 3), is the speed of negative streamers and is the speed of positive streamers. The cycle is repeated using the new space leader length as the initial value. The procedure continues until the space leader meets the tip of the negative stepped leader. When this happens, the stepped leader is assumed to extend to a distance equal to the length of the space leader. The time necessary for the development of the step once the space leader meets the stepped leader tip is neglected in calculating the speed of stepped leaders. The total time necessary for the initiation of the step is given by
In the above, n is the total number of cycles necessary for the space leader to reach the tip of the stepped leader, and is the time (as defined by Equation (2)) to complete the mth cycle.
Once the new step is formed, the streamer length associated with the new extension of the stepped leader is estimated as before, and the procedure is repeated again. It is important to mention here that the space leader is assumed to have a rather high conductivity in the simulation so that it can be considered as a good conductor in estimating the electric fields at its tips; these fields are necessary for calculating the length of streamer regions and the electric field through which the negative streamers from the space leader are propagating.
4. Results
The stepped leader charge distribution model, as developed by Cooray et al. [16]; see also [17,18], gives the distribution of the stepped leader charge as a function of the height of the stepped leader tip above ground. Thus, the electric field in front of the stepped leader channel when its tip is at a given height from ground level—a parameter necessary as an input to the stepped leader model—is evaluated using this model. Combining this with the stepped leader model, the step length, the step forming time, and the stepped leader speed were calculated as a function of the height of the stepped leader tip for several prospective return stroke currents. Before presenting these results, let us first consider the available information concerning the stepped leaders.
A significant amount of experimental data is available on the step length, stepping interval, and the average speed of stepped leaders. The data show that the length of the steps vary from 8.5 m to 200 m [1,2,20,21], the step intervals vary from 5 µs to 200 µs [1,2,20,21,22,23], and the average leader speeds vary from 0.8 × 10⁵ m/s to 1.5 × 10⁶ m/s [1,2,20,21,23,24]. Recent high-speed video measurements by Hill et al. [4] found an average step interval of 16.4 µs and average step length of 5.2 m for 82 steps. In the case of altitude-triggered lightning, Biagi et al. [3] found the step lengths to be 5 m to 8 m in length. The time interval between steps can also be obtained by measuring the time intervals between the leader pulses in electric field records. The leader pulse intervals immediately preceding the return stroke, which means when the stepped leader is close to the ground, varied between about 15 µs and 3 µs [3,25].
A statistically significant study on the speed of stepped leaders was conducted recently by Campos et al. [26]. They found average speeds of 3.4 × 10⁵ m/s and 1.87 × 10⁵ m/s at two sites, one in Southern Brazil and the other in Arizona. The maximum and minimum speeds observed were 0.9 × 10⁵ m/s and 1.98 × 10⁶ m/s. They also found that about 42% of the leaders showed increasing speed as the leader extends and 49% showed irregular behavior. Only 9% showed a decrease in speed with increasing leader length. Campos et al. [26] also analyzed how the leader speed is related to the return increasing peak current. Even though there is some scatter in the data, there was a clear indication that the leader speeds increase with increasing peak current.
In the calculations to be presented, results are obtained for four prospective return stroke currents with peaks 15 kA, 30 kA, 45 kA, and 60 kA. In the simulation, step lengths are calculated for stepped leader lengths from 2.0 km (or 2.5 km) to 4.75 km. The total length of the stepped leader channel selected in the calculation is 5 km. Moreover, the calculations were conducted for three values of negative streamer speeds, namely, 0.5 × 10⁶ m/s, 106 m/s, and 2 × 10⁶ m/s. Furthermore, two sets of calculations were conducted: one for the negative streamer potential gradient of 106 V/m, and the other for 2 × 10⁶ V/m. Let us consider the results obtained for leader step length, stepping time, and the speed of the leader separately.
4.1. Step Length
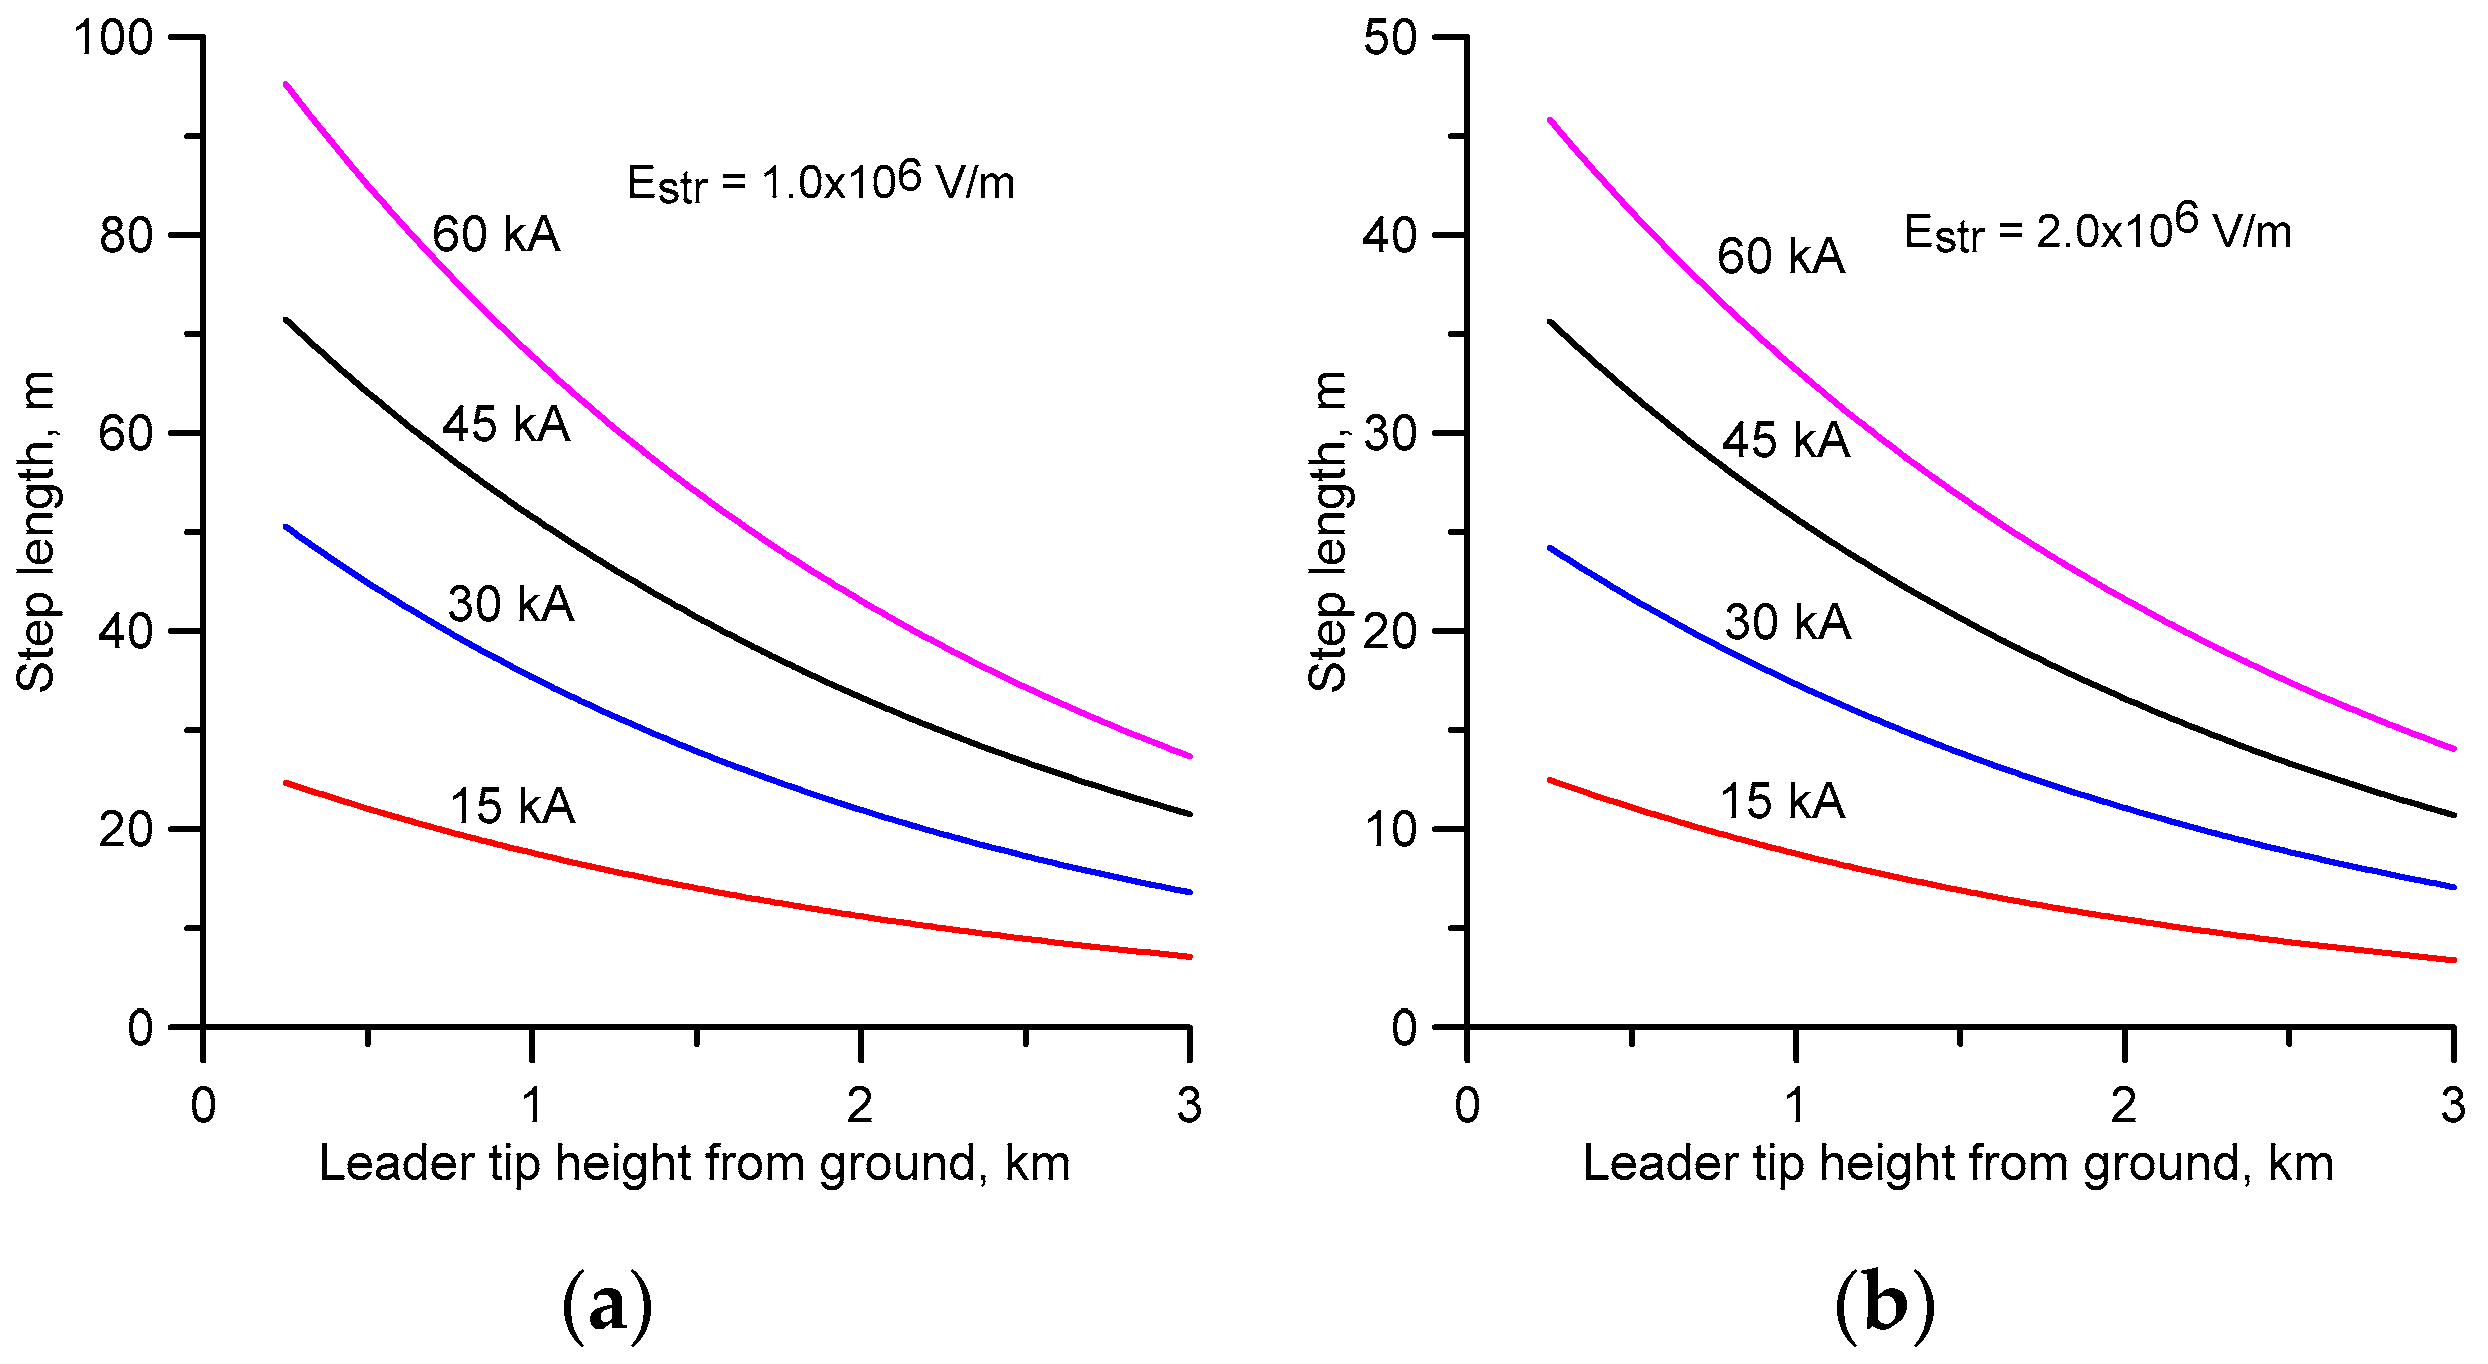
The results of the calculation show that the step length is independent of the speed of negative streamers. It is only controlled by the streamer potential gradient. This one can understand because the streamer potential gradient decides the length of the streamer region and this is directly related to the step length. On the other hand, the streamer speed controls the time necessary for the formation of the step. The average step length as a function of peak current is shown in Figure 4a for Estr = 106 V/m and Figure 4b for Estr = 2 × 10⁶ V/m. Several interesting observations can be made from the data presented in these figures. The first observation is that the step length increases with increasing peak current. The reason for increasing step length with increasing peak current can be understood when one notices that the length of the streamer region ahead of the stepped leader channel increases with increasing prospective return stroke current. The second observation is that the step length increases as the stepped leader approaches the ground. This is caused by the increase in charge density at the leader tip as it approaches the ground. The third observation is that, for a given current, the step length decreases as the potential gradient of the streamer increases. As mentioned previously, this is caused by the decrease in streamer length with increasing streamer potential gradient.
4.2. Step Forming Time
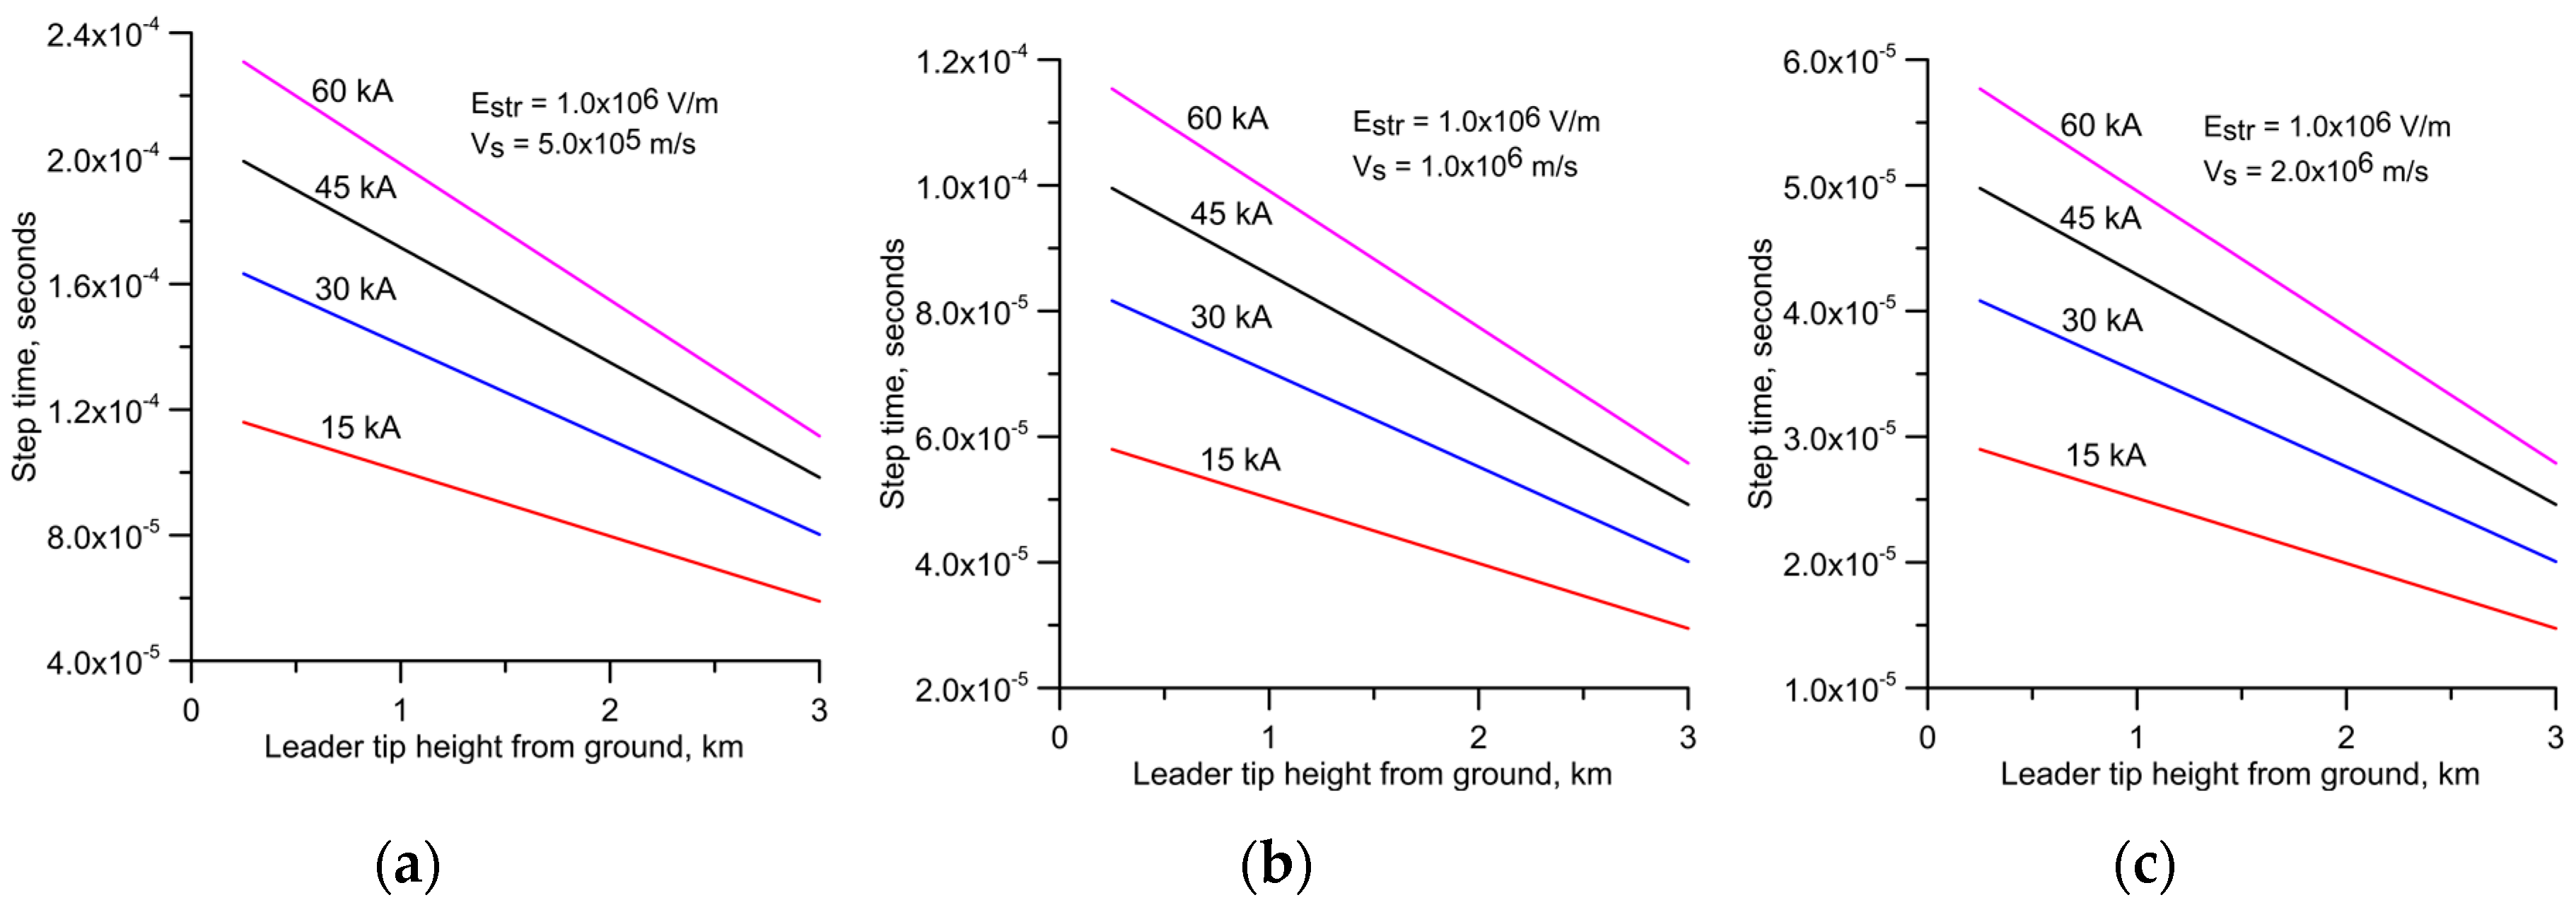
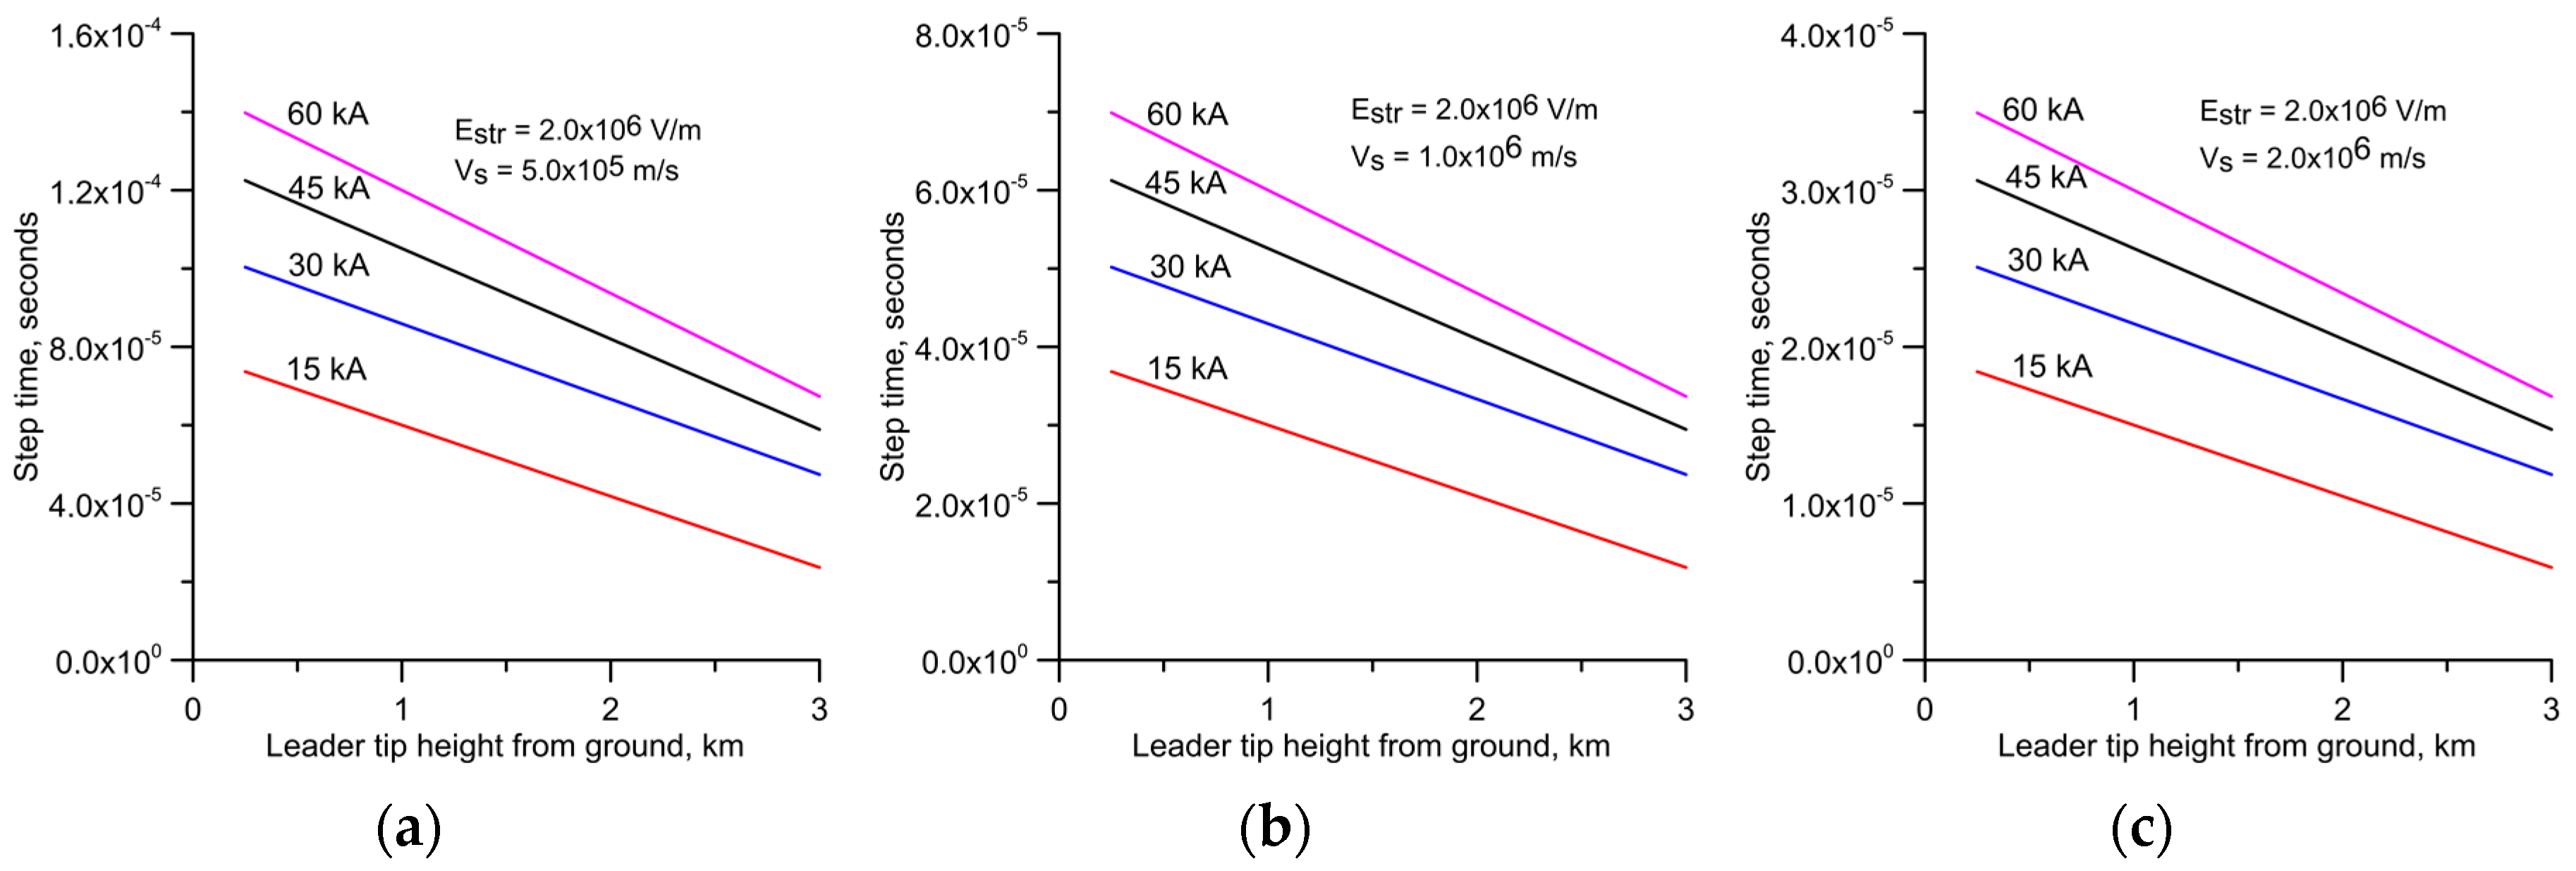
Results show that the step forming time is affected by the prospective return stroke peak current, speed of negative streamer, and the potential gradient of the negative streamers. For this reason, in addition to the calculations conducted with two negative streamer potential gradients, calculations are also conducted for three negative streamer speeds. The results are presented in Figure 5 and Figure 6. Observe that the step forming time depends on the prospective return stroke peak current, and the potential gradient and speed of the negative streamers. As mentioned earlier, the time it takes to make a step depends on several events. First, it depends on the time it takes for the negative streamers issued from the new leader tip to reach their full length where the formation of the space leader takes place. Once the space leader is formed, depending on the field configuration and the distance to the tip of the stepped leader, it requires several bursts of negative streamers before the space leader can reach the tip of the stepped leader. During each burst, a negative streamer travels from the tip of the space leader to a point where it expends all the potential difference available for its propagation. This propagation of the negative streamers also requires some time depending on their speed. The time necessary for the formation of a step is given by the sum of these times. The step time increases with increasing peak current because the length of the streamer region increases with increasing charge on the leader channel. For the same reason, the step forming time increases as.
The leader approaches the ground. However, for a given height and current, this time decreases with increasing streamer potential gradient and it increases with decreasing streamer speeds. It decreases with increasing potential gradient because the length of the streamers and, hence, the time necessary for the streamers of a given speed to reach their final destination decreases with increasing potential gradient. This time decreases with increasing streamer speed because this will reduce the travel time of the streamers.
4.3. Stepped Leader Speed
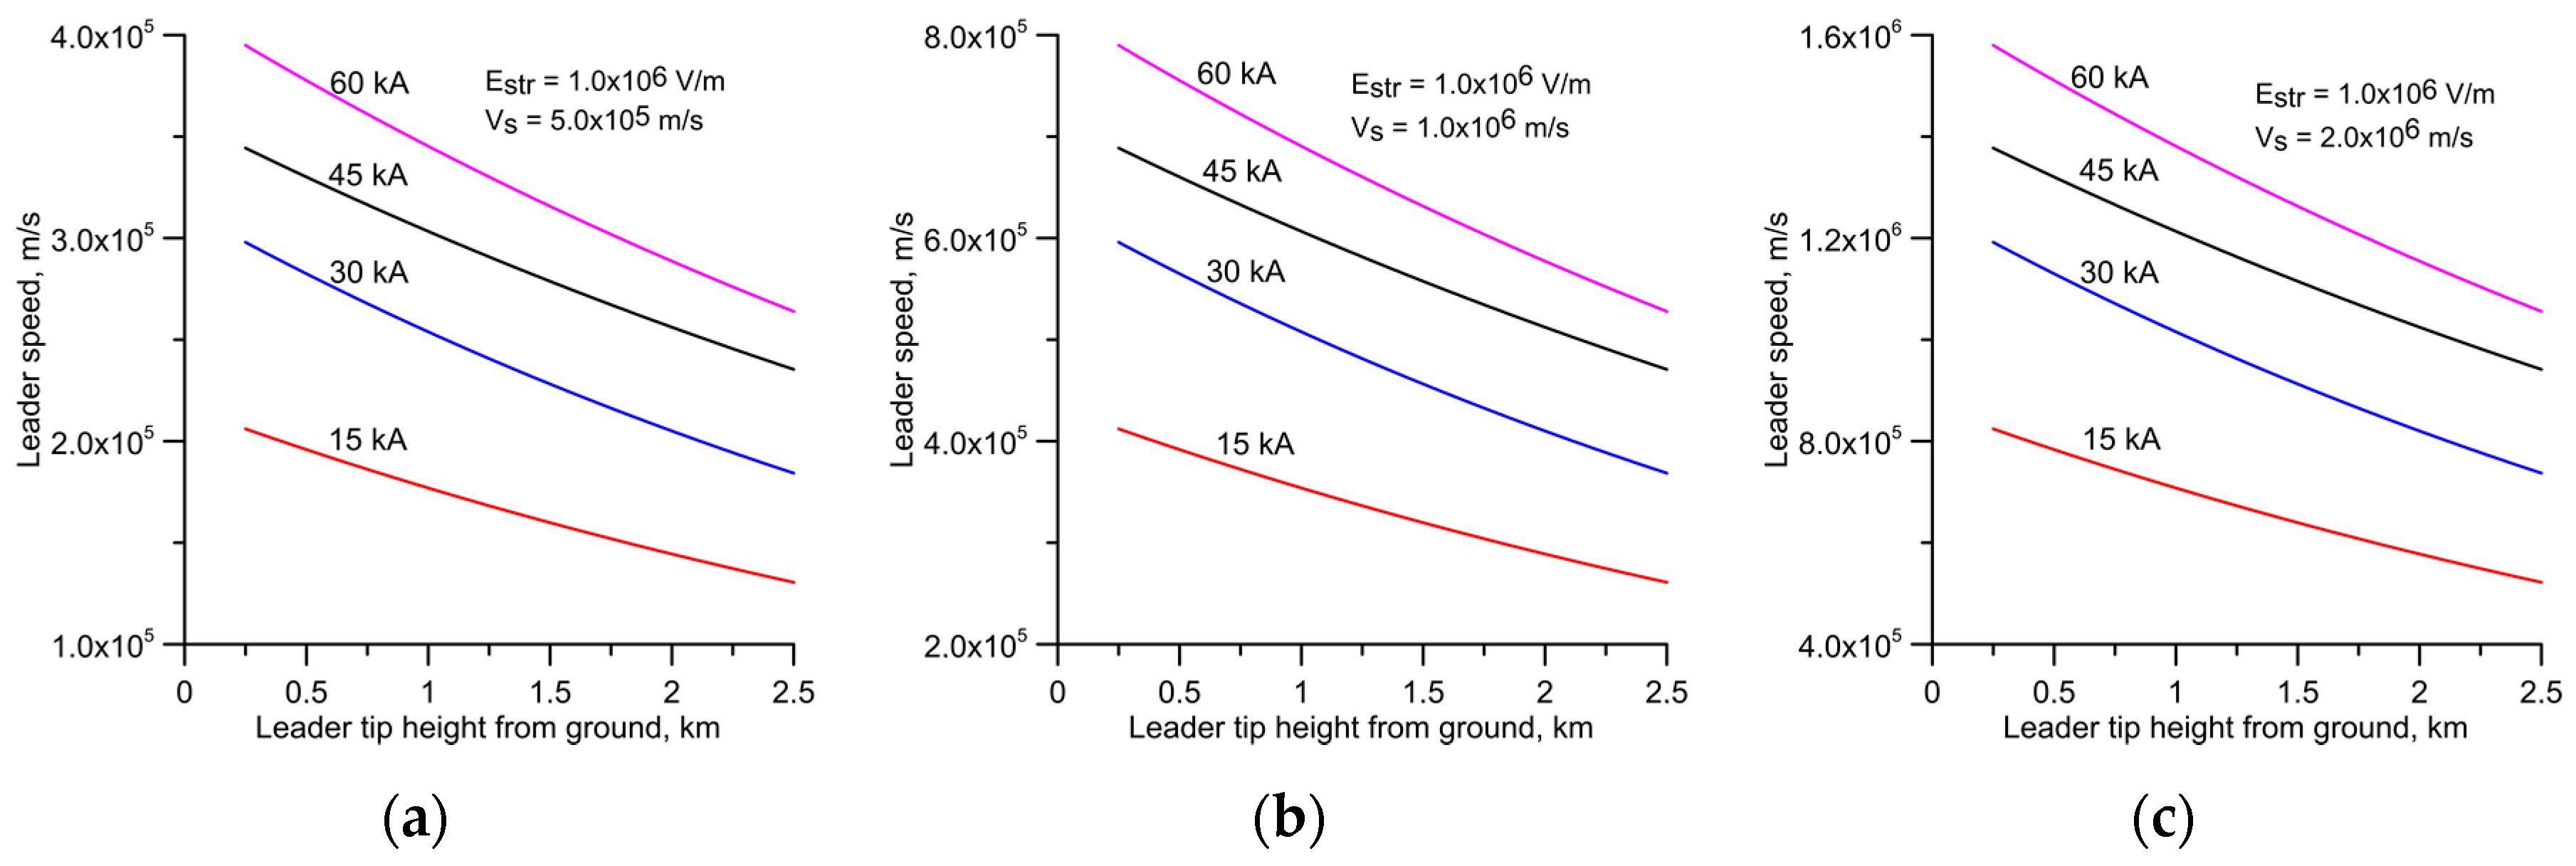
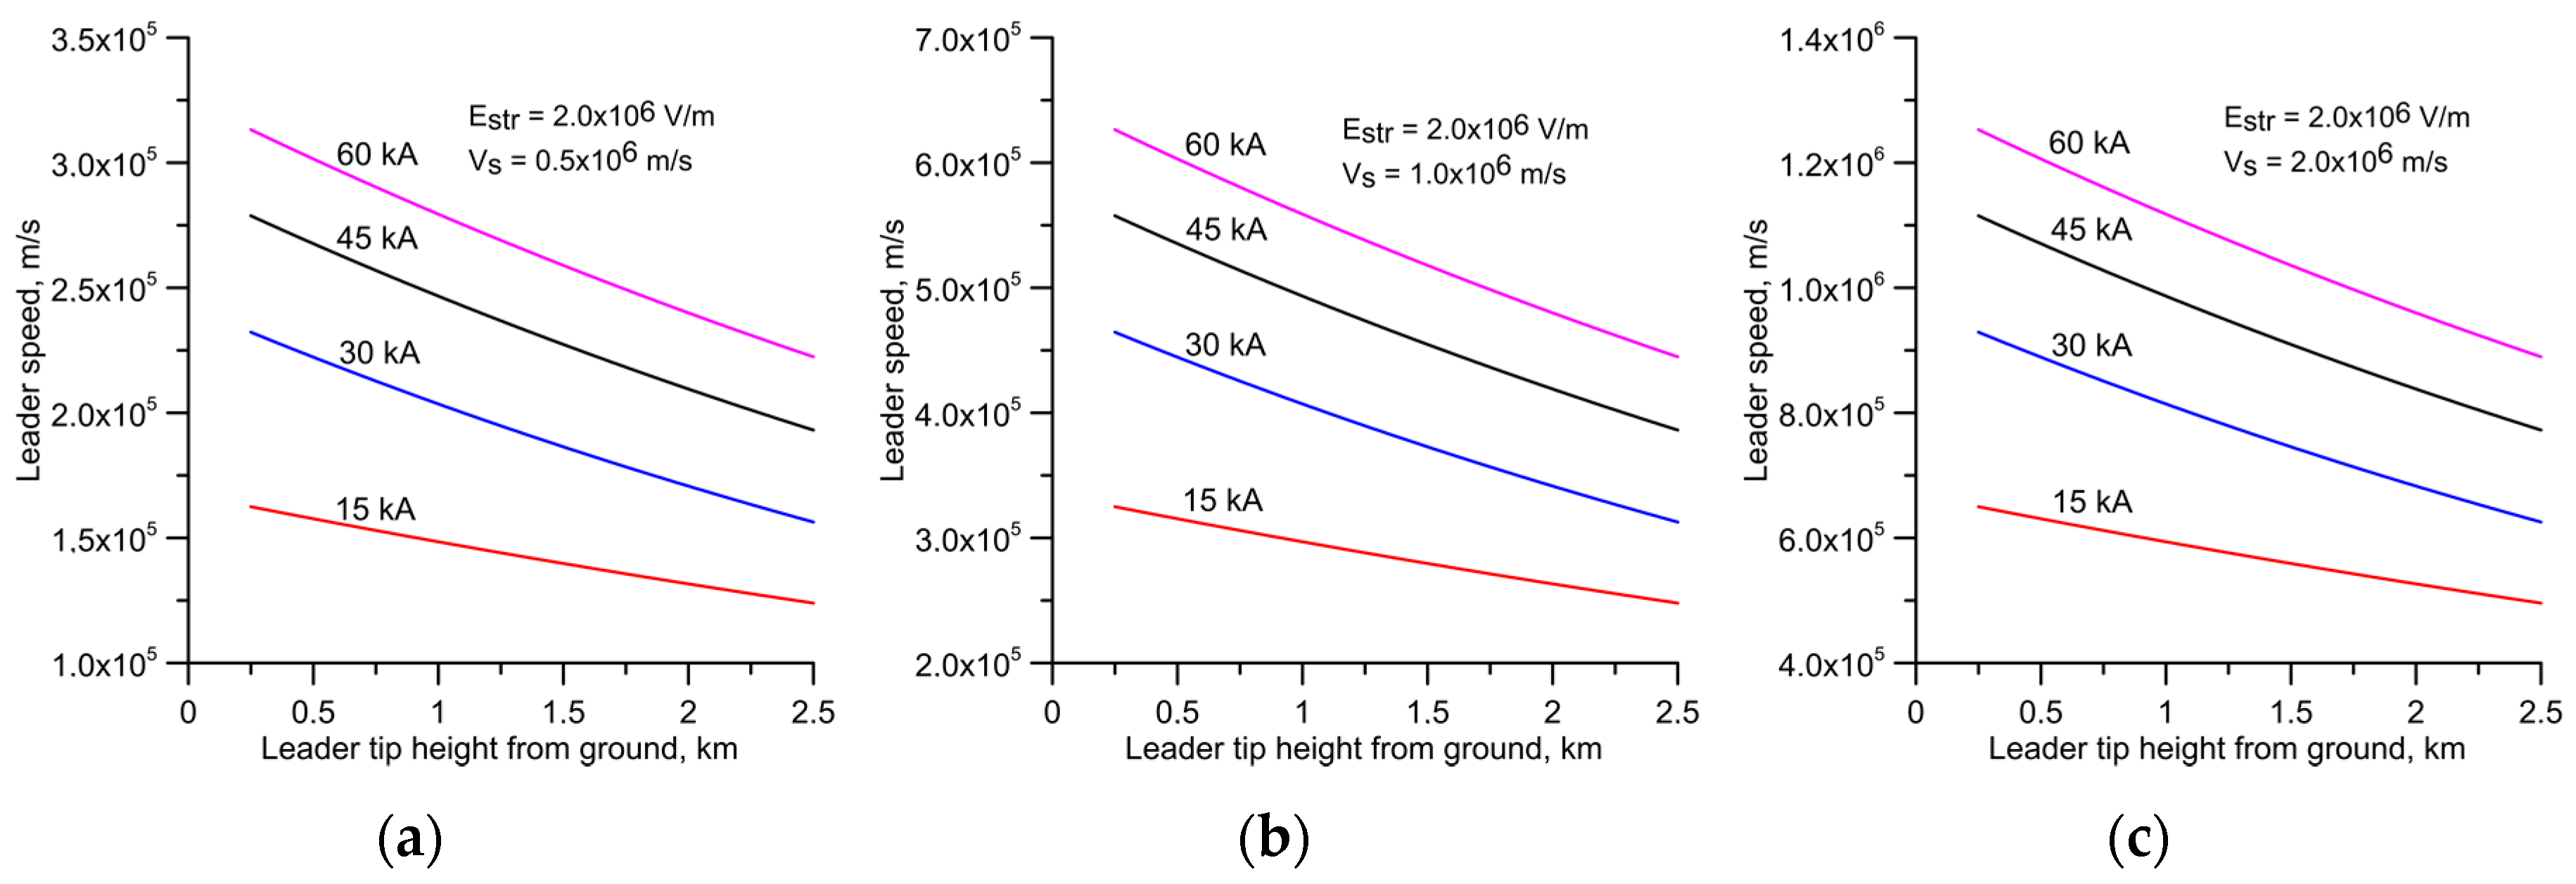
The speed of propagation of the stepped leaders as a function of the height of the stepped leader tip from ground level for four different prospective return stroke currents and for different streamer parameters are shown in Figure 7 and Figure 8. First, observe that the leader speed increases as the stepped leader nears the ground. For a given height, the leader speed increases with increasing peak current, increasing streamer speed, and decreasing streamer potential gradient. The leader speed is controlled both by the step length and the time necessary for the formation of the step; it increases with increasing streamer speed because the latter will reduce the time of formation for a given step length.
However, it is the change in step length that influences the leader speed more than the time of formation. This is the reason why the parameters that increase the step length, i.e., larger peak current and lower potential gradient, lead to larger leader speeds. The data presented in Figure 7 and Figure 8 gives the instantaneous speed at a given level. What is usually being measured is the average speed. In order to generate data that can be compared directly with experimental data, the average speed over the last two kilometres is estimated and its value is tabulated in Table 1. Observe again that the average speed increases with increasing peak current, increasing streamer speed, and decreasing potential gradient. This result is in agreement with the results presented by Zhu et al. [27], in which it was found that negative lightning flashes with faster stepped leaders tend to have higher first return stroke peak currents.
5. Discussion
For prospective return stroke currents in the range of 15 kA to 60 kA and for different possible streamer parameters, the calculated step lengths are distributed over the range of 5 m to 100 m, the step forming times are distributed over the range of 10 µs to about 200 µs, and the leader speeds are distributed over the range of 105 m/s to about 1.6 × 10⁶ m/s. This shows, given the possibility of varying parameters, that the calculations produce results in the same ballpark as the measurements. According to the results presented in Figure 7 and Figure 8, the leader speed increases as the leader approaches the ground. However, in experimental data, only about 42% of the leaders show such a tendency. One possible reason for this discrepancy is the following. In the calculations, we assume that the leader charge increases continuously as the stepped leader approaches the ground. This is correct if we consider a straight vertical stepped leader. However, in the presence of branches, the electric field configuration could be very complex and it is possible that (especially in the vicinity of the branches) there is a certain amount of screening; this may cause some form of modulation of the leader charge distribution, and this, in turn, can cause the speed to increase in some regions and decrease in other regions. This complex behavior is actually observed in 46% of the stepped leaders. If we consider the average stepped leader speed observed over the last 2000 m or so in the study conducted by Campos et al. [26], the observed value is about 3 × 10⁵ m/s. This shows that, within the confines of the present leader model, the best parameters that approximate the experimental data are 1.0 × 10⁶ m/s for the negative streamer speed and 2.0 × 10⁶ V/m for the negative streamer potential gradient.
The leader step length is controlled by the charge on the stepped leader and if the charge is modulated along the channel, it will also modulate the length of the leader steps. For the parameters mentioned above, the leader step length close to ground for a typical first return stroke current is in the order of about 20 m; this agrees to some extent with the results presented by Berger [2]. For the parameters mentioned earlier, the stepping time close to ground is about 50 µs, it decreases with increasing height. This value, too, is in reasonable agreement with the experimental data of Berger [2]. Unfortunately, almost all the studies do not give the prospective return stroke peak current, and, for this reason, a direct comparison is impossible in the present study. The study also shows that the leader speed increases with increasing peak current and this tendency is also observed in the experimental data of Campos et al. [26] and Zhu et al. [27].
Let us now consider some of the assumptions made in the stepped leader model. In constructing the model, we have made several assumptions. In the model, we assume that the space leader is created at the very edge of the streamer region and that only one such leader is created. It is possible that the space leader is created when the negative streamer charge reaches a certain critical value, and this may occur before the streamers travel the full length. If this is the case, then both the calculated step lengths and step times will decrease because the origin of the space leader takes place closer to the leader tip than assumed in the model.
In the model, it is assumed that only one space leader is created, but, in reality, several space leaders could be created. In this case, the leader may produce two branches. Thus, the results are valid for the stepped leaders away from the branch points. This is also the case (as mentioned before) in which, close to the branch points, the screening of the channels from each other may reduce the charge on the leader.
In the model, without making any significance difference to the results, one can neglect the time necessary for the propagation of the positive streamers. Experimental data show that, even in virgin air under identical conditions, the negative streamers have about 25% of the speed of positive streamers. If we assume the positive streamers to be four times faster than the negatives, the results would be changed only marginally if the propagation times of the positive streamers are neglected. However, in the present situation they are moving in regions of opposite charge density and in fields which are much larger than their stability fields. Thus, the assumption that the positive streamers move very fast compared with the negative streamers, and that the time necessary for their propagation is consequently much smaller than the time taken by negative streamers, is probably justified.
In the calculation, we have assumed that the space leader channel has a fixed radius and that it can be treated as a good conductor. Even though it will increase the complexity of the model and the computation time, it can be corrected. For example, the theory of Gallimberti [19] shows how the leader radius increases as a function of the energy input to the leader and how the leader potential will decrease with time as the current passing through it increases. This theory can be applied to the space leader to consider the variation of the leader potential and the radius. The introduction of this concept into the model is under investigation.
In the model, we have assumed that the extension of the space leader occurs almost instantaneously as the streamers extend to their extreme limits. However, the sections of the space leader are created by heating the streamer stems, and the time that this heating process may take is assumed in the simulation to be comparable to the time necessary for the extension of the streamers.
In the model, it is assumed that negative streamers will be emitted first from the negative end of the space leader and, when the negative streamers extend to their maximum length (i.e., when the charge accumulated in the space leader is maximum) positive streamers will be emitted. In reality, it is possible that the emissions of negative and positive streamers occur almost simultaneously. If they occur simultaneously, the total time necessary for the formation of a step is given by the time necessary for the propagation of negative streamers alone. In this case, the step formation time may be reduced by about 25% or less. Of course, more experimental data on step formation obtained using high-speed cameras may provide more information to improve this aspect of the model.
In estimating the time necessary for the formation of a leader step, we have neglected the time involved with the propagation of the luminous front along the newly created leader step once the space leader has made contact with the tip of the stepped leader. This high current and bright phase of the step formation that occurs at the instant when the contact is established between the space leader and the stepped leader may sweep the newly created step at a speed close to or above 107 m/s [28]. For a 10 m step, this time is about 1 µs, which could be neglected with respect to the overall time necessary for the formation of a step.
In the model, we start the simulation at the instant of negative streamer emission from the space leader. However, given the lower threshold for positive streamer emission, it is probably the positive streamers that are generated first from the space stem. In the simulations, we do not consider these initial stages where the space stem is converted to a space leader. In the simulations, we assume that there is an existing space leader and start the simulation with the origin of the negative streamers from the space leader.
In the model, it is also assumed that the length of the positive streamers (assumed comparable to that of the negative streamers) is limited by the positive charge accumulated in the space leader by the emission of negative streamers. However, it is important to point out that, since the positive streamers are propagating in an electric field which is larger than the critical electric field necessary for their propagation, once initiated, they can continue to propagate in the background electric field without any connection to the point of initiation. Of course, the situation is somewhat different here because the positive streamers are propagating in a region filled with negative space charge (i.e., the space charge deposited by the negative streamers of the stepped leader). In this case, it is possible that the charge on the positive streamers is neutralized rapidly by the negative space charge and, as a consequence, the extension of the positive streamers inside the negative space charge layer is limited. Again, more information concerning the propagation of positive streamers inside a negative space charge volumes is needed to improve this assumption of the model.
Finally, it is important to mention here that in a more rigorous model of a stepped leader, in addition to improving the assumptions already made in developing the model, it is necessary to include the interplay between more uniform ionization waves as compared with a system of relatively isolated streamers, the role of the current flow into the negative leader channel from the system of positive streamers developing in the negative charge region, and possible changes in the leader field as the space leader extends inside the negative streamer zone of the stepped leader, as well as possible violations of the electrostatic assumptions either due to short time scales or to the limited conductivity of the newly created sections of the space leader.
6. Conclusions
A model developed based on the mechanism observed for the formation of negative leader steps in the laboratory discharges is shown to be capable of generating the length of the steps, the step forming time, and the speed of the lightning stepped leader as a function of prospective return stroke peak current. Both the step length and the average speed increase with increasing prospective return stroke current. The model also predicts that the stepped leader speed will increase as it approaches the ground. The results depends on the negative streamer speeds and negative streamer potential gradients assumed in the model. The best results are obtained when the negative streamer gradient is 2 × 10⁶ V/m and the negative streamer speed is about 106 m/s. Under these assumptions, the model predicts that a stepped leader with a 30 kA prospective return stroke current may produce steps of about 15–20 m in length close to ground and its average speed of propagation will be about 5 × 10⁵ m/s. The ranges of step lengths, step times, and leader speeds obtained from the stepped leader model developed in this paper agree reasonably well with the step lengths, step forming times and stepped leader speeds observed in experimental investigations.
Acknowledgments
This work was supported by the Swedish Research Council grant VR-2015-05026 and partly by the fund from the B. John F. and Svea Andersson donation at Uppsala University.
Author Contributions
Vernon Cooray came up with the idea, developed the model, performed the calculations and wrote the manuscript. L. Arevalo contributed to the discussion of the theory.
Conflicts of Interest
The authors declare no conflict of interest.
References
- Schonland, B.F.J.; Malan, D.J.; Collens, H. Progressive lightning II. Proc. R. Soc. A Math. Phy. 1935, 152, 595–625. [Google Scholar] [CrossRef]
- Berger, I. Novel observations on lightning discharges: Results of research on Mount San Salvatore. J. Frankl. Inst. 1967, 283, 478–525. [Google Scholar] [CrossRef]
- Biagi, C.J.; Uman, M.A.; Hill, J.D.; Jordan, D.M.; Rakov, V.A.; Dwyer, J. Observations of stepping mechanisms in a rocket-and-wire triggered lightning flash. J. Geophys. Res. Atmos. 2010, 115, D23215. [Google Scholar] [CrossRef]
- Hill, J.D.; Uman, M.A.; Jordan, D.M. High-speed video observations of a lightning stepped leader. J. Geophys. Res. Atoms. 2011, 116, D16117. [Google Scholar] [CrossRef]
- Les Renardières Group. Negative discharges in long air gaps at les Renardieres, 1978 results. Electra 1981, 74, 67–216. [Google Scholar]
- Castellani, A.; Bondiou, A.; Lalande, P.; Bonamy, A.; Gallimberti, I. Laboratory study of the bi-leader process from an electrically floating conductor Part 2: Bileader properties. IEE Proc. Sci. Meas. Technol. 1998, 145. [Google Scholar] [CrossRef]
- Bacchiega, G.L.; Gazzani, A.; Bernardi, M.; Gallimberti, I.; Bondiou, A. Theoretical modelling of the laboratory negative stepped leader. In Proceedings of the 1994 International Aerospace and Ground Conference on Lightning and Static Electricity, Mannheim, Germany, 24–27 May 1994. [Google Scholar]
- Lalande, P.; Bondiou-Clergerie, A.; Bacchiega, G.; Gallimberti, I. Observations and modeling of lightning leaders. C. R. Phys. 2002, 3, 1375–1392. [Google Scholar] [CrossRef]
- Mazur, V.; Ruhnke, L.; Boundiou-Clergerie, A.; Lalande, P. Computer simulation of a downward negative stepped leader and its interaction with ground structures. J. Geophys. Res. Atmos. 2000, 105, 361–369. [Google Scholar] [CrossRef]
- Arevalo, L.; Cooray, V. Preliminary study on the modelling of negative leader discharges. J. Phys. D Appl. Phys. 2011, 44, 315204. [Google Scholar] [CrossRef]
- Beroual, A.; Rakotonandrasana, J.; Fofana, I. Predictive dynamic model of the negative lightning discharge based on the similarity with long laboratory sparks. Part 1: Physical process and modeling. IEEE Trans. Dielectr. Electr. Insul. 2010, 17, 1551–1561. [Google Scholar] [CrossRef]
- Dellera, L.; Garbagnati, E. Lightning stroke simulation by means of the leader progression model. Part I: Description of the model and evaluation of free-standing structures. IEEE Trans. Power Deliv. 1990, 5, 2009–2022. [Google Scholar] [CrossRef]
- Rizk, F. Modeling of lightning incidence to tall structures. Part I: Theory. IEEE Trans. Power Deliv. 1994, 9, 162–171. [Google Scholar] [CrossRef]
- Becerra, M.; Cooray, V. A self consistent upward leader propagation model. J. Phys. D Appl. Phys. 2006, 39, 3708–3715. [Google Scholar] [CrossRef]
- Kochkin, P.; Lehtinen, N.; van Deursen, A.P.J.; Østgaard, N. Pilot system development in metre-scale laboratory discharge. J. Phys. D Appl. Phys. 2016, 49, 425203. [Google Scholar] [CrossRef]
- Cooray, V.; Rakov, V.; Theethayi, N. The lightning striking distance—Revisited. J. Electrost. 2007, 65, 296–306. [Google Scholar] [CrossRef]
- Cooray, V. Introduction to Lightning; Springer: London, UK, 2015. [Google Scholar]
- He, J.L. Evaluation of Lightning Shielding Analysis Method for EHV and UHV DC and AC Transmission Lines, CIGRE Working Group Brochure WG C4.26, 2017. Available online: https://e-cigre.org/publication/704-evaluation-of-lightning-shielding-analysis-methods-for-ehv-and-uhv-dc-and-ac-transmission-lines (accessed on 6 December 2017).
- Gallimberti, I. The mechanism of long spark formation. J. Phys. Colloq. 1979, 40, 193–249. [Google Scholar] [CrossRef]
- Schonland, B.F.J. The lightning discharge. Handb. Phys. 1956, 22, 576–628. [Google Scholar]
- Chen, M.; Takagi, N.; Watanabe, T.; Wang, D.; Kawasaki, Z.I.; Liu, X. Spatial and temporal properties of optical radiation produced by stepped leaders. J. Geophys. Res. Atmos. 1999, 104, 27573–27584. [Google Scholar] [CrossRef]
- Krider, E.P. The relative light intensity produced by a lightning stepped leader. J. Geophys. Res. Atmos. 1974, 79, 4542–4544. [Google Scholar] [CrossRef]
- Lu, W.; Wang, D.; Takagi, N.; Rakov, V.; Uman, M.; Miki, M. Characteristics of the optical pulses associated with a downward branched stepped leader. J. Geophys. Res. Atmos. 2008, 113, D21206. [Google Scholar] [CrossRef]
- Orville, R.E.; Idone, V.P. Lightning leader characteristics in the Thunderstorm Research International Program (TRIP). J. Geophys. Res. Atmos. 1982, 87, 11177–11192. [Google Scholar] [CrossRef]
- Cooray, V.; Lundquist, S. Characteristics of the radiation fields from lightning in Sri Lanka in the tropics. J. Geophys. Res. Atmos. 1985, 90, 6099–6109. [Google Scholar] [CrossRef]
- Campos, L.Z.S.; Saba, M.M.F.; Warner, T.A.; Pinto, O., Jr.; Krider, E.P.; Orville, R.E. High speed video observations of natural cloud to-ground lightning leaders—A statistical analysis. Atmos. Res. 2014, 135–136, 285–305. [Google Scholar] [CrossRef]
- Zhu, Y.; Rakov, V.A.; Tran, M.D. A study of preliminary breakdown and return stroke processes in high-intensity negative lightning discharges. Atmosphere 2016, 7, 130. [Google Scholar] [CrossRef]
- Wang, D.; Takagi, N.; Uman, M.A.; Jordan, D.M. Luminosity progression in dart-stepped leader step formation. J. Geophys. Res. Atmos. 2016, 121, 612–614. [Google Scholar] [CrossRef]
Figure 1.
The formation of a leader step as observed in the negative leader of altitude-triggered lightning. The lower set of diagrams show the upper set with enhanced contrast. Observe the high-luminosity region located ahead of the leader tip in the lower left diagram which is probably the space leader. The lower right diagram shows the newly formed leader step together with the streamers that emanated from the tip of the leader. Adapted from Hill et al. [4].

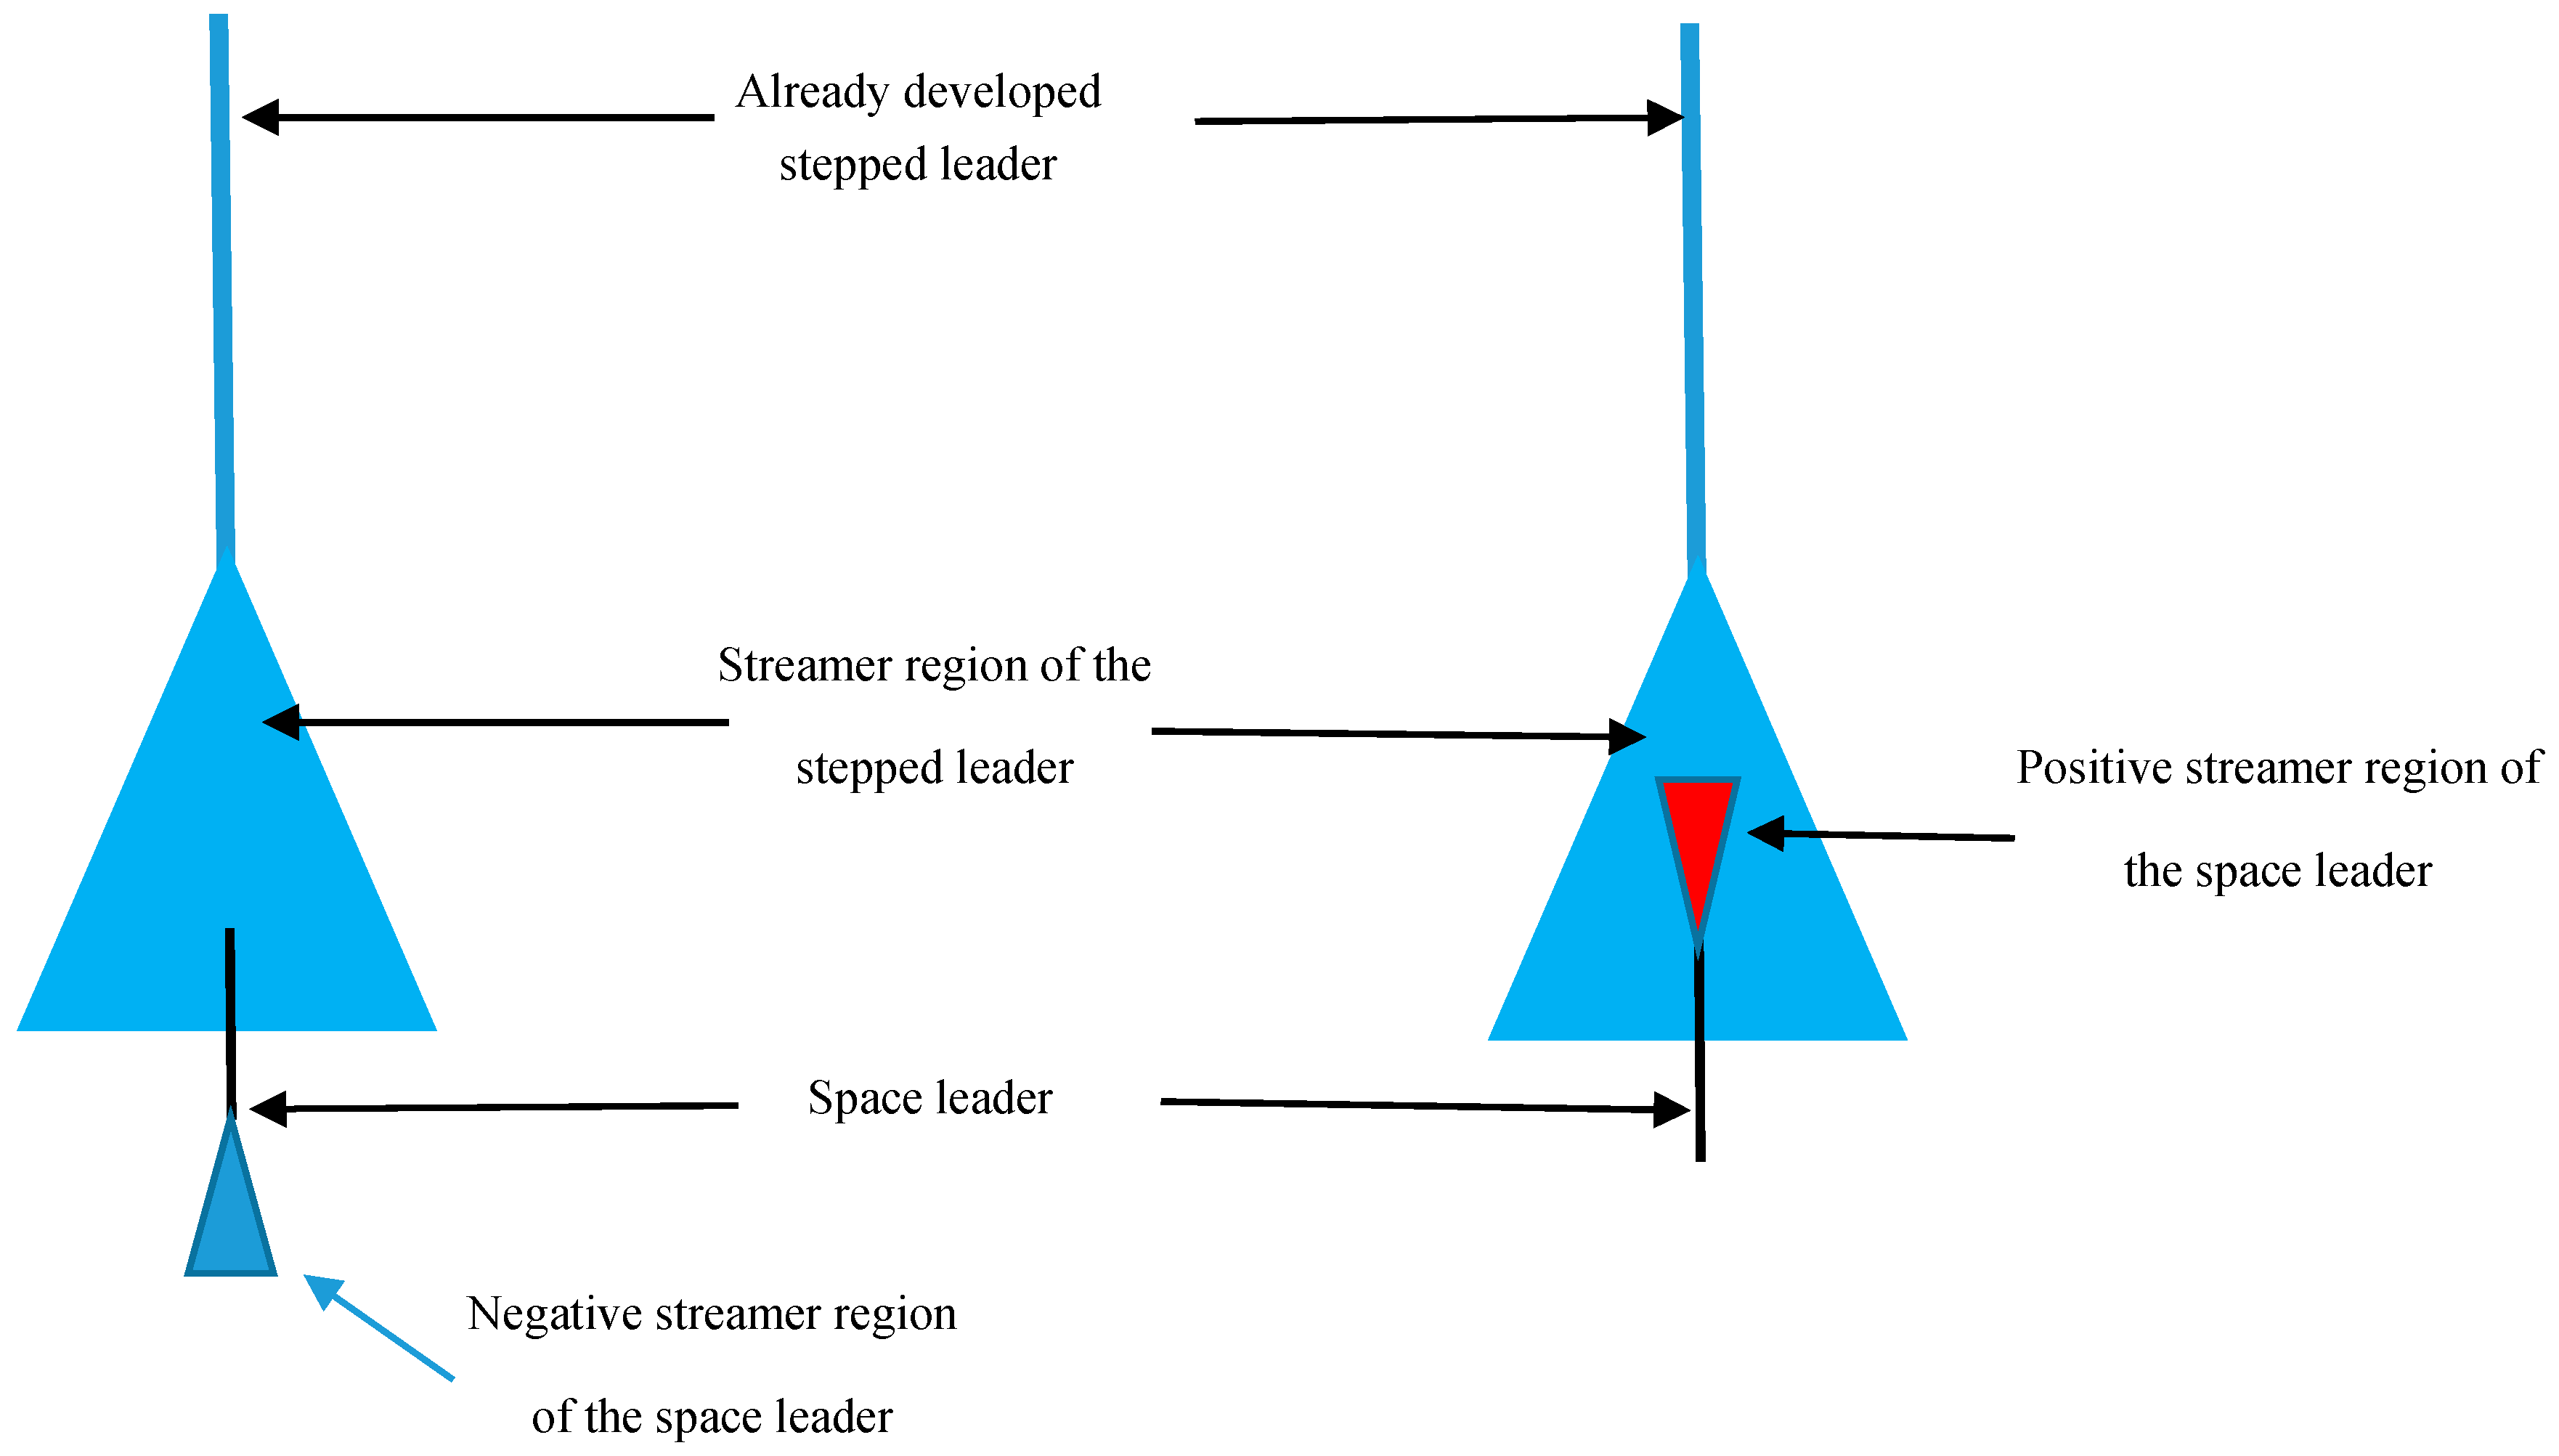
Figure 2.
Two stages of the simulation. First, the emission of negative streamers from the space leader takes place. This will charge the space leader positively. This results in the extension of and emission of positive streamers from the space leader.
Figure 2.
Two stages of the simulation. First, the emission of negative streamers from the space leader takes place. This will charge the space leader positively. This results in the extension of and emission of positive streamers from the space leader.

Figure 3.
Distance–Voltage diagram that illustrates how the charge associated with a streamer burst is obtained. The area between the two curves representing the background potential and the streamer potential is marked A.
Figure 3.
Distance–Voltage diagram that illustrates how the charge associated with a streamer burst is obtained. The area between the two curves representing the background potential and the streamer potential is marked A.
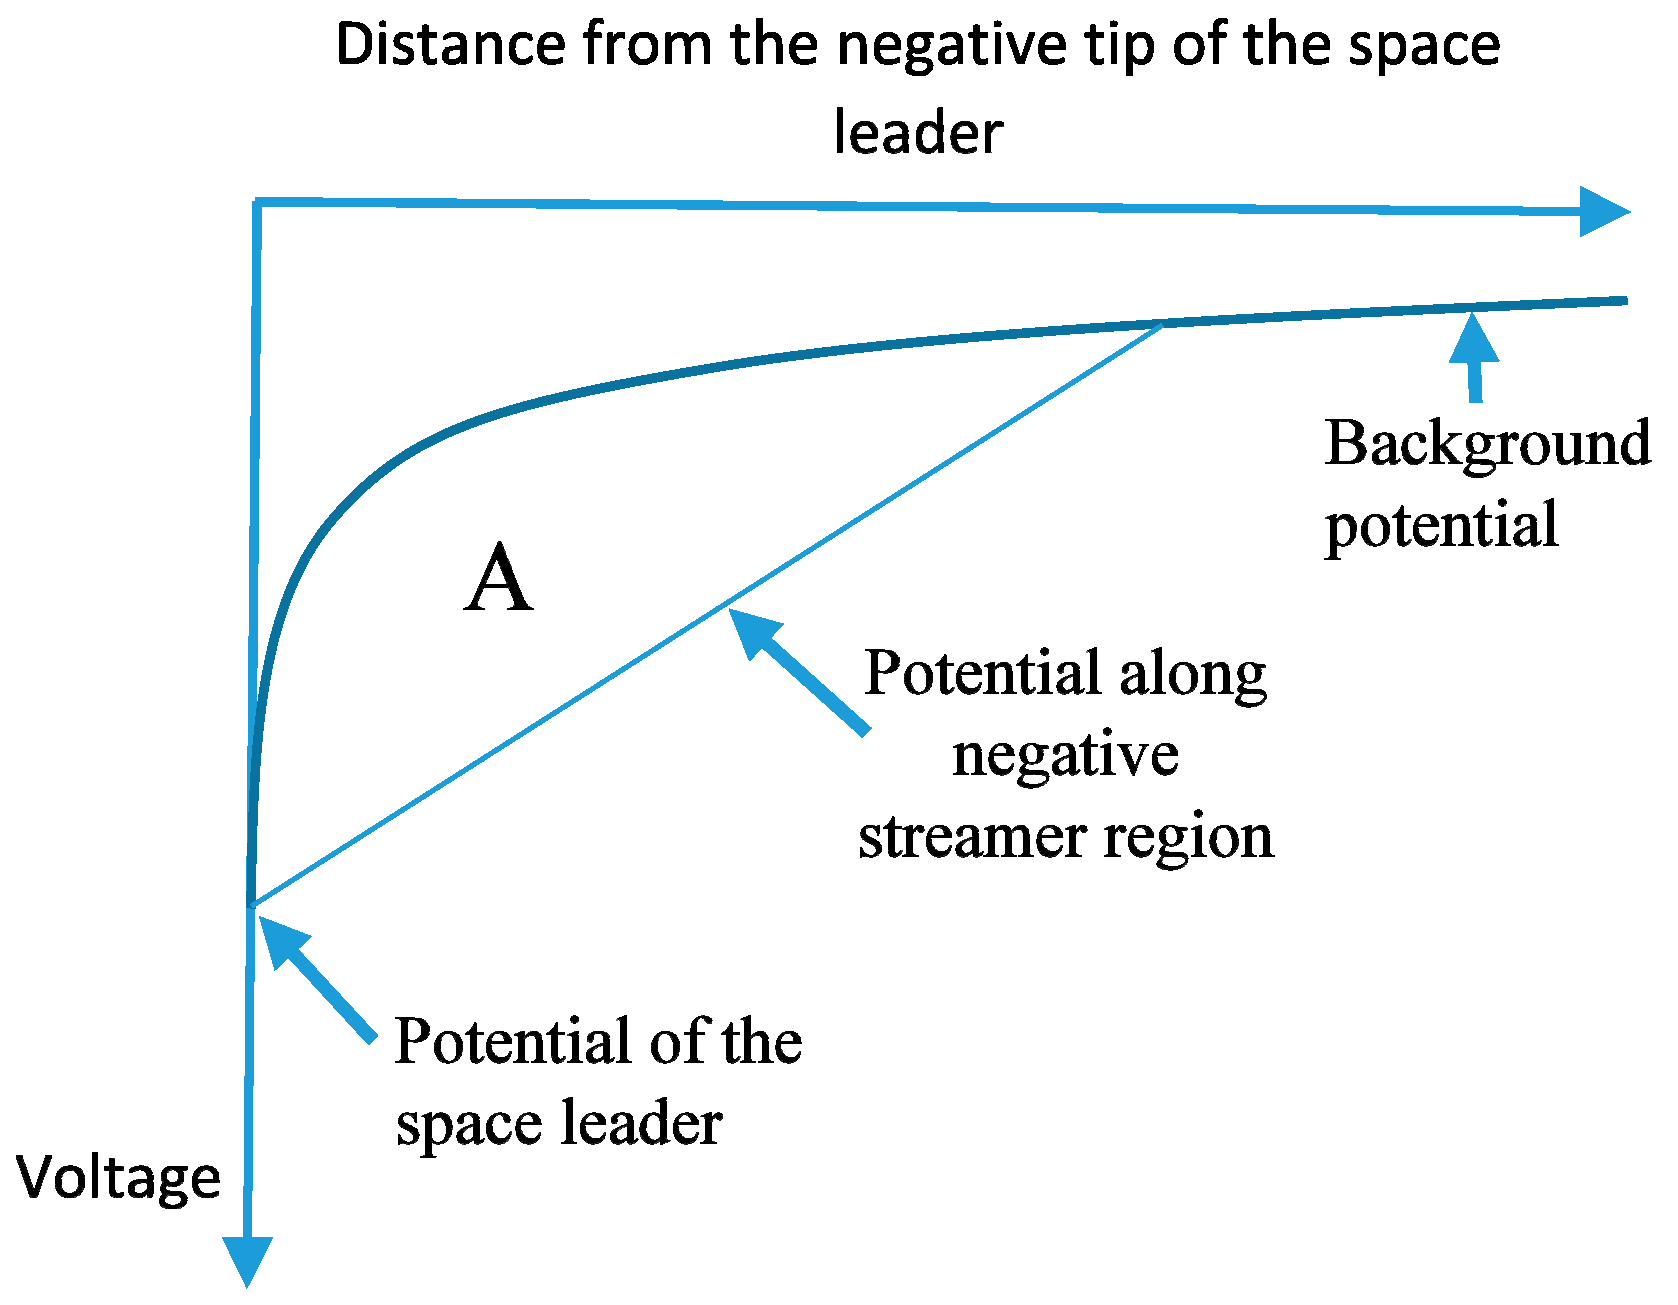
Figure 4.
Step length as a function of the height of the leader tip for four different current peaks. (1) 60 kA, (2) 45 kA, (3) 30 kA, and (4) 15 kA. Results are shown for two negative streamer potential gradients, namely, (a) Estr = 106 V/m and (b) Estr = 2 × 10⁶ V/m.
Figure 4.
Step length as a function of the height of the leader tip for four different current peaks. (1) 60 kA, (2) 45 kA, (3) 30 kA, and (4) 15 kA. Results are shown for two negative streamer potential gradients, namely, (a) Estr = 106 V/m and (b) Estr = 2 × 10⁶ V/m.

Figure 5.
Step forming time as a function of leader tip height from ground level for four different prospective return stroke currents. (1) 60 kA; (2) 45 kA; (3) 30 kA; and (4) 15 kA. Results are shown for three different negative streamer speeds, Vs, namely, (a) 0.5 × 10⁶ m/s; (b) 1.0 × 10⁶ m/s; and (c) 2.0 × 10⁶ m/s. Calculations are for Estr = 106 V/m.

Figure 6.
Step forming time as a function of leader tip height from ground level for four different prospective return stroke currents. (1) 60 kA; (2) 45 kA; (3) 30 kA; and (4) 15 kA. Results are shown for three different negative streamer speeds, Vs, namely, (a) 0.5 × 10⁶ m/s; (b) 1.0 × 10⁶ m/s; and (c) 2.0 × 10⁶ m/s. Calculations are for Estr = 2 × 10⁶ V/m.

Figure 7.
Leader speed as a function of leader tip height from ground level for four different prospective return stroke currents. (1) 60 kA; (2) 45 kA; (3) 30 kA; and (4) 15 kA. Results are shown for three different negative streamer speeds, Vs, namely, (a) 0.5 × 10⁶ m/s; (b) 1.0 × 10⁶ m/s; an (c) 2.0 × 10⁶ m/s. Calculations are for Estr = 106 V/m.

Figure 8.
Leader speed as a function of leader tip height from ground level for four different prospective return stroke currents. (1) 60 kA; (2) 45 kA; (3) 30 kA; and (4) 15 kA. Results are shown for three different negative streamer speeds, Vs, namely, (a) 0.5 × 10⁶ m/s; (b) 1.0 × 10⁶ m/s; and (c) 2.0 × 10⁶ m/s. Calculations are for Estr = 2 × 10⁶ V/m.


Table 1.
Average speed of the stepped leader over the last 2 km for different values of prospective return stroke peak current, streamer speed, and streamer potential gradient.
Table 1.
Average speed of the stepped leader over the last 2 km for different values of prospective return stroke peak current, streamer speed, and streamer potential gradient.
| Streamer Potential Gradient: 1.0 × 10⁶ V/m | |||||
| Streamer speed: 0.5 × 10⁶ m/s | Streamer speed: 1.0 × 10⁶ m/s | Streamer speed: 2.0 × 10⁶ m/s | |||
| Peak current (kA) | Leader speed (m/s) | Peak current (kA) | Leader speed (m/s) | Peak current (kA) | Leader speed (m/s) |
| 15 | 1.672 × 10⁵ | 15 | 3.34 × 10⁵ | 15 | 6.69 × 10⁵ |
| 30 | 2.384 × 10⁵ | 30 | 4.76 × 10⁵ | 30 | 9.53 × 10⁵ |
| 45 | 2.908 × 10⁵ | 45 | 5.81 × 10⁵ | 45 | 11.67 × 10⁵ |
| 60 | 3.277 × 10⁵ | 60 | 6.55 × 10⁵ | 60 | 13.11 × 10⁵ |
| Streamer Potential Gradient: 2.0 × 10⁶ V/m | |||||
| Streamer speed: 0.5 × 10⁶ m/s | Streamer speed: 1.0 × 10⁶ m/s | Streamer speed: 2.0 × 10⁶ m/s | |||
| Peak current (kA) | Leader speed (m/s) | Peak current (kA) | Leader speed (m/s) | Peak current (kA) | Leader speed (m/s) |
| 15 | 1.43 × 10⁵ | 15 | 2.86 × 10⁵ | 15 | 5.72 × 10⁵ |
| 30 | 1.94 × 10⁵ | 30 | 3.88 × 10⁵ | 30 | 7.76 × 10⁵ |
| 45 | 2.359 × 10⁵ | 45 | 4.71 × 10⁵ | 45 | 9.438 × 10⁵ |
| 60 | 2.689 × 10⁵ | 60 | 5.379 × 10⁵ | 60 | 10.75 × 10⁵ |
© 2017 by the authors. Licensee MDPI, Basel, Switzerland. This article is an open access article distributed under the terms and conditions of the Creative Commons Attribution (CC BY) license (http://creativecommons.org/licenses/by/4.0/).
Share and Cite
MDPI and ACS Style
Cooray, V.; Arevalo, L. Modeling the Stepping Process of Negative Lightning Stepped Leaders. Atmosphere 2017, 8, 245. https://doi.org/10.3390/atmos8120245
AMA Style
Cooray V, Arevalo L. Modeling the Stepping Process of Negative Lightning Stepped Leaders. Atmosphere. 2017; 8(12):245. https://doi.org/10.3390/atmos8120245
Chicago/Turabian StyleCooray, Vernon, and Liliana Arevalo. 2017. "Modeling the Stepping Process of Negative Lightning Stepped Leaders" Atmosphere 8, no. 12: 245. https://doi.org/10.3390/atmos8120245
Note that from the first issue of 2016, this journal uses article numbers instead of page numbers. See further details here.