MJO Modulating the Activity of the Leading Mode of Intraseasonal Variability in South America


1
Departamento de Ciencias de la Atmósfera y los Océanos, Facultad de Ciencias Exactas y Naturales, Universidad de Buenos Aires, C1428EGA Buenos Aires, Argentina
2
Centro de Investigaciones del Mar y la Atmósfera (CIMA), Instituto Franco Argentino sobre Estudios de Clima y sus Impactos (UMI IFAECI)/CNRS-CONICET, Universidad de Buenos Aires, C1428EGA Buenos Aires, Argentina
3
NOAA Earth System Research Laboratory, Physical Sciences Division, Boulder, CO 80305, USA
*
Author to whom correspondence should be addressed.
Atmosphere 2017, 8(12), 232; https://doi.org/10.3390/atmos8120232
Submission received: 29 August 2017
/
Revised: 8 November 2017
/
Accepted: 21 November 2017
/
Published: 28 November 2017
(This article belongs to the Special Issue Madden-Julian Oscillation)
Abstract
:Intraseasonal (IS) variability in South America is efficiently described through the first empirical orthogonal function of filtered precipitation or outgoing longwave radiation (OLR) anomalies. In the 30–90-day band, the leading OLR pattern between October and April is a dipole with centers of action in the South Atlantic Convergence Zone (SACZ) and southeastern South America (SESA). The Madden Julian Oscillation (MJO) was shown to have an impact on the rainfall in South America, with greater influence during the austral warm season. The aim of this study is therefore to assess the modulation of the MJO in the activity of the leading pattern of variability in South America, named the 3090-Seasonal-Intraseasonal (SIS) pattern. It was found that the most intense periods of activity of the SIS pattern appear to be related to intense MJO events with coherent eastward propagation. Furthermore, positive 3090-SIS phases, associated with enhanced (inhibited) convection over the SESA (SACZ) region generally occur during MJO progression from the eastern Indian Ocean to the Western Pacific (i.e., Maritime Continent sector). On the contrary, negative 3090-SIS phases, associated with enhanced (inhibited) convection over SACZ (SESA) are observed when the MJO active phase locates between the Western Pacific and the western Indian Ocean (African sector). The 3090-SIS pattern modulation by the MJO opens the opportunity to develop skillful subseasonal prediction tools in South America.
1. Introduction
Intraseasonal (IS, generally 10–90 day) variability in South America exhibits significant activity all year round [1]. It modulates regional climate anomalies, and in particular precipitation during both summer (e.g., [2]) and winter [3]. The leading pattern of variability of 30–90-day filtered outgoing longwave radiation (OLR) anomalies, hereafter referred as the 3090-Seasonal-Intraseasonal (3090-SIS) pattern, obtained from an empirical orthogonal function (EOF) analysis, has been recently used to describe the main characteristics of regional IS precipitation variability [1]. Between October and April, the 3090-SIS pattern is a dipole (Figure 1e from [1]), with an intense center of action over the region where the mean variability associated with the South Atlantic Convergence Zone (SACZ) is largest, and with the other pole located in southeastern South America (SESA). This pattern explains around 21% of the variance and it is significantly different from the second mode. On the other hand, between May and September, the 3090-SIS pattern is a monopole extended in a NW-SE direction over western Paraguay and SESA [1].
The MJO has been shown to have a substantial influence on precipitation anomalies over South America [4,5,6,7] and particularly over the SACZ region [8,9,10,11]. Reference [4] showed that the MJO influence on the probability of enhanced precipitation is present all year round, though it is less pronounced during austral winter. Moreover, a reduction (increase) in the probability of enhanced precipitation north of the SACZ region is on average observed alongside with an increase (reduction) over SESA for the December-February, March-May and September-November seasons [4]. Such an influence of the MJO on rainfall might then be playing a key role in the structure of the 3090-SIS pattern. On the other hand, in relation to the activity of the 3090-SIS pattern, Reference [1] also found MJO-like anomalies progressing along tropical latitudes.
From both previous studies [1,4] it can be speculated that the MJO seems to have an influence on 30–90 SIS activity, although neither of them explicitly quantified that influence. Therefore, the aim of this communication is to provide a more comprehensive description of the full range of conditions in which the MJO and 3090-SIS exhibit joint activity. The study focuses on the year period that goes from October to April, when the MJO signal is most intense.
2. Data and Methodology
The period of study spans from October 1979 to April 2013. The MJO events were identified following [12], as their index better estimates the intraseasonal signals associated with the MJO and it is less noisy than the RMM index of [13]. First, the seasonal cycle and linear trend were removed from the of 200-hPa and 850-hPa zonal wind taken from the NCEP-NCAR reanalysis ([14]). Then, the anomalies were filtered to retain intraseasonal variations with a 20–200 day bandpass filter, as [15] showed that it represents more accurately the isolated MJO events as opposed to a narrower band filter. Finally, a combined EOF analysis of equatorially averaged ( S– N) bandpass-filtered 200-hPa and 850-hPa zonal wind anomalies was performed. The first two normalized principal components (PC1, PC2) are used to characterize the MJO, and it was verified that the MJO index used in this study follows the intraseasonal variations of the RMM index of [13]. MJO events were identified when the following criteria were observed: (1) the phase angle between PC1 and PC2 systematically rotates counterclockwise over time to at least phase 5; (2) the amplitude of the MJO index () is always larger than 0.9; and (3) the entire duration of the event lasts between 30 and 90 days.
The 3090-SIS pattern is determined from the EOF1 of 30–90-day filtered OLR anomalies ([16]) in the region between S– N and W– W. Its temporal evolution was described through the standardized principal component (here named the 3090-SIS index) as in [1]. The 3090-SIS index is defined such that positive (negative) values indicate enhanced (inhibited) convection over SESA and inhibited (enhanced) convection over the SACZ region. Additionally, a positive (negative) 3090-SIS event was defined as a period of at least 5 days in which the 3090-SIS index reaches values greater than 1 (lower than ). In turn, each 3090-SIS event is divided into 3 stages: SIS growing stage, as the first one third of the event days, SIS mature stage, the middle one third of the event days centered in the SIS index peak, and SIS decaying stage, the last one third of the event days. If the 3090-SIS event started (ended) during a mature phase, only two stages were accordingly defined: mature and decaying (growing and mature) stages. In subsequent discussions, for simplicity, the SIS index and SIS events refer to the 3090-SIS index and 3090-SIS events.
3. Results
We here assess the joint evolution of the SIS and MJO indices. As an example, Figure 1 shows the evolution of the SIS index for the October 1985–April 1986 season, along with the amplitude of the MJO index, the MJO phase and the fulfillment of the MJO event criteria. Two successive MJO events were detected at the beginning of this season, followed by two isolated MJO events, during which 3 positive SIS events occurred. Also, two negative SIS events took place: one centered around day 90, during the third MJO event, and the other one, weaker, centered on day 130, just after that MJO event ended (Figure 1).
For each season, the occurrence of SIS events was detected and the MJO index during those days was analyzed, also considering whether an MJO event was recorded or not. The results are summarized in Table 1 in the following categories: (i) “MJO event”, if at least one of the days of the SIS event occurred during an MJO event as defined in Section 2; (ii) “short MJO”, if at least one of the days of the SIS event occurred while the MJO amplitude was greater than 1 but did not fulfill the conditions for an MJO event; and (iii) “weak MJO” if the amplitude of the MJO was lower than 1 during the entire SIS event and the conditions for an MJO event were not fulfilled. During the 34 seasons considered, 86 (83) SIS positive (negative) events were registered, and most of them took place in conjunction with an MJO event. Regarding the positive SIS events, 67.4% of them were associated with an MJO event, another 25.6% to the category “short MJO” and only 7.0% occurred during a weak MJO period. Moreover, 60.3% of the negative SIS events were also detected associated to an MJO event, 18.0% to a short MJO and 21.7% to a weak MJO (Table 1).
In the following subsections, the relationship between the MJO events and the SIS index evolution is further analyzed from two different perspectives. First, we analyze the behavior of the MJO events in association with the development of either positive or negative SIS events. Then, we study the evolution of the SIS index associated with each of the MJO phases.
3.1. MJO Behavior in Association with SIS Events
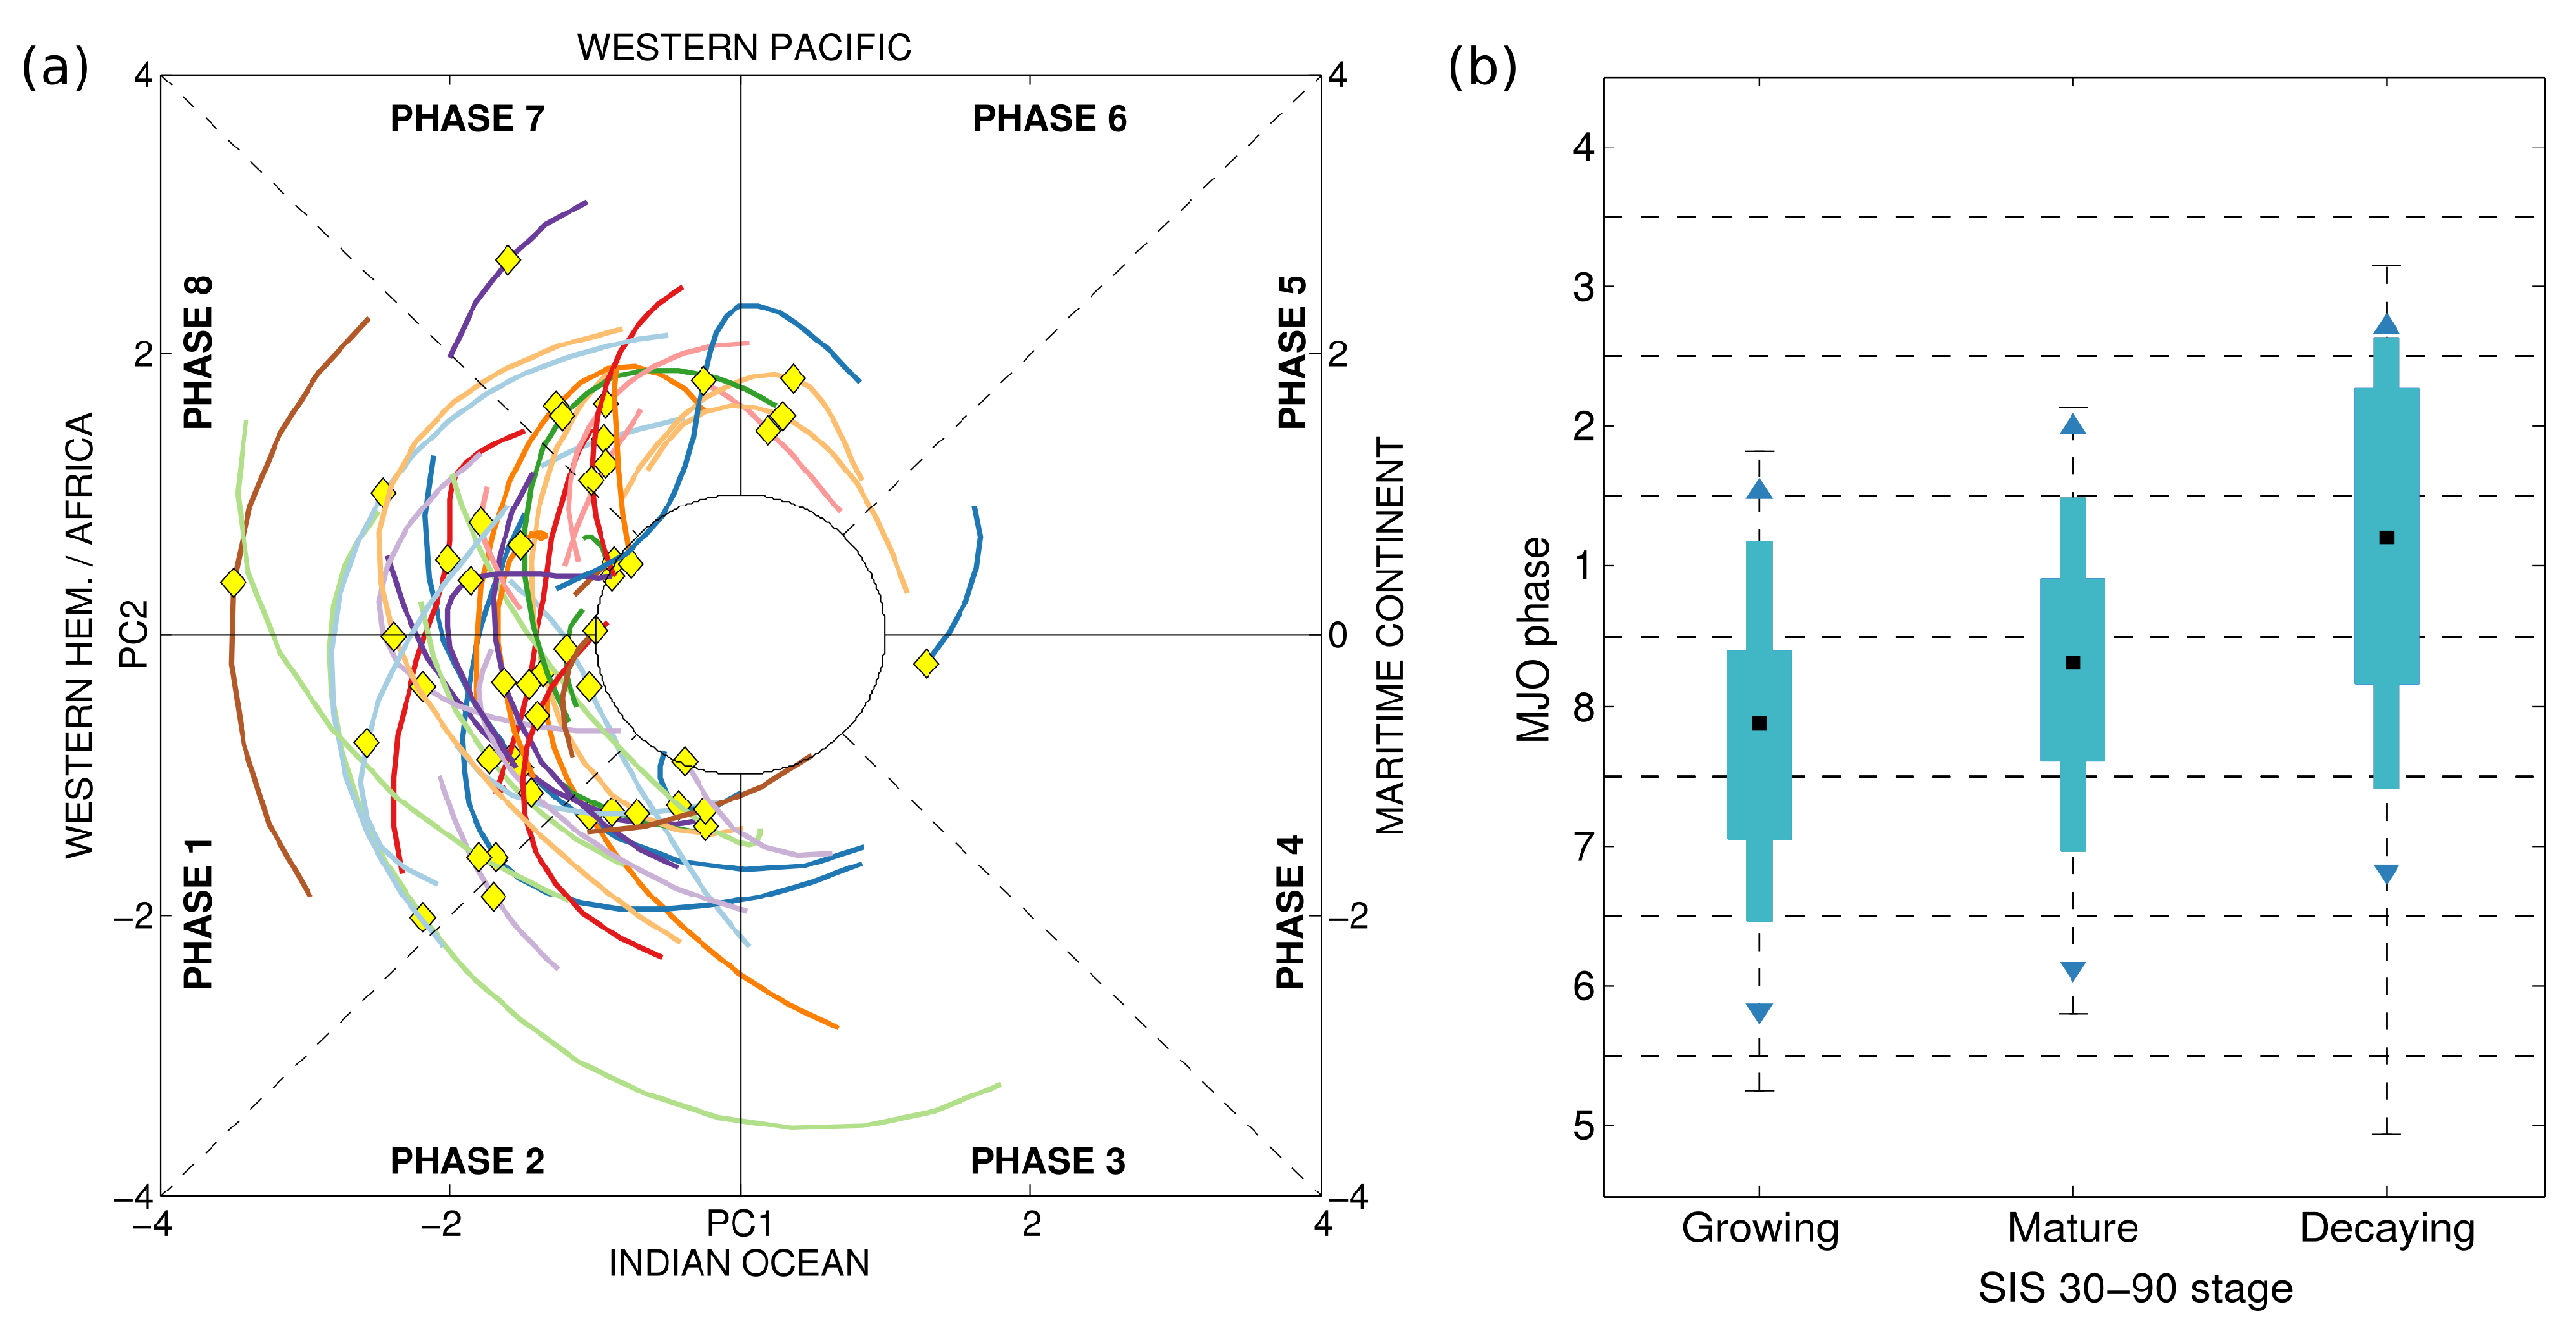
The MJO index values associated with MJO events that occurred during days in which the SIS index achieved a positive event were plotted in Figure 2a. The phase diagram shows that the MJO in association with a positive SIS event spans mostly phases 3 to 6, when the enhanced convective phase of the MJO is located in the eastern Indian Ocean, the Maritime Continent and the western Pacific Ocean. Furthermore, phase 5 is when most SIS events reach their maximum. Only one positive SIS event that occurred during an MJO event took place completely during MJO phases 1 and 2. (Figure 2a).
A boxplot of the average MJO phase angle identified for each stage of the SIS events (Figure 2a) is shown in Figure 2b. The mature phase of a positive SIS event is more likely to occur between phases 4 and 5, while 95% of the SIS events reach their mature phase between phases 3 and 6. Consequently, 95% of the SIS events show their growing and decaying stages approximately between phases 2 and 6 and 4 and 7 respectively (Figure 1). This boxplot shows that despite the range of phases along which a positive SIS event occurred is somewhat large, around 90% of the growing and mature stages (and 75% of the decaying stage) of the events can be identified within MJO phases 3 to 6.
Analogously, Figure 3a describes the phase evolution of the MJO events that occurred in association with negative SIS events. In this case, the MJO index spans mostly phases 7 to 2, when the convective phase of the MJO progresses from the Western Hemisphere to the western Indian Ocean. Figure 2a and Figure 3a clearly show that when a positive or negative SIS event occurs during an MJO event, the location of the convective phase of the MJO is distinctly different between the two. Moreover, the mature phase of a negative SIS event is more likely to develop during phases 8 and 1 (around 75% of the observed cases), while the growing and decaying stages were more commonly observed between phases 7 and 8 (75%) and 8 and 2 (around 90%) respectively (Figure 3b).
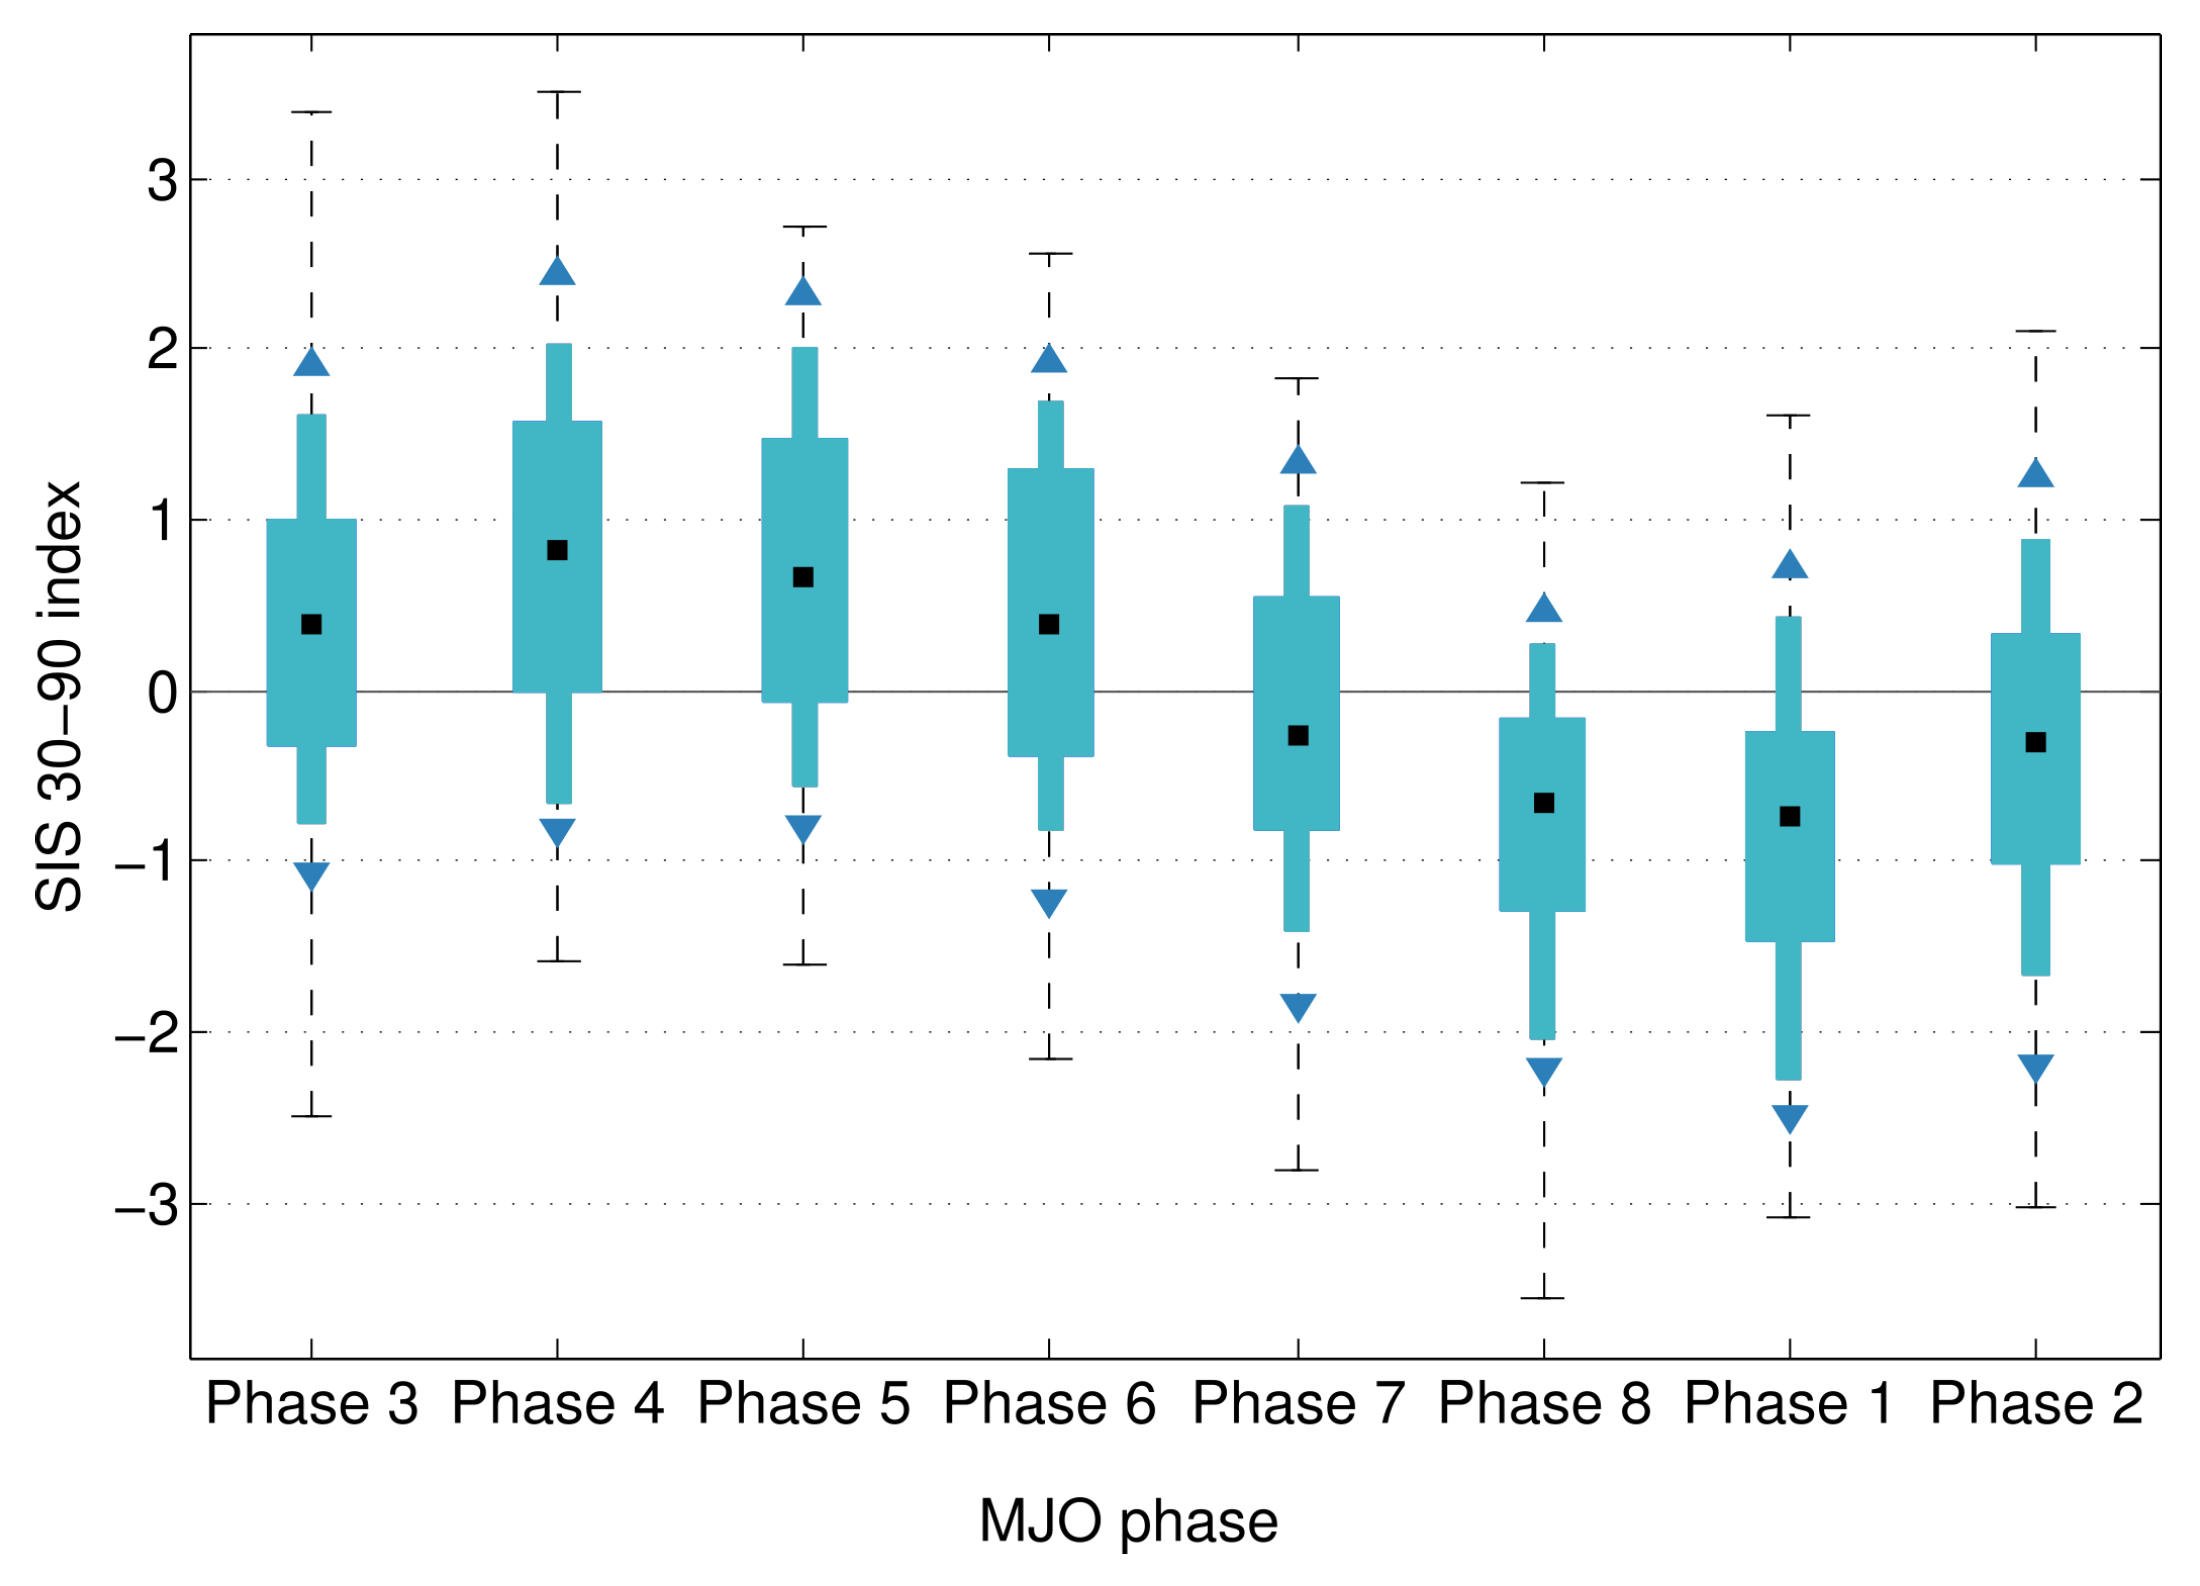
3.2. SIS Index Behavior in Association with MJO Phases
For the following analysis, all daily SIS values identified in association with MJO events were sorted according to each of the 8 MJO phases, and described in a boxplot framework (Figure 4). Positive SIS index values are more frequently observed during MJO phases 3 to 6. Particularly, in phases 4 and 5 around 75% of the daily SIS index values are positive, implying greater probabilities of a positive SIS event. Even though there are negative SIS values in MJO phases 3 to 6, those could primarily be explained as a consequence of a growing SIS index towards positive values during the following MJO phases or a decaying SIS index after positive values during the previous MJO phases (not shown). Furthermore, less than 10% of the SIS index values for this MJO phases were below (less than 5% for phases 4 and 5). On the other hand, during MJO phases 7 to 2, negative SIS values are more frequently observed. Indeed, more than 75% of the days when the MJO convective phase is located over the western hemisphere and Africa, that is, phases 8 and 1, showed a negative SIS index.
4. Discussion and Conclusions
The full range of possibilities of the joint activity of the MJO and the SIS pattern, which is the leading mode of IS variability in South America, was analyzed for the October-April season. It was found that most positive SIS events, which bring rain to the SESA region, occur as MJO progresses from the eastern Indian Ocean to the Pacific Ocean (MJO phases 3 to 6). On the other hand, negative SIS events, which inhibit rainfall in SESA and enhance it in the SACZ region, generally develop in conjunction with the MJO progressing through the Western Hemisphere to the western Indian Ocean (MJO phases 7 to 2). However, the analysis shows that besides the mean conditions characterizing the MJO-SIS activity, there is a spectrum of other possible joint activities. It is speculated that the latter could be in part due to the different ways in which MJO can develop and to the joint activity of other large-scale climate patterns (e.g., Southern Annular Mode [17]) that can alter the MJO influence over South America.
Similar results were found using the ERA-Interim database ([18]) for computing the MJO index of [12] and also using the original OLR-based MJO index (OOMI [19], not shown), which is obtained as the projection of 30–96 day eastward only filtered OLR onto the spatial EOF patterns of 30–96 day eastward filtered OLR. The OOMI index is smoother than the OMI index given the more restrictive filtering, but is also only based on the convective signal of the MJO. This result confirms that our findings are robust and do not depend on the index used in this study.
Reference [4] showed that for austral summer the probability of exceeding the upper tercile of daily rainfall increases (decreases) in SESA (eastern Brazil) on average during the MJO progression through the Maritime Continent (that is, phases 4 and 5). That pattern is consistent with a positive SIS index. Furthermore, they show that phase 3 (6) is on average associated with an increase (decrease) of probability of enhanced rainfall in SESA (eastern Brazil). These results are consistent with those presented in this communication, as most of the positive SIS events are indeed related to MJO phases 3 to 6. On the other hand, Reference [4] found that when the active phase of the MJO locates in the Western Hemisphere and Africa (phases 8 and 1), the probability of enhanced precipitation increases north of the SACZ, and that it decreases in SESA during phase 7, a pattern consistent with a negative SIS index. This relation was also verified here.
Moreover, Reference [1] showed that from October to April the activity of the SIS pattern in the 30–90 day timescale can be associated with the progression of OLR anomalies in tropical latitudes that advance from Africa and the east Indian Ocean to the Maritime Continent, during the 30 days prior to the peak of the positive SIS mature phase to its peak, when rainfall is favored in SESA. Those anomalies were hypothesized to be similar to the MJO between phases 1 and 5. The results presented here also support that finding, as the MJO activity was directly related to the activity of the SIS 30–90 pattern showing that the peak of the SIS index is more likely to occur around MJO phase 5. Therefore, we confirm that the MJO modulates the activity of the leading pattern of intraseasonal activity in South America. Both, Reference [1,4], as well as references therein, show that the physical mechanisms explaining that remote influence are extratropical arcing teleconnections due to Rossby wavetrains emanating from the MJO convective phase near the Maritime Continent that reach South America, promoting favorable dynamic conditions for either ascent or descent over the SESA and SACZ regions.
The modulation that the MJO exerts on the SIS pattern in particular, and the continuous improvement of the representation and predictability of the MJO in climate models (e.g., [20] and references therein) further motivate the study of the SIS index predictability, which will be undertaken in future work.
Finally, monitoring and predicting the intraseasonal variability in southern South America is a challenge that is being addressed by joint collaborations between the scientific community and the operational weather services of the region in projects such as CLIMAX (www.climax-sa.org). Towards that end, this study provides valuable insight and motivation to develop tools for regional monitoring of the SIS within the context of the MJO activity in the near future.
Acknowledgments
The research was supported by CONICET/PIP 112-20120100626CO, UBACyT 20020130100489BA, PIDDEF 2014/2017 Nro 15, and the CLIMAX Project funded by Belmont Forum. MSA is supported by a PostDoc grant from CONICET, Argentina.
Conflicts of Interest
The authors declare no conflict of interest.
References
- Vera, C.S.; Alvarez, M.S.; Gonzalez, P.L.M.; Liebmann, B.; Kiladis, G.N. Seasonal cycle of precipitation variability in South America on intraseasonal timescales. Clim. Dyn. 2017, 1–11. [Google Scholar] [CrossRef]
- Gonzalez, P.L.M.; Vera, C.S. Summer precipitation variability over South America on long and short intraseasonal timescales. Clim. Dyn. 2014, 43, 1993–2007. [Google Scholar] [CrossRef]
- Alvarez, M.S.; Vera, C.S.; Kiladis, G.N.; Liebmann, B. Intraseasonal variability in South America during the cold season. Clim. Dyn. 2014, 42, 3253–3269. [Google Scholar] [CrossRef]
- Alvarez, M.S.; Vera, C.S.; Kiladis, G.N.; Liebmann, B. Influence of the Madden Julian Oscillation on precipitation and surface air temperature in South America. Clim. Dyn. 2016, 46, 245–262. [Google Scholar] [CrossRef]
- Barrett, B.S.; Carrasco, J.F.; Testino, A.P. Madden-Julian Oscillation (MJO) Modulation of atmospheric circulation and chilean winter precipitation. J. Clim. 2012, 25, 1678–1688. [Google Scholar] [CrossRef]
- Jones, C.; Waliser, D.E.; Lau, K.M.; Stern, W. Global occurrences of extreme precipitation and the Madden-Julian Oscillation: Observations and predictability. J. Clim. 2004, 17, 4575–4589. [Google Scholar] [CrossRef]
- Paegle, J.N.; Byerle, L.A.; Mo, K.C. Intraseasonal modulation of South American summer precipitation. Mon. Weather Rev. 2000, 128, 837–850. [Google Scholar] [CrossRef]
- De Souza, E.B.; Ambrizzi, T. Modulation of the intraseasonal rainfall over tropical Brazil by the Madden-Julian oscillation. Int. J. Climatol. 2006, 26, 1759–1776. [Google Scholar] [CrossRef]
- Castro Cunningham, C.A.; De Albuquerque Cavalcanti, I.F. Intraseasonal modes of variability affecting the South Atlantic Convergence Zone. Int. J. Climatol. 2006, 26, 1165–1180. [Google Scholar] [CrossRef]
- Carvalho, L.M.V.; Jones, C.; Liebmann, B. The South Atlantic Convergence Zone: Intensity, form, persistence, and relationships with intraseasonal to interannual activity and extreme rainfall. J. Clim. 2004, 17, 88–108. [Google Scholar] [CrossRef]
- Jones, C.; Carvalho, L.M.V. Active and break phases in the South American monsoon system. J. Clim. 2002, 15, 905–914. [Google Scholar] [CrossRef]
- Jones, C.; Carvalho, L.M.V. Spatial-intensity variations in extreme Precipitation in the Contiguous United States and the Madden-Julian Oscillation. J. Clim. 2012, 25, 4898–4913. [Google Scholar] [CrossRef]
- Wheeler, M.C.; Hendon, H.H. An all-season real-time multivariate MJO Index: Development of an index for monitoring and prediction. Mon. Weather Rev. 2004, 132, 1917–1932. [Google Scholar] [CrossRef]
- Kalnay, E.; Kanamitsu, M.; Kistler, R.; Collins, W.; Deaven, D.; Gandin, L.; Iredell, M.; Saha, S.; White, G.; Woollen, J.; et al. The NCEP/NCAR 40-Year Reanalysis Project. Bull. Am. Meteorol. Soc. 1996, 77, 437–471. [Google Scholar] [CrossRef]
- Matthews, A.J. Propagation mechanisms for the Madden-Julian Oscillation. Q. J. R. Meteorol. Soc. 2000, 126, 2637–2651. [Google Scholar] [CrossRef]
- Liebmann, B.; Smith, C.A. Description of a Complete (Interpolated) outgoing longwave radiation dataset. Bull. Am. Meteorol. Soc. 1996, 77, 1275–1277. [Google Scholar]
- Flatau, M.; Kim, Y.J. Interaction between the MJO and Polar Circulations. J. Clim. 2013, 26, 3562–3574. [Google Scholar] [CrossRef]
- Dee, D.P.; Uppala, S.M.; Simmons, A.J.; Berrisford, P.; Poli, P.; Kobayashi, S.; Andrae, U.; Balmaseda, M.A.; Balsamo, G.; Bauer, P.; et al. The ERA-Interim reanalysis: Configuration and performance of the data assimilation system. Q. J. R. Meteorol. Soc. 2011, 137, 553–597. [Google Scholar] [CrossRef]
- Kiladis, G.N.; Dias, J.; Straub, K.H.; Wheeler, M.C.; Tulich, S.N.; Kikuchi, K.; Weickmann, K.M.; Ventrice, M.J. A Comparison of OLR and circulation-based indices for Tracking the MJO. Mon. Weather Rev. 2014, 142, 1697–1715. [Google Scholar] [CrossRef]
- Kim, H.M.; Webster, P.J.; Toma, V.E.; Kim, D. Predictability and prediction skill of the MJO in two operational forecasting systems. J. Clim. 2014, 27, 5364–5378. [Google Scholar] [CrossRef]
Figure 1.
SIS index for the October-April season of 1985/1986 (black line), MJO amplitude (dashed line, yellow shading), MJO phase (blue line). The red dots indicate the fulfillment of the conditions of an MJO event as defined in Section 2.
Figure 1.
SIS index for the October-April season of 1985/1986 (black line), MJO amplitude (dashed line, yellow shading), MJO phase (blue line). The red dots indicate the fulfillment of the conditions of an MJO event as defined in Section 2.
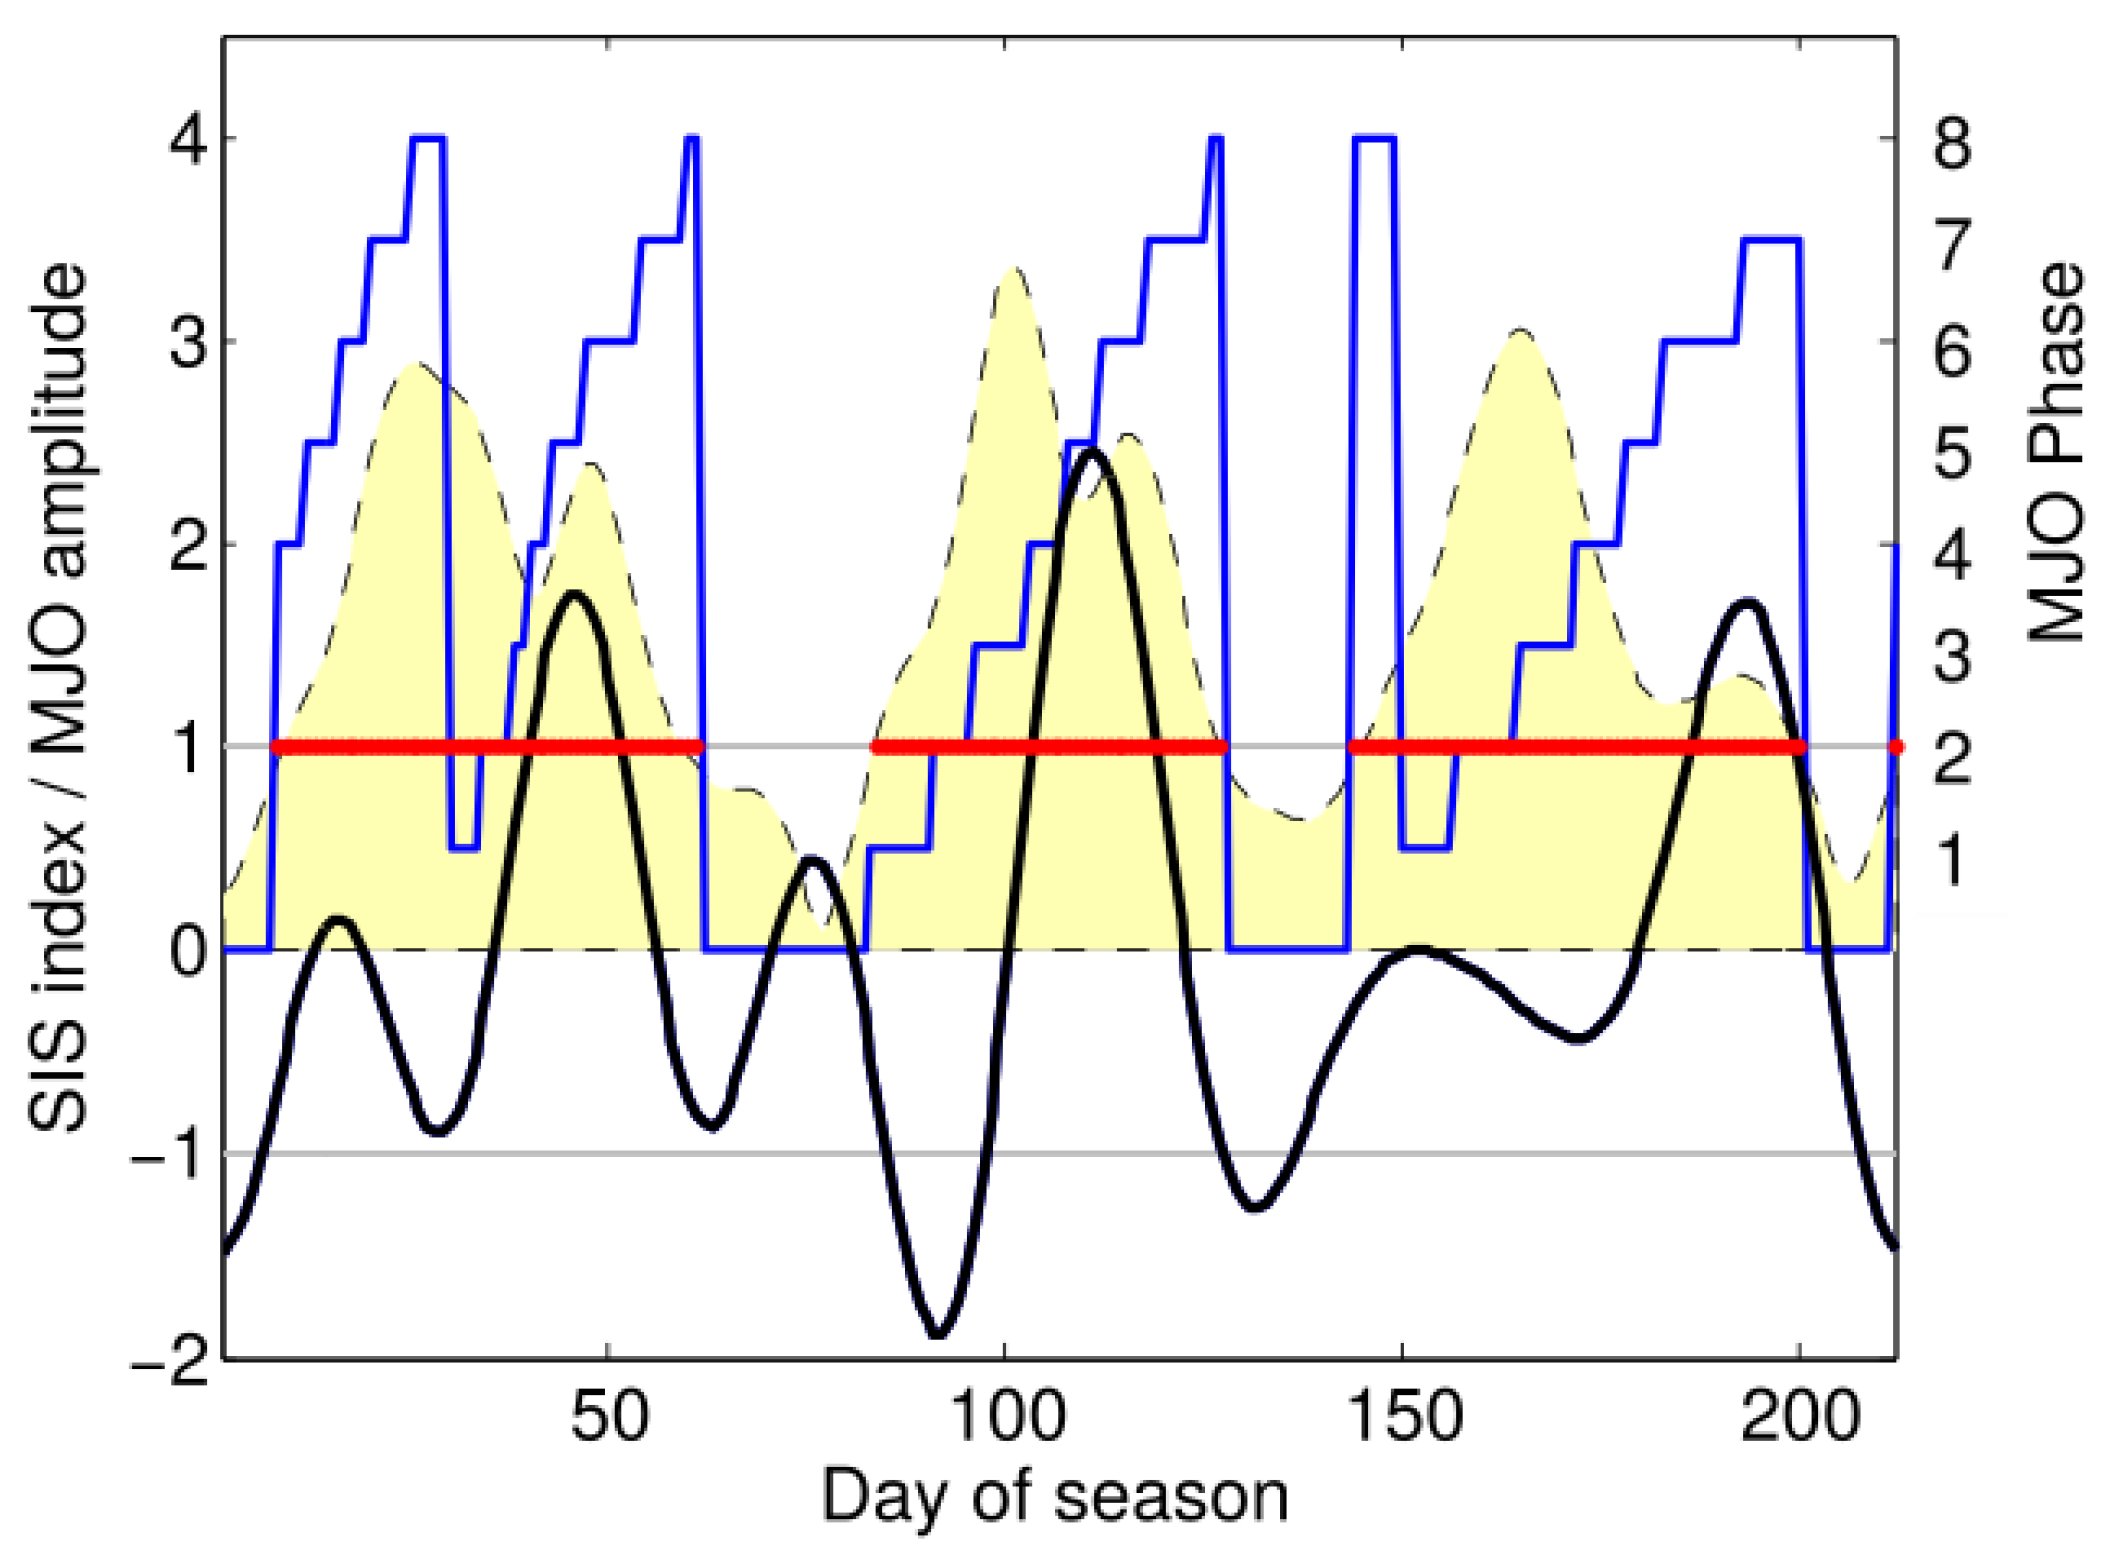
Figure 2.
(a) MJO phase diagram with the daily MJO index values during positive SIS events within an MJO event. The yellow diamond indicates the day in which the SIS index is maximum and (b) Boxplot of the average phase angle for the growing, mature and decaying stages of positive SIS events (see text for definitions). The wide box indicates the lower and upper quartiles, the thin box indicates the 10th and 90th percentiles, the triangles indicate the 5th and 95th percentiles, the black square the median and the whiskers the extreme values. The dashed horizontal lines correspond to the angles in which the MJO phase changes, and the phase associated to each interval of angles is indicated in the vertical axis.

Figure 3.
(a) MJO phase diagram with the daily MJO index values during negative SIS events within an MJO event. The yellow diamond indicates the day in which the SIS index is minimum and (b) Boxplot of the average phase angle for the growing, mature and decaying stages of positive SIS events (see text for definitions). Rest as in Figure 2.

Figure 4.
Boxplot of the SIS index values for each MJO phase achieved within an MJO event. The wide box indicates the lower and upper quartiles, the thin box indicates the 10th and 90th percentiles, the triangles indicate the 5th and 95th percentiles, the black square the median and the whiskers the extreme values.

Table 1.
Categorization of positive and negative SIS events according to MJO state.
| Positive SIS Event | Negative SIS Event | |
|---|---|---|
| MJO event | 58 (67.4%) | 50 (60.3%) |
| Short MJO | 22 (25.6%) | 15 (18.0%) |
| Weak MJO | 6 (7.0%) | 18 (21.7%) |
© 2017 by the authors. Licensee MDPI, Basel, Switzerland. This article is an open access article distributed under the terms and conditions of the Creative Commons Attribution (CC BY) license (http://creativecommons.org/licenses/by/4.0/).
Share and Cite
MDPI and ACS Style
Alvarez, M.S.; Vera, C.S.; Kiladis, G.N. MJO Modulating the Activity of the Leading Mode of Intraseasonal Variability in South America. Atmosphere 2017, 8, 232. https://doi.org/10.3390/atmos8120232
AMA Style
Alvarez MS, Vera CS, Kiladis GN. MJO Modulating the Activity of the Leading Mode of Intraseasonal Variability in South America. Atmosphere. 2017; 8(12):232. https://doi.org/10.3390/atmos8120232
Chicago/Turabian StyleAlvarez, Mariano S., Carolina S. Vera, and George N. Kiladis. 2017. "MJO Modulating the Activity of the Leading Mode of Intraseasonal Variability in South America" Atmosphere 8, no. 12: 232. https://doi.org/10.3390/atmos8120232
Note that from the first issue of 2016, this journal uses article numbers instead of page numbers. See further details here.