Article

Atmospheric Processing and Variability of Biological Ice Nucleating Particles in Precipitation at Opme, France

1
Université Clermont Auvergne, CNRS, Institut de Chimie de Clermont-Ferrand, F-63000 Clermont-Ferrand, France
2
Université Clermont Auvergne, CNRS, Laboratoire de Météorologie Physique, F-63000 Clermont-Ferrand, France
3
Université Clermont Auvergne, CNRS, Observatoire de Physique du Globe de Clermont-Ferrand, F-63000 Clermont-Ferrand, France
4
Department of Environmental Sciences, University of Basel, Basel 4056, Switzerland
*
Author to whom correspondence should be addressed.
Atmosphere 2017, 8(11), 229; https://doi.org/10.3390/atmos8110229
Submission received: 31 October 2017 / Revised: 14 November 2017 / Accepted: 17 November 2017 / Published: 21 November 2017
(This article belongs to the Special Issue Atmospheric Aerosol Composition and its Impact on Clouds)

Abstract

:
Atmospheric ice nucleating particles (INPs) contribute to initiate precipitation. In particular, biological INPs act at warmer temperatures than other types of particles (>−10 °C) therefore potentially defining precipitation distribution. Here, in order to identify potential environmental drivers in the distribution and fate of biological INPs in the atmosphere, we conducted a mid-term study of the freezing characteristics of precipitation. A total of 121 samples were collected during a period of >1.5 years at the rural site of Opme (680 m a.s.l. (above sea level), France). INP concentration ranged over two orders of magnitude at a given temperature depending on the sample; there were <1 INPs mL−1 at ≥−5 °C, ~0.1 to 10 mL−1 between −5 °C and −8 °C, and ~1 to 100 mL−1 at colder temperatures. The data support the existence of an intimate natural link between biological INPs and hydrological cycles. In addition, acidification was strongly correlated with a decrease of the freezing characteristics of the samples, suggesting that human activities impact the role of INPs as triggers of precipitation. Water isotope ratio measurements and statistical comparison with aerosol and cloud water data confirmed some extent of INP partitioning in the atmosphere, with the INPs active at the warmest temperatures tending to be more efficiently precipitated.

1. Introduction

The formation of ice in clouds is a major process in the induction of precipitation [1]. At temperatures above the homogeneous freezing point of water, at nearly −40 °C, ice formation is favored by the presence of aerosols acting as ice nucleating particles (INPs). To date, many INPs with possible impacts on precipitation have been identified in the atmosphere. These comprise abundant mineral and organic particles such as feldspar [2] and cellulose [3], and also fewer numerous biological particles [4,5,6,7] catalyzing freezing at much warmer temperatures (i.e., >−10 °C; [1,8]), notably fungi [9,10] and bacteria [11,12,13].
The capacity of biological material to catalyze ice formation was discovered about 50 years ago [14,15,16,17]. Since then, biological INPs have been shown to be widespread in the air, clouds and precipitation, from tropics to polar regions (e.g., [6,18,19,20]), and over oceans [21,22,23]. Water isotope ratio measurements in snowfall showed that biological INPs are precipitated more efficiently than other particles of a similar size [24], suggesting a role in initiating precipitation. However, modeling studies indicated that their impact is probably not global [25,26], but rather limited to regional or local scales [27], at places and times where and when they are sufficient enough to trigger precipitation and influence spatial and temporal rainfall patterns [27,28].
Over the past 15 years, the mountain observatory on Puy de Dôme (1465 m a.s.l.) in Central France has hosted a number of studies on the microbiology of aerosols [29,30,31] including biological ice nucleators [6,11,32]. In this paper, we present a 1.5-year survey of the freezing characteristics of precipitation collected at a site located below puy de Dôme Mountain, and associated with meteorological, chemical and microbiological data in an attempt to explain the variability. In a second step we combine these new precipitation data with data from clouds and aerosol sampled on the summit. Our objective is to identify pattern indicative of the potential role of INPs in inducing precipitation and to detect eventual specific atmospheric processing of INPs.

2. Material and Methods

2.1. Sample Collection

Precipitation samples were collected at ~1.5 m above ground at Opme meteorological station in Central France (680 m a.s.l., 45.712500° N, 3.090278° E), in a rural area at about 7 km from Clermont-Ferrand city and 13 km from the top of puy de Dôme. An automated wet-deposition sampler (Eigenbrodt NSA 181/KHS) was installed at Opme in September 2015; it is equipped with a sensor to open a polytetrafluoroethylene (PTFE) lid only when precipitation occurs, thus preventing contamination by dry deposition between precipitation events. The water collected by the glass funnel of the sampler was immediately transferred by gravity into sterile (autoclaved) 1-L glass bottles through sterile silicone tubing. The carousel holding 8 collection bottles was maintained at 4 °C, and it was set to switch every 24 h at midnight to a new bottle. Bottles were all (even if empty) collected every week or less and replaced by a new set of 8 sterile bottles after careful rinsing of the collection funnel with ethanol 70% and sterile water. The volume of sample collected daily was divided by the collection area (500 cm2) to derive daily precipitation.
After the collection of the bottles, each sample was directly analyzed for INPs, pH was measured, and ~1 mL subsample was collected and stored at 4 °C for oxygen isotope ratio measurement. At some occasions, subsamples were taken for ion content analysis by ion chromatography (5 mL, stored at −25 °C) and total cells enumeration by flow cytometry (see below).
Aerosol samples were collected for periods of 5 to 21 days between January and November 2013 at puy de Dôme station (1465 m a.s.l., 45.772° N, 2.9655° E, France), on 13.7 cm diameter quartz filters using a HiVol PM10 Digitel sampler, at a mean air flow rate of 420 L/min. Filters were stored at −25 °C until analysis. For ice nucleation assays, 2 subsamples of 1.2 cm of diameter were collected from each filter sample, in a laminar flow hood using a flamed dye. Particles were obtained by washing these in 12 mL of sterile 0.9% NaCl solution, with shaking for 20 min at 4 °C; the liquid was then analyzed for INPs.

2.2. Ice Nucleation Assays

The concentration of INPs was determined between −2 °C and −14 °C by droplet-freezing assays, using the apparatus LINDA (LED-Based Ice Nucleation Detection Apparatus) [33]. From each precipitation sample, 26 subsamples of 400 µL were pipetted into 0.5 mL microtubes and placed in a cryobath (Julabo F34-ED) set at −2 °C. LINDA detects freezing as a sudden decrease in the transmission of light from light-emitting diodes (LEDs) below the microtubes as observed with a camera above the tubes. The cumulative concentration of INPs at each 0.5 °C temperature step was calculated according to Equation (13) in Vali [34], and it is noted INPT at the temperature T throughout the manuscript. The corresponding lower and upper quantification limits were 0.10 IN mL−1 and 8.15 IN mL−1, respectively, or 81.5 IN mL−1 in the case when a ten-fold dilution of the sample was analyzed. There was no relationship between the delay before analysis (time spent by the sample in the collector after precipitation: 0 to 7 days at 4 °C) and the INP concentration or the onset temperature of freezing (p-value > 0.97; Spearman’s or Pearson’s test).
For aerosols, non-exposed quartz filters were used as controls using the same washing procedure as for samples. The washing liquid started freezing at temperatures ≤−9.5 °C and the corresponding INP concentration remained <0.5 mL−1 at temperatures >−12 °C, i.e., one order of magnitude lower than in the less concentrated samples.

2.3. Cell Counts

Cell counts were performed occasionally on precipitation samples, by flow cytometry (BD FacsCalibur, Becton Dickinson, Franklin Lakes, NJ, USA). Triplicate volumes of 450 µL were added with 50 µL 5% glutaraldehyde (0.5% final concentration; Sigma-Aldrich G7651) and stored at 4 °C. For analysis, samples were mixed with 1 vol. of 0.02 µm filtered Tris-EDTA pH 8.0 (40 mM Tris-Base, 1 mM EDTA, acetic acid to pH 8.0) and stained with SYBRGreen I (Molecular Probes Inc., Eugene, OR, USA) from a 100X solution. Counts were performed for 2 min or 100,000 events at a flow rate “High” (~80 µL min−1, precisely determined by weighting). Bacterial cells were distinguished based on their forward and side scattering fluorescence light intensities (λexc = 488 nm; λem = 530 nm).

2.4. Chemical Analyses

Ion analysis of precipitation samples was realized occasionally, by ion chromatography, on subsamples kept at −25 °C, using a Dionex DX320 for anions (column AS11, eluant KOH) and a Dionex ICS1500 for cations (column CS16, eluant hydroxymethanesulfonate), similarly as in [35].

2.5. Meteorological Data and Backward Trajectory Plots

Meteorological variables (pressure, temperature, relative humidity and wind speed) were monitored continuously by the ground based meteorological stations at Opme and puy de Dôme. Details on these stations can be found at http://wwwobs.univ-bpclermont.fr/SO/mesures/index.php. The variables are measured routinely and included in ACTRIS-FR, the French component of the distributed research infrastructure ACTRIS (Aerosol Cloud and Trace gases Research Infrastructure).
Vertical profiles of 4 parameters (relative humidity, cloud cover, cloud liquid water content and cloud ice water content) have also been extracted from ECMWF ERA-Interim re-analyses [36] and used for statistical analyses. The nearest grid point from Opme has been taken from the horizontal resolution 0.125° output, on 23 vertical levels between the ground and 12 km altitude and with a temporal resolution of 6 h (00, 06, 12 and 18UT). The 4 profiles have been plotted for each day of precipitation sampling, and the plots are presented in the Supplementary Materials (Supplementary Materials zipfile 1).
In order to determine the dynamical origin of the precipitating clouds, we calculated back-trajectories with the LACYTRAJ model [37]. LACYTRAJ is a 3D kinematic trajectory code using ECMWF ERA-Interim re-analyses. In this work, initialization wind fields have a horizontal resolution of 1° in latitude and longitude, and 37 vertical levels. Each trajectory point is advected using a bilinear interpolation for horizontal wind fields and time and a log-linear interpolation for vertical wind field. Each cluster of trajectories is calculated every 15 min for 48 h of back-trajectories, for each day of precipitation sampling with a starting vertical level defined using ERA-Interim humidity and cloud parameters, and varying from 1 to 5 km. LACYTRAJ has previously been used to study long-range inter-hemispheric transport of carbon monoxide [38], interactions between the mixing layer and the free troposphere [39] or jet stream dynamics [40]. Based on previous studies of the atmosphere at this site [41], we distinguished categories in the geographical origin of air masses; here 3 sectors were defined: West (air masses from the Atlantic Ocean), North-East (Continental source) and South (Mediterranean Sea). The back-trajectory plots corresponding to the samples investigated are presented in the Supplementary Materials (Supplementary Materials zipfile 2).

2.6. δ18O Measurements

Precipitation leads to a depletion of 18O in water carried by an air mass. It can be quantitatively modeled as a Rayleigh distillation process [42]. We have previously described the procedure in detail by which we derive from δ18O values measured in a precipitation sample the fraction of water vapor lost from an air mass prior to its arrival at a sampling point [24]. In this study we used a value of −13.12 permil for water vapor at its source (above ocean), fractionation factors from liquid to vapor of 1.0116 along the trajectory from ocean to puy de Dôme and of 1.0129 in the precipitating clouds above Opme. The greatest uncertainty here is associated with the possible change of δ18O in precipitation along its trajectory between the clouds and our sampler, which we cannot account for.

2.7. Data Analyses

Statistical analyses were performed using Paleontological Statistics Software Package for Education and Data Analysis (PAST) v.3.07 [43] and SigmaPlot 13.0. For statistical comparisons of datasets, normality was verified by Shapiro–Wilk test and parametric (F or t-test, Pearson correlation) or non-parametric (Mann–Whitney, Kruskal–Wallis, Spearman correlation, ANOVA on ranks) tests were used accordingly.
Correlation tests including qualitative environmental variables (season and geographical origin) were performed by assigning a natural number arbitrary starting from 1 to each category; all the different assignment possibilities were included in the tests.

3. Results and Discussion

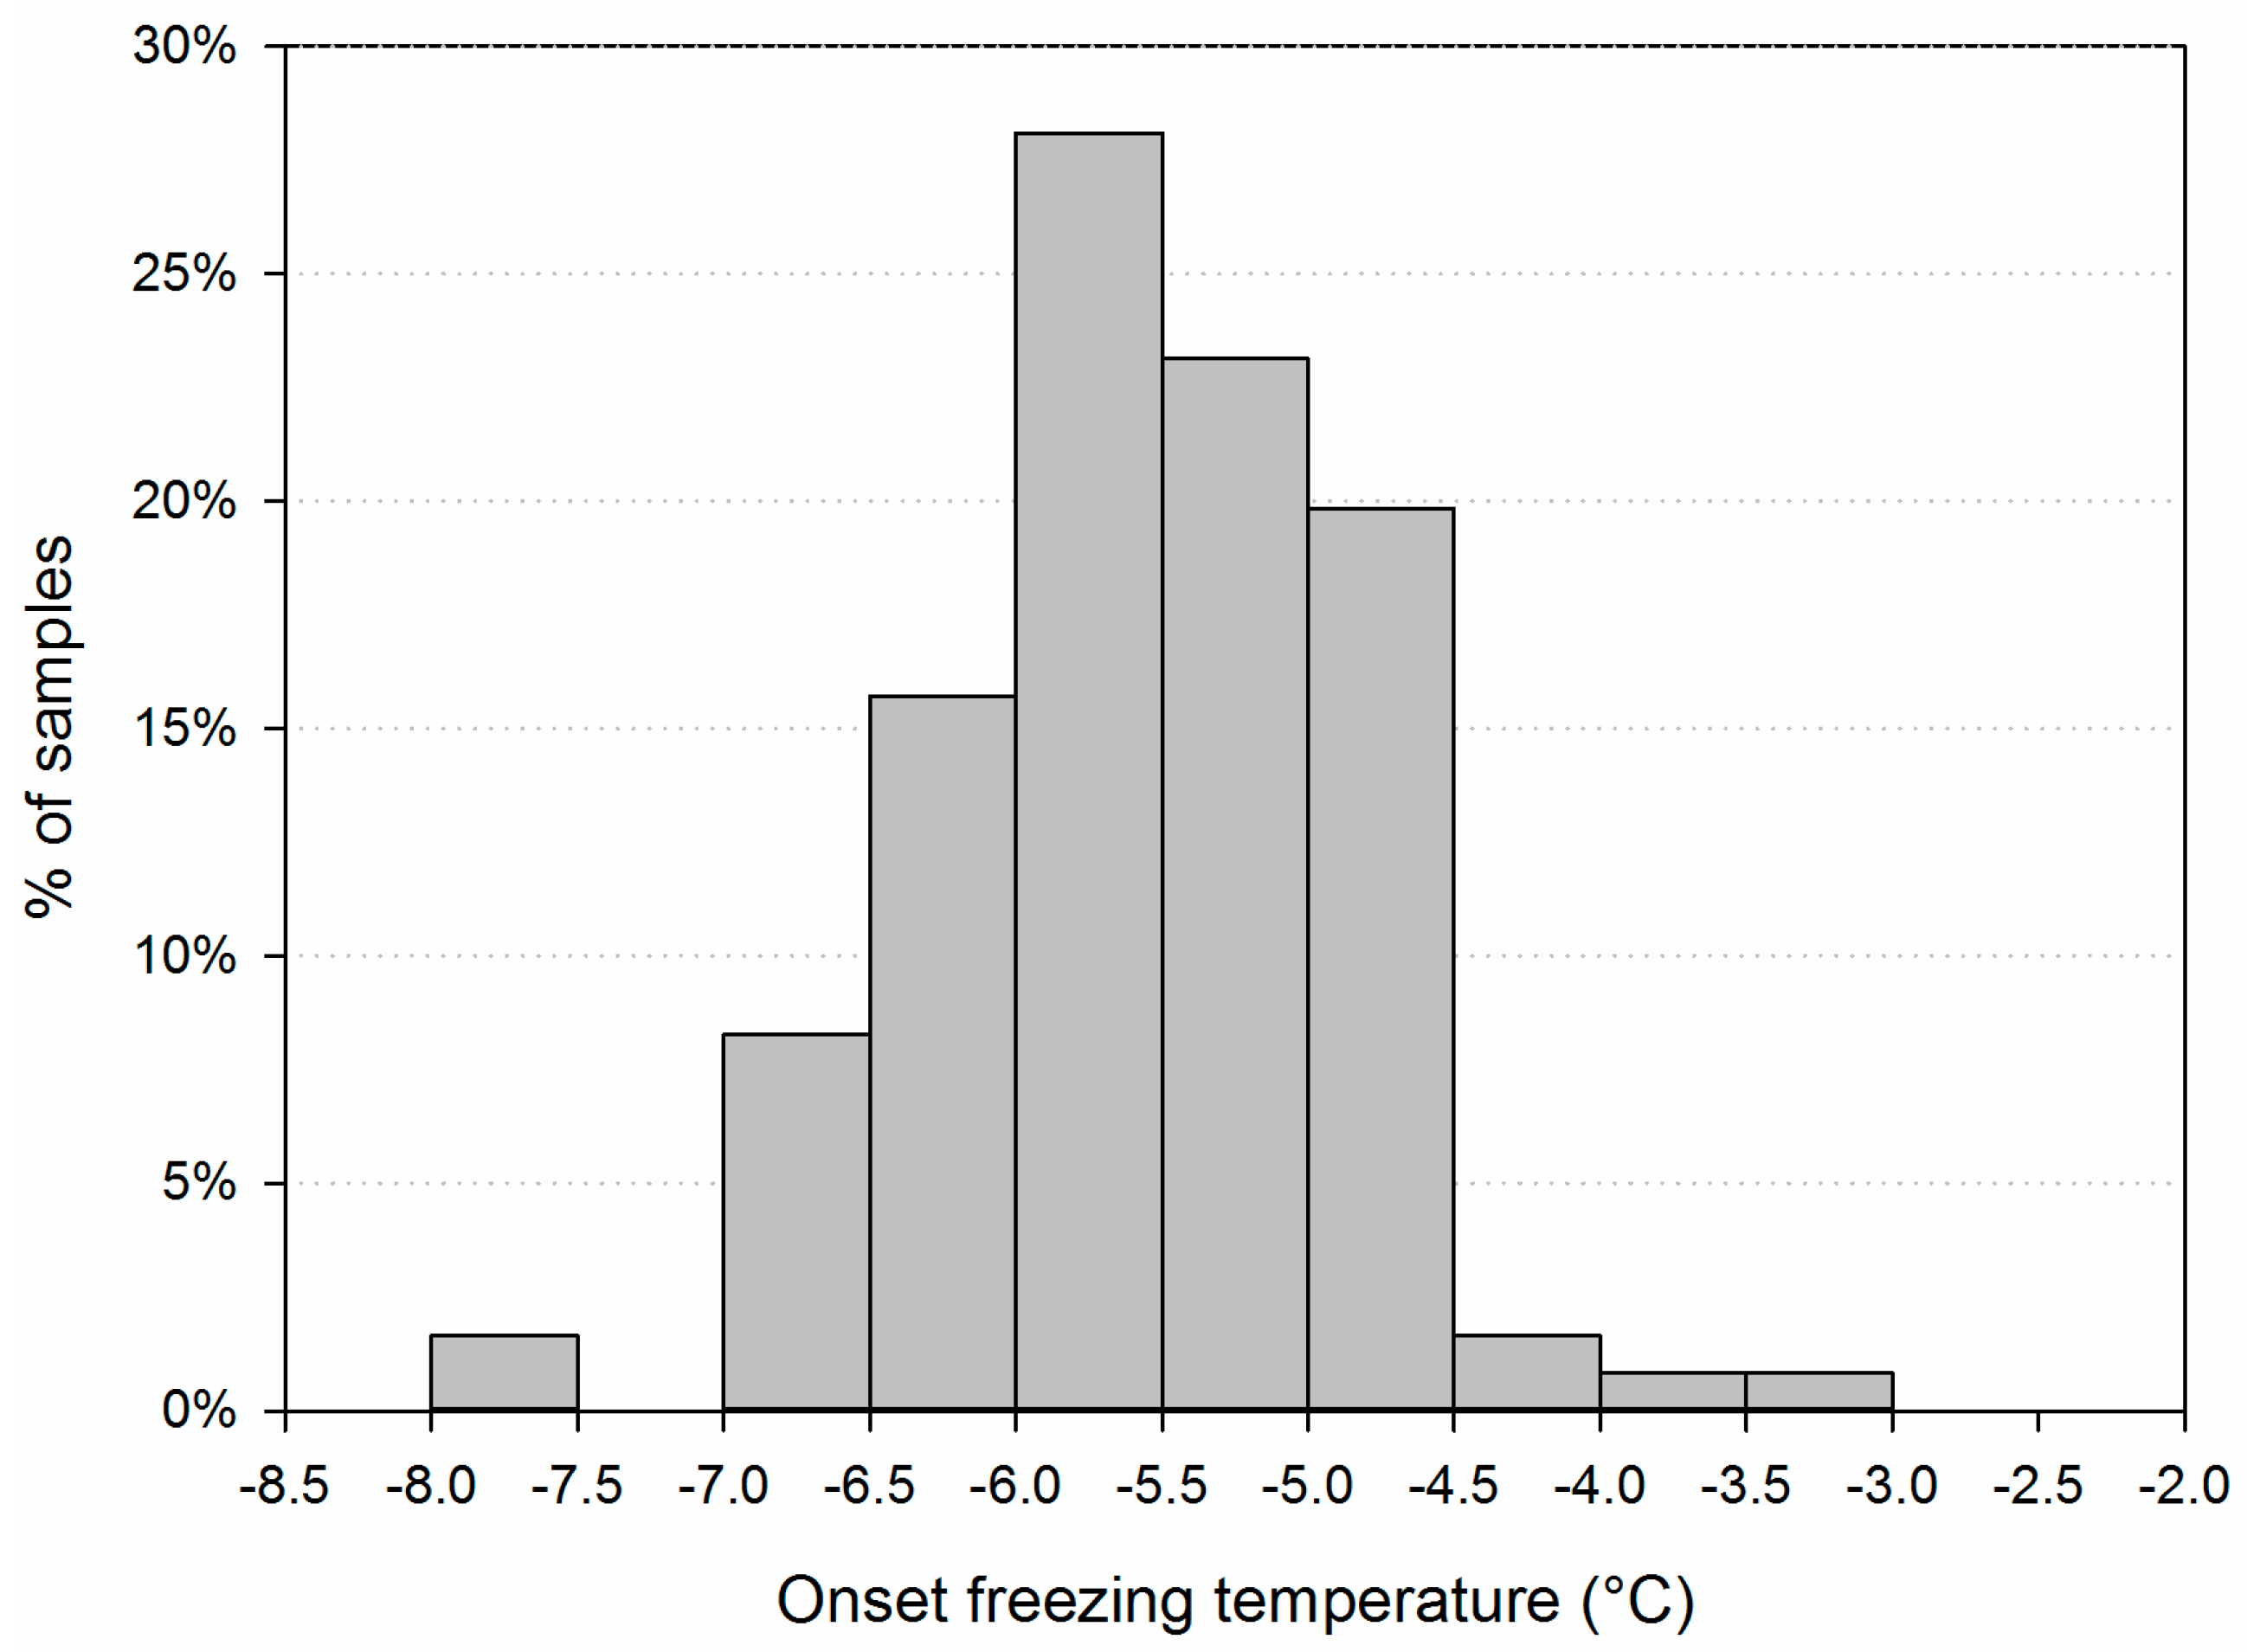
3.1. Main Characteristics of the Samples

During the period between 30 September 2015 and 11 June 2017 (620 days), a total of 421 days were investigated; 138 of these had precipitation events, and 121 of them were analyzed for INPs. The dataset investigated is summarized in Table 1, and presented in its entirety in the Supplementary Materials (Table S1); the cumulative freezing profiles are synthesized in Figure 1, and the corresponding individual freezing profiles are shown in Figure S1.
INP concentration increased exponentially with decreasing temperature, as usually observed (e.g., [6,20]); values spanned in general over two orders of magnitude at each temperature depending on the sample, with ranges from <0.1 to 1 mL−1 at temperatures ≥−5 °C, from ~0.1 to ~10 mL−1 between −5 °C and −8 °C, and from ~1 to ~100 down to −14 °C (Figure 1). Sample values at any temperature between −4.5 °C to −12 °C were normally distributed (Shapiro–Wilk test; n = 121; p < 0.01).
The temperature at which the first freezing event was observed under our experimental conditions (“onset freezing temperature”) corresponds to our limit of quantification (0.1 INP mL−1). This occurred at temperatures between −3 °C and −7.5 °C, on average over the 121 samples at −5.3 °C ± 0.7 °C (Figure 2) (normality verified by Shapiro–Wilk test; n = 121; p = 9 × 10⁻⁵); it was strongly linked with the concentration of INP measured at colder temperatures (Pearson test; p < 0.001; n = 121). Such high freezing temperatures indicate that the particles responsible for freezing were biological [4,5,6,44,45]. At −7 °C (INP−7), more than 90% of the samples had started freezing and INP concentration was on average 2.05 ± 2.17 mL−1 (±standard error); the concentrations measured at this temperature were used for further statistical analyses.

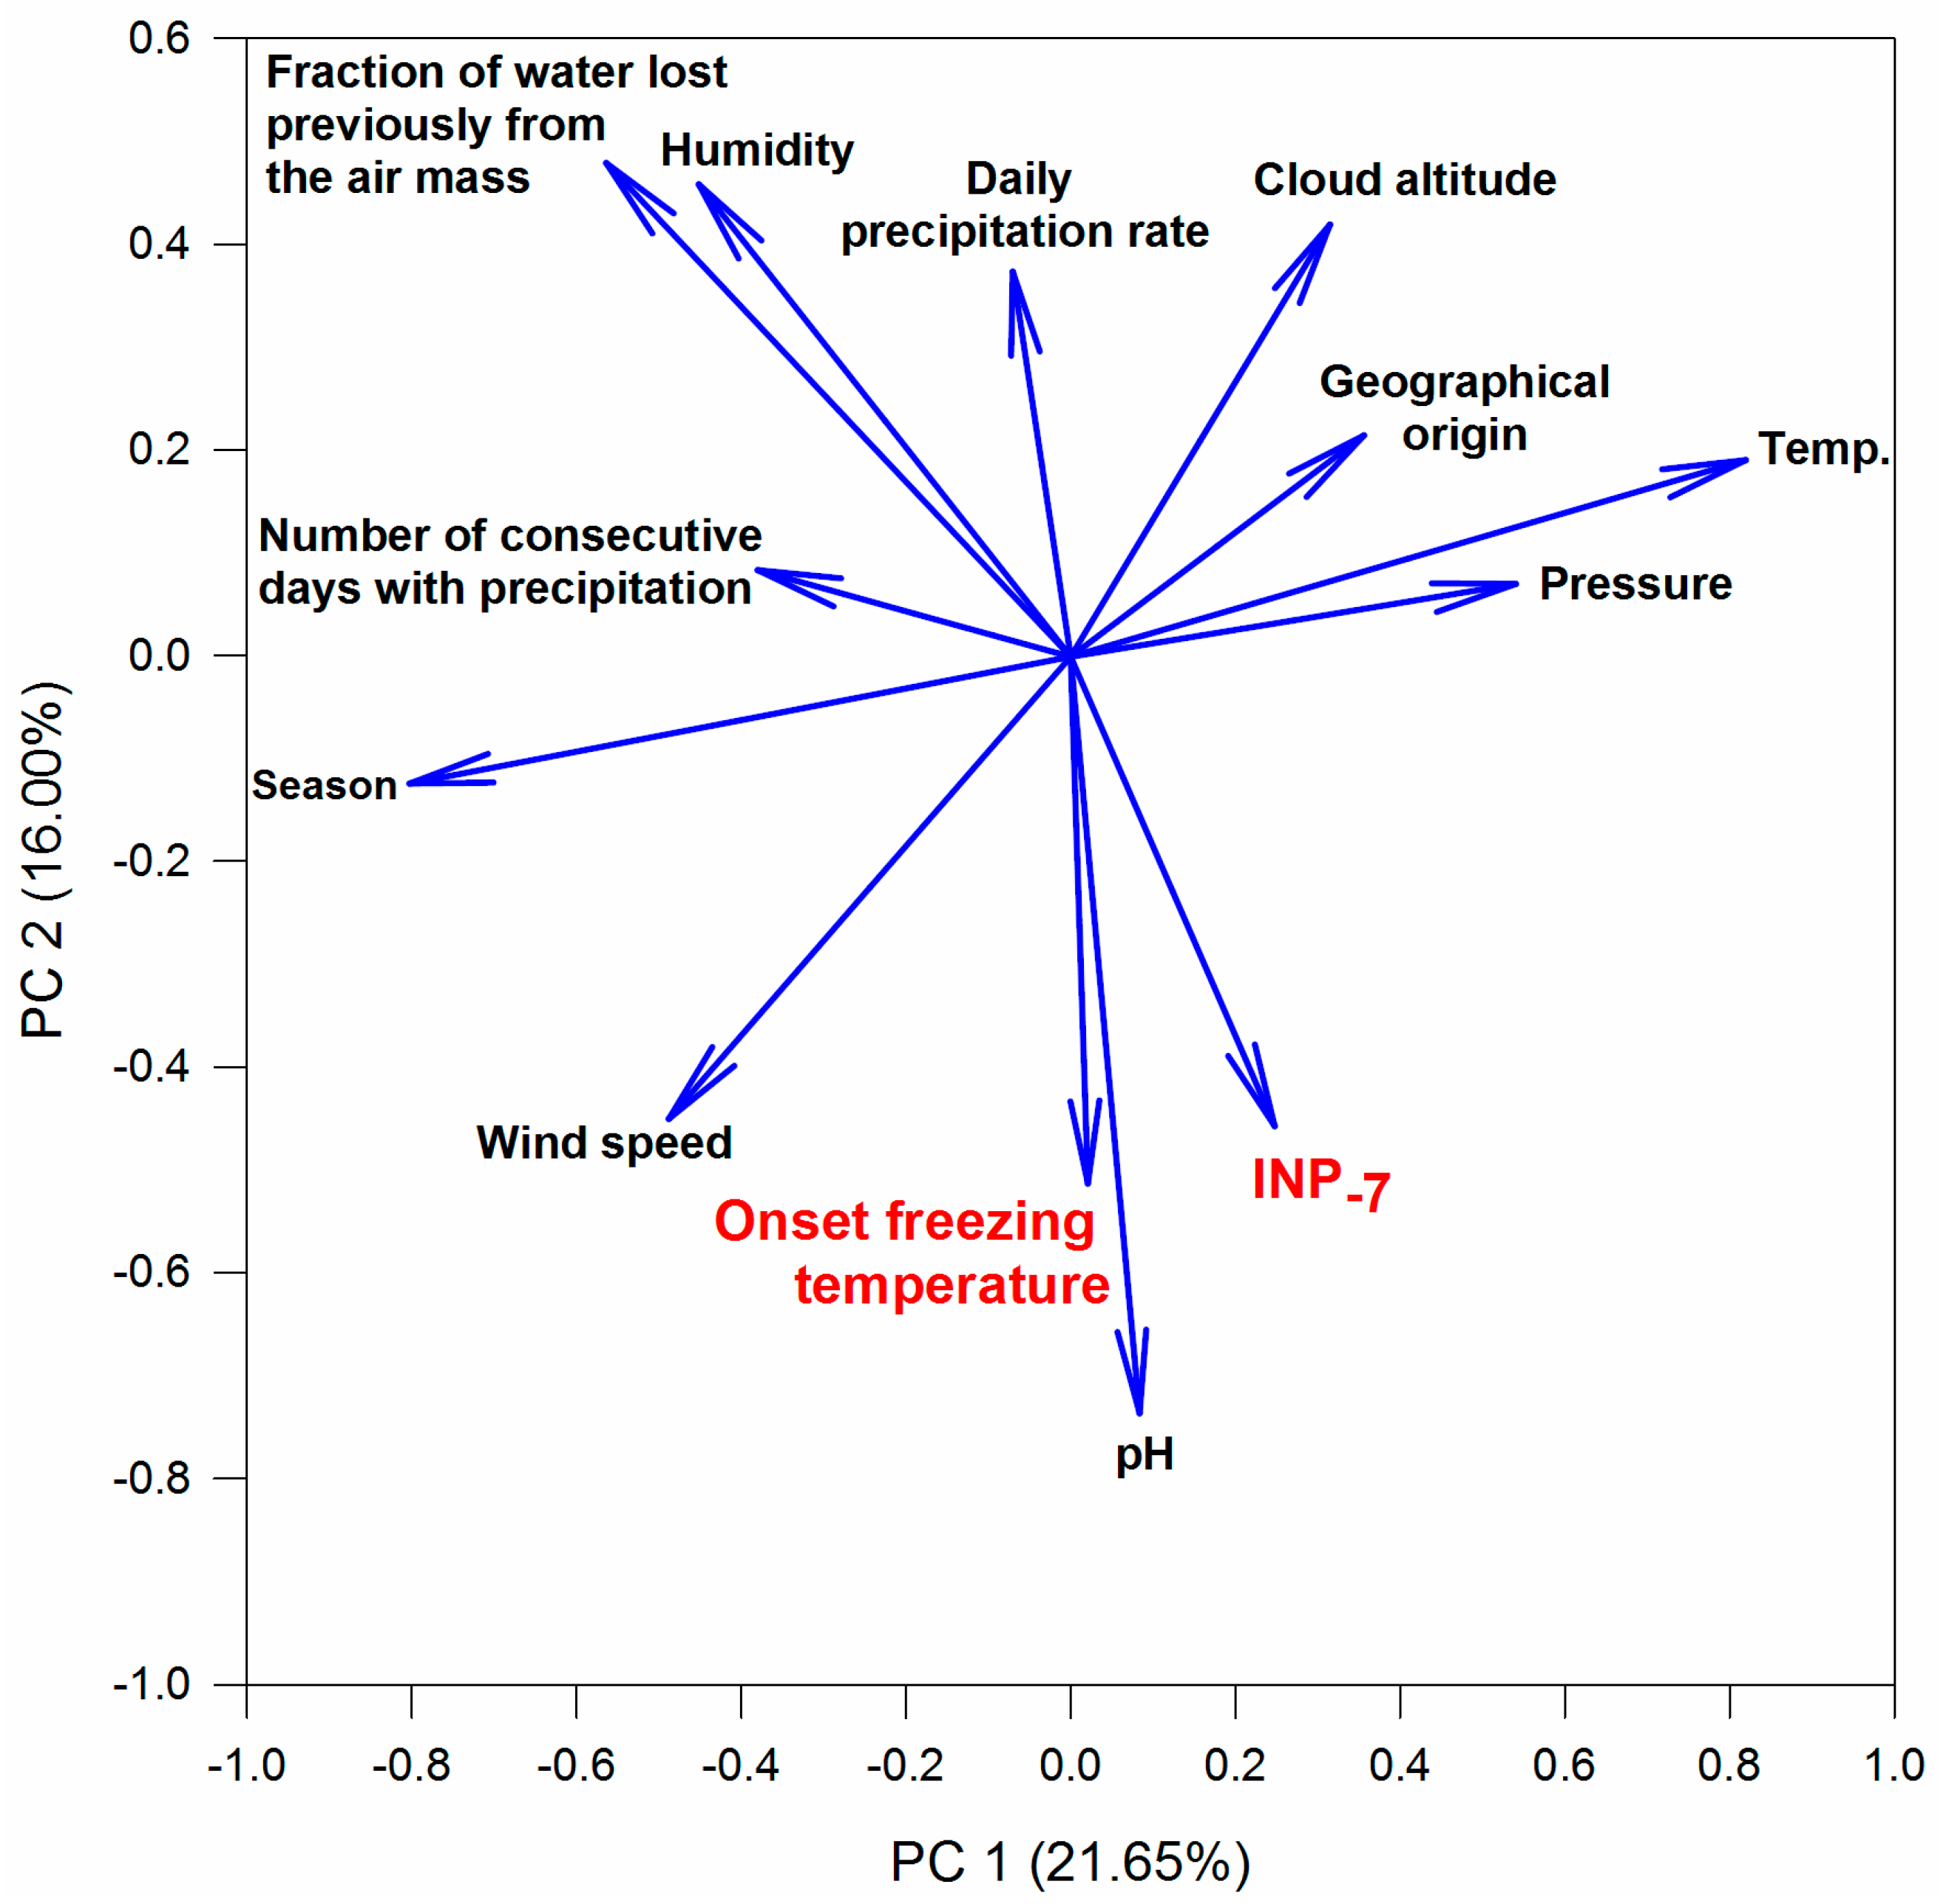
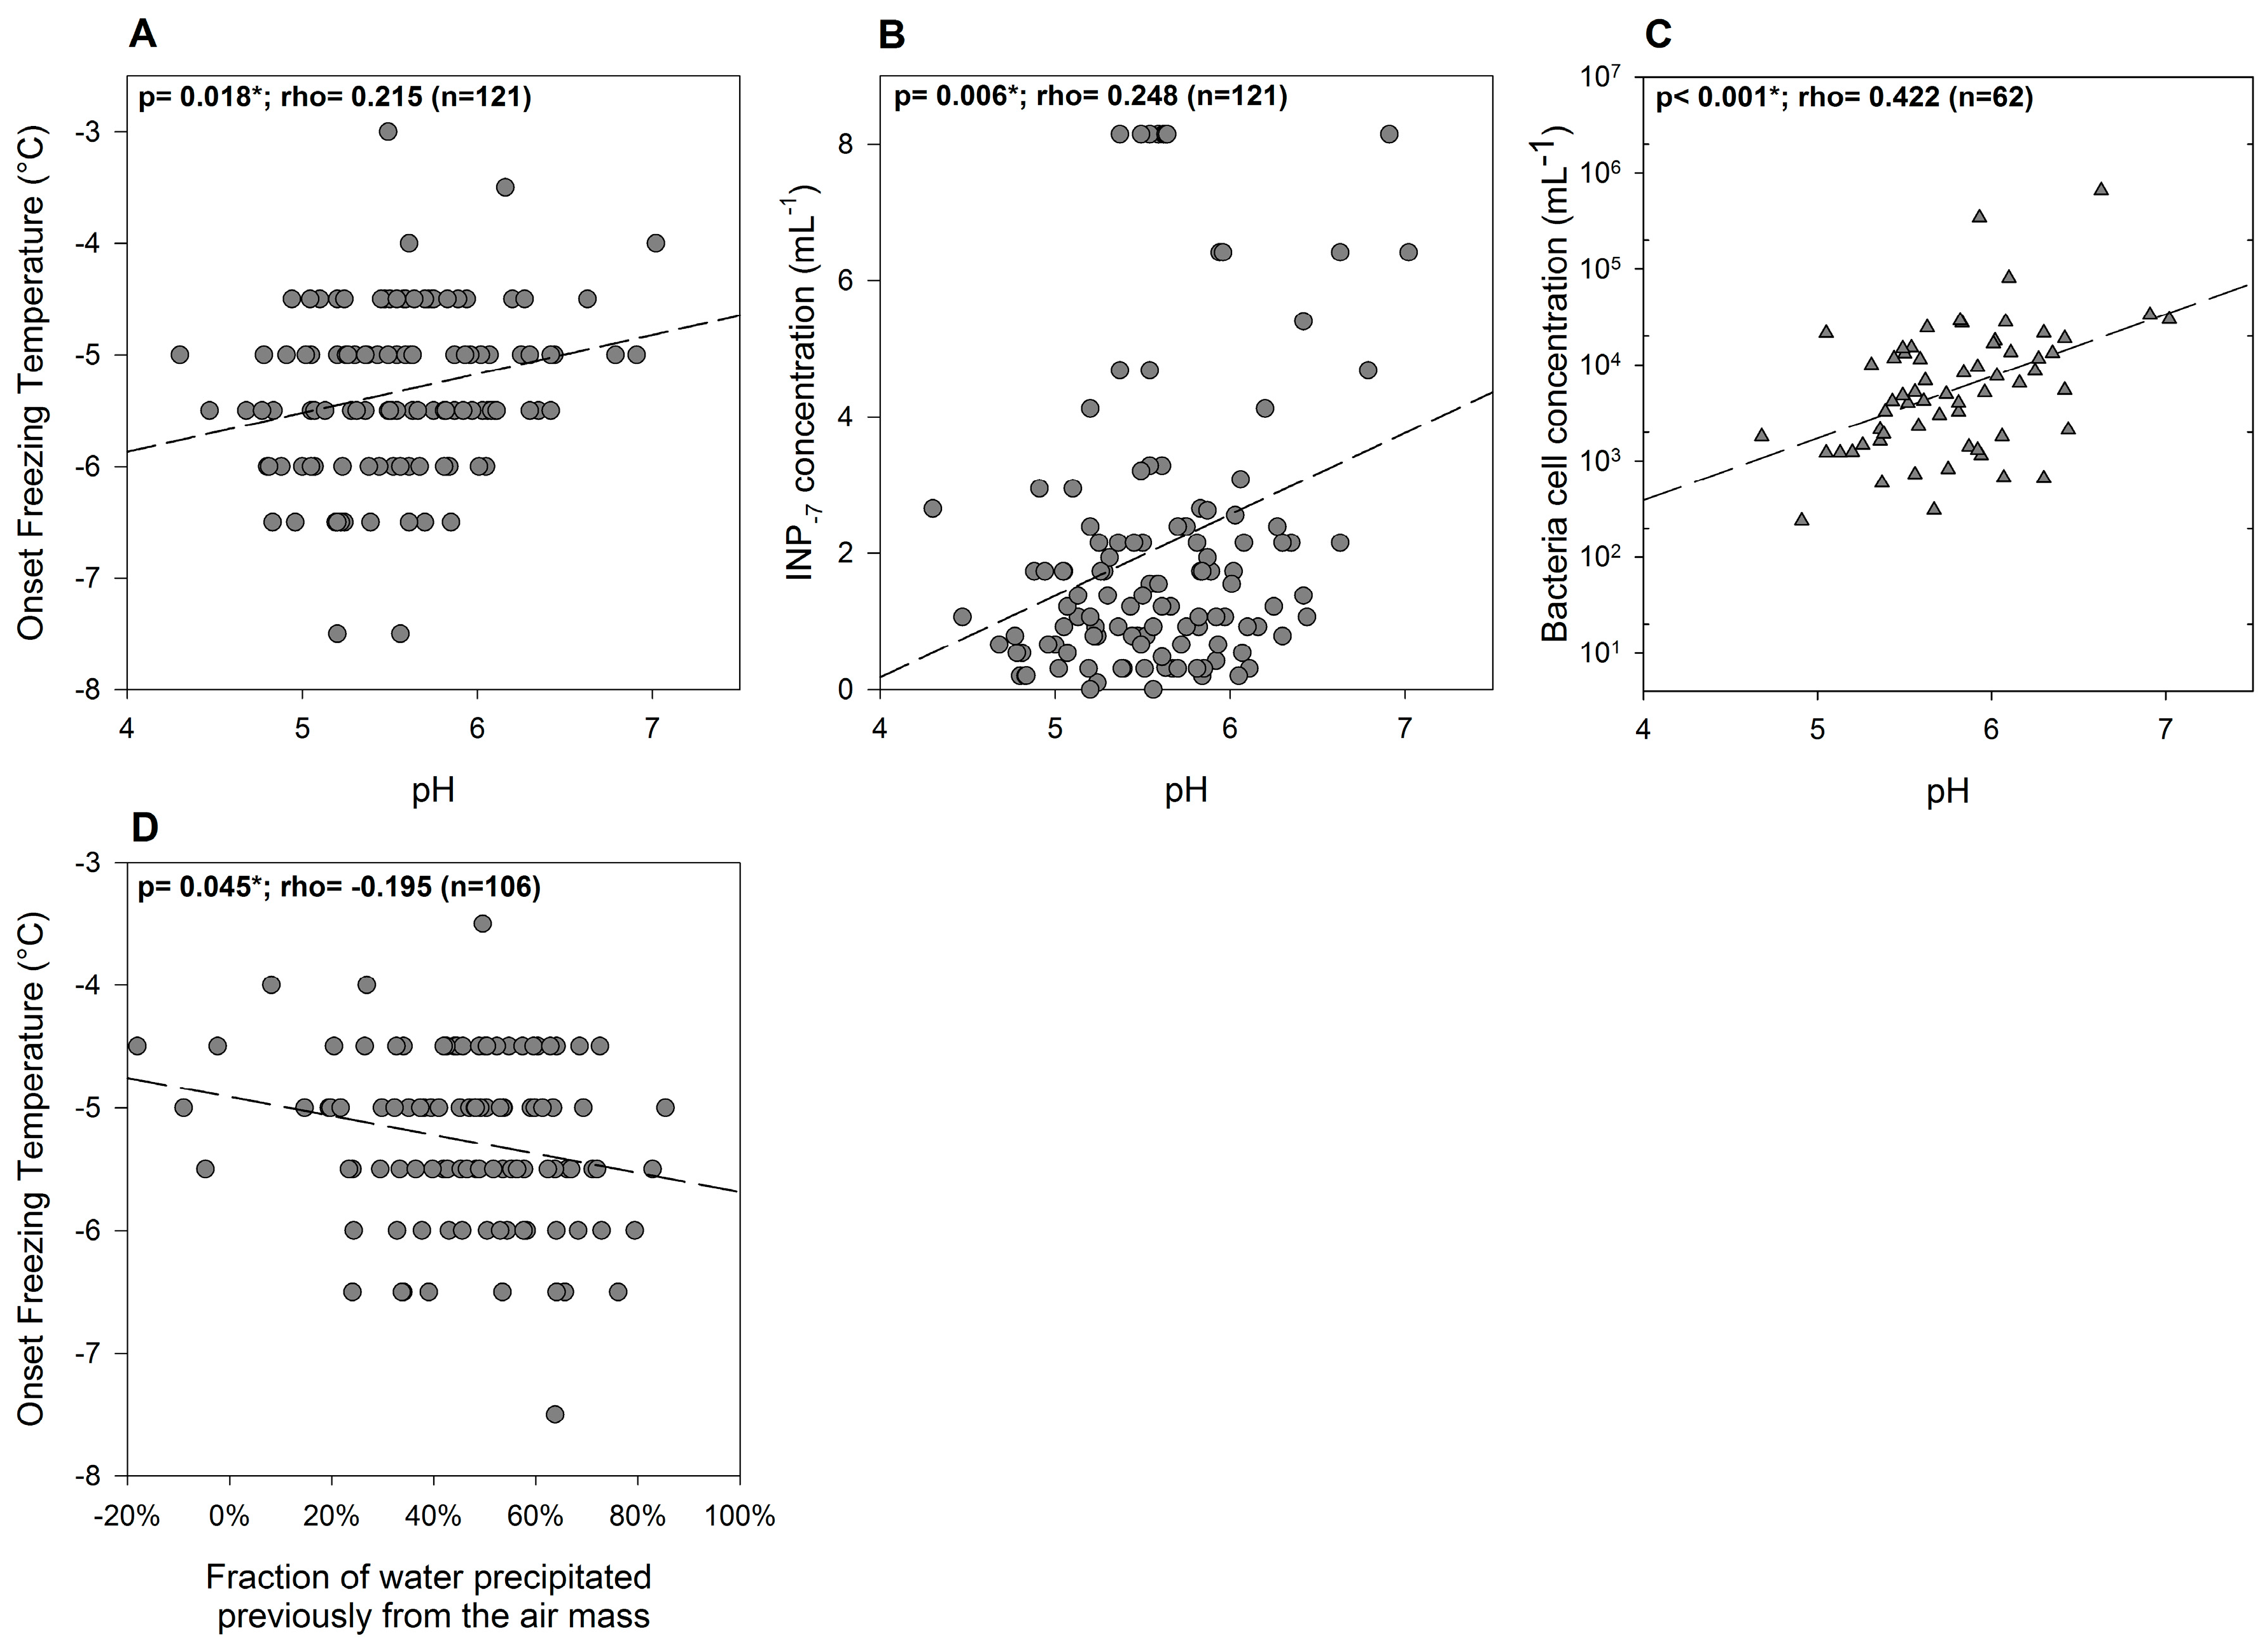
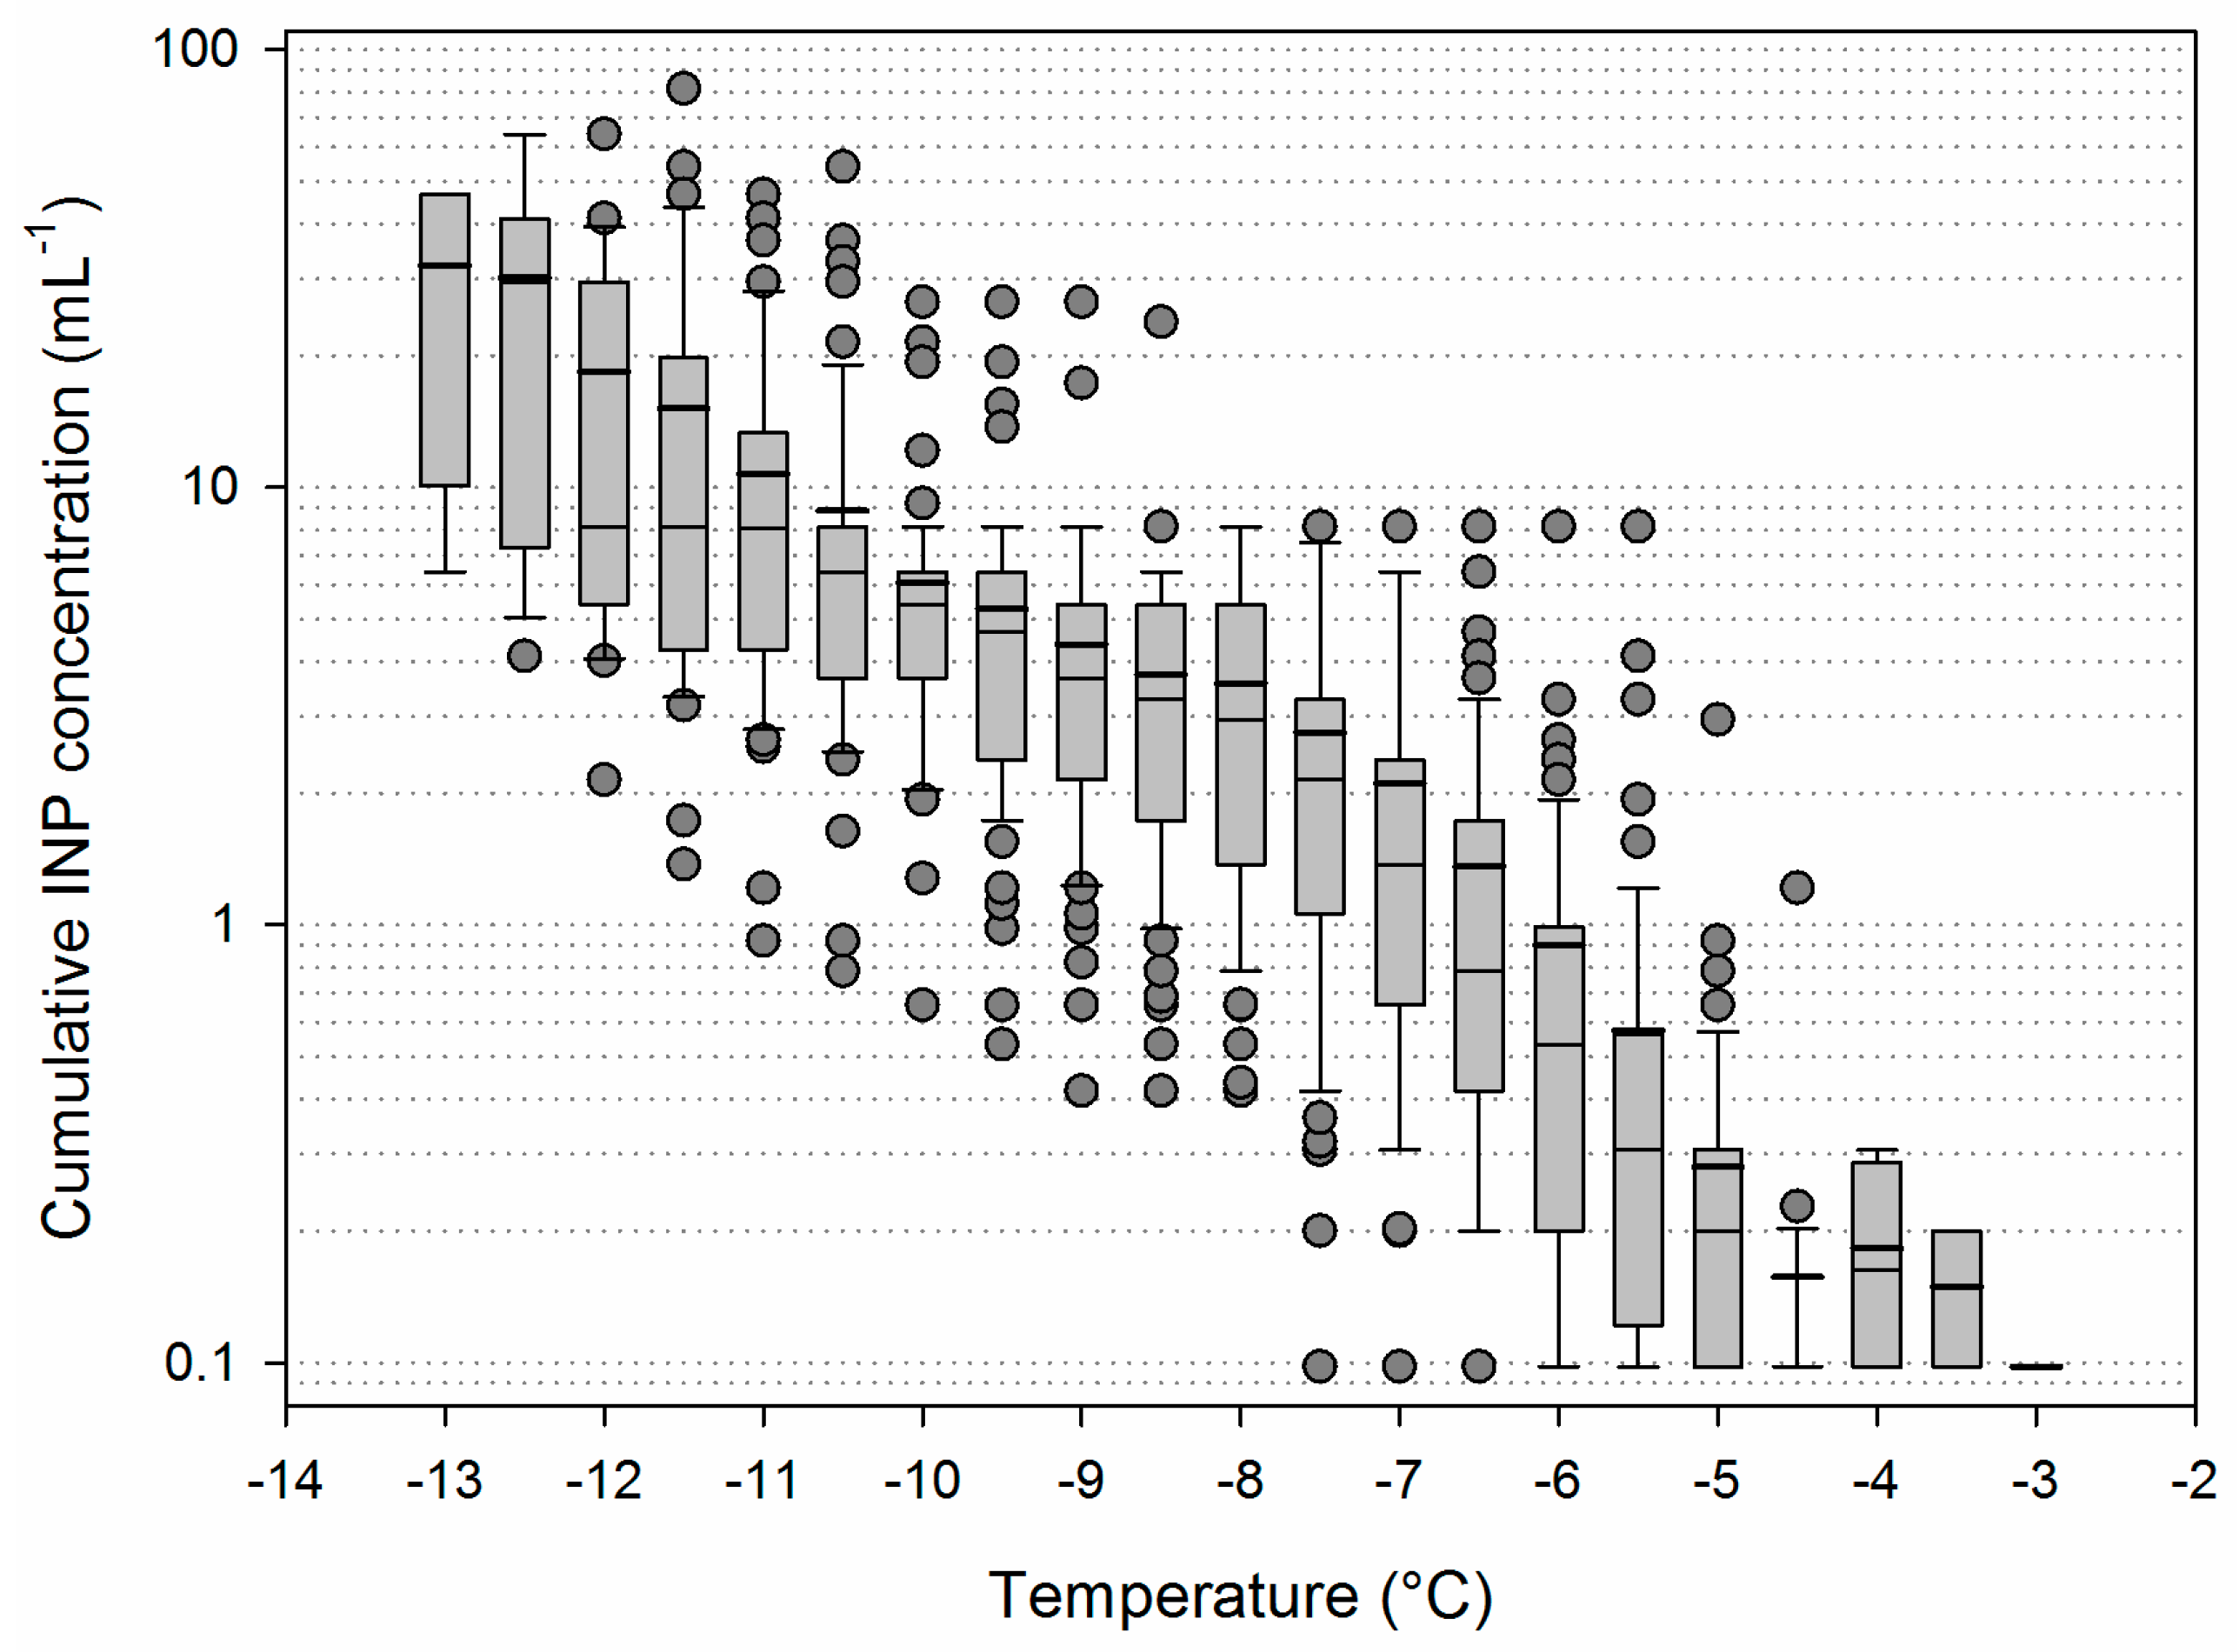
3.2. Variability of INP Concentration and Links with Environmental Variables

In this study, we documented the climatology of the INP active at a warm temperature and tried to identify their environmental drivers, in order to improve knowledge and representation of their spatial and temporal distribution.
The freezing profiles of precipitation varied widely between precipitation events, at a short time scale. For example, on the 4 October 2015 we recovered a sample of ~35 mL of water having freezing properties among the weakest observed in this study (see Table S1 and Figure S2), with an onset freezing temperature of −6.5 °C and as low as 0.2 INP−7 mL−1. On the day after (5 October 2015), the rainfall was about three times more abundant and a volume of ~100 mL was recovered; the onset freezing temperature under the same experimental conditions had risen to −4.5 °C, and rather than being more diluted by the larger volume of water, the sample had one order of magnitude high concentration of INP−7. Similarly, the two samples with the most extreme high and low freezing characteristics were both collected in spring 2017, on the 19 and 31 May. While the first sample started freezing at −7.5 °C, so no INP−7 was detected, the second froze at −3 °C and had ≥8.15 INP mL−1 at −5.5 °C. Between these contrasting examples, notably the origin of air masses had changed from Western to Eastern, and pH had risen closer to neutrality. In further statistical analyses, we explored the whole dataset in order to detect general trends that could best explain the variability of INP concentration observed in precipitation. Multivariate analysis (PCA) was carried out first, considering meteorological and temporal variables, and air mass characteristics when available, along with freezing parameters (INP−7 and onset freezing temperature). About 40% of the variance of the dataset was explained by the two first components, related mainly to temporal (season) and local meteorological (temperature and pressure) variables for the first one, and with the influence of sources and atmospheric processes for the second (pH, fraction of water lost previously from the air mass) (Figure 3). Freezing parameters themselves were related in particular to these latter variables, which does neither imply strict correlations with them, nor exclude specific influence of other parameters.
The correlation between each individual variable was further examined by a non-parametric Spearman Rank correlation test. The correlation matrix is shown as Supplementary Material (Table S3). Results concerning the variability of freezing parameters in relation with season and with air mass characteristics are presented and discussed below.

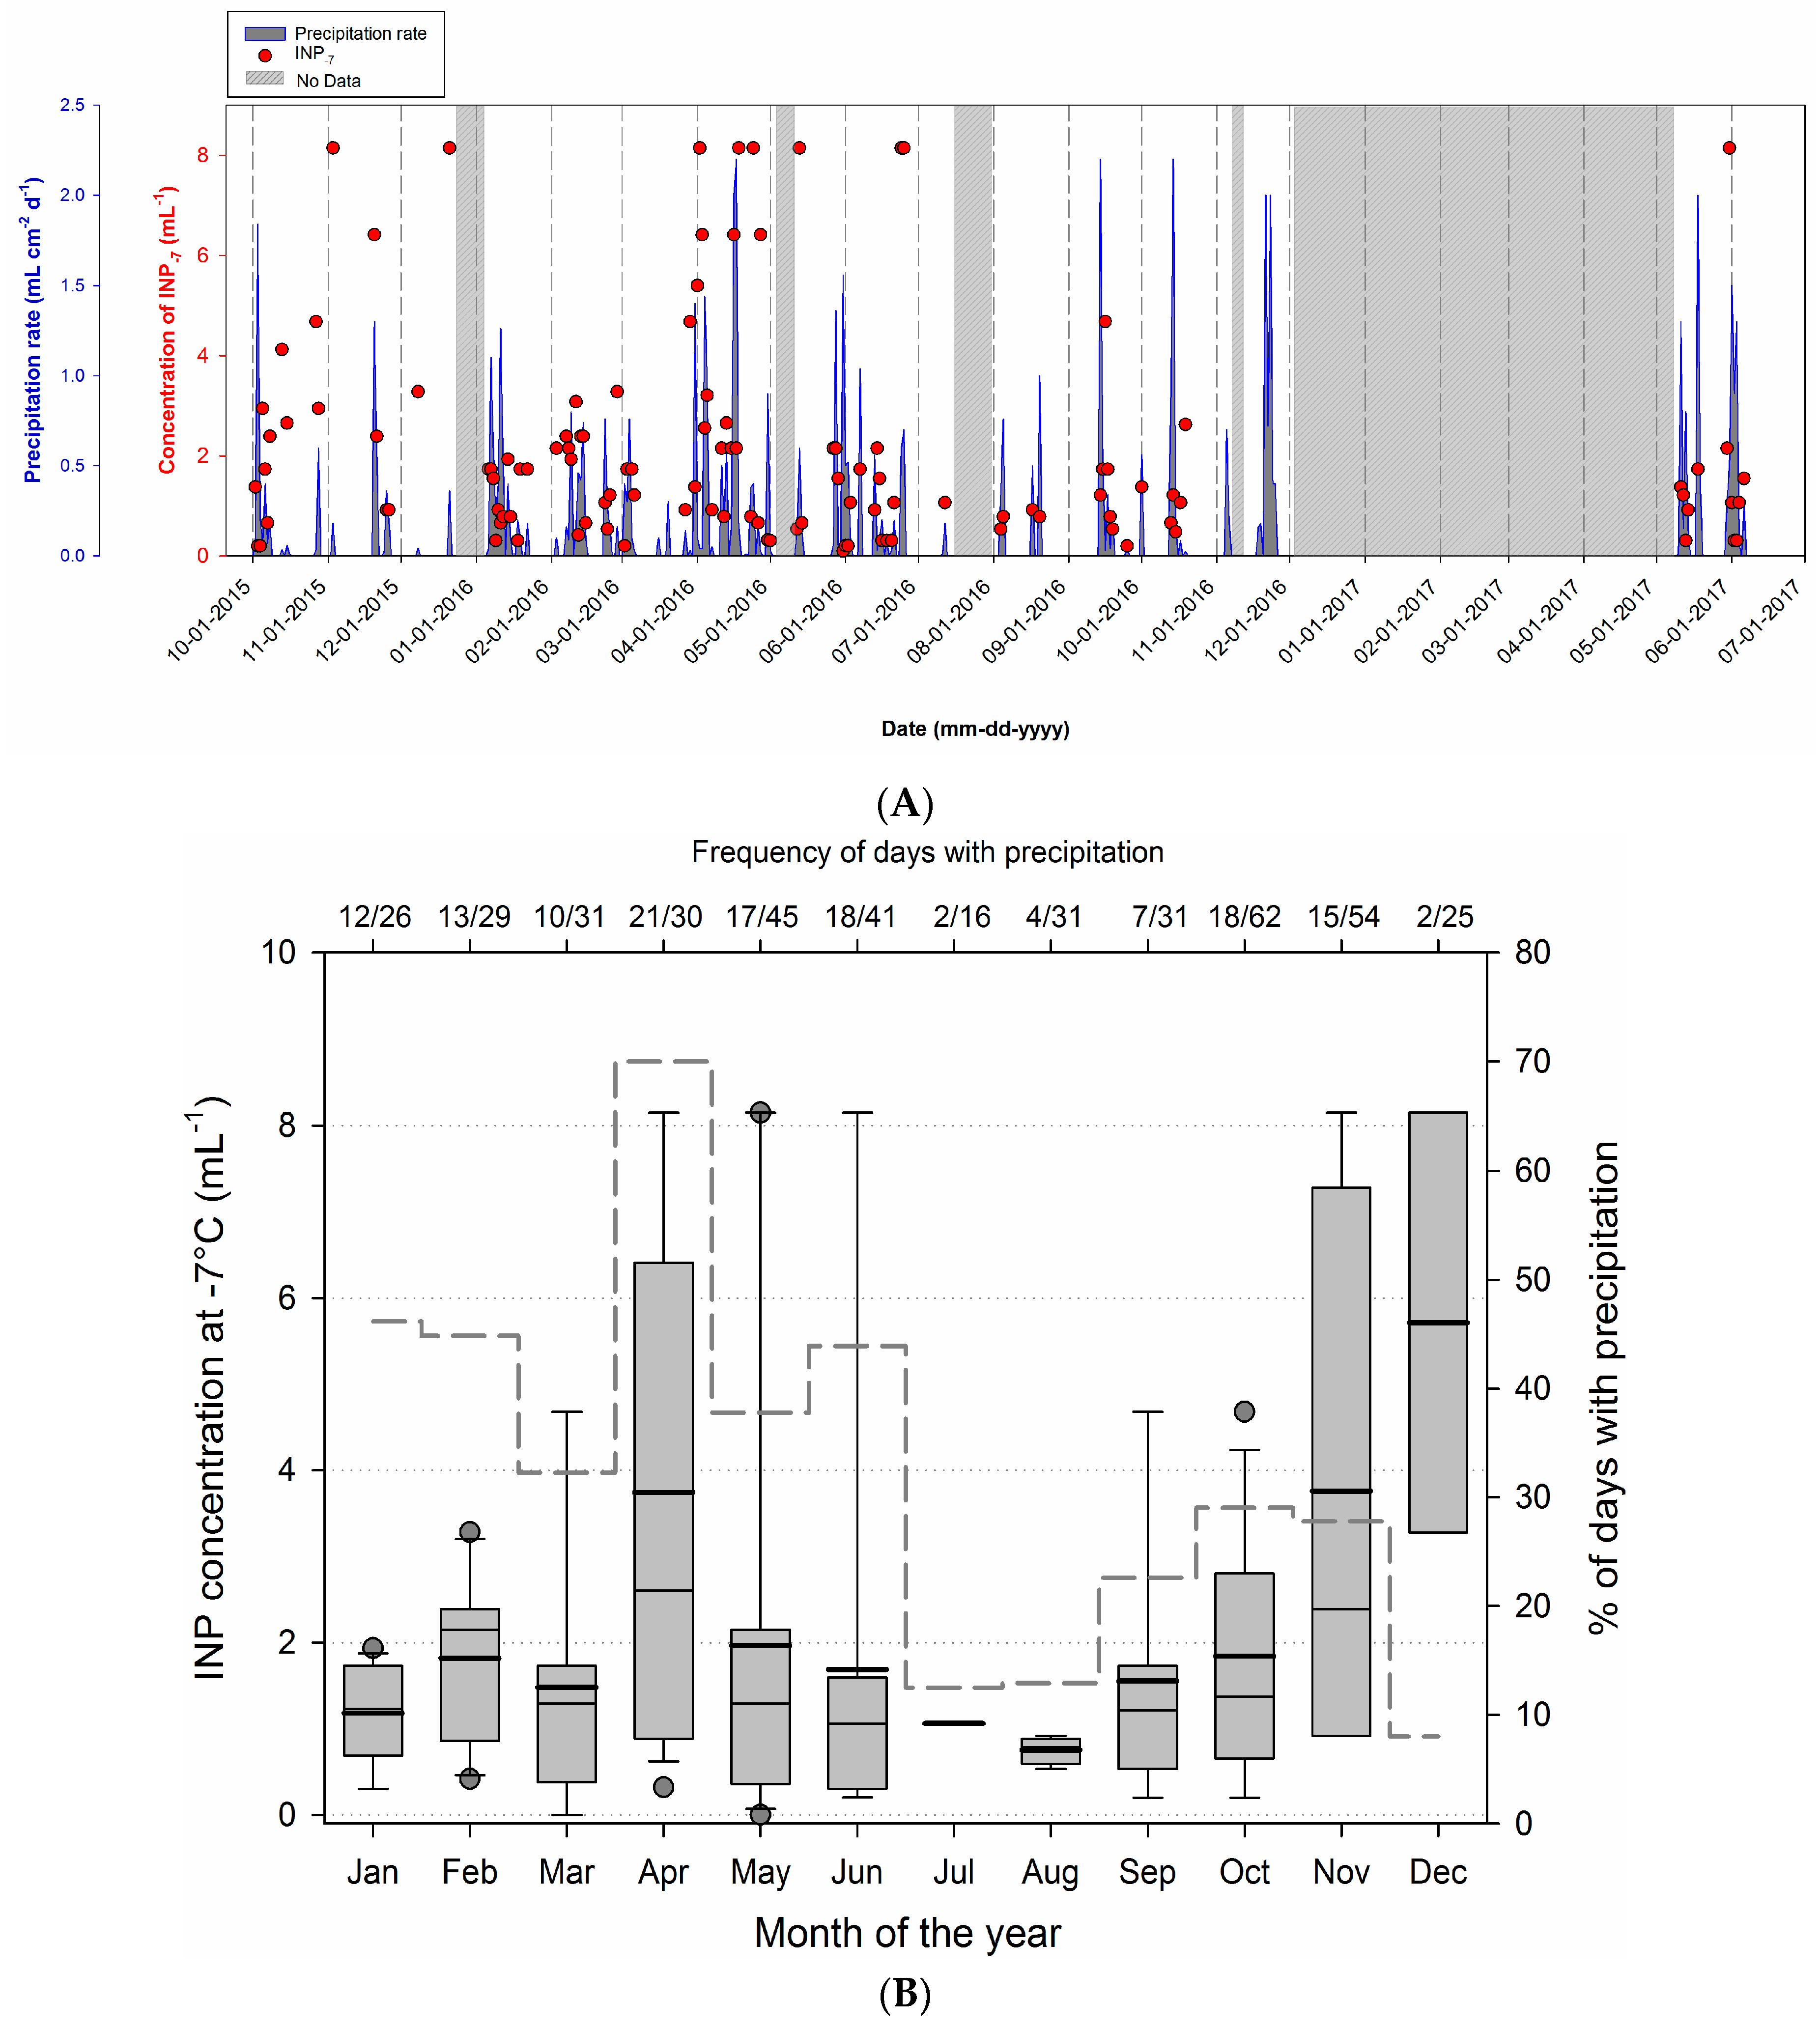
3.3. Temporal Variability

As expected, local meteorological variables were linked with season (p < 0.01), but the freezing characteristics of precipitation samples were found totally independent from these (p > 0.05). The temporal variability of INP−7 concentration in precipitation was examined on a monthly basis (Figure 4): It varied between 0.76 ± 0.16 mL−1 in August and 5.71 ± 3.44 mL−1 in December, with a peak in April at 3.74 ± 2.86 mL−1. The variability observed follows a trend generally similar to that of solutes (ions: nitrate, sulphate, ammonium, potassium) studied earlier at this site [47].
The frequency of rainy days on a monthly basis during the period considered in our study varied between 0.13 in July (=2/16; number of days with precipitation/total number of days considered for this calendar month over the entire sampling period), and 0.70 (21/30) in April (Table S2). Interestingly, from January to October, the frequency of rainy days was significantly and positively linearly correlated with the concentration of INP−7 in precipitation (Pearson’s R; p-value = 0.007; n = 13). This could result from the role of INP being active at high temperature in inducing precipitation, as demonstrated by numeric modeling [28], and/or by precipitation driving the aerosolization of biological INPs [10,48]. The seasonality of their abundance in the atmosphere is probably related with changes in the strength of sources, notably the phenology of vegetation [10], as it was already suggested in one of the earliest studies of biogenic INP in rainwater [49]. Links between aerosol number concentration or composition and the spatial and temporal distribution of precipitation are known. A recent study highlighted such a link based on 50 years of aerosol and rain measurements over China [50]. In Australia, Bigg and collaborators investigated the time series of several decades of rainfalls and INP concentration in the air; they observed feedbacks linking these two parameters: Land use influences precipitation frequency and quantity by modulating the abundance of airborne INPs, which in turn influence precipitation [27].

3.4. Relations between INPs, Origin of Air Mass and Precipitation Chemistry

Freezing characteristics, i.e., onset freezing temperature and/or INP−7 concentration, were correlated with the pH of precipitated water and with the fraction of water previously lost by precipitation from the air mass (Spearman correlations, p < 0.05; Figure 5 and Table S3). This suggests some controls of environmental drivers on INPs, from their sources toward precipitation. Unless indicated otherwise, in the following, statistics are results of Spearman rank correlation tests.
Rain carries particles and solutes from high altitudes to the ground. The material present in precipitation originates in part from the clouds, and also from aerosols scavenged on the path of falling drops, so its composition reflects both the composition of the clouds and of the air column underneath (e.g., [47,51,52]. Analyzing precipitation thus gives the unique possibility to access to large integrated atmospheric samples. Although it is not the purpose of this study to investigate long distance transport vs. local sources, we attempted to decipher the extent of these two origins in our observations. Methods have been derived from simultaneous observations of precipitation and aerosols and/or numeric modeling, notably at our sampling site and nearby [47]. It was evaluated that below-cloud scavenging can contribute 1/1000 up to half of the mass of a material present in precipitation water [51,53,54,55], depending on particle characteristics (size and solubility; higher scavenging efficiencies are observed for non-soluble particles and for particles <1 µm in diameter) and environmental context (height of the boundary layer above the sampling site, amount of precipitation, raindrop size, duration of the dry period preceding precipitation). Marked wash-out tends to cause higher concentrations in lightest rain-falls and/or after longer periods of consecutive dry days [51]. Here, the concentration of INP−7 was independent (p > 0.05) from both the number of consecutive days with precipitation and from the daily precipitation rate (Table S3). Conversely, microbial cells were diluted in heavy rainfalls compared with slight precipitation events (p = 0.01 with the daily precipitation rate; n = 62; Table S3). This indicated a notable contribution of wash-out processes to the pool of microbial cells observed in precipitation, as proposed earlier [52], but no or negligible influence on INPs.
In our dataset, 81 precipitating events were associated with air masses originating from the West (Atlantic Ocean), 23 from the South (Mediterranean Sea) and 17 from the East (Continent). The freezing characteristics were not statistically different between these geographical origins (ANOVA, Kruskal–Wallis’ test, p > 0.05). Major ion concentrations were in the range ~0.5–50 µM, dominated by NH4+, NO3 and Ca2+ (n = 19), and pH ranged from 4.3 to 7.0 (n = 121). Ion concentrations were generally all positively correlated with one another, independent of air mass origin, with the sectorization used, as well as from the freezing characteristics of the samples (Table S3). In turn, acidic pH was strongly linked with a decrease in both the onset freezing temperature and INP−7 concentration (p < 0.02; Figure 5). Acidic pH in atmospheric waters often results from anthropogenic releases (e.g., [56]). This observation suggests that human activities that result in rain acidification are unlikely to release biological INPs. Additionally, we cannot exclude that they could have a negative influence on the freezing capacity of biological INPs, and thus possibly subsequent impacts on precipitation. Here, as we have investigated precipitation and not cloud water, we cannot directly compare the probability of acidic clouds with that of more neutral clouds to precipitate, In the laboratory, the ice nucleation activity of bacteria in a culture was found previously to be decreased under acidic conditions (pH 4.1 vs. pH 5.9), in particular at the highest temperatures [57], as well as were cell-free ice nuclei derived from bacteria [58]. The presence of ammonium sulfate was also shown to affect the ice nucleation activity of bacterial cells aerosolized in cloud simulation chamber [59]. Modifications of the surface properties of particles (coating, charges) could be responsible for these observations [60].
Although no direct correlation of bacterial cell concentration with the freezing parameters was observed in our data (p > 0.17; n = 62; Table S3), it was also strongly linked with pH (p < 0.001; n = 62) and season, with more cells during the warmest periods of the year; these features were both observed earlier in the air and clouds, notably by our group at this location [61,62,63]. These indirect relationships suggest that a fraction of the biological particles involved in freezing could be ice-nucleation active bacterial cells, but the absence of a direct correlation also indicates that they represent an insignificant (in the statistical sense) number of individuals in the total airborne bacterial community (e.g., [11,12]).
The proportion of water lost from the air mass prior the collection of our precipitation samples, as inferred from the isotopic signature, ranged from −0.181 to 0.85 (0.47 ± 0.19 in average). Small negative values are due to measurement uncertainty and, possibly, a failure in these cases of our assumption that isotope ratios remain unaltered along the path of precipitation between cloud and collector. It was observed earlier at the high altitude research station Jungfraujoch, Switzerland, that INPs active at warm temperatures are preferentially precipitated, compared to other particles of comparable size, supporting the idea that they play a role in inducing precipitation [24]. Here, this idea is supported by a correlation between the fraction of vapor lost and the onset freezing temperature (p = 0.045; n = 106), which tends to decrease when more water has been lost (likely along with the most efficient INPs). However, unlike the study on Jungfraujoch, we did not find a correlation with the concentration of INP−7.

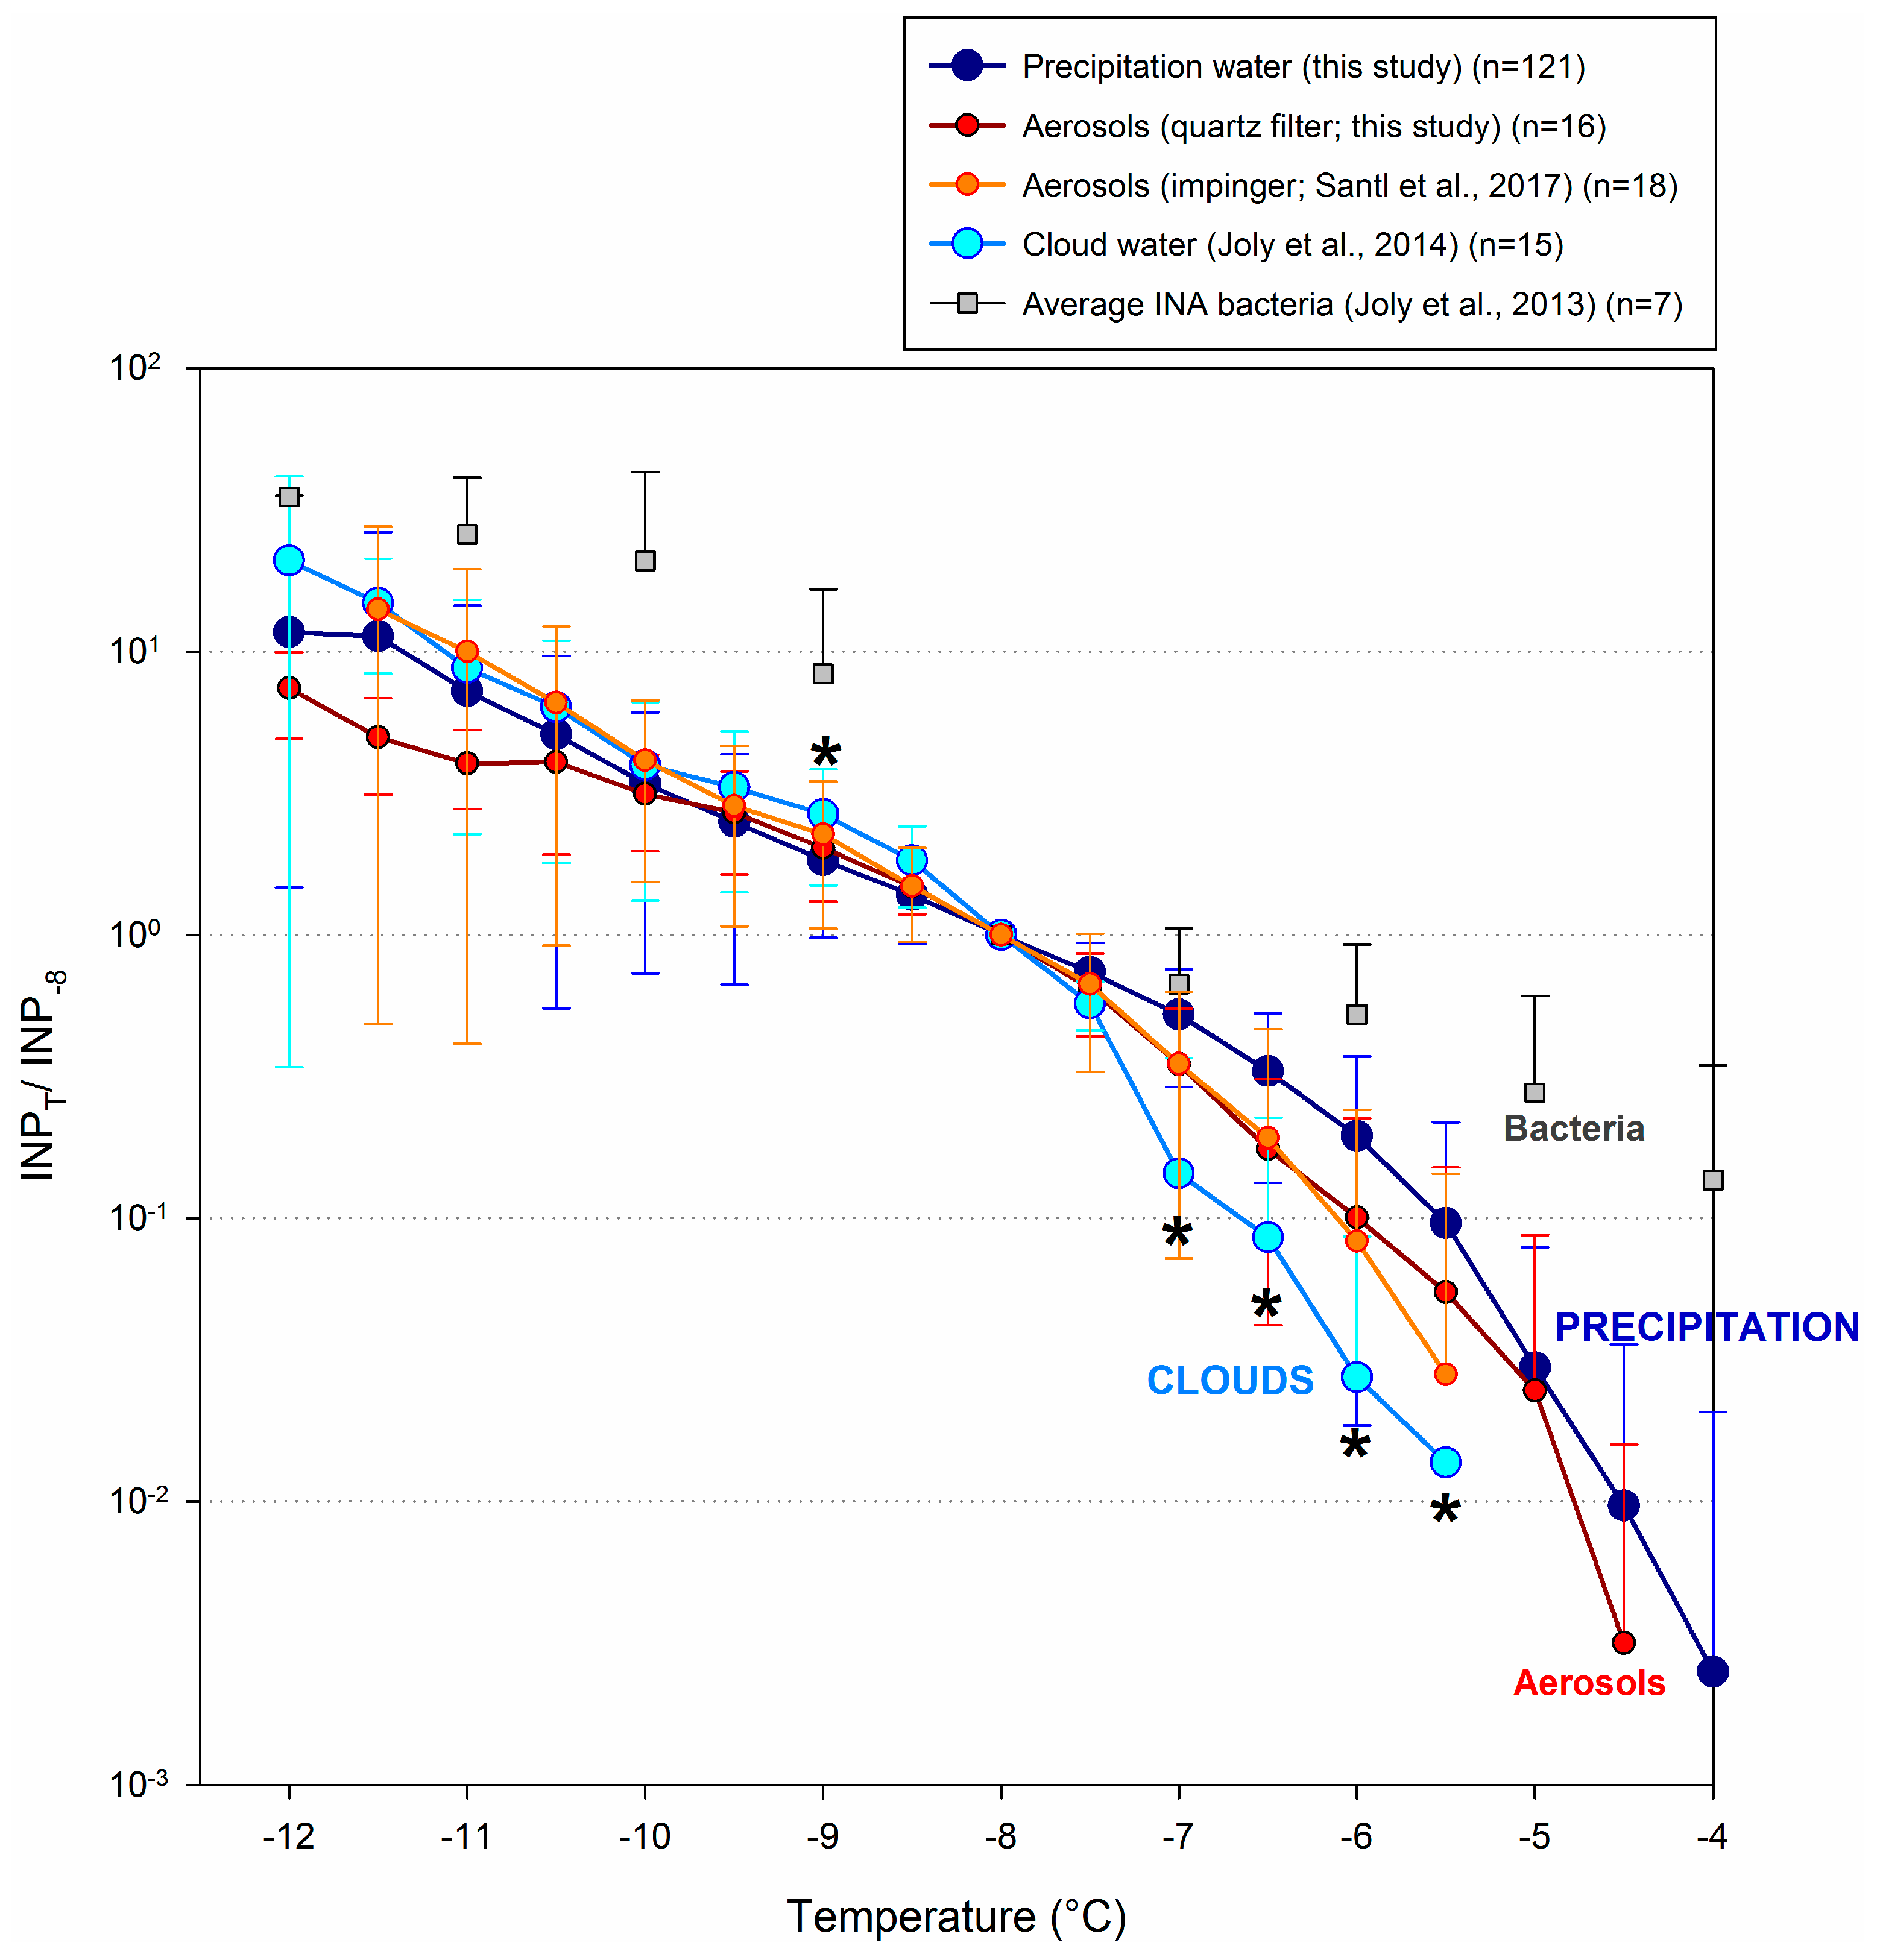
3.5. Comparison with Other Atmospheric Components

Major ion concentrations in the precipitation samples were generally in the range ~0.5–50 µM, dominated by NH4+, NO3 and Ca2+, and bacterial cell concentration varied between 2.4 × 10² and 6.6 × 10⁵ mL−1 (Table 1). Chemicals and particles are known to be generally more concentrated in the early stages of a forming cloud than in precipitation due to dilution by addition of condensing water as the cloud develops towards a precipitating stage (e.g., [47,64]). Consistently, the concentrations of ions, cells and INPs were on average more dilute in precipitation compared with cloud water, by a factor of ~2 to ~10, although not all significantly (Figure S3). Notably Na+ and Mg2+ were significantly less concentrated in precipitation than they were in cloud water, but the concentrations of NO3 and SO42−, as well as those of cells, were not different, indicative of different processing behaviors (in-cloud partitioning [65] and/or below-cloud scavenging [55]) between these species. Concerning INPs, at the temperature of −8 °C (temperature at which data are available for both clouds and precipitation), the concentrations measured in cloud water (<0.1 to 75 INP−8 mL−1; n = 12; [6]) were not different from those measured in precipitation (0.42 to >8.15 mL−1, n = 121) (p > 0.05; Mann-Whitney test) (Figure S3). This suggests a relative enrichment in precipitation compared with, notably, microbial cells, which were found more dilute in precipitation than in cloud water (110–661,000 mL−1 vs. 3300–244,000 mL−1, respectively [30]).
Theories and observations indicate that INPs can be responsible for triggering precipitation [24,28]. In particular the most efficient of them, i.e., those acting at the warmest temperatures, should be relatively enriched in precipitating water compared with their relative abundance in aerosols or clouds, respect to other compounds, particles and less efficient INPs [24,59,66]. For investigating the processing, i.e., the specific behavior, of INPs in the atmosphere, we statistically compared our data with others measurements carried out at nearby, at puy de Dôme Mountain Observatory (1465 m a.s.l.), in clouds and aerosols in the frame of other studies [6,30,32]. In addition, INP concentration measurements were carried out on aerosols collected on a weekly basis in 2012 on quartz filter at the same site to account for different sampling methods. In order to compare the freezing profiles of precipitation with those of cloud water and aerosols while avoiding the influence of dilution, INP concentration data at the temperature T (INPT) were normalized by the concentration measured in the same sample at −8 °C (INP−8), i.e., the warmest temperature at which INP concentration was within the quantification range for most samples in all the datasets. The average value of INP−8 was not different between precipitation and clouds, as mentioned above (Figure S3). The normalization of INP data allows revealing the relative contribution of different categories of INPs to the raw corresponding freezing profiles. The resulting normalized average cumulative freezing profiles of precipitation from Opme station, aerosols and cloud water from puy de Dôme are presented in Figure 6.
The relative average freezing profiles of ice nucleation active (INA) bacteria strains, the most active natural INP known, are also plotted here for comparison; these were isolated by culture from cloud water collected at puy de Dôme [11]. The relative contribution of INPs active at temperatures ≥−7 °C and at −9 °C was significantly lower in clouds than it was in precipitation (Mann–Whitney test, p < 0.05), while it was similar at colder temperatures. This clearly indicates that precipitation was relatively enriched with the INPs active at the warmest temperatures. The profiles of aerosols were intermediate between those of clouds and precipitation, independently of the sampling method used (filtration or impingement). This demonstrates some extent of partitioning of INPs in the atmosphere depending on the temperature at which INPs catalyze ice formation, and involving water condensation, freezing and precipitation.
The most efficient INP known so far, INA bacteria (e.g., [8]), are probably affected by this processing. The bioprecipitation hypothesis proposed in the 1980’s directly related to this processing. The hypothesis proposed that biological particles such as bacteria can induce precipitation, and so accelerate their own deposition thanks to a better ice nucleation activity compared to other particle types [67]. Cultures and characterization of INA species of bacteria indicated that precipitation is indeed enriched with INA phenotypes as compared to plants and rivers, suggesting that these bacteria can take advantage of atmospheric transport and colonize distant environments. This phenomenon was also indirectly observed in the recent years by investigating freshly fallen precipitation at high altitude: INPs active at warm temperatures were found to be depleted when the air mass had already precipitated earlier elsewhere [24]. Similarly, experiments involving clone population of cultivated INA bacteria injected in cloud simulation chamber resulted in cloud freezing, then in precipitation; only the less efficient INA bacteria remained aloft after cloud evaporated [59].

4. Conclusions

Our mid-term and quasi systematic study of the freezing characteristics of precipitation allowed to establish links, some of which can be causal, between the distribution of biological INPs in the atmosphere and environmental characteristics. Our work also gives hints on how to investigate the role of INPs and their distribution over the globe in the future.
Several of these relationships support the actual role of biological INPs in inducing precipitation. Clear temporal variations were observed, at short term, and also in relation with the monthly frequency of precipitation occurring at the sampling site. In addition, acidification was evidenced to be linked with a diminution of the freezing capacity of the precipitation samples. This could be due to a simple undetected source effect, and/or to a diminution of the natural nucleation efficiency of INPs caused by low pH. In any case, this fact could add to the “rain suppression” effect caused by anthropogenic aerosols [68] and lead to even larger decreases of rain occurrence in some areas of the globe impacted by pollution.
The pH was strongly correlated with the freezing characteristics of the samples; as this is easily measurable, it could probably be used as a proxy for rapid investigation of the freezing properties of atmospheric waters, or it should at least be measured simultaneously to verify this relationship. In turn, the water isotope ratio might not be as informative as expected [19] for investigating INPs distribution and processing in precipitation when collected well below cloud base.
The proximity with puy de Dôme Meteorological station, where many studies concerning the chemistry and biology of the atmosphere are conducted, gave us the possibility to compare datasets on aerosols, clouds, and precipitation, and investigate the atmospheric fate of INPs. From statistics, we demonstrated that INPs are naturally enriched in precipitation compared with other biological aerosols such as microbial cells. They partition in the atmosphere depending on the temperature at which they initiate ice formation, and this phenomenon involves clouds. This supports the bioprecipitation hypothesis involving certain species of bacteria, the extremely high ice nucleation activity of which was proposed they favor their own deposition to the surface with precipitation, and so atmospheric dispersion. Future work in this field could focus on simultaneously studying cloud and precipitation of the same meteorological events, in order to account for their physical link. Aerosols also will have to be sampled for evaluating the extent of wash-out processes on the biological composition of precipitation compared with clouds.

Supplementary Materials

The following are available online at www.mdpi.com/2073-4433/8/11/229/s1, Supplementary zipfile 1: ECMWF atmospheric profiles of cloud cover, humidity, liquid water content and ice water content, Supplementary zipfile 2: ECMWF backtrajectory plots over the 48 h preceding the sampling day (time of the day was adjusted when formal information on the precipitation time was available), Figure S1: Cumulative INP concentration of all the precipitation samples investigated in this study (n = 121), Figure S2: Cumulative INP concentration in precipitation samples selected for their low and high freezing activities, Figure S3: Comparison between the composition of precipitation and cloud water, Figure S4: Summary plot, Table S1: xls file: whole dataset for precipitation at Opme, Table S2: Temporal characteristics of the dataset, Table S3: xls file: Spearman rank order correlation matrix for Opme precipitation variables, Table S4: Summary of the unpublished puy de Dôme summit aerosol dataset used for comparison with precipitation collected at Opme.

Acknowledgments

We warmly thank Emiliano Stopelli for the isotope ratio measurements. Opme and puy de Dôme sites are routinely operated by OPGC/LaMP staff, and supported by University Clermont-Auvergne, CNRS and CNES. We acknowledge ECMWF for providing ERA-Interim re-analysis, and IRSN for part of the meteorological data presented, and the Fédération de Recherche en Environnement FR 3467 UCA/CNRS/INRA for partial funding.

Author Contributions

Pierre Amato and Franz Conen conceived and designed the experiments; Glwadys Pouzet, Elodie Peghaire and Maxime Aguès and Pierre Amato performed the experiments; Glwadys Pouzet, Elodie Peghaire, Pierre Amato, Jean-Luc Baray and Franz Conen analyzed the data; Pierre Amato, Jean-Luc Baray and Franz Conen contributed reagents/materials/analysis tools; Pierre Amato, Jean-Luc Baray and Franz Conen wrote the paper.

Conflicts of Interest

The authors declare no conflicts of interest.

References

  1. Möhler, O.; DeMott, P.J.; Vali, G.; Levin, Z. Microbiology and atmospheric processes: The role of biological particles in cloud physics. Biogeosciences 2007, 4, 1059–1071. [Google Scholar] [CrossRef]
  2. Atkinson, J.D.; Murray, B.J.; Woodhouse, M.T.; Whale, T.F.; Baustian, K.J.; Carslaw, K.S.; Dobbie, S.; O’Sullivan, D.; Malkin, T.L. The importance of feldspar for ice nucleation by mineral dust in mixed-phase clouds. Nature 2013. [Google Scholar] [CrossRef]
  3. Hiranuma, N.; Möhler, O.; Yamashita, K.; Tajiri, T.; Saito, A.; Kiselev, A.; Hoffmann, N.; Hoose, C.; Jantsch, E.; Koop, T.; et al. Ice nucleation by cellulose and its potential contribution to ice formation in clouds. Nat. Geosci. 2015, 8, 273–277. [Google Scholar] [CrossRef]
  4. Hill, T.C.J.; DeMott, P.J.; Tobo, Y.; Fröhlich-Nowoisky, J.; Moffett, B.F.; Franc, G.D.; Kreidenweis, S.M. Sources of organic ice nucleating particles in soils. Atmos. Chem. Phys. 2016, 16, 7195–7211. [Google Scholar] [CrossRef]
  5. Conen, F.; Morris, C.E.; Leifeld, J.; Yakutin, M.V.; Alewell, C. Biological residues define the ice nucleation properties of soil dust. Atmos. Chem. Phys. 2011, 11, 9643–9648. [Google Scholar] [CrossRef]
  6. Joly, M.; Amato, P.; Deguillaume, L.; Monier, M.; Hoose, C.; Delort, A.-M. Quantification of ice nuclei active at near 0 °C temperatures in low-altitude clouds at the Puy de Dôme atmospheric station. Atmos. Chem. Phys. 2014, 14, 8185–8195. [Google Scholar] [CrossRef] [Green Version]
  7. Pummer, B.G.; Bauer, H.; Bernardi, J.; Bleicher, S.; Grothe, H. Suspendable macromolecules are responsible for ice nucleation activity of birch and conifer pollen. Atmos. Chem. Phys. 2012, 12, 2541–2550. [Google Scholar] [CrossRef]
  8. Hoose, C.; Möhler, O. Heterogeneous ice nucleation on atmospheric aerosols: A review of results from laboratory experiments. Atmos. Chem. Phys. 2012, 12, 9817–9854. [Google Scholar] [CrossRef]
  9. Fröhlich-Nowoisky, J.; Hill, T.C.J.; Pummer, B.G.; Yordanova, P.; Franc, G.D.; Pöschl, U. Ice nucleation activity in the widespread soil fungus Mortierella alpina. Biogeosciences 2015, 12, 1057–1071. [Google Scholar] [CrossRef]
  10. Conen, F.; Eckhardt, S.; Gundersen, H.; Stohl, A.; Yttri, K.E. Rainfall drives atmospheric ice-nucleating particles in the coastal climate of southern Norway. Atmos. Chem. Phys. 2017, 17, 11065–11073. [Google Scholar] [CrossRef]
  11. Joly, M.; Attard, E.; Sancelme, M.; Deguillaume, L.; Guilbaud, C.; Morris, C.E.; Amato, P.; Delort, A.-M. Ice nucleation activity of bacteria isolated from cloud water. Atmos. Environ. 2013, 70, 392–400. [Google Scholar] [CrossRef]
  12. Morris, C.E.; Sands, D.C.; Vinatzer, B.A.; Glaux, C.; Guilbaud, C.; Buffière, A.; Yan, S.; Dominguez, H.; Thompson, B.M. The life history of the plant pathogen Pseudomonas syringae is linked to the water cycle. ISME J. 2008, 2, 321–334. [Google Scholar] [CrossRef] [PubMed]
  13. Stopelli, E.; Conen, F.; Guilbaud, C.; Zopfi, J.; Alewell, C.; Morris, C.E. Ice nucleators, bacterial cells and Pseudomonas syringae in precipitation at Jungfraujoch. Biogeosciences 2017, 14, 1189–1196. [Google Scholar] [CrossRef]
  14. Maki, L.R.; Galyan, E.L.; Chang-Chien, M.-M.; Caldwell, D.R. Ice Nucleation Induced by Pseudomonas syringae. Appl. Microbiol. 1974, 28, 456–459. [Google Scholar] [PubMed]
  15. Vali, G.; Christensen, M.; Fresh, R.W.; Galyan, E.L.; Maki, L.R.; Schnell, R.C. Biogenic Ice Nuclei. Part II: Bacterial Sources. J. Atmos. Sci. 1976, 33, 1565–1570. [Google Scholar] [CrossRef]
  16. Fukuta, N.; Mason, B.J. Epitaxial growth of ice on organic crystals. J. Phys. Chem. Solids 1963, 24, 715–718. [Google Scholar] [CrossRef]
  17. Schnell, R.C.; Vali, G. Atmospheric Ice Nuclei from Decomposing Vegetation. Nature 1972, 236, 163–165. [Google Scholar] [CrossRef]
  18. Christner, B.C.; Morris, C.E.; Foreman, C.M.; Cai, R.; Sands, D.C. Ubiquity of Biological Ice Nucleators in Snowfall. Science 2008, 319, 1214. [Google Scholar] [CrossRef] [PubMed]
  19. Stopelli, E.; Conen, F.; Morris, C.E.; Herrmann, E.; Henne, S.; Steinbacher, M.; Alewell, C. Predicting abundance and variability of ice nucleating particles in precipitation at the high-altitude observatory Jungfraujoch. Atmos. Chem. Phys. 2016, 16, 8341–8351. [Google Scholar] [CrossRef]
  20. Conen, F.; Rodríguez, S.; Hülin, C.; Henne, S.; Herrmann, E.; Bukowiecki, N.; Alewell, C. Atmospheric ice nuclei at the high-altitude observatory Jungfraujoch, Switzerland. Tellus B Chem. Phys. Meteorol. 2015, 67, 25014. [Google Scholar] [CrossRef]
  21. Burrows, S.M.; Hoose, C.; Pöschl, U.; Lawrence, M.G. Ice nuclei in marine air: Biogenic particles or dust? Atmos. Chem. Phys. 2013, 13, 245–267. [Google Scholar] [CrossRef]
  22. Mason, R.H.; Si, M.; Li, J.; Chou, C.; Dickie, R.; Toom-Sauntry, D.; Pohlker, C.; Yakobi-Hancock, J.D.; Ladino, L.A.; Jones, K.; et al. Ice nucleating particles at a coastal marine boundary layer site: Correlations with aerosol type and meteorological conditions. Atmos. Chem. Phys. 2015, 15, 12547–12566. [Google Scholar] [CrossRef]
  23. DeMott, P.J.; Hill, T.C.J.; McCluskey, C.S.; Prather, K.A.; Collins, D.B.; Sullivan, R.C.; Ruppel, M.J.; Mason, R.H.; Irish, V.E.; Lee, T.; et al. Sea spray aerosol as a unique source of ice nucleating particles. Proc. Natl. Acad. Sci. 2016, 113, 5797–5803. [Google Scholar] [CrossRef] [PubMed]
  24. Stopelli, E.; Conen, F.; Morris, C.E.; Herrmann, E.; Bukowiecki, N.; Alewell, C. Ice nucleation active particles are efficiently removed by precipitating clouds. Sci. Rep. 2015, 5, 16433. [Google Scholar] [CrossRef] [PubMed]
  25. Hoose, C.; Kristjánsson, J.E.; Burrows, S.M. How important is biological ice nucleation in clouds on a global scale? Environ. Res. Lett. 2010, 5, 024009. [Google Scholar] [CrossRef]
  26. Sesartic, A.; Lohmann, U.; Storelvmo, T. Bacteria in the ECHAM5-HAM global climate model. Atmos. Chem. Phys. 2012, 12, 8645–8661. [Google Scholar] [CrossRef] [Green Version]
  27. Bigg, E.K.; Soubeyrand, S.; Morris, C.E. Persistent after-effects of heavy rain on concentrations of ice nuclei and rainfall suggest a biological cause. Atmos. Chem. Phys. 2015, 15, 2313–2326. [Google Scholar] [CrossRef]
  28. Sahyoun, M.; Korsholm, U.S.; Sørensen, J.H.; Šantl-Temkiv, T.; Finster, K.; Gosewinkel, U.; Nielsen, N.W. Impact of bacterial ice nucleating particles on weather predicted by a numerical weather prediction model. Atmos. Environ. 2017, 170, 33–34. [Google Scholar] [CrossRef]
  29. Amato, P.; Ménager, M.; Sancelme, M.; Laj, P.; Mailhot, G.; Delort, A.-M. Microbial population in cloud water at the Puy de Dôme: Implications for the chemistry of clouds. Atmos. Environ. 2005, 39, 4143–4153. [Google Scholar] [CrossRef]
  30. Vaïtilingom, M.; Attard, E.; Gaiani, N.; Sancelme, M.; Deguillaume, L.; Flossmann, A.I.; Amato, P.; Delort, A.-M. Long-term features of cloud microbiology at the puy de Dôme (France). Atmos. Environ. 2012, 56, 88–100. [Google Scholar] [CrossRef]
  31. Amato, P.; Joly, M.; Besaury, L.; Oudart, A.; Taib, N.; Moné, A.I.; Deguillaume, L.; Delort, A.-M.; Debroas, D. Active microorganisms thrive among extremely diverse communities in cloud water. PLoS ONE 2017, 12, e0182869. [Google Scholar] [CrossRef] [PubMed]
  32. Šantl-Temkiv, T.; Amato, P.; Gosewinkel, U.; Thyrhaug, R.; Charton, A.; Chicot, B.; Finster, K.; Bratbak, G.; Löndahl, J. High-Flow-Rate Impinger for the Study of Concentration, Viability, Metabolic Activity, and Ice-Nucleation Activity of Airborne Bacteria. Environ. Sci. Technol. 2017, 51, 11224–11234. [Google Scholar] [CrossRef] [PubMed]
  33. Stopelli, E.; Conen, F.; Zimmermann, L.; Alewell, C.; Morris, C.E. Freezing nucleation apparatus puts new slant on study of biological ice nucleators in precipitation. Atmos. Meas. Tech. 2014, 7, 129–134. [Google Scholar] [CrossRef] [Green Version]
  34. Vali, G. Quantitative Evaluation of Experimental Results an the Heterogeneous Freezing Nucleation of Supercooled Liquids. J. Atmos. Sci. 1971, 28, 402–409. [Google Scholar] [CrossRef]
  35. Marinoni, A.; Laj, P.; Sellegri, K.; Mailhot, G. Cloud chemistry at the Puy de Dôme: Variability and relationships with environmental factors. Atmos. Chem. Phys. 2004, 4, 715–728. [Google Scholar] [CrossRef]
  36. Berrisford, P.; Dee, D.P.; Poli, P.; Brugge, R.; Fielding, K.; Fuentes, M.; Kållberg, P.W.; Kobayashi, S.; Uppala, S.; Simmons, A. The ERA-Interim Archive Version 2.0; European Centre for Medium Range Weather Forecasts: Reading, Berkshire, UK, 2011. [Google Scholar]
  37. Clain, G.; Baray, J.-L.; Delmas, R.; Keckhut, P.; Cammas, J.-P. A lagrangian approach to analyse the tropospheric ozone climatology in the tropics: Climatology of stratosphere–troposphere exchange at Reunion Island. Atmos. Environ. 2010, 44, 968–975. [Google Scholar] [CrossRef]
  38. Duflot, V.; Dils, B.; Baray, J.L.; De Mazière, M.; Attié, J.L.; Vanhaelewyn, G.; Senten, C.; Vigouroux, C.; Clain, G.; Delmas, R. Analysis of the origin of the distribution of CO in the subtropical southern Indian Ocean in 2007. J. Geophys. Res. 2010, 115, D22106. [Google Scholar] [CrossRef]
  39. Freney, E.; Sellegri Karine, S.K.; Eija, A.; Clemence, R.; Aurelien, C.; Jean-Luc, B.; Aurelie, C.; Maxime, H.; Nadege, M.; Laeticia, B.; et al. Experimental Evidence of the Feeding of the Free Troposphere with Aerosol Particles from the Mixing Layer. Aerosol Air Qual. Res. 2016, 16, 702–716. [Google Scholar] [CrossRef]
  40. Baray, J.-L.; Pointin, Y.; Van Baelen, J.; Lothon, M.; Campistron, B.; Cammas, J.-P.; Masson, O.; Colomb, A.; Hervier, C.; Bezombes, Y.; et al. Case study and climatological analysis of upper tropospheric jet stream and stratosphere-troposphere exchanges using VHF profilers and radionuclide measurements in France. J. Appl. Meteorol. Climatol. 2017. [Google Scholar] [CrossRef]
  41. Deguillaume, L.; Charbouillot, T.; Joly, M.; Vaïtilingom, M.; Parazols, M.; Marinoni, A.; Amato, P.; Delort, A.-M.; Vinatier, V.; Flossmann, A.; et al. Classification of clouds sampled at the puy de Dôme (France) based on 10 yr of monitoring of their physicochemical properties. Atmos. Chem. Phys. 2014, 14, 1485–1506. [Google Scholar] [CrossRef] [Green Version]
  42. Moran, T.A.; Marshall, S.J.; Evans, E.C.; Sinclair, K.E. Altitudinal Gradients of Stable Isotopes in Lee-Slope Precipitation in the Canadian Rocky Mountains. Arct. Antarct. Alp. Res. 2007, 39, 455–467. [Google Scholar] [CrossRef]
  43. Hammer, Ø.; Ryan, P.; Harper, D. PAST: Paleontological Statistics software package for education and data analysis. Palaeontol. Electron. 2001, 4, 9. [Google Scholar]
  44. Christner, B.C.; Cai, R.; Morris, C.E.; McCarter, K.S.; Foreman, C.M.; Skidmore, M.L.; Montross, S.N.; Sands, D.C. Geographic, seasonal, and precipitation chemistry influence on the abundance and activity of biological ice nucleators in rain and snow. Proc. National Acad. Sci 2008, 105, 18854–18859. [Google Scholar] [CrossRef] [PubMed]
  45. DeMott, P.J.; Prenni, A.J. New Directions: Need for defining the numbers and sources of biological aerosols acting as ice nuclei. Atmos. Environ. 2010, 44, 1944–1945. [Google Scholar] [CrossRef]
  46. Petters, M.D.; Wright, T.P. Revisiting ice nucleation from precipitation samples. Geophys. Res. Lett. 2015, 42, 2015GL065733. [Google Scholar] [CrossRef]
  47. Bourcier, L.; Masson, O.; Laj, P.; Chausse, P.; Pichon, J.M.; Paulat, P.; Bertrand, G.; Sellegri, K. A new method for assessing the aerosol to rain chemical composition relationships. Atmos. Res. 2012, 118, 295–303. [Google Scholar] [CrossRef]
  48. Huffman, J.A.; Prenni, A.J.; DeMott, P.J.; Pöhlker, C.; Mason, R.H.; Robinson, N.H.; Fröhlich-Nowoisky, J.; Tobo, Y.; Després, V.R.; Garcia, E.; et al. High concentrations of biological aerosol particles and ice nuclei during and after rain. Atmos. Chem. Phys. 2013, 13, 6151–6164. [Google Scholar] [CrossRef]
  49. Schnell, R.C.; Vali, G. Biogenic ice nuclei: Part I. Terrestrial and marine sources. J. Atmos. Sci. 1976, 33, 1554–1564. [Google Scholar] [CrossRef]
  50. Xu, X.; Guo, X.; Zhao, T.; An, X.; Zhao, Y.; Quan, J.; Mao, F.; Gao, Y.; Cheng, X.; Zhu, W.; et al. Are precipitation anomalies associated with aerosol variations over eastern China? Atmos. Chem. Phys. 2017, 17, 8011–8019. [Google Scholar] [CrossRef]
  51. André, F.; Jonard, M.; Ponette, Q. Influence of meteorological factors and polluting environment on rain chemistry and wet deposition in a rural area near Chimay, Belgium. Atmos. Environ. 2007, 41, 1426–1439. [Google Scholar] [CrossRef]
  52. Hanlon, R.; Powers, C.; Failor, K.; Monteil, C.L.; Vinatzer, B.A.; Schmale, D.G., III. Microbial ice nucleators scavenged from the atmosphere during simulated rain events. Atmos. Environ. 2017, 163, 182–189. [Google Scholar] [CrossRef]
  53. Barth, M.C.; Stuart, A.L.; Skamarock, W.C. Numerical simulations of the July 10, 1996, Stratospheric-Tropospheric Experiment: Radiation, Aerosols, and Ozone (STERAO)-Deep Convection experiment storm: Redistribution of soluble tracers. J. Geophys. Res. 2001, 106, 12381–12400. [Google Scholar] [CrossRef]
  54. Murakami, M.; Kimura, T.; Magono, C.; Kikuchi, K. Observations of Precipitation Scavenging for Water-Soluble Particles. J. Meteorol. Soci. Jpn. Ser. II 1983, 61, 346–358. [Google Scholar] [CrossRef]
  55. Jaffrezo, J.-L.; Colin, J.-L. Rain-aerosol coupling in urban area: Scavenging ratio measurement and identification of some transfer processes. Atmos. Environ. (1967) 1988, 22, 929–935. [Google Scholar] [CrossRef]
  56. Charlson, R.J.; Rodhe, H. Factors controlling the acidity of natural rainwater. Nature 1982, 295, 683–685. [Google Scholar] [CrossRef]
  57. Attard, E.; Yang, H.; Delort, A.M.; Amato, P.; Poschl, U.; Glaux, C.; Koop, T.; Morris, C.E. Effects of atmospheric conditions on ice nucleation activity of Pseudomonas. Atmos. Chem. Phys. 2012, 12, 10667–10677. [Google Scholar] [CrossRef]
  58. Muryoi, N.; Kawahara, H.; Obata, H. Properties of a Novel Extracellular Cell-free Ice Nuclei from Ice-nucleating Pseudomonas antarctica IN-74. Bioscience Biotech. Biochem. 2003, 67, 1950–1958. [Google Scholar] [CrossRef] [PubMed]
  59. Amato, P.; Joly, M.; Schaupp, C.; Attard, E.; Möhler, O.; Morris, C.E.; Brunet, Y.; Delort, A.-M. Survival and ice nucleation activity of bacteria as aerosols in a cloud simulation chamber. Atmos. Chem. Phys. 2015, 15, 6455–6465. [Google Scholar] [CrossRef]
  60. Yang, Z.; Bertram, A.K.; Chou, K.C. Why Do Sulfuric Acid Coatings Influence the Ice Nucleation Properties of Mineral Dust Particles in the Atmosphere? J. Phys. Chem. Lett. 2011, 2, 1232–1236. [Google Scholar] [CrossRef] [PubMed]
  61. Amato, P.; Parazols, M.; Sancelme, M.; Mailhot, G.; Laj, P.; Delort, A.-M. An important oceanic source of micro-organisms for cloud water at the Puy de Dôme (France). Atmos. Environ. 2007, 41, 8253–8263. [Google Scholar] [CrossRef]
  62. Di Giorgio, C.; Krempff, A.; Guiraud, H.; Binder, P.; Tiret, C.; Dumenil, G. Atmospheric pollution by airborne microorganisms in the city of Marseilles. Atmos. Environ. 1996, 30, 155–160. [Google Scholar] [CrossRef]
  63. Bovallius, A.; Bucht, B.; Roffey, R.; Anäs, P. Three-year investigation of the natural airborne bacterial flora at four localities in sweden. Appl. Environ. Microbiol. 1978, 35, 847. [Google Scholar] [PubMed]
  64. Lin, N.-H.; Peng, C.-M. Estimates of the Contribution of Below-cloud Scavenging to the Pollutant Loadings of Rain in Taipei, Taiwan. Terr. Atmos. Ocean. Sci. 1999, 10, 693. [Google Scholar] [CrossRef]
  65. Sellegri, K.; Laj, P.; Marinoni, A.; Dupuy, R.; Legrand, M.; Preunkert, S. Contribution of gaseous and particulate species to droplet solute composition at the Puy de Dôme, France. Atmos. Chem. Phys. 2003, 3, 1509–1522. [Google Scholar] [CrossRef]
  66. Morris, C.E.; Georgakopoulos, D.G.; Sands, D.C. Ice nucleation active bacteria and their potential role in precipitation. J. Phys. IV Proc. 2004, 121, 87–103. [Google Scholar] [CrossRef]
  67. Sands, D.C.; Langhans, V.E.; Scharen, A.L.; De Smet, G. The association between bacteria and rain and possible resultant meteorological implications. J. Hung. Meteorol. Serv. 1982, 86, 148–152. [Google Scholar]
  68. Rosenfeld, D. Suppression of Rain and Snow by Urban and Industrial Air Pollution. Science 2000, 287, 1793–1796. [Google Scholar] [CrossRef] [PubMed]
Figure 1. Summary plots of the cumulative freezing profiles of precipitation samples (n = 121). Boxes show medians (narrow horizontal line), 25th and 75th percentiles (upper and lower bounds of the boxes) and 10th and 90th percentiles (whiskers), with outliers indicated as dots; mean ice nucleating particles (INP) concentrations are indicated as thick lines.
Atmosphere 08 00229 g001
Figure 2. Frequency distribution of the onset freezing temperature of precipitation samples (n = 121). Each sample consisted of 10.4 mL precipitation (26 × 400 µL). This sample volume corresponds to 26 m3 of cloud volume, assuming a condensed water content of 0.4 g m−3 [46]; e.g., in such a cloud volume there would have been at least one INP active at the indicated temperature and frequency.
Atmosphere 08 00229 g002
Figure 3. Representation of the variables explaining the distribution of the data along the two main axes defined by principal components analysis. (See data in Table S1).
Atmosphere 08 00229 g003
Figure 4. (A) Temporal distribution of the 121 precipitation samples over the 620-days period studied from September 2015 to June 2017 (daily precipitation rate and INP−7 concentration); (B) monthly evolution of INP-7 concentration (left Y-axis). Boxes show medians (narrow horizontal line), 25th and 75th percentiles (upper and lower bounds of the boxes) and 10th and 90th percentiles (whiskers), with outliers indicated as dots; means are indicated as thick lines. The monthly frequency of days with precipitation is indicated on the top of the graph and plotted as percentages (dashed line, right Y-axis).
Atmosphere 08 00229 g004
Figure 5. Correlations between the freezing characteristics of precipitation samples and pH (A,B), or the fraction of water lost by previous precipitation from the air mass (D); the relation between cell concentration and pH is also shown (C). Dashed lines are linear fits depicting significant relationships; non-parametric Spearman rank correlation results are indicated on the top of each plot.
Atmosphere 08 00229 g005
Figure 6. Average normalized cumulative freezing profiles of precipitation, aerosols and cloud water samples collected in the same area and normalized to their respective INP−8. In addition of data generated in this study on precipitation and aerosols collected by filtration (see Table S4 and Figure S4 for data), literature data were retrieved for cloud water and aerosols collected by impingement from [6,32], respectively (studies led at puy de Dôme summit, i.e., a few km away from the sampling site investigated here). The average normalized freezing profile of ice-nucleation active (INA) bacteria isolated from clouds previously [11] is also shown for comparison. Asterisks indicate significant difference between precipitation and cloud water (Mann-Whitney test, p < 0.05).
Atmosphere 08 00229 g006
Table 1. Summary of the precipitation dataset investigated (see Table S1 for complete data).
Sampling Duration (h)Total Volume Collected (mL)Precipitation Rate (mL cm−2 d−1) (a)Onset Freezing Temp. (°C)INP−7 Concentration (mL−1)Ambient Air Temperature (°C) (b)Relative Humidity (b)Pression (hPa) (b)
Min24120.024−7.50.00−1.334.0916
Max2411002.2−38.1519.9120.8954
Mean24239.70.5−5.32.089.286.9937
Std error-265.80.50.72.145.121.08
n121121121121121101101101
Mean Wind Speed (m s−1) (b)Max Wind Speed (m s−1) (b)Cells Conc. (mL−1)1-fv (c)pHCl (µM)NO3 (µM)SO42− (µM)PO43− (µM)Na+ (µM)NH4+ (µM)K+ (µM)Mg2+ (µM)Ca2+ (µM)
Min0.591.622.4 × 102−0.184.301.93.50.80.31.97.00.30.16.6
Max9.1614.656.61 × 1050.857.0232.936.421.33.813.660.016.43.533.0
Mean3.326.702.6 × 1040.55.596.315.35.01.33.929.92.40.811.2
Std error1.702.649.3 × 1040.20.517.19.65.50.82.816.33.70.86.7
n848462106121191918191919191919
(a) Inferred from the volume of water collected; (b) over the duration of the sampling period; (c) fraction of water vapor lost from air mass prior this precipitation event; derived from water isotope ratio.

