Article

Evaluation and Inter-Comparison of Oxygen-Based OC-EC Separation Methods for Radiocarbon Analysis of Ambient Aerosol Particle Samples

1
Centre for Isotope Research, Energy and Sustainability Research Institute Groningen, University of Groningen, 9747 AG Groningen, The Netherlands
2
Department of Chemistry and Biochemistry & Oeschger Centre for Climate Change Research, University of Bern, 3012 Bern, Switzerland
3
Department of Physics and Astronomy, University of Florence & INFN-Florence, 50019 Sesto Fiorentino (Firenze), Italy
4
Department of Physics, Università degli Studi di Milano & INFN-Milan, 20133 Milano, Italy
5
TNO, Netherlands Organisation for Applied Scientific Research Utrecht, 3584 CB Utrecht, The Netherlands
*
Author to whom correspondence should be addressed.
Current address: TNO, Netherlands Organisation for Applied Scientific Research Zeist, 3704 HE Zeist, The Netherlands.
Atmosphere 2017, 8(11), 226; https://doi.org/10.3390/atmos8110226
Submission received: 4 October 2017 / Revised: 11 November 2017 / Accepted: 15 November 2017 / Published: 21 November 2017
(This article belongs to the Special Issue Carbonaceous Aerosols in Atmosphere)

Abstract

:
Radiocarbon analysis is a widely-used tool for source apportionment of aerosol particles. One of the big challenges of this method, addressed in this work, is to isolate elemental carbon (EC) for 14C analysis. In the first part of the study, we validate a two-step method (2stepCIO) to separate total carbon (TC) into organic carbon (OC) and EC against the EUSAAR_2 thermal-optical method regarding the recovered carbon concentrations. The 2stepCIO method is based on the combustion of OC in pure oxygen at two different temperature steps to isolate EC. It is normally used with a custom-built aerosol combustion system (ACS), but in this project, it was also implemented as a thermal protocol on a Sunset OC-EC analyzer. Results for the recovered EC mass concentration showed poor agreement between the 2stepCIO method on the ACS system and on the Sunset analyzer. This indicates that the EC recovery is sensitive not only to the temperature steps, but also to instrument-specific parameters, such as heating rates. We also found that the EUSAAR_2 protocol itself can underestimate the EC concentration on untreated samples compared to water-extracted samples. This is especially so for highly loaded filters, which are typical for 14C analysis. For untreated samples, the EC concentration on long-term filter samples (two to five days sampling time) was 20–45% lower than the sum of EC found on the corresponding 24-h filter samples. For water-extracted filter samples, there was no significant difference between long-term and the sum of daily filter samples. In the second part of this study, the 14C was measured on EC isolated by the 2stepCIO method and compared to methods from two other laboratories. The different methods agree well within their uncertainty estimates.

1. Introduction

Carbon containing constituents contribute approximately 20–40% to the mass of fine particulate matter with an aerodynamic diameter below 2.5 µm (PM2.5) depending on sampling location [1]. The total carbon (TC) content of aerosol particles can be divided into organic carbon (OC) and elemental or black carbon (EC or BC). The largest part of OC consists of low-molecular-weight hydrocarbons and derivatives, which are colorless, non-refractory compounds. EC is a product of incomplete combustion and pyrolysis, which is optically absorbing and thermally refractory. The definition and quantification of EC or BC is dependent on the measurement technique [2], such as thermo-chemical or optical classification. Since this study uses thermal or thermo-optical methods, we will use the term EC. EC contributes to the global warming of the atmosphere, but as shown in the most recent IPCC report [3,4], the radiative forcing of EC is still associated with large uncertainties. In order to improve global models, but also for pollution reduction measures, it is important to know the sources of the carbonaceous aerosol. Radiocarbon analysis is a reliable tool for source apportionment, as it clearly distinguishes fossil sources, which are 14C-free, from contemporary sources, independently of individual emission conditions or subsequent transformation processes. It has become a widely-used method in the field of aerosol research, e.g., [5,6,7,8,9,10,11,12,13,14,15,16].
Since OC and EC have different chemical structures and production mechanisms, it is useful to clearly separate OC and EC in order to get better information about the sources of the carbonaceous aerosol. The most common approach for the quantification of OC and EC is currently the thermo-optical analysis. In a first step OC is evaporated in an inert atmosphere (usually helium) and afterwards the remaining EC is combusted by mixing the inert gas with oxygen. During the whole process, the light transmission or reflectance of the filter sample is monitored, which allows to correct for artifacts that occur in the course of this procedure. The main artifact is caused by the pyrolysis of OC during the evaporation step, which produces char that is chemically similar to EC and can be only removed by combustion. If not corrected, this artifact causes an underestimate of OC and an overestimate of EC. Different protocols for thermo-optical analysis with varying time and temperature settings exist [17,18]. Inter-comparison studies [19,20,21] have shown that the quantification of OC and EC depends on the applied method and the science community has not yet come to an international agreement for a reference method.
Radiocarbon source apportionment requires a physical separation of OC and EC, which is complicated by the pyrolysis of OC. To avoid charring of OC, Cachier et al. [22] developed a method which uses pure oxygen as a carrier gas and consists of a first step at lower temperature at around 300 °C to remove the OC and another step at much higher temperature to fully oxidize the remaining carbon. Most separation techniques [6,23,24] used for radiocarbon analysis of EC are based on this approach, while length and temperature of the applied steps are further optimized and extra steps are applied. By now most of the techniques aim at the clear separation of OC and EC by removing carbon in intermediate temperature steps [6,23,24]. There is no sharp boundary between OC and EC, which means the intermediate part of carbon, which consists of more refractory OC and less refractory EC mostly from wood burning [25] shows similar thermochemical properties. This makes it necessary to exclude this intermediate part of the EC for radiocarbon analysis, because it cannot be fully separated from OC. As a consequence a full recovery of the EC cannot be achieved. To minimize the charring of the OC during the OC removal step, filter samples are usually water-extracted. Yu et al. [26] found that especially water-soluble OC is prone to charring, so for radiocarbon analysis of EC it is best to remove this water-soluble OC.
The first part of this publication is focused on the quantification of the different carbon fractions and the recovery of EC for radiocarbon analysis. Measurements for this investigation have been done at the Centre for Isotope Research (CIO). Carbon concentrations derived with the EUSAAR_2 [17] thermo-optical protocol are compared with concentrations recovered with the 2stepCIO [23] separation technique for subsequent radiocarbon analysis. Filters used for radiocarbon analysis are often sampled over extended periods of time, in order to collect enough material. On the other hand, 24-h filter samples are usually used for concentration monitoring and thermo-optical protocols are consequently optimized for filters with a lower carbon loading. Therefore, carbon mass concentrations on 24-h filter samples are compared to concentrations derived from long-term filter samples.
The second part of this publication compares 14C in EC isolated by three different methods based on the approach by Cachier et al. [22]. The most recent and comprehensive inter-comparison exercise of 14C in carbonaceous aerosols [27] found that results of 14C measurements in OC and TC generally agree well between the different laboratories, but results for EC showed large differences ranging from 28–79%. These values represent the inter-laboratory standard deviation of 14C in EC for three different samples. The main reason for this large difference was attributed to different EC separation techniques. The present investigation therefore presents a more detailed inter-comparison focused on EC. All three laboratories (Laboratory for the Analysis of Radiocarbon with AMS (LARA) Bern, Laboratorio di Tecniche Nucleari per l’Ambiente e i Beni Culturali (LABEC) Florence, CIO Groningen) in this inter-comparison already took part in the earlier exercise, but since then have further improved their methods. The results of four ambient filter samples, with different carbon mass concentrations, and from different air mass regions, are compared and the different approaches are discussed in detail.

2. Methods

2.1. Sampling

In autumn 2014 a filter sampling campaign was conducted at the Cabauw Experimental Site for Atmospheric Research (CESAR) in cooperation with the Netherlands Organisation for Applied Scientific Research (TNO). The CESAR observatory (51.971° N, 4.927° E) is located in a rural spot in the western part of the Netherlands in the surrounding of three major cities (Utrecht, Rotterdam, Amsterdam) and is characterized as a regional background site of a relatively polluted area.
Filter samples were taken by CIO and TNO with two parallel high-volume aerosol sampler (DIGITEL DHA-80) using a single-stage impactor inlet, which removed all particulate matter with an aerodynamic diameter larger than 2.5 µm. The aerosol particles were collected on circular quartz fiber filters with a diameter of 15 cm. Several filters can be loaded into the sampler and are stored in filter stacks before and after active sampling. TNO used Pallflex Tissuquartz (2500 QAT-UP) filters, whereas CIO used Whatman (QMA 1851-150) filters. Sampling duration differed for the two institutes, TNO changed their filter every 24 h and CIO varied the sampling duration from two to five days. Changing of filters was done at midnight for all samples. The filter samples taken by CIO stayed in the sampler (either in the active sampling position or in the filter stock) for a total time period of around two weeks, except for filter samples 4 and 8, which were kept in the sampler for 28 days due to logistical reasons. Sampling filter blanks of CIO were treated in the same way as the real samples, but they never entered the flow chamber and stayed the whole time in the filter stock of the sampler. In the course of the sampling campaign four blank filter samples have been taken, out of which three filters stayed in the sampler for two weeks and one filter was kept in the sampler for 29 days. TNO kept their blank filter samples for two weeks in the sampler. Samples and blank filters were taken from or put into the sampler at the same particular time for both institutes. An overview of all filter samples taken by CIO is given in Table 1.
All filter samples were analyzed at CIO for concentrations of OC and EC, EC recovery and for the fraction modern of EC. Some samples were selected for a comparison of the carbon concentrations with the 24-h samples from TNO (see Table 1, marked with an o) and for an inter-comparison of the fraction modern of EC with other laboratories (see Table 1, marked with an x).

2.2. Filter Handling and Pretreatment at CIO

Prior to sampling, the filters were heated for two hours at 800 °C to remove adsorbed organic contamination. The filters were wrapped in pre-heated (2 h at 550 °C) aluminum foil and stored at a temperature of around −20 °C to avoid adsorption of OC, except for transportation to and from the sampling site and the time in the sampler. All tools that were used for filter handling, e.g., tweezers and punches were pre-cleaned first with acetone and then with ethanol. For the main part of the analysis the filter samples were water-extracted to remove the water-soluble part of the carbon. In the filtration assembly (Erlenmeyer flask, support base with fritted glass disc, funnel, clamp) for water extraction a filter punch of 30 mm or 40 mm rests on a fritted glass disc. Approximately 150 mL of Milli-Q water passes through the exposed filter (gravity-driven). In this set-up it cannot be completely avoided to lose a small part of the particulate matter, which is flushed up from the filter surface and settles on the funnel walls. The filtration assembly is thoroughly cleaned in between each water extraction with acetone and ethanol and then shortly rinsed with Milli-Q water. After water extraction the filter samples were dried overnight in a desiccator with silica gel filling. No treatment was conducted to remove inorganic carbon, because it was shown [28] that it can be neglected for PM2.5 in mid-latitude regions in the absence of local sources.

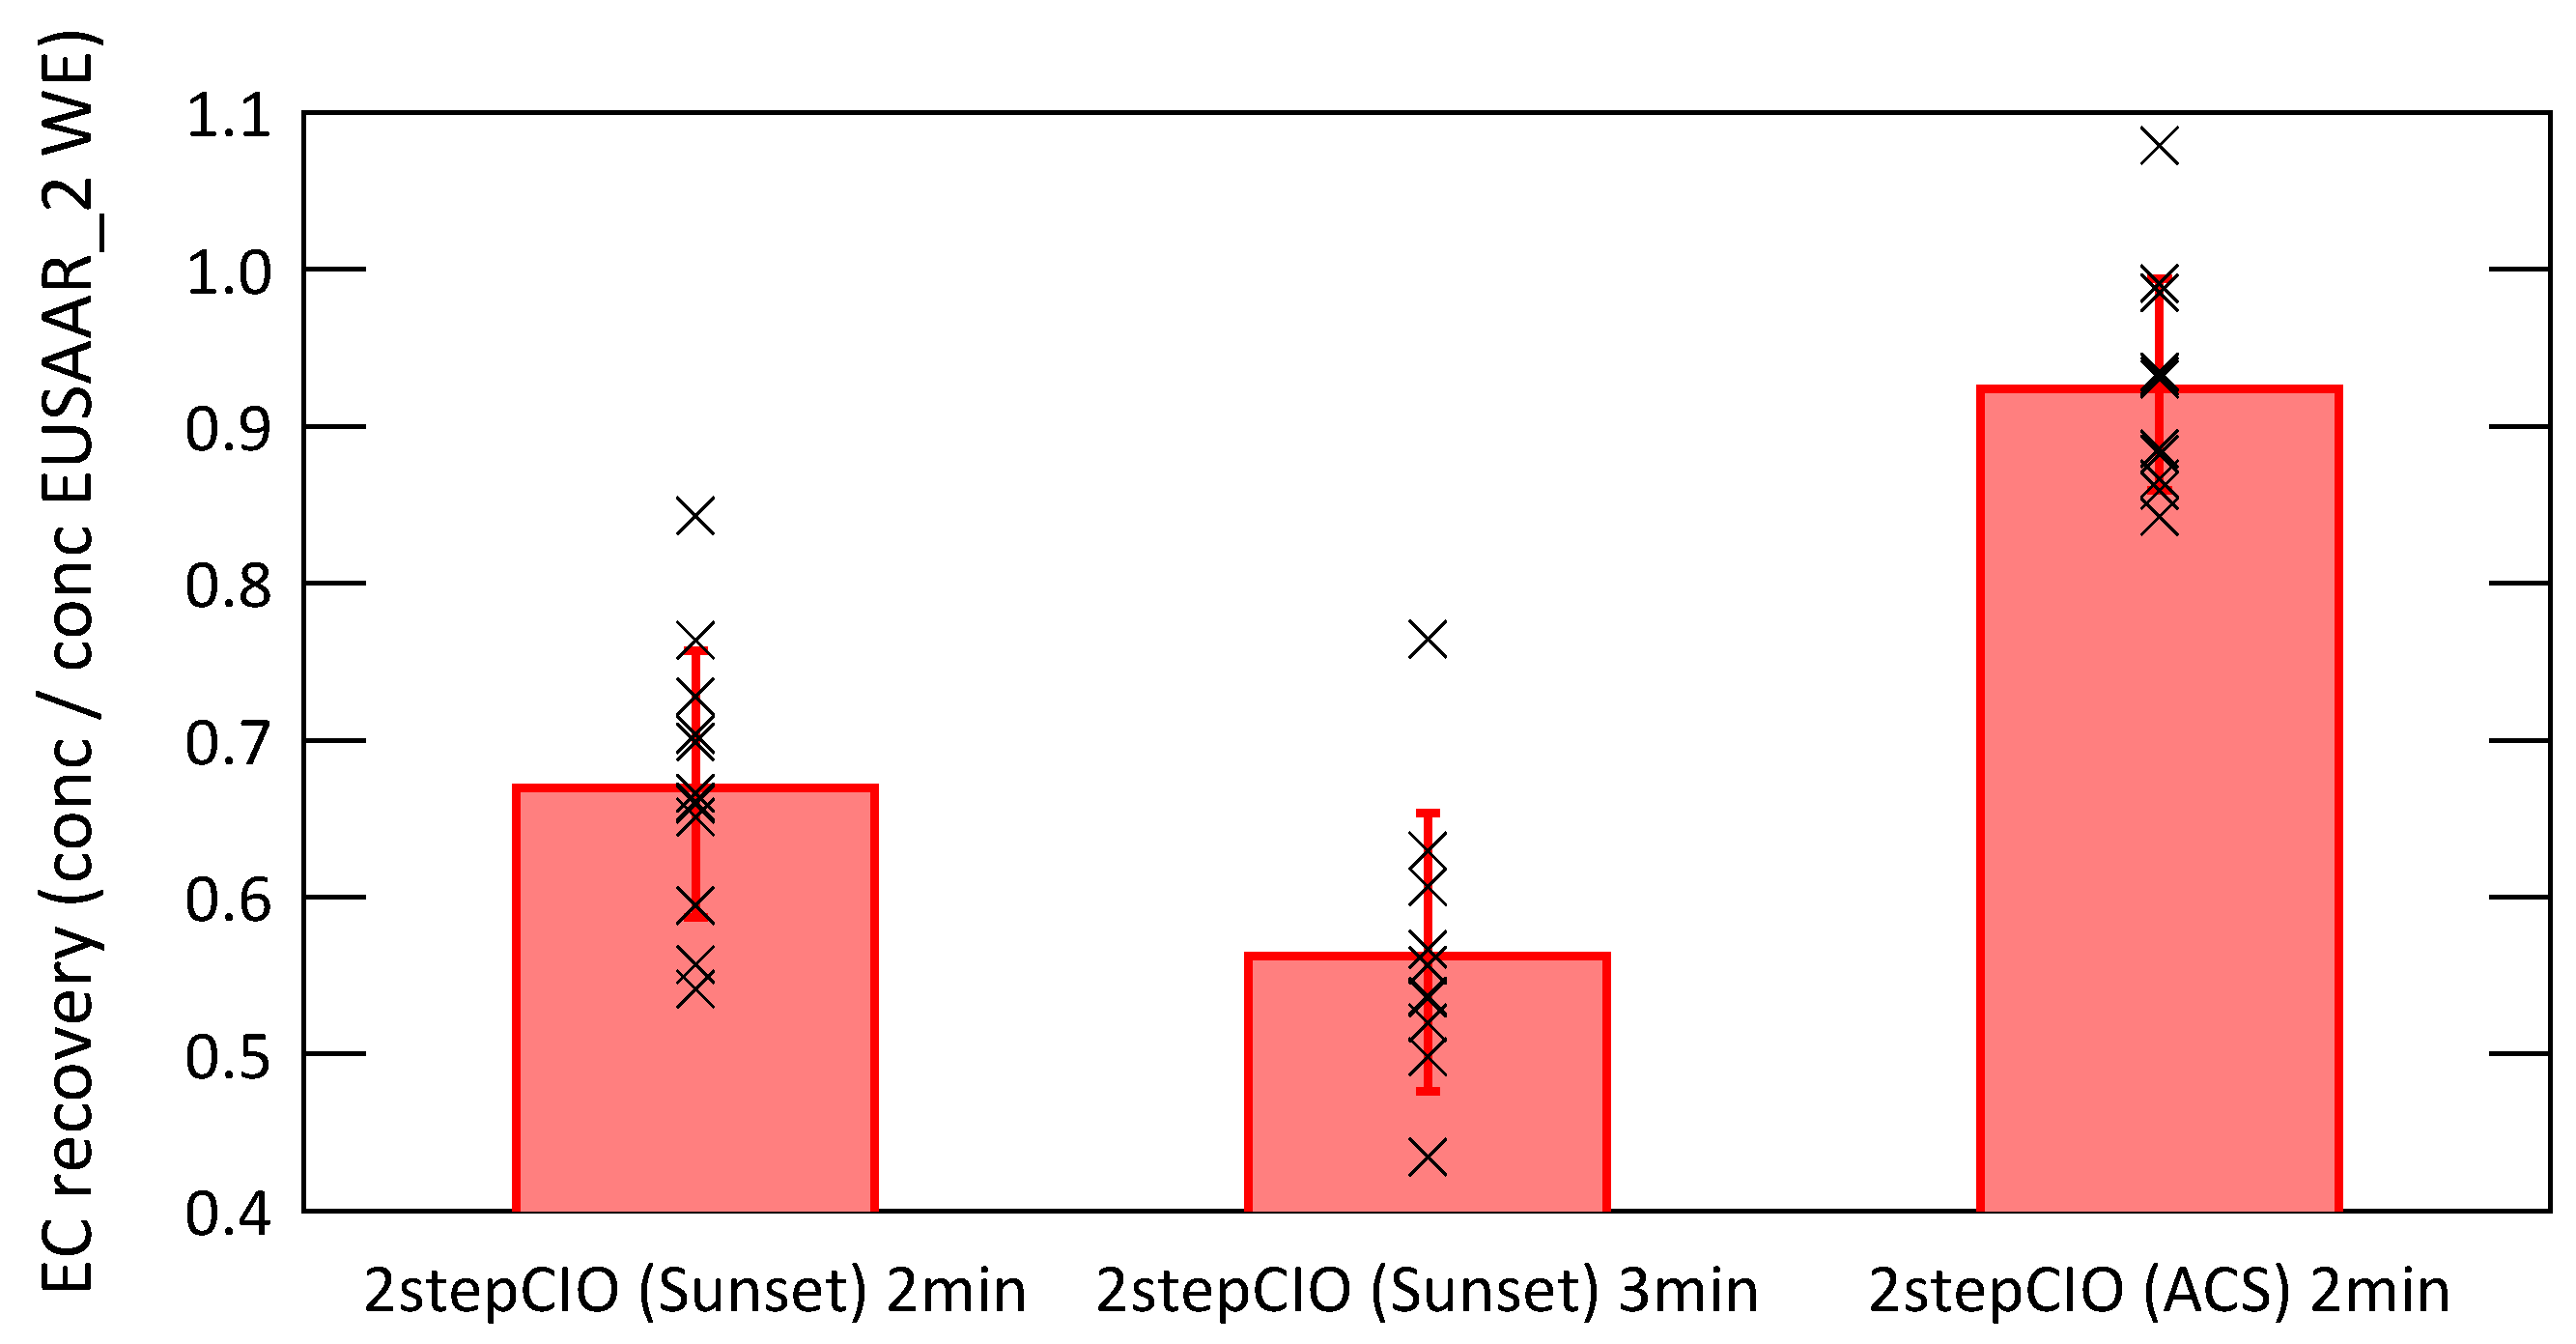
2.3. 2stepCIO Separation Method and Radiocarbon Analysis of EC at CIO

The aerosol combustion system (ACS) used for OC-EC separation in this study and its evaluation is described in detail by Dusek et al. [23]. The brief description following here will mainly concentrate on the extraction of EC from the bulk of the carbonaceous constituents in aerosol particles. The ACS consists of an extraction and a purification line, which are separated by a needle valve. The pressure in the extraction line is kept above atmospheric pressure, at around 1050 hPa, to prevent contamination, whereas the pressure in the purification line is kept below 20 hPa. The main part of the extraction line is composed of a quartz glass tube with a movable sample holder surrounded by three ovens. The combustion of the sample takes place in the first and second oven under a flow of purified 99.999% oxygen of around 65 mL/min. The third oven is kept at a temperature of 650 °C and contains a platinum catalyst (high sensitivity TC catalyst, platinum on quartz wool, Shimadzu Corporation, Kyoto, Japan), which ensures full oxidation of remaining incomplete combustion products.
For EC extraction, the water-extracted filter sample is inserted into the reaction tube for 10 min at 375 °C in the first oven, followed by 2 min at 450 °C in the second oven. In the first step OC is combusted and in the second step the most refractory OC and a part of EC are removed. Gases evolving during these steps are pumped away at the outlet of the reaction tube. The final step is the combustion of EC at 650 °C for 5 min in the second oven. The CO2 formed during this step is collected in a cryogenic trap in the purification line. After extraction the CO2 is transferred cryogenically from the trap to a flask containing phosphorus pentoxide (P2O5), where last traces of water vapor are removed. In a calibrated volume the extracted amount of CO2 is determined manometrically. Finally the sample is stored in a flame-sealed glass ampule until further analysis.
At CIO, the extracted and purified CO2 is reduced to graphite by a Bosch reaction at a temperature of 515 °C and a H2/CO2 ratio of 2.5. A porous iron pellet serves as a catalyst [29] and the produced water is removed cryogenically with the help of a Peltier cooler. Before starting the reaction, contaminations are removed from the iron pellet by oxidation with pure oxygen and subsequent reduction with hydrogen. After the formation of graphite on the pellets they are pressed into the accelerator mass spectrometer (AMS) target holders. The AMS at CIO, Model 4130 manufactured by HVEE, is based on a 3 MV Tandetron accelerator and is dedicated to the analysis of radiocarbon [30]. All samples and standards for this project were measured in one batch.
14C data are reported for CIO and also for LARA and LABEC as fraction modern, following the nomenclature discussed by Reimer et al. [31]:
F 14 C = 14 C 12 C sample 0.7459 · 14 C 12 C Ox I I , ( - 25 )
The 14C/12C ratio of the sample is related to the ratio of the standard, which is not corrected for decay since the year 1950. This year was internationally agreed on as a reference for the atmosphere unaffected by anthropogenic influence. Data analysis and correction is done at CIO following the non-matching size method described in [32] for ultra-small samples. Measurement results are normalized to a set of oxalic acid standards (OX-II, SRM 4990C) and corrected for isotopic fractionation, using the simultaneously measured 13C/12C ratio of the sample. Sample masses ranged from about 60 µg to 275 µg carbon, therefore standards with varying carbon mass for the quantification of fossil and modern carbon contamination are prepared in the same mass range and graphitized in the same way as the samples. OX-II is used to determine the fossil contamination (on average 3.1 ± 1.2 µg) and the 14C-free gas Rommenhöller for the determination of the modern contamination (on average 0.09 ± 0.07 µg). A set of secondary standards is used to assess the robustness and reliability of the data. This included IAEA-C7 with a consensus value of F 14 C = 0.4935 ± 0.0012 and sample sizes of 44 µg and 295 µg and IAEA-C8 with a consensus value of F 14 C = 0.1503 ± 0.0017 and sample sizes of 45 µg and 249 µg. Results agree within uncertainties and can be found in the Appendix A (Figure A3). Additionally F 14 C values for EC need to be corrected for contamination introduced during CO2 extraction and filter handling (procedural blank correction), as well as potential OC charring. The combined procedural blank correction and OC-charring correction of the F 14 C values for EC can be done according to the mass balance equation:
F 14 C s = F 14 C m · M m - F 14 C b · M b - F 14 C OC char · M OC char M m - M b - M OC char
where F 14 C s is the fraction modern of the EC sample; F 14 C m is the measured fraction modern and M m the measured mass concentration including contamination and charred OC; F 14 C b is the fraction modern of the procedural blank and M b the mass concentration measured for a sampling blank filter; and F 14 C OC char is the fraction modern of the water-insoluble OC (WIOC) of the respective sample and M OC char the respective mass concentration of the charred WIOC. For this project it was not possible to measure the fraction modern of EC for the procedural blank, because of restricted availability of filter sample material. The F 14 C b was set as 0.65 ± 0.32 , which is an average of two previous blank measurements with an uncertainty range of 50%, where the CO2 from several 2stepCIO extractions have been combined to have enough material for radiocarbon analysis in the AMS. For M b the actual EC mass concentration determined with the ACS of the respective sampling blank has been used, which shows an average value of 0.064 ± 0.06 µg/cm2. The fraction modern of WIOC also could not be measured for this project, because not enough filter material was available. F 14 C OC char was set as 0.57 ± 0.14 for all samples. This value corresponds to the average and the respective standard deviation of F 14 C (WIOC) for 24 samples from a study [9] conducted at the same measurement site between February 2011 and March 2012. Dusek et al. [23] estimated that charred WIOC contributes at most 5% to the analyzed EC. During filter analysis on the Sunset analyzer (2stepCIO (Sunset)) the OC charring has been monitored optically using the laser transmission signal and was found to be not significant. Under these conditions M OC char was set as 2.5 ± 2.5% of the respective EC sample mass concentration. Since the EC yield was close to 100%, the F 14 C data were not corrected for EC loss.

2.4. Radiocarbon Analysis of EC at LARA

For sample preparation a 24 mm quartz-fiber filter punch of each PM2.5 sample was extracted with 20 mL ultra pure water (18.2 MΩ) with a 25 mm polycarbonate filter holder (Sartorius) and was dried in a laminar flow box for 6 h. A 1.5 cm2 punch of the water-extracted filter was treated with a thermo-optical OC-EC analyzer (Model 4L, Sunset Laboratory Inc., Tigard, OR, USA) using the first three steps of the “Swiss 4S protocol” to remove all remaining water-insoluble OC. The remaining EC was combusted at 760 °C in O2 (99.9995%) after complete OC removal [24]. The evolved CO2 was guided to a gas inlet system [33], where the sample is diluted with helium to 5% CO2 [34]. The CO2/He mixture is directly fed into the Cs sputter ion source of the “MIni CArbon DAting System” (MICADAS) AMS at a constant rate [35]. The 14C/12C ratio of the resulting C-ions are expressed as fraction modern.
All reported results were corrected for isotopic fractionation, using the measured 13C/12C ratio of OX-II (SRM 4990C). Furthermore corrections for cross- and constant contaminations are applied. Results for F 14 C (EC) were not field blank corrected, however they were corrected for the loss of EC and for OC-charring during the first three steps of the applied thermo-optical protocol. EC yields and the degree of charring was quantified from the laser transmission raw signal, using the Lambert-Beer law [24]. To do so, the measured F 14 C (EC) was extrapolated to 100% EC yield considering the empirically determined relationship between the EC yield and the measured F 14 C (EC) [36]. The correction for OC-charring is done by subtracting the quantified mass of charred OC and its 14C/12C ratio from the measured F 14 C (EC) by isotopic mass balance.

2.5. Radiocarbon Analysis of EC at LABEC

At the LABEC laboratory in Florence a sample preparation-graphitization line specially dedicated to aerosol samples is available. The water-extracted filter sample is placed in a self-constructed oven, where the combustion takes place. Isolation of EC is achieved by pre-combustion in purified O2 at 375 °C for 40 min and subsequent flash heating at 750 °C in purified He to remove OC. Combustion of EC is then accomplished by heating the oven to 800 °C for 20 min in a constant O2 flow of 100 mL/min [6]. In order to ensure complete combustion, a CuO catalyst is placed close to the oven. The evolving gas is then purified by passing through chemical traps to remove halogens and sulfate and through a thermal trap for the removal of H2O and N2O. The purified CO2 is trapped in a reversible cryogenic trap and finally transferred into the graphitization reactor. The reduction to graphite is done according to the Bosch reaction at a temperature of 600 °C, using iron powder (Alfa Aesar, 99.9+%, <10 µm) as a catalyst and trapping the produced water in a cold-finger with the help of a Peltier-based device. The hydrogen used for the reaction is provided by a gas generator and has a purity of 99.999%. The iron powder is cleaned previous to the reaction by heating it in vacuum at 600 °C and then heating in hydrogen at 350 °C. More details about the sample preparation line at LABEC can be found in [37].
Radiocarbon analysis at LABEC is done with an AMS system manufactured by HVEE and based on a 3 MV Tandetron. Results are normalized to a set of NIST OX-II (SRM 4990C) standards and corrected for isotopic fractionation using the simultaneously measured 13C/12C ratios. Special attention thereby was paid to produce samples of the same size, to minimize machine induced isotopic fractionation. Alfa Aesar graphite samples were measured, to be able to subtract background counts. The overall analyzing procedure was checked by measuring also reference material (IAEA-C7).
An overview of all investigated radiocarbon analysis methods with their main characteristics is presented in Table 2.

2.6. Thermo-Optical Analysis with a Commercial OC-EC Analyzer

The determination of carbon fraction concentrations in aerosol particle filter samples by the thermo-optical technique has been widely accepted as a reference method [20]. In this work the thermo-optical OC-EC analyzer manufactured by Sunset Laboratory Inc. (Model 5L), which allows the utilization of pure oxygen for the analysis, was used. Reference concentrations of OC and EC have been determined with the EUSAAR_2 protocol [17]. This measurement protocol is widely used in Europe and was optimized for analyzing carbonaceous aerosol at European regional background stations. In the EUSAAR_2 protocol the filter sample is first heated in an inert helium atmosphere in different steps up to a highest temperature of 650 °C, which causes the evaporation of OC. After a rapid cooling to 500 °C the sample is heated in four steps to a temperature of 850 °C, but this time in a mixture of helium and 2% oxygen to oxidize all residual carbonaceous material. The laser transmission signal is used for the charring correction.
The 2stepCIO protocol, described in Section 2.3, was also implemented on the Sunset instrument to allow for a direct comparison of the 2stepCIO protocol with the EUSAAR_2 protocol on the same device. The main objective was to allow more detailed tests of the ACS protocol with an automated method instead of the time consuming extraction on the manual ACS setup. In this project it was used to test the recovery of EC with varying length of the intermediate temperature step (450 °C). In the 2stepCIO protocol on the Sunset analyzer OC is defined as all carbon combusted in the first temperature step (375 °C), EC is all carbon from the last temperature step (650 °C) and TC is all carbon combusted during the whole thermal protocol including carbon coming off in the intermediate step.
All carbon concentrations are first corrected with the instrument blank, which represents the background contamination of the instrument during the analysis, and subsequently with the sampling blank. The sampling blank represents a measure of contamination added to the filter during sampling, storage and filter handling. In general sampling blanks are more influenced by the adsorption of organic compounds and not by contamination with EC material.

3. Results and Discussion

In the following section carbon concentrations determined with the 2stepCIO protocol are validated against results from the EUSAAR_2 thermo-optical protocol and the recovery of EC for radiocarbon analysis is investigated. In the second part results of the inter-comparison study of 14C in EC are discussed.

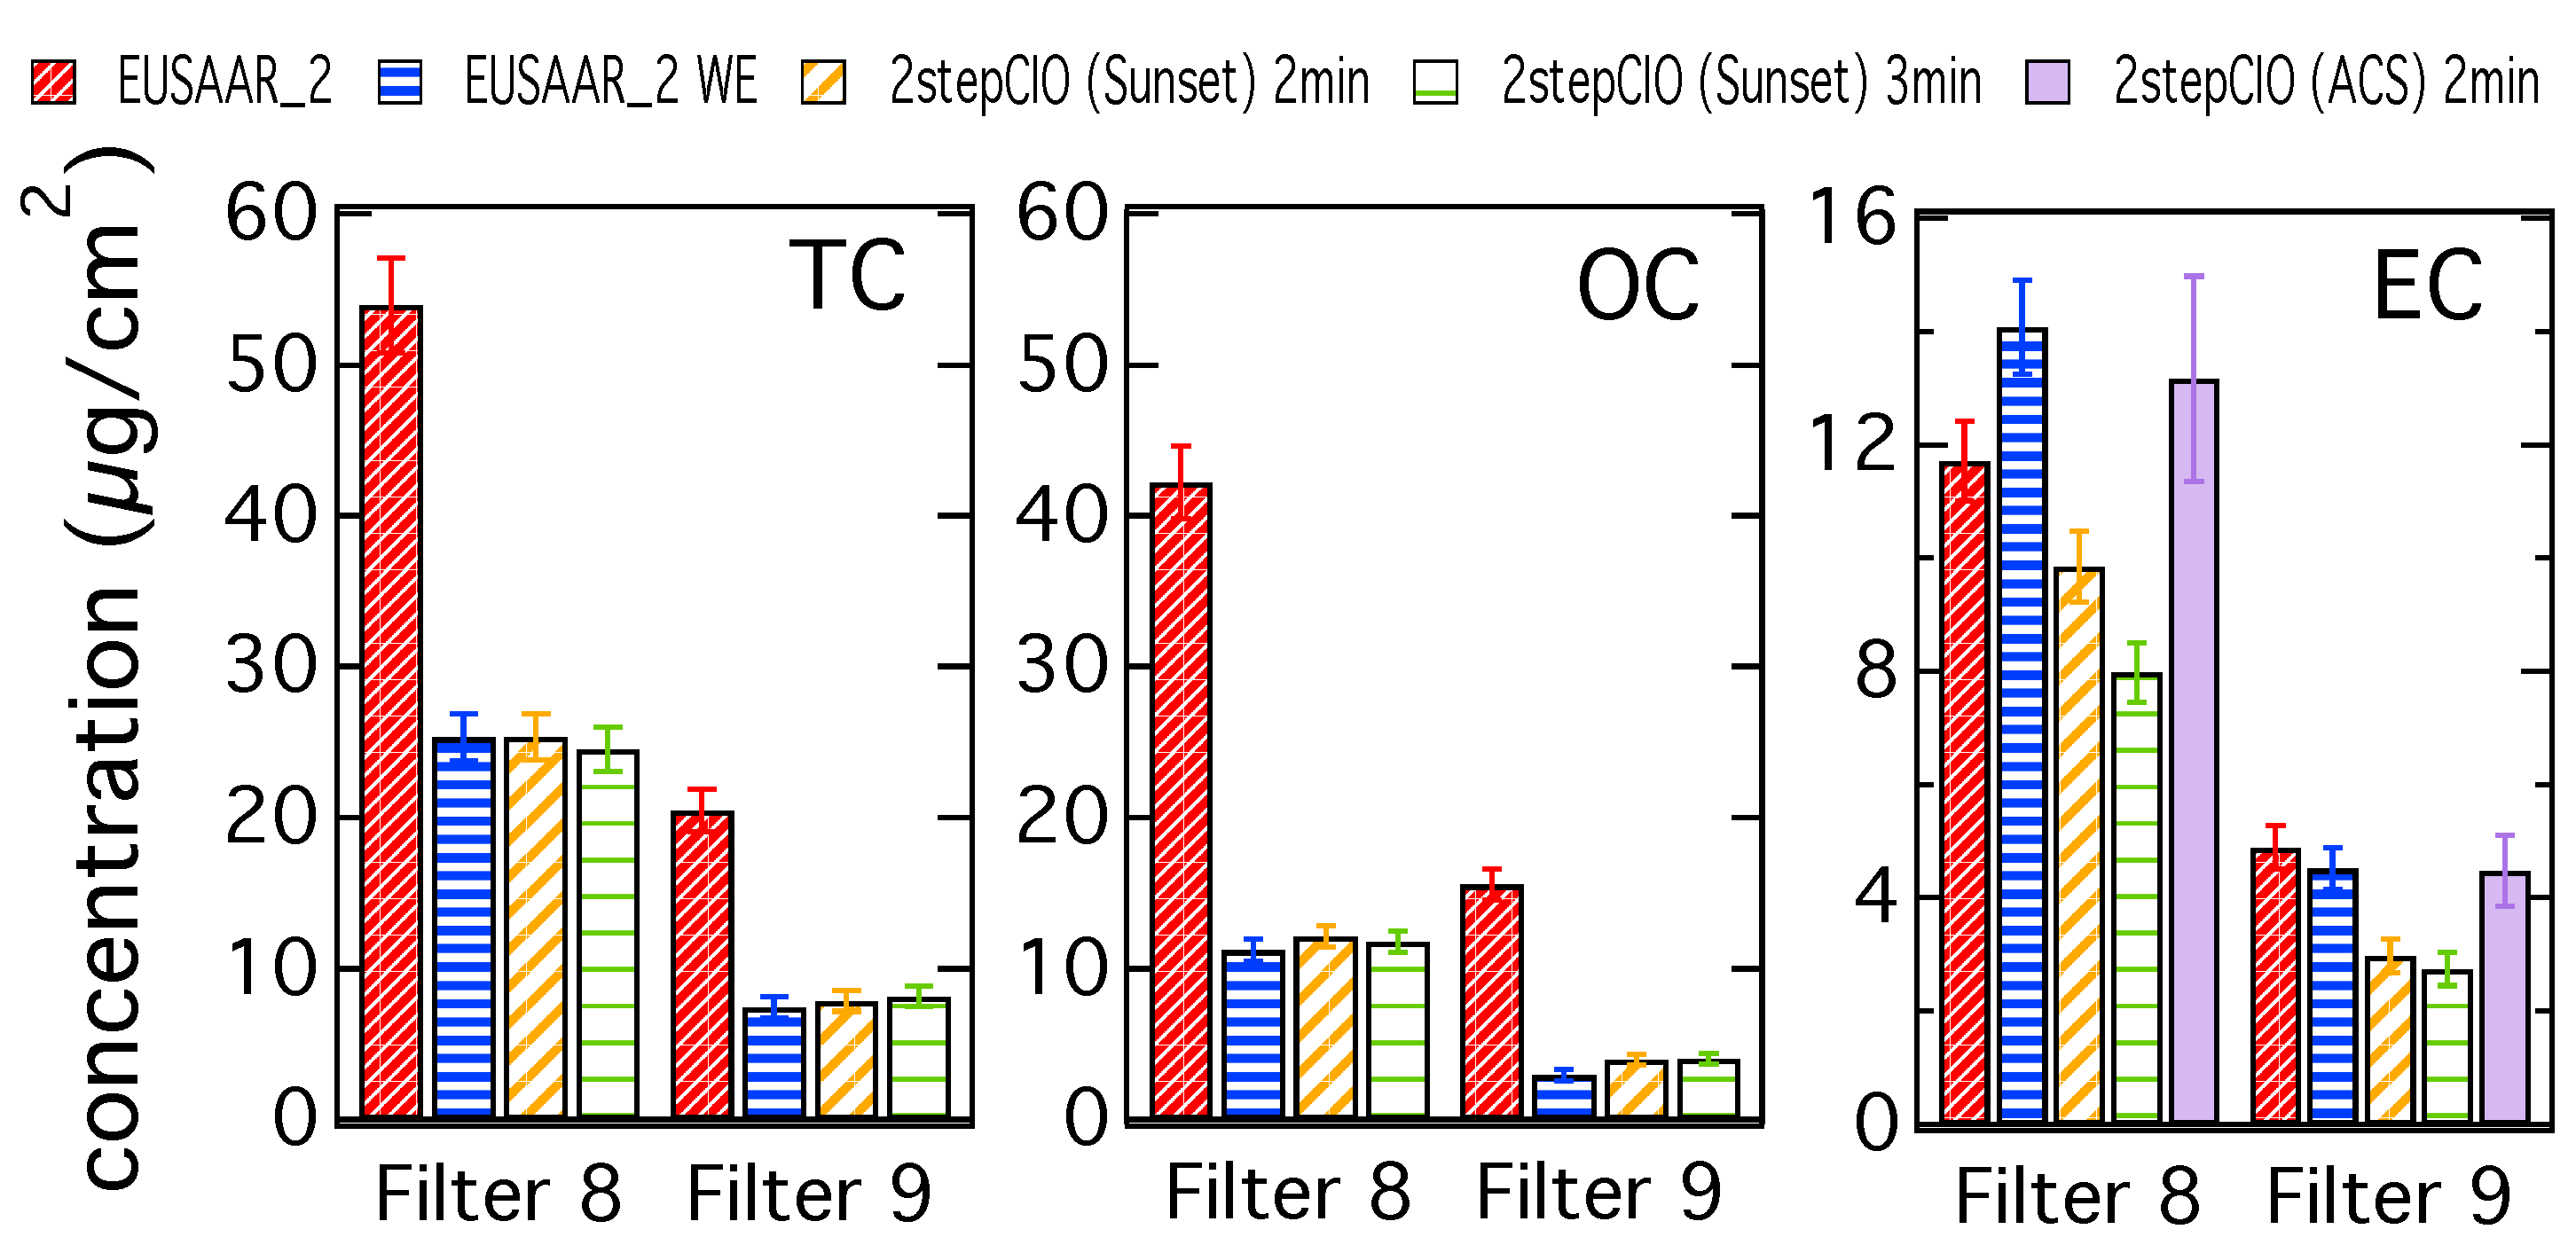
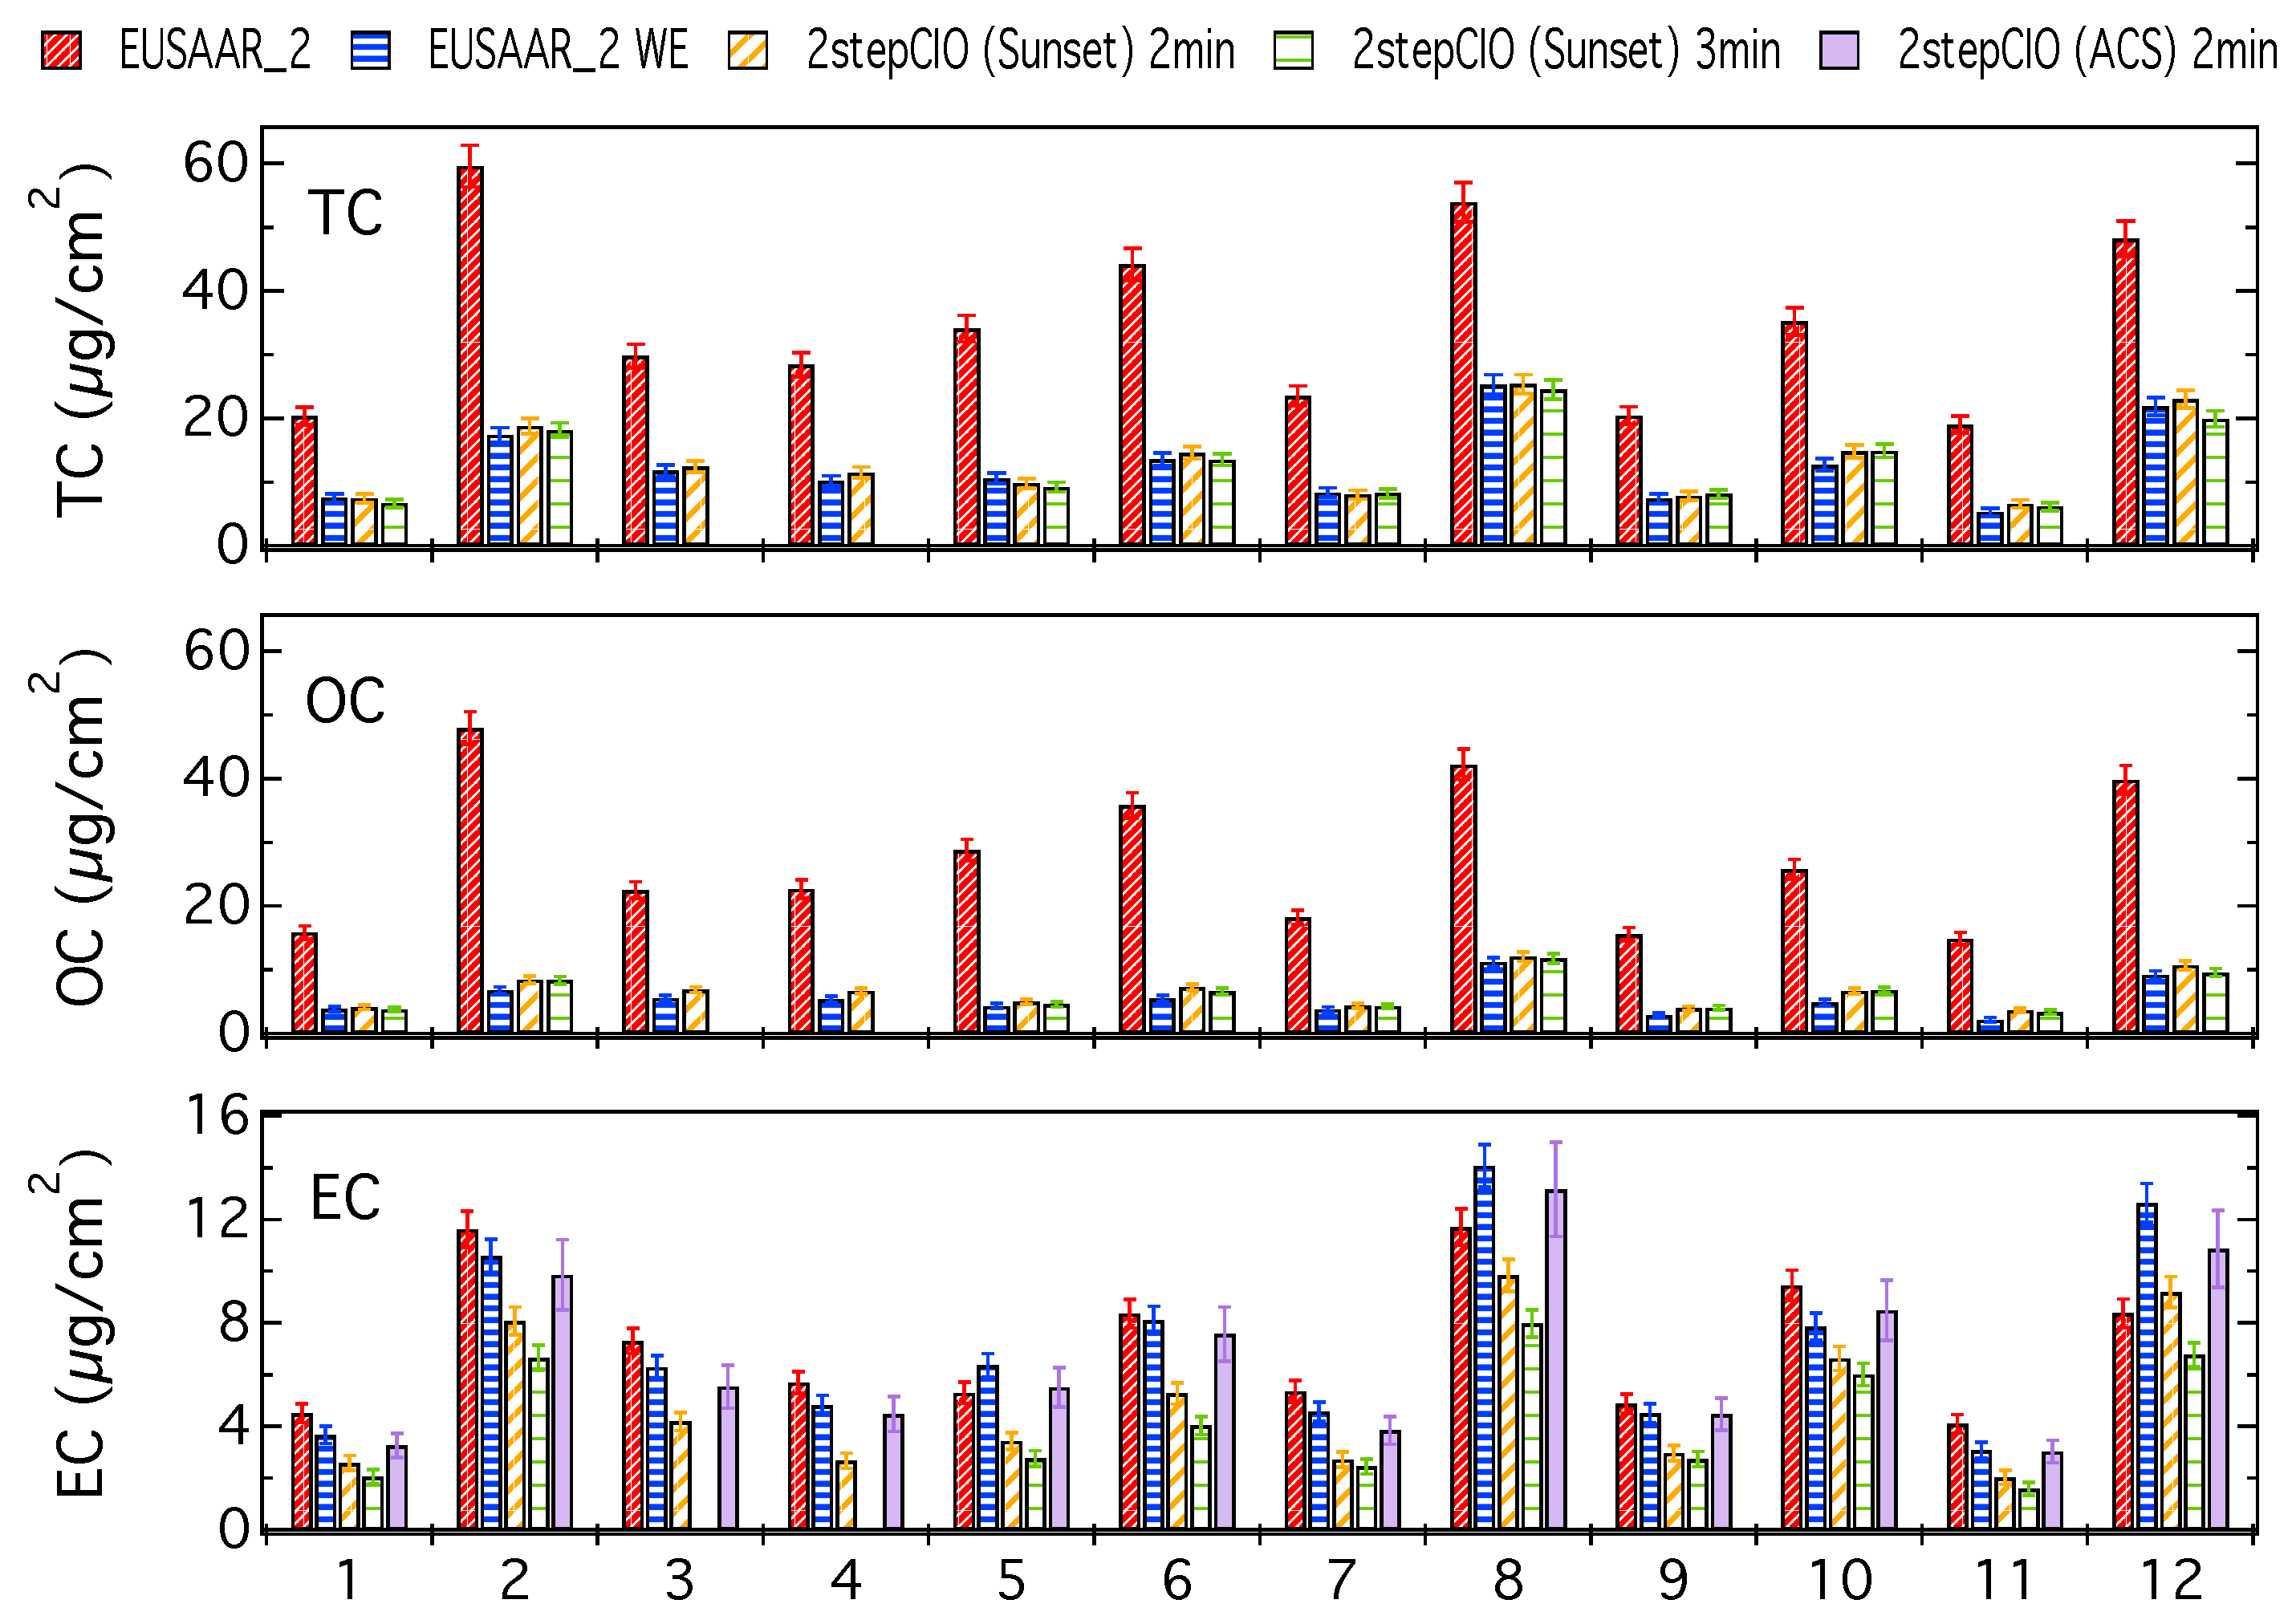
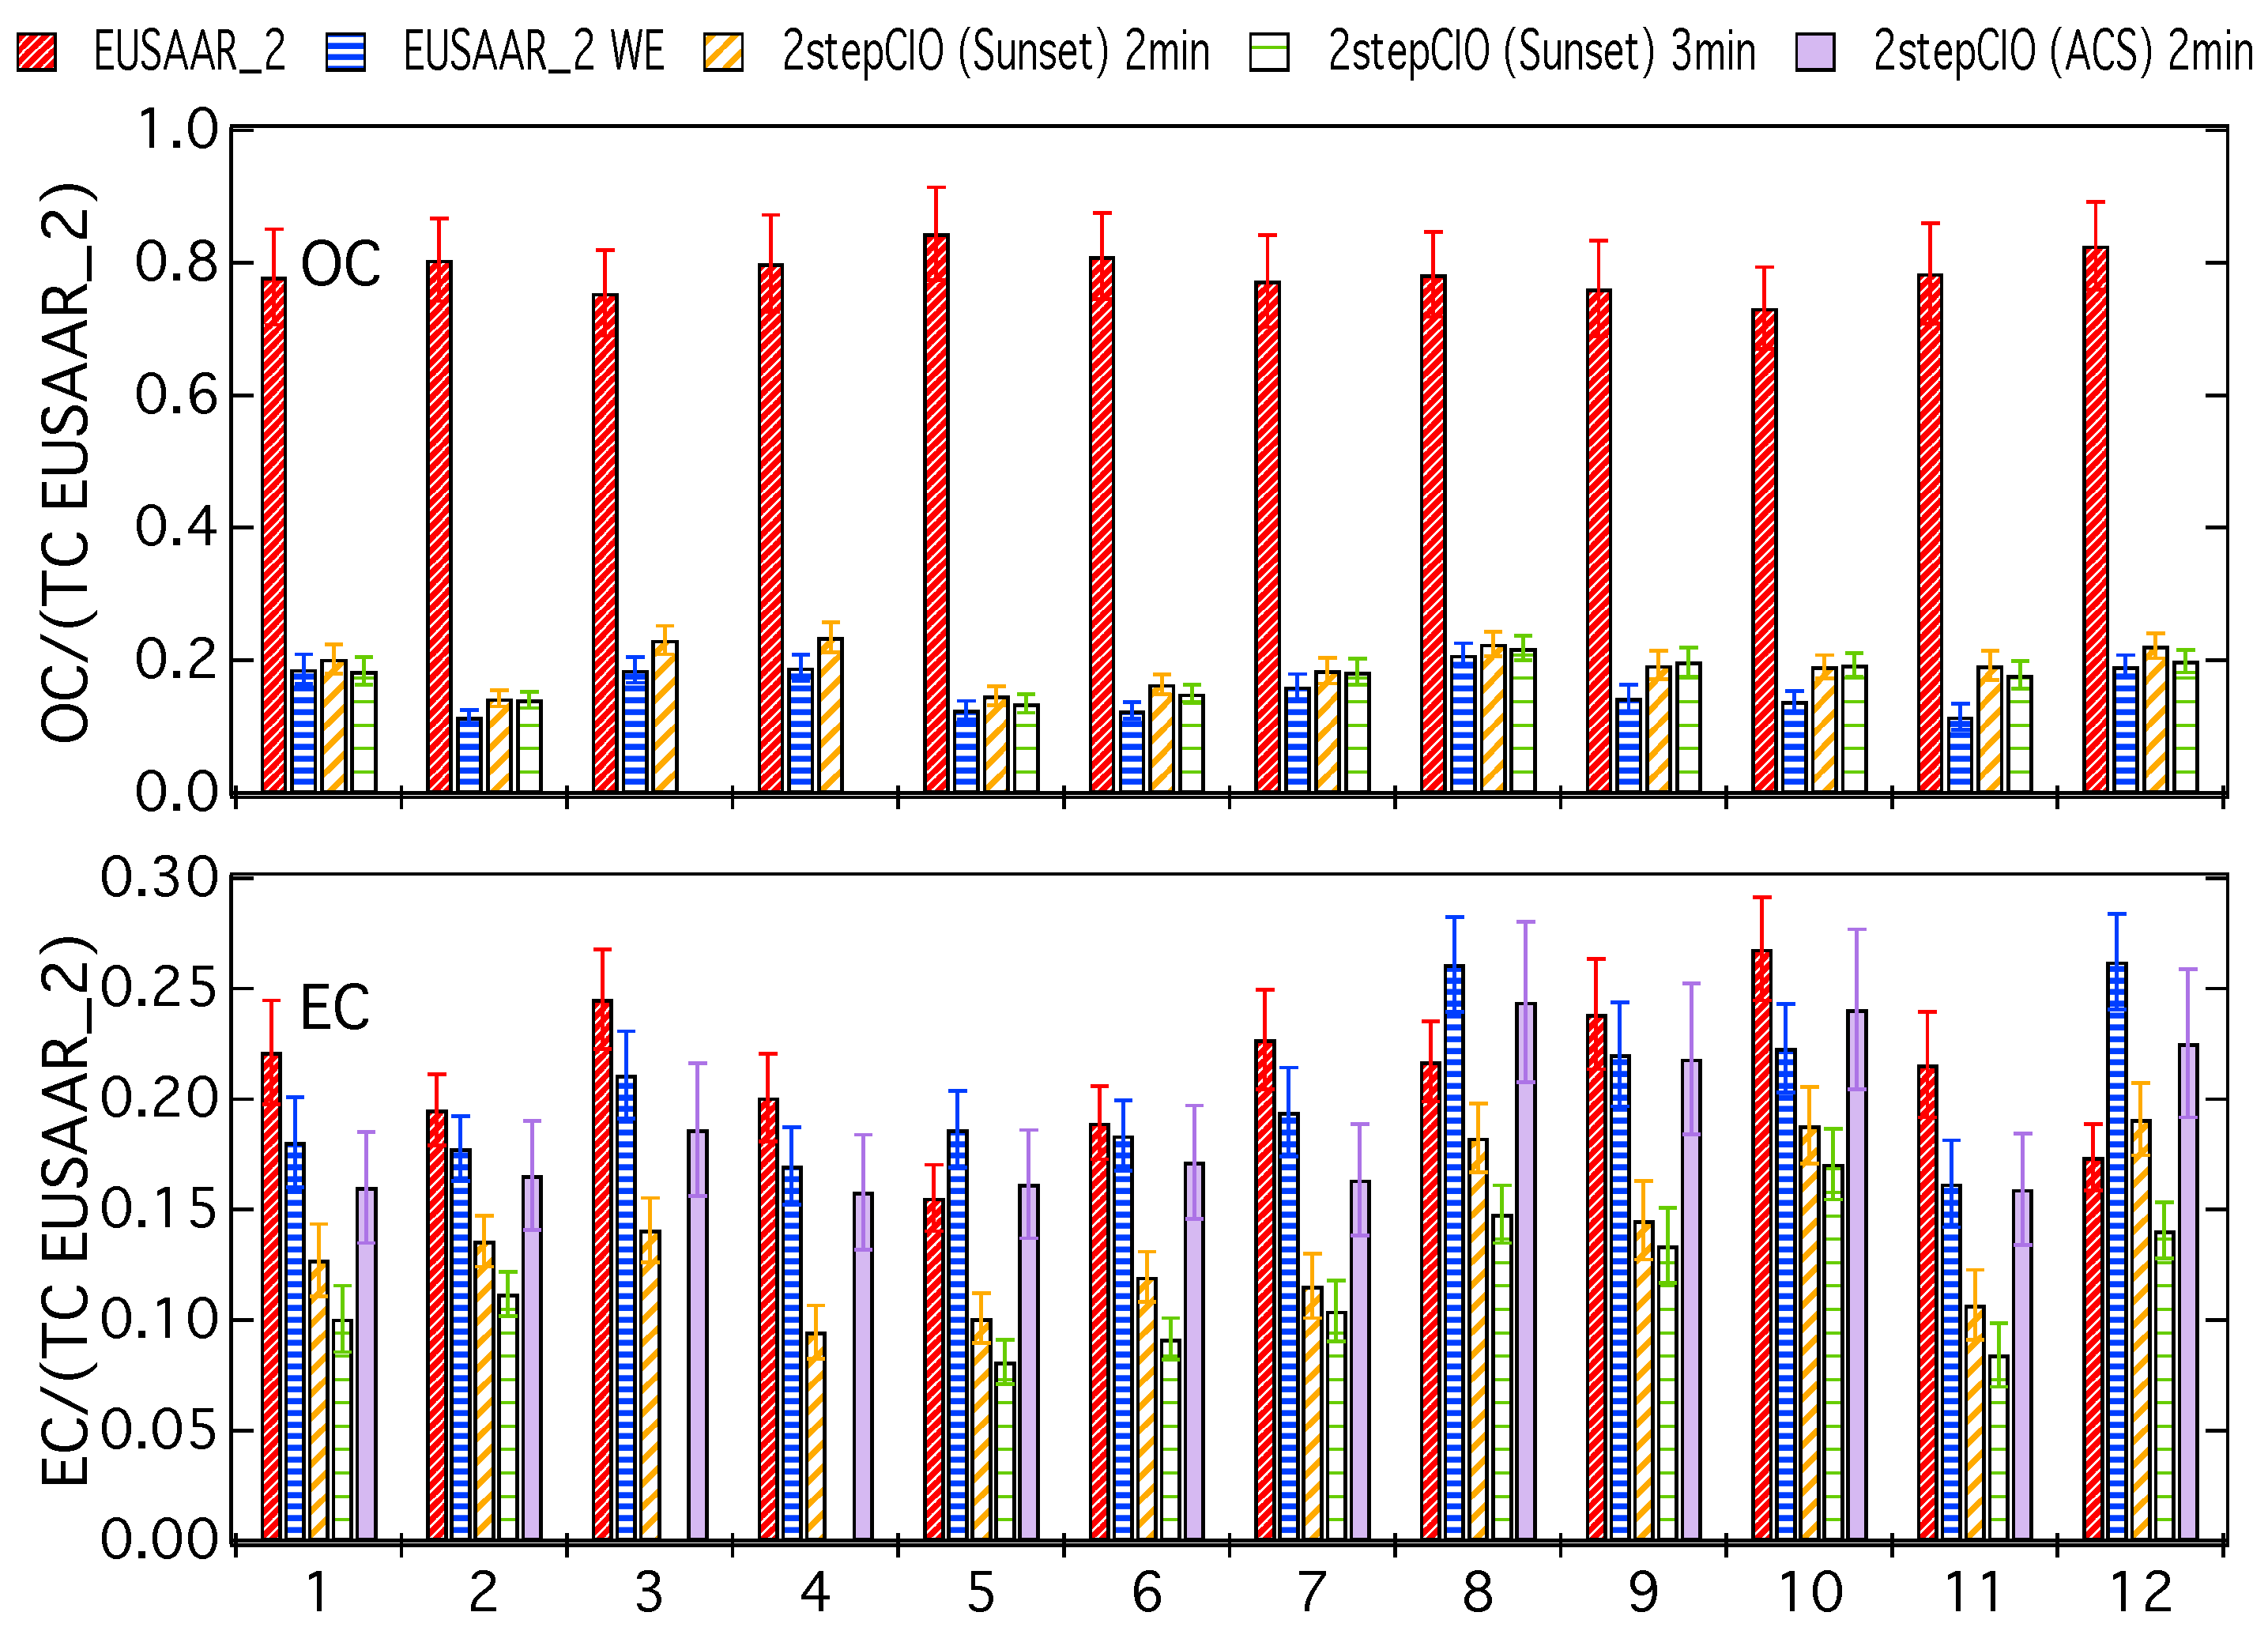
3.1. Analysis of OC-EC Concentrations (CIO)

Figure 1 shows the concentrations of TC, OC and EC for a five-day filter (8) and a two-day filter (9), which represent typical cases from this study. Results for all filter samples are provided in the Appendix A (Figure A1). Additionally in the Appendix A in Figure A2 the results for all filter samples are shown and discussed as a fraction of the respective TC concentration on the untreated filter sample determined with the EUSAAR_2 protocol.
The different bars represent carbon concentrations determined with the EUSAAR_2 protocol, the 2stepCIO protocol implemented on the Sunset analyzer and the 2stepCIO protocol on the ACS extraction system (purple). The EUSAAR_2 protocol has been applied to the untreated filter samples (EUSAAR_2 in red) and to the water-extracted filter samples (EUSAAR_2 WE in blue). The 2stepCIO protocol on the Sunset instrument has been applied with an intermediate step (450 °C) of 2 min (yellow) and 3 min (green) for water-extracted filter samples. In the case of multiple analyses, e.g., filter sample 8 was analyzed three times for each protocol, the averaged results are shown. Error bars show the uncertainty range of the results determined by the Sunset analyzer, which are defined by the detection limit of the instrument and random variability from running duplicates.
TC and OC concentrations are both much higher for the untreated filter samples, which implies that most of the OC is water-soluble. TC and OC concentrations agree within their uncertainty for the different protocols on the water-extracted samples, whereas EC concentrations differ. Results for filter sample 9 represent a typical case, where the EC concentration determined with the EUSAAR_2 protocol for the water-extracted sample is slightly lower than for the untreated sample, because even though EC is water insoluble, some particle loss during water-extraction cannot be avoided. Results from the 2stepCIO protocol on the Sunset analyzer show a lower concentration for EC than determined with the EUSAAR_2 protocol, because for the 2stepCIO protocol the EC recovery is less than 100%. The recovered EC concentration further decreases when the intermediate step is longer (2stepCIO (Sunset) 3 min). In contrast the EC concentration determined with the 2stepCIO protocol on the ACS is higher than the EC determined with the 2stepCIO protocol on the Sunset analyzer. EC analyzed on the ACS is similar to the results from the EUSAAR_2 protocol for water-extracted filter samples. Carbon fraction concentrations are in general higher for filter sample 8, but results from the different protocols behave in principle similar to what was observed for filter sample 9, except for EC analyzed with the EUSAAR_2 protocol, which shows higher concentration on the water-extracted sample than on the untreated sample. Since it is impossible that EC is added during water extraction treatment, it is more likely that this unusual result is caused by the analysis method. Filter samples 8 and 9 actually show similar concentrations per m3 of air, but due to the longer sampling time, filter 8 has a much higher carbon concentration per filter area and was also of darker color than filter sample 9. This can cause difficulties for the transmission measurement and can make the positioning of the split point problematic. This could result in an underestimation of EC when using the EUSAAR_2 protocol on untreated filter samples. After water extraction, charring is much reduced and the split point is probably more reliable for highly loaded filter samples.
Piazzalunga et al. [38] investigated the effect of water-extraction on the quantification of EC in urban aerosol samples and found that EC on water-extracted samples was generally higher than on untreated samples. Another explanation for the observed underestimation of EC for the EUSAAR_2 protocol on untreated filter samples might be found in a study by Subramanian et al. [39]. They noticed that the filter loading has a significant influence on the optical signal during the analysis. Samples with low filter loading show a linear relationship of the laser attenuation and the filter loading, but at high filter loadings the laser attenuation decreases. This is known as the “shadowing” effect [40] and was characteristic for filter with more than 15 µg/cm2 carbon coming off in the helium/oxygen phase of the thermal-optical analysis. Filter 8 shows carbon concentrations for this phase of approximately 35 µg/cm2 for untreated samples and 17 µg/cm2 for water-extracted samples. In this case water-extraction improves the analysis of EC, because the optical signal is more reliable and the split point can be determined in a more correct way. Filter 9 shows carbon concentrations for the helium/oxygen phase of about 13.5 µg/cm2 for untreated samples and about 5 µg/cm2 for water-extracted samples, which had in both cases no disruptive influence on the optical signal during analysis.
Figure 2 shows the ratio of the EC concentration on water-extracted (EC WE) and untreated (EC) filter samples versus the TC concentration on the untreated filter samples.
Red circles show results from this study determined with the EUSAAR_2 protocol and black triangles show results from Dusek et al. [9]. In the study by Dusek et al. [9] filter samples have been taken at the same measurement site, but carbon concentrations are determined by the QUARTZ protocol [41] on a Sunset analyzer with a flame ionization detector.
Ideally one would expect a ratio around one, because EC is not water-soluble. In reality a small part of the EC can be lost during water extraction and so a ratio slightly less than one is possible. Ratios higher than one, even up to more than 2.5 as shown in Figure 2, are unexpected. These high ratios coincide with a high TC concentration per filter area, which supports the above hypothesis that EC might be underestimated due to a problematic charring correction on highly loaded filters with a TC concentration on the untreated filter samples of higher than approximately 50 µg/cm2 [39]. One should be cautious, if thermo-optical OC and EC concentrations from highly loaded filter samples are used to estimate EC recoveries or to derive absolute concentrations of fossil or biomass burning EC. Our study confirms observations made by previous studies [38] and suggests that water extraction of highly loaded filter samples prior to EC analysis might lead to more trustworthy EC concentrations, despite the potential losses during water extraction.
Figure 3 shows a comparison of EC from the long-term filter versus the 24-h filter for three different protocols. The ratio of EC on the long-term filter with respect to the sum of EC from the corresponding 24-h filter samples is shown versus the sampling duration in days.
For a sampling duration up to four days the ratios are close to one for the EUSAAR_2 WE protocol, indicating that for water-extracted samples EC on long-term filter samples agrees within less than 10% with the sum of EC on the 24-h samples. For the EUSAAR_2 protocol on the untreated samples the ratios are significantly smaller than one, indicating that EC is underestimated on the long-term filter samples with respect to the corresponding 24-h samples. For the highly loaded filter sample with a sampling duration of five days EUSAAR_2 underestimates the EC concentration on the long-term filter in comparison with the sum of the 24-h filter, whereas EUSAAR_2 WE shows an overestimate. The underestimate of EC for untreated long-term filter samples with the EUSAAR_2 protocol is probably related to the underestimate of EC on highly loaded filter samples shown in Figure 1 and Figure 2. The overestimate of EC on the long-term sample with EUSAAR_2 WE with a sampling duration of five days is probably related to the process of water extraction. During water extraction a small part of EC is lost and this has a bigger impact on the sum of the 24-h samples, where the process was in total performed five times. In general this also influences results from shorter sampling time periods, so that the overestimate should increase with increasing sampling duration. This effect is not clearly visible and with respect to the range of uncertainty it can be also neglected. EC concentration on the long-term samples is underestimated with respect to the 24-h samples for the 2stepCIO protocol. Reasons for this behavior could not be clearly identified.
Similar results were found by Cheng and He [42], where 24-h filter samples were compared to samples with a sampling time of 48 h and results were obtained with a DRI carbon analyzer and the IMPROVE-A temperature protocol. They noticed that with higher OC loading the potential of charring is higher and so the analytical artifact, which means the underestimation of EC caused by this type of analysis is more emphasized. On average EC concentrations on 48-h filter samples were about 15% lower than results from 24-h filter samples. Furthermore, in a study by Chiappini et al. [20], where 24-h filter samples have been compared with samples taken with varying sampling times of two, three and five days, tendencies to have lower EC concentrations on long-term filter samples compared to the sum of the 24-h filter samples were found.
As a conclusion of this comparison and also confirmed by the literature [38,39] it can be said that it is best to determine EC concentrations on water-extracted filter samples, especially when doing source apportionment of carbonaceous aerosol with the help of radiocarbon analysis.
Figure 4 shows the EC recovery, which is the ratio of the EC concentration determined with a given protocol to the EC concentration determined with the EUSAAR_2 WE protocol. The red bars represent the average recovery with the standard deviation as error bar and the individual data points are shown as black crosses.
The 2stepCIO protocol with an intermediate step of 2 min shows a much higher average EC recovery of 0.93 ± 0.07 on the ACS than on the Sunset analyzer, where the average EC recovery is 0.67 ± 0.09 and 0.57 ± 0.09 for an intermediate step of 2 min and 3 min respectively. This shows clearly that the EC recovery is not determined by the thermal protocol alone, but is also sensitive to instrument specific parameters. Possible reasons for the non matching results might be the different volumes of the oven chambers of the two setups or the different design of the filter sample holders or even the different size of the analyzed filter sample, which resulted in different heating rates. Care should be taken when implementing or comparing similar temperature protocols on different extraction systems. Online monitoring of charring and EC losses using laser transmission during OC removal for F 14 C (EC) analysis [24] is helpful to overcome problems of variable EC recoveries.

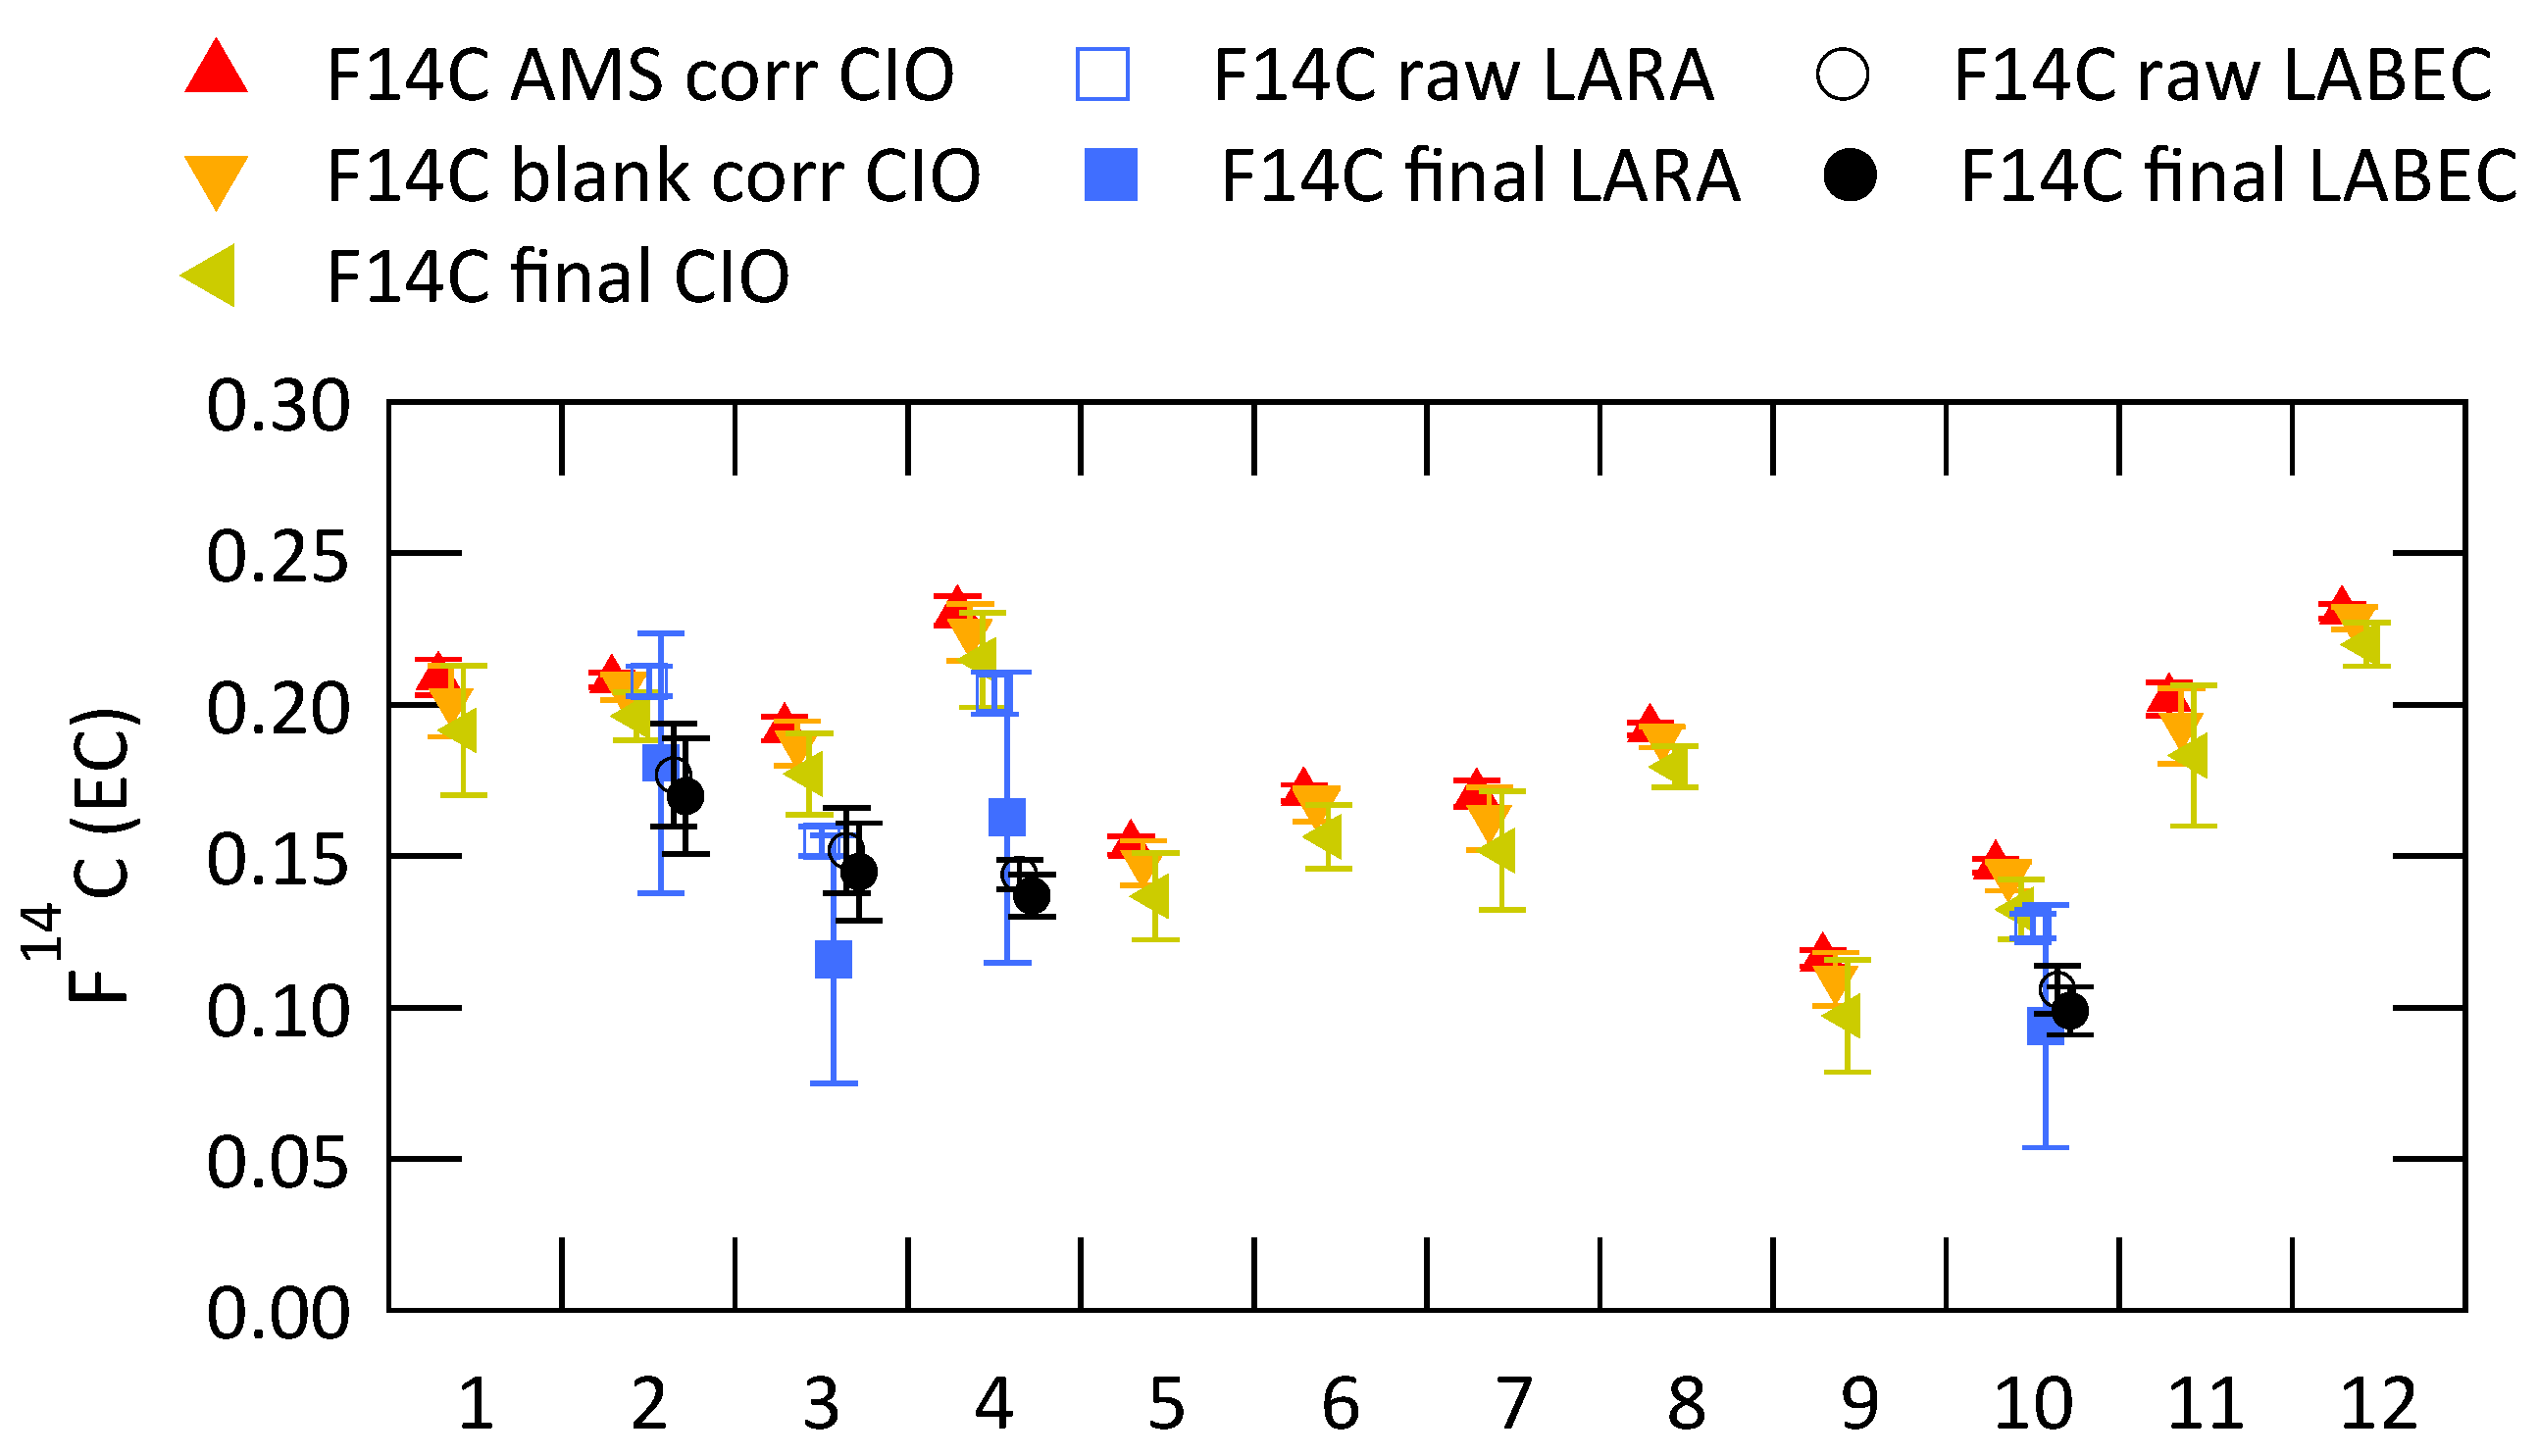
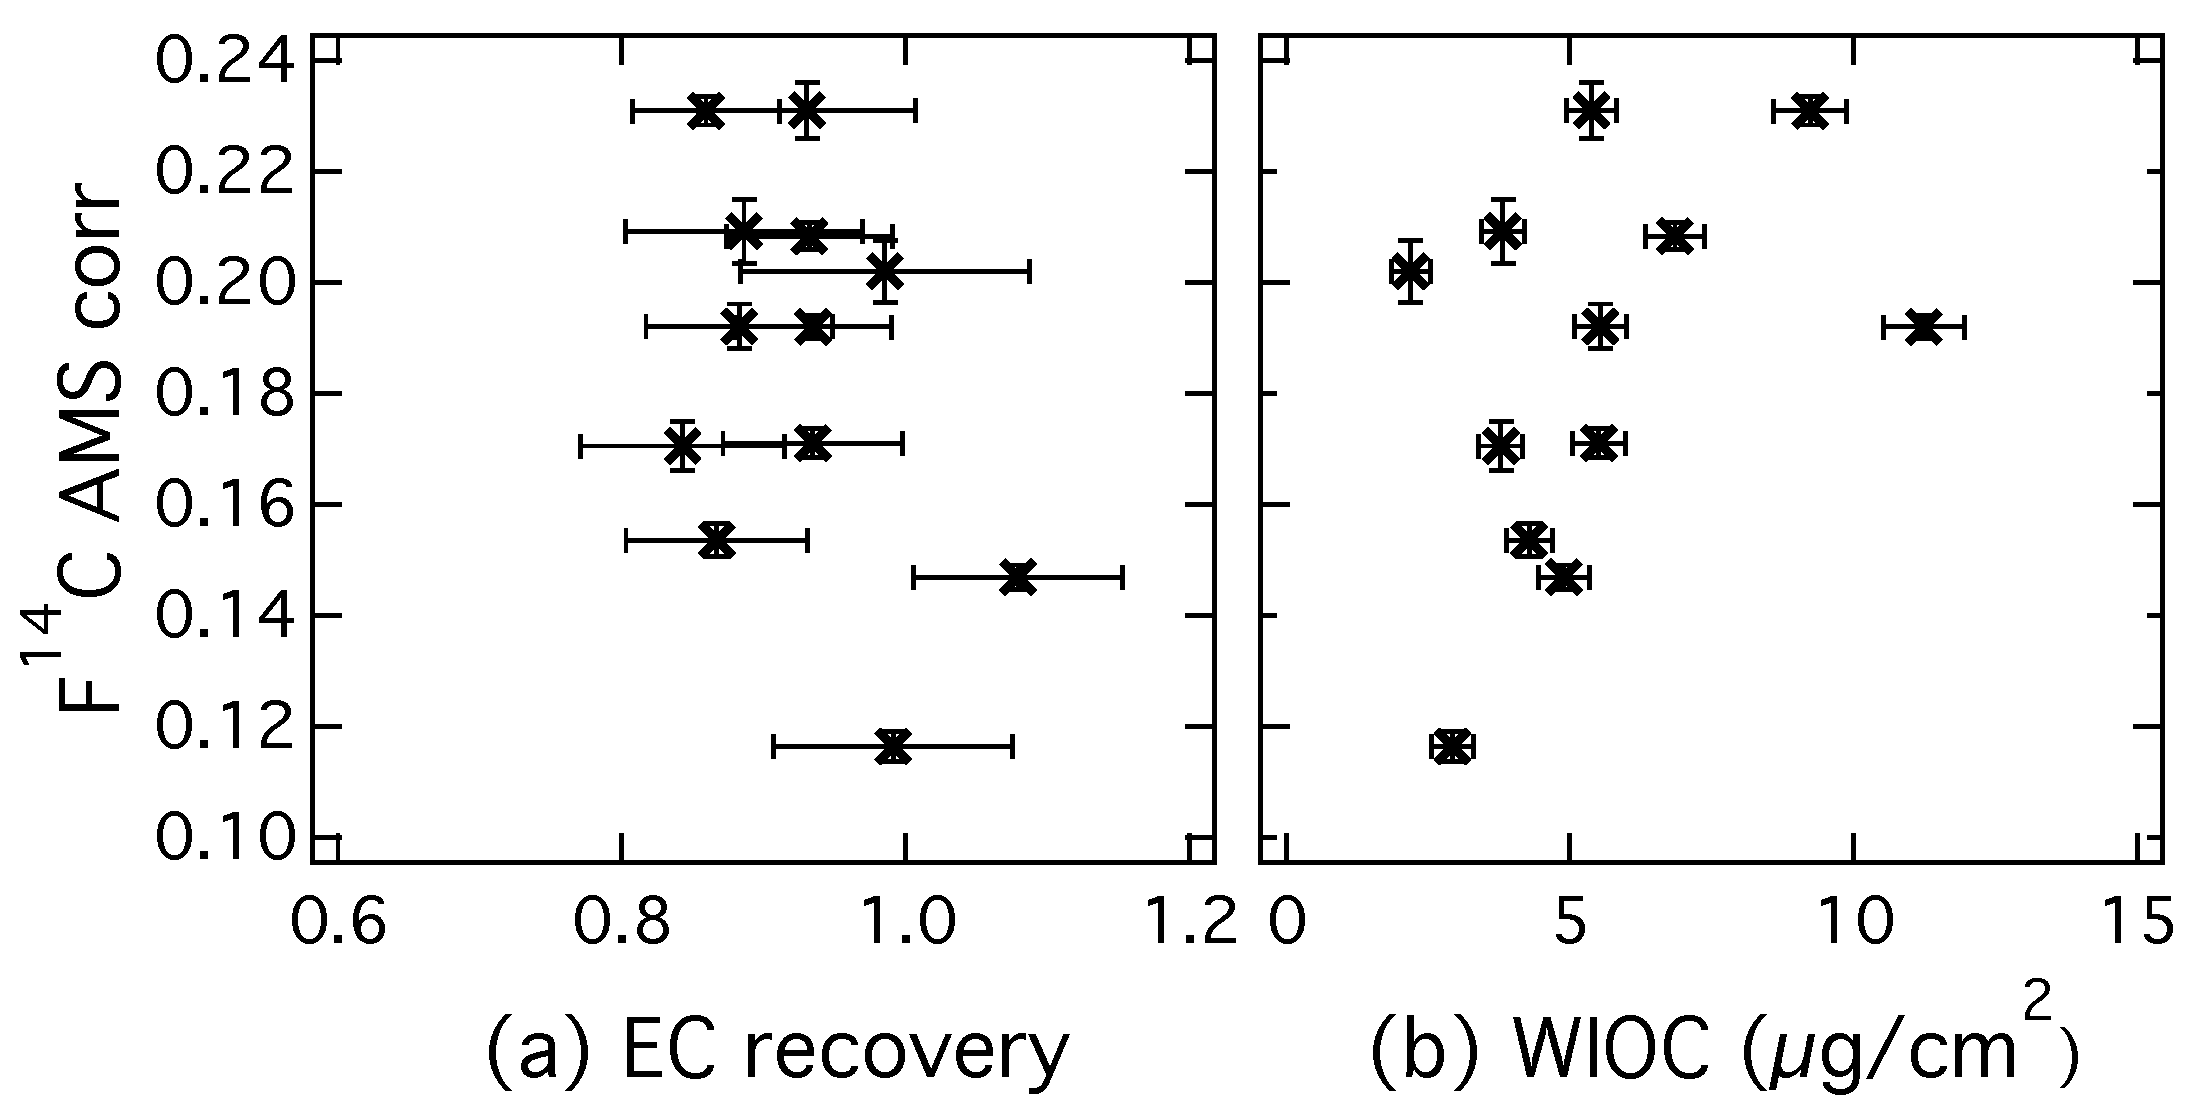
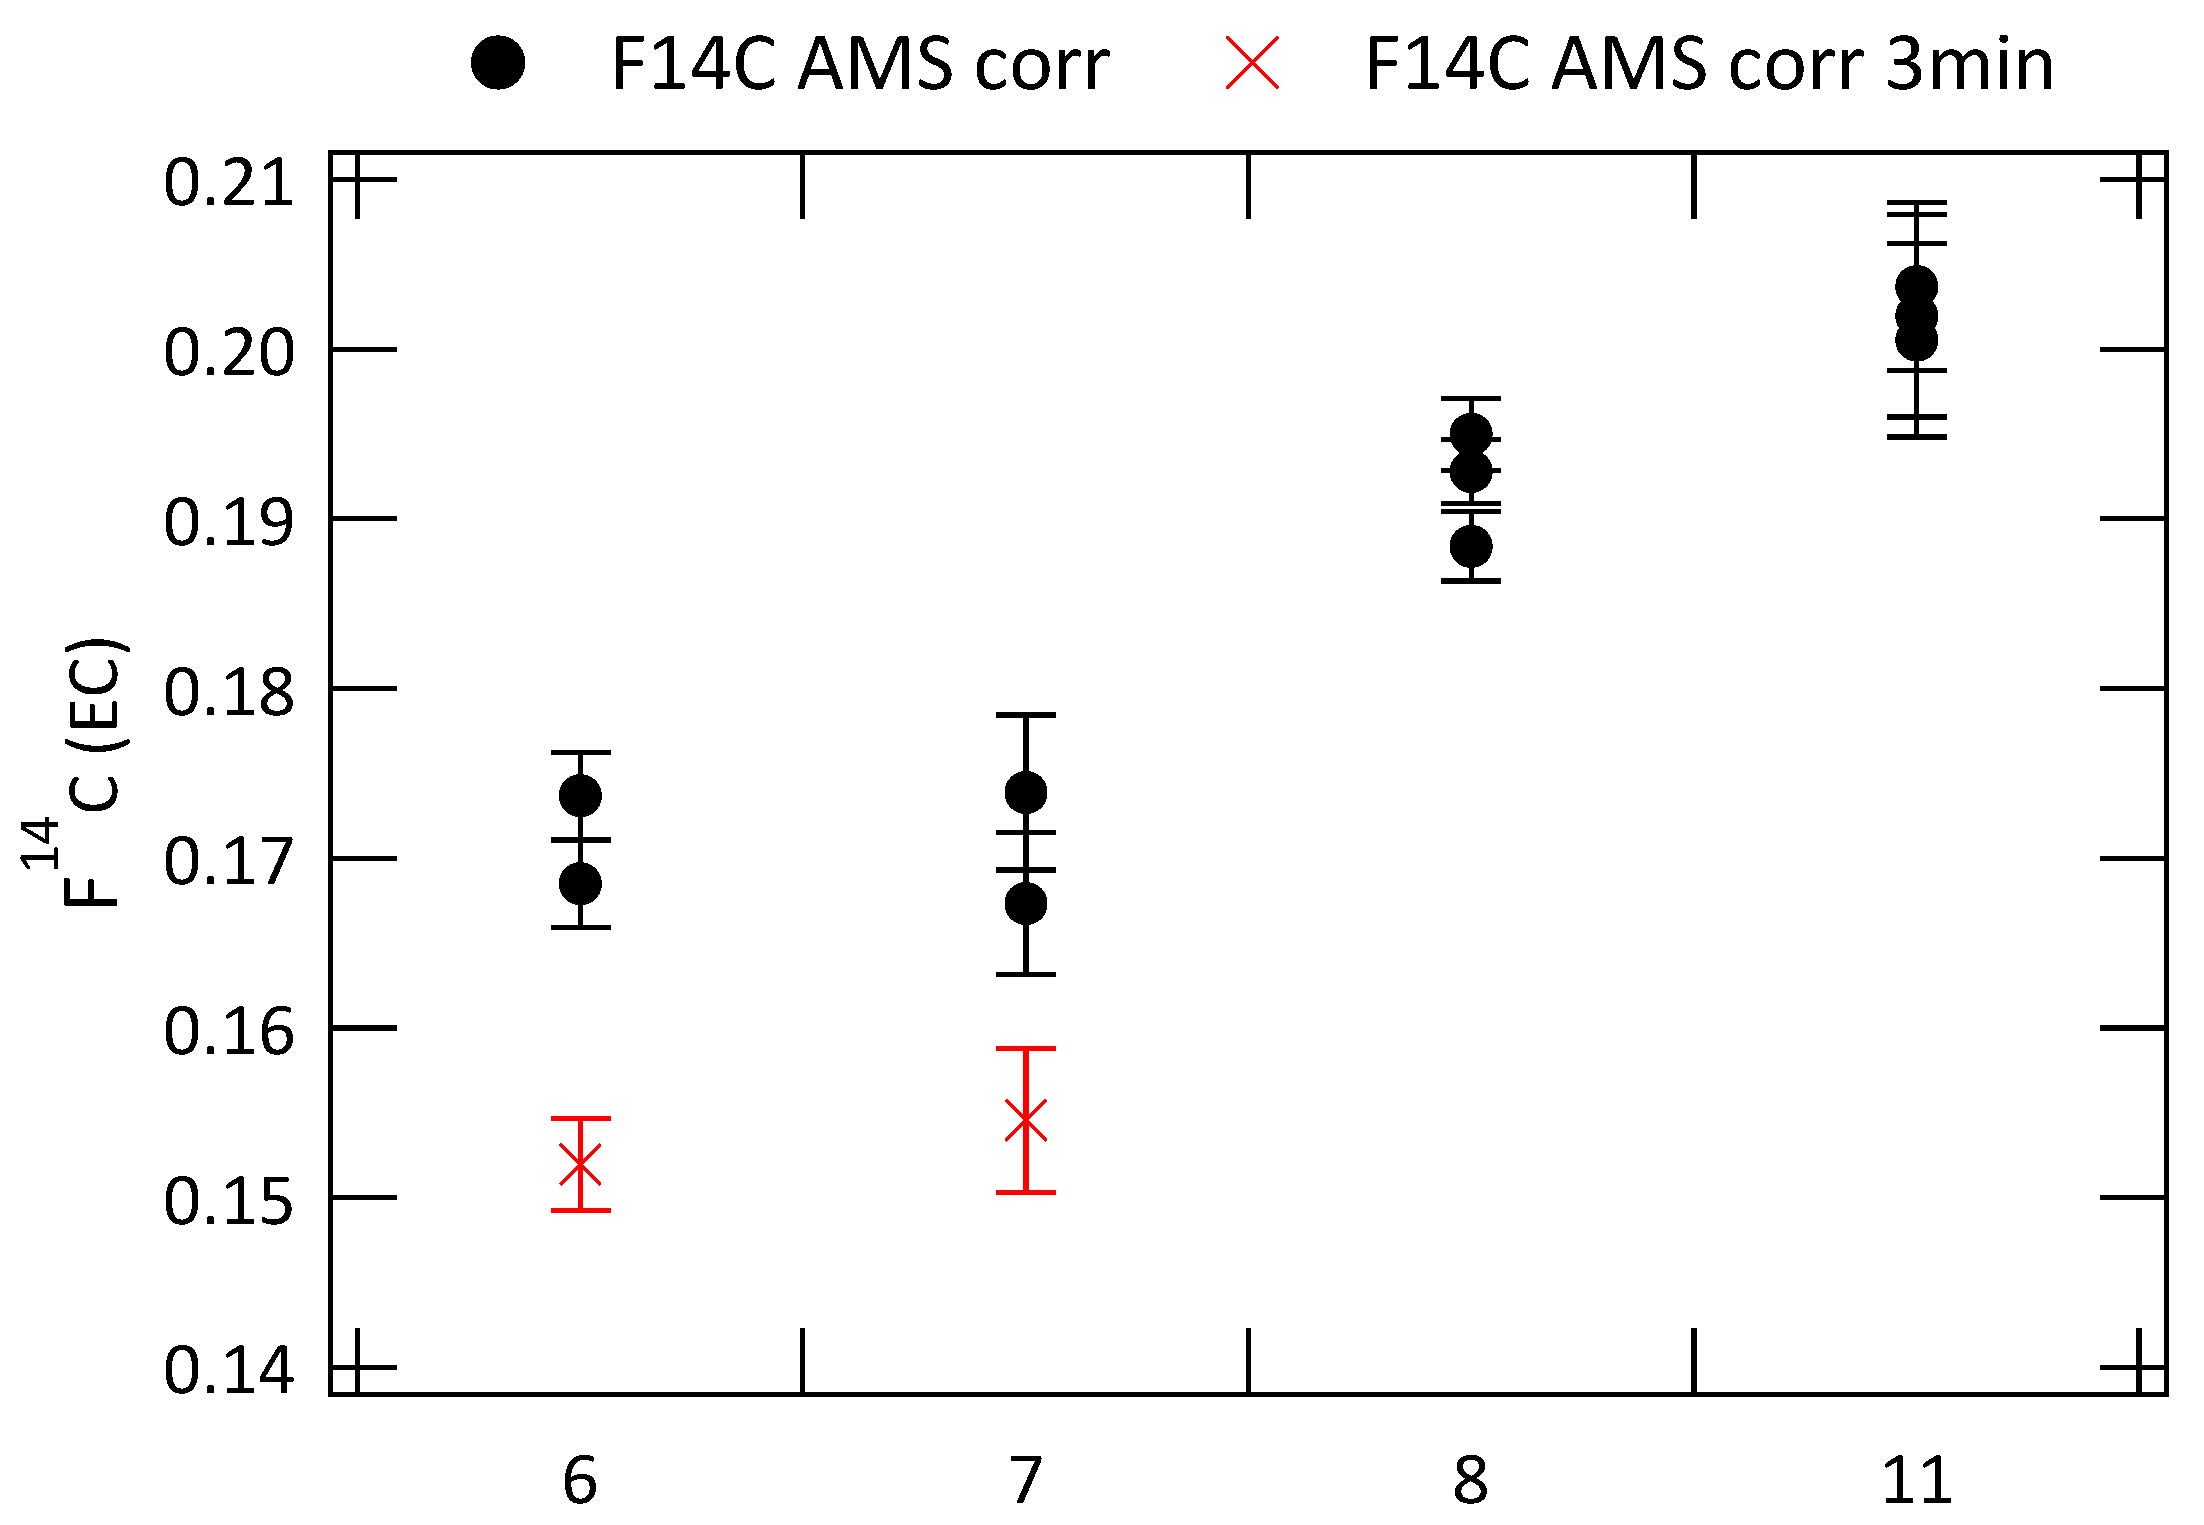
3.2. Analysis of Radiocarbon in EC: Results of an Inter-Comparison Study

Figure 5 shows the fraction modern of EC ( F 14 C (EC)) for all filters analyzed at CIO. Data points in red show results after all corrections related to AMS measurement and graphitization (normalization, correction for isotopic fractionation and background contamination), data points in orange show the results after additional sampling blank correction and data points in green show the final results after both sampling blank correction and OC charring correction. Uncertainties are calculated using error propagation. In case of multiple measurements of the same filter the average value is shown here. Results from LARA (blue squares) and LABEC (black circles) for the filter samples selected for the inter-comparison study are also shown in this figure. Open markers show the uncorrected data and filled marker show the results after application of the corrections listed in Table 2.
The F 14 C (EC) from CIO decrease after corrections are applied. Contamination introduced during sampling and handling of the filter has a higher F 14 C than EC and thus increases the value of the measured fraction modern of EC. The contamination of EC with charred WIOC also increases the fraction modern, because OC has in general more contemporary sources. During a series of increasing sampling duration from two to five days (filters 1–4; 5–8; 9–12), it seems that the fraction modern of EC increases slightly, especially for filter samples 9–12. This could potentially be caused by incomplete removal of OC for more highly loaded filter samples. Possible indicators for incomplete OC removal are a high EC recovery and a high filter loading of WIOC. These indicators are investigated in Figure 6, where F 14 C of EC (AMS corr) is plotted respectively versus the EC recovery (a) and versus the WIOC concentration (b).
High EC recoveries would coincide with a higher fraction modern of EC, if OC is incompletely removed by an inefficient intermediate removal step and contributes to the EC concentration. However, such a correlation cannot be observed in Figure 6a. The highest EC recovery for these results actually shows one of the lowest fraction modern and the variation in F 14 C cannot be explained by EC recovery. Since for highly loaded filter samples the removal of WIOC is more difficult, a positive correlation of F 14 C (EC) with WIOC concentration can also be an indication that the intermediate removal step is not sufficient and some refractive OC is still combusted in the EC step. However, Figure 6b shows no clear dependence of F 14 C (EC) on WIOC concentrations. Therefore Figure 6a,b both indicate that F 14 C (EC) is not influenced by insufficient OC removal. Even though this is no conclusive proof, it is likely that the increase in F 14 C (EC) towards the end of the sampling period is due to external factors, such as the colder temperatures that were observed or different source regions of the aerosol.
The repeatability of the radiocarbon analyses of EC at CIO was tested on four filter samples, which were each analyzed three times. F 14 C (EC) of these analyses are shown in Figure 7, before sampling blank and OC charring correction to avoid uncertainties related to these corrections.
Filter samples 6 and 7 have been analyzed both with an intermediate step at 450 °C of 2 min and of 3 min. Results for the 3 min intermediate temperature step are shown with red crosses. The results are very reproducible with standard deviations ranging from 0.0016 for filter 11 to 0.0046 for filter 7 (2 min intermediate step). The F 14 C (EC) values for extractions with a longer intermediate step of 3 min are slightly but significantly lower by about 2%. Lower F 14 C (EC) also have been observed in previous studies [24], where the temperature of the intermediate step was increased. It could be due to a more efficient removal of remaining OC or the loss of less refractory EC during the longer intermediate temperature step. This less refractory EC mostly originates from wood burning and loosing some of it will lower the F 14 C (EC) value. It is not completely certain which of the two, removal of remaining OC or removal of EC from wood burning, is the stronger effect. The results presented in Figure 6 did not show a clear connection between the WIOC concentration of the filters or the EC recovery and the fraction modern of EC, but already a small amount of remaining OC can increase F 14 C (EC) significantly.
F 14 C (EC) analyzed by the different laboratories agree well (Figure 5). The standard deviation for the different filter samples of F 14 C of the final data are: 0.0133 (filter 2); 0.0306 (filter 3); 0.0397 (filter 4); 0.0208 (filter 10). Results from the 2009 inter-comparison exercise on 14C analyses of carbonaceous aerosols, presented in [27], show a standard deviation for the uncorrected F 14 C (EC) data of 0.065 (Milan) and 0.117 (Ispra) for two ambient filter samples. F 14 C (EC) of ambient aerosol particle samples have been reported by previous studies [11,12,14,43] across Europe in a range from 0.1, mostly for filter samples from cities, to up to 0.8, measured during winter-time smog episodes related to wood burning in Switzerland [44]. Therefore the measurement of F 14 C (EC) with an accuracy of ±0.05 is satisfactory to be able to draw meaningful conclusions about the sources of EC.
The three laboratories that are compared in this study also took part in the earlier inter-comparison study. However, in the meantime their methods have been revised and more thoroughly evaluated. The present methods are relatively similar, using water extraction and an oxygen-based thermal separation of OC and EC. There are differences in the duration and the set temperature for the various steps and LARA and LABEC use an intermediate step in helium, but CIO does not. CIO shows higher values of F 14 C (EC) for all analyzed filter samples between 10% and 40% higher than the averaged results from LARA and LABEC. The cause for the differences seems to be systematic and it might be the missing thermal treatment in helium, but another likely reason for the higher F 14 C (EC) values is the already mentioned high overall EC recovery for CIO. EC recovery for CIO was between 0.89 (filter 3) and 1.09 (filter 10). LARA showed EC recoveries of 0.64 for filter 4 and 0.70 for the rest of the investigated samples. They calculated the EC recovery from the optical observation of the filter during treatment (for details see Section 2.4) and they applied a special correction step to extrapolate to full recovery. This correction to 100% EC recovery introduces considerable uncertainties and the final data of LARA and CIO agree within these uncertainties. There is no information about the EC recovery from LABEC, because they do not quantify the EC concentration with sufficient accuracy to estimate the recoveries.
If we assume that the higher F 14 C (EC) values of CIO compared to LABEC and LARA are caused by remaining or charred OC, we can calculate from Equation (2) how much OC is necessary to cause the observed difference. This calculation shows that a contribution of remaining or charred OC to the extracted EC of 8% for filter 2, 13% for filter 3, 17% for filter 4 and 10% for filter 10 would be required to cause the elevated values for CIO. Results from CIO were corrected with the assumption that 2.5 ± 2.5 % of the actual measured EC mass is OC. The EC concentrations determined at CIO show an uncertainty of around 14%. Therefore such a contribution of OC cannot be directly observed in the measured recovery values.
It should be also kept in mind that the determination of F 14 C (EC) data is subject to considerable systematic uncertainties mainly due to the assumptions involved in various corrections. The presented data from LARA show the highest uncertainty, because these explicitly take into account most of these uncertainties related to these assumptions. Their correction for background and cross contamination represent a small contribution to the observed uncertainty compared to the EC yield and OC charring correction with the main contribution coming from the EC yield correction. As a consequence the error estimate of LARA is probably the most realistic accuracy estimate.
The present inter-comparison shows good agreement between the results for these three methods (within estimated uncertainties from LARA) and this is a crucial step in the direction of more reliable comparison between different published F 14 C (EC) data. The next essential step would be to expand this type of inter-comparison and to include also F 14 C (EC) data resulting from separation approaches based on different principles. Another commonly used approach to derive the fraction modern of EC from aerosol particle filter samples is the CTO-375 method [45,46] and modifications of this method [5,15,16,47,48]. This method is associated with much lower EC recoveries of about 10% [5] with respect to EC concentrations measured by thermo-optical analysis. Other separation methods use a commercial OC-EC analyzer and apply one of the common protocols like NIOSH [7,49], IMPROVE [50] or EUSAAR_2 [51] and collect the carbon released during (parts of) the oxygen steps for further radiocarbon analysis. The fraction modern of EC is then directly or indirectly determined from these results. This approach might result in a higher fraction modern of EC, because more pyrolyzed OC is formed in a helium atmosphere without water extraction of the samples than in an oxygen atmosphere after water extraction and the separation of pyrolyzed carbon from EC is not straightforward. On the other hand these methods have the advantage of a higher and probably more consistent EC recovery and it will be interesting to include these methods in future inter-comparisons. At present 14C inter-comparisons are mainly restricted to ambient filter samples, where the “true” F 14 C of OC and EC is not known. Therefore if methods give similar results it is still not clear if they are accurate and if methods give different results, it is impossible to decide, which method (if any) gives the right value. It will therefore be very important in the future to define and produce suitable (EC) reference materials for 14C analysis on aerosols.

4. Conclusions

EC concentrations determined with the EUSAAR_2 thermal-optical protocol were dependent on the sampling duration for untreated filter samples, but not for water-extracted samples. The EC concentration was 20% to 45% lower on the long-term filters compared to the sum of the 24-h filters for untreated filter samples, whereas no significant difference was found for water-extracted samples. Moreover, on highly loaded filters (TC higher than approximately 50 µg/cm2), EC concentrations were lower for untreated filter samples than for water-extracted samples with larger differences between EC for higher TC concentration. The underestimate of EC on untreated samples is likely related to an inaccurate charring correction on highly loaded filter samples. In conclusion, the most consistent results were found when using the EUSAAR_2 protocol on water-extracted filter samples. This makes water extraction of the filter samples recommendable as a regular pretreatment step to determine consistent EC concentrations for highly loaded filters, even though a small loss of EC may occur.
When the 2stepCIO protocol was set up on the Sunset OC-EC analyzer, recovered EC concentrations were lower than on the ACS itself. The disagreement between the results shows that instrument-specific parameters play a role in EC recovery and further development is needed to create a protocol on the Sunset analyzer, which matches the EC recovery of the ACS.
The results for the fraction modern in EC measured at CIO seem to suggest a connection between higher F 14 C (EC) and a longer sampling time period of the filter, but this might alternatively (and actually more likely) be due to actual variation in the fossil fraction of the atmospheric EC, related to lower temperatures towards the end of the sampling period.
The inter-comparison of F 14 C (EC) of four filter samples between three independent laboratories showed good agreement with a standard deviation between 0.01 and 0.04, which is acceptable when aiming at aerosol source studies. Results from CIO were found to be higher than values from the other laboratories, but still within the combined uncertainty estimate from LARA, which is likely to be the most realistic. This can be an indication that the relatively high EC recovery found for CIO (0.89–1.09 at CIO in comparison to about 0.70 for LARA) might be indicative of some remaining OC in the EC fraction, which increases the F 14 C (EC). A direct dependency between EC recovery and F 14 C (EC) was not found, but a theoretical estimate showed that already a small amount of remaining OC in the range of the uncertainty of the measured EC concentrations can have the observed influence on the measured F 14 C (EC).
In conclusion, the inter-comparison of F 14 C (EC) analyzed with these three similar OC-EC separation methods showed satisfactory results. More comprehensive inter-comparison studies are needed, where also different approaches to measure the fraction modern in EC are included.

Acknowledgments

The authors like to thank Romke Tjoelker for his help during the sampling campaign, Henk Been and Marc Bleeker for their help with the AMS measurements at CIO and Anita Aerts-Bijma and Dicky van Zonneveld for their help with 14C data correction at CIO.

Author Contributions

Matthias Vonwiller and Sönke Szidat performed the experimental and data analysis at LARA and wrote the method description “Radiocarbon Analysis of EC at LARA” and provided valuable comments for the manuscript. Giulia Calzolai, Martina Giannoni and Vera Bernardoni performed the experiments and data analysis at LABEC. Giulia Calzolai and Vera Bernardoni additionally contributed to the method description “Radiocarbon Analysis of EC at LABEC” and provided valuable comments for the manuscript. Aleksandra D. Jedynska as the main organizer of the sampling campaign at the CESAR observatory and Bas Henzing provided the 24-h filter samples from TNO and gave valuable comments for the manuscript. Ulrike Dusek conceived the idea and supervised the project and revised the first version of the manuscript. Harro A. J. Meijer supervised the AMS measurement at CIO and provided valuable comments for the manuscript. Katrin Zenker performed the experimental and data analysis at CIO and wrote the main part of the manuscript and coordinated the collaboration for the inter-comparison study.

Conflicts of Interest

The authors declare no conflict of interest.

Appendix A

Additionally to Figure A1, which shows absolute concentrations of TC, OC and EC, in Figure A2 these concentrations are shown relative to the TC concentration of the respective untreated filter sample determined with the EUSAAR_2 protocol. This information about the relative yields provides a better understanding of the behavior of the different investigated thermal protocols regarding the dependence on a range of different TC concentrations.
The different bars represent relative carbon concentrations determined with the EUSAAR_2 protocol, the 2stepCIO protocol implemented on the Sunset analyzer and the 2stepCIO protocol on the ACS extraction system (purple). The EUSAAR_2 protocol has been applied to the untreated filter samples (EUSAAR_2 in red) and to the water-extracted filter samples (EUSAAR_2 WE in blue). The 2stepCIO protocol on the Sunset instrument has been applied with an intermediate step (450 °C) of 2 min (yellow) and 3 min (green) for water-extracted filter samples. In the case of multiple analyses the averaged results are shown and error bars show the uncertainty range of the results.
Figure A2 shows very consistent and stable relative yields for the OC concentrations on the untreated filter samples for the EUSAAR_2 protocol over the range of the observed TC concentration. Results for OC from the different protocols on water-extracted samples show obviously a much lower relative yield, because most of the organic material on the filter is apparently water-soluble. Despite this the relative yield for OC on water-extracted samples also shows consistent values, which underlines that the investigated protocols can give reproducible results over the observed range of TC concentrations. Relative yield for the 2stepCIO method agree within the uncertainty ranges with results from the EUSAAR_2 on water-extracted samples, which indicate that no significant amount of OC is lost during the intermediate step of the 2stepCIO method and most of the removed part of carbon is actually EC. Results for the relative concentrations of EC do not show very consistent values, which is in line with the observations from Figure 1 and Figure A1 and the probable reasons for this are discussed in the main text (Section 3.1).
Figure A1. TC, OC and EC concentrations determined with the EUSAAR_2 protocol on untreated (EUSAAR_2) and water-extracted (EUSAAR_2 WE) filter samples and determined with the 2stepCIO protocol on the Sunset analyzer with an intermediate step (450 °C) of 2 min (2stepCIO (Sunset) 2 min) and 3 min (2stepCIO (Sunset) 3 min) and the 2stepCIO protocol on the ACS (2stepCIO (ACS) 2 min) for all investigated filter.
Atmosphere 08 00226 g0a1
Figure A2. OC and EC concentrations relative to the TC concentration determined with the EUSAAR_2 protocol on untreated filter samples—determined with the EUSAAR_2 protocol on untreated (EUSAAR_2) and water-extracted (EUSAAR_2 WE) filter samples and determined with the 2stepCIO protocol on the Sunset analyzer with an intermediate step (450 °C) of 2 min (2stepCIO (Sunset) 2 min) and 3 min (2stepCIO (Sunset) 3 min) and the 2stepCIO protocol on the ACS (2stepCIO (ACS) 2 min) for all investigated filter.
Atmosphere 08 00226 g0a2
Figure A3. F 14 C of secondary standards IAEA-C7 and IAEA-C8 measured at CIO with applied AMS corrections (normalization, correction for isotopic fractionation and background contamination correction) in dependence of sample carbon mass.
Atmosphere 08 00226 g0a3

References

  1. Pöschl, U. Atmospheric Aerosols: Composition, transformation, climate and health effects. Angew. Chem. Int. Ed. 2005, 44, 7520–7540. [Google Scholar] [CrossRef] [PubMed]
  2. Petzold, A.; Ogren, J.A.; Fiebig, M.; Laj, P.; Li, S.M.; Baltensperger, U.; Holzer-Popp, T.; Kinne, S.; Pappalardo, G.; Sugimoto, N.; et al. Recommendations for reporting “black carbon” measurements. Atmos. Chem. Phys. 2013, 13, 8365–8379. [Google Scholar] [CrossRef] [Green Version]
  3. Boucher, O.; Randall, D.; Artaxo, P.; Bretherton, C.; Feingold, G.; Forster, P.; Kerminen, V.M.; Kondo, Y.; Liao, H.; Lohmann, U.; et al. Clouds and aerosols. In Climate Change 2013: The Physical Science Basis. Contribution of Working Group I to the Fifth Assessment Report of the Intergovernmental Panel on Climate Change; Stocker, T., Qin, D., Plattner, G.K., Tignor, M., Allen, S., Boschung, J., Nauels, A., Xia, Y., Bex, V., Midgley, P., Eds.; Book Section 7; Cambridge University Press: Cambridge, UK; New York, NY, USA, 2013; pp. 571–658. [Google Scholar]
  4. Myhre, G.; Shindell, D.; Bréon, F.M.; Collins, W.; Fuglestvedt, J.; Huang, J.; Koch, D.; Lamarque, J.F.; Lee, D.; Mendoza, B.; et al. Anthropogenic and natural radiative forcing. In Climate Change 2013: The Physical Science Basis. Contribution of Working Group I to the Fifth Assessment Report of the Intergovernmental Panel on Climate Change; Stocker, T., Qin, D., Plattner, G.K., Tignor, M., Allen, S., Boschung, J., Nauels, A., Xia, Y., Bex, V., Midgley, P., Eds.; Book Section 8; Cambridge University Press: Cambridge, UK; New York, NY, USA, 2013; pp. 659–740. [Google Scholar]
  5. Andersson, A.; Sheesley, R.J.; Kruså, M.; Johansson, C.; Gustafsson, Ö. 14C-Based source assessment of soot aerosols in Stockholm and the Swedish EMEP-Aspvreten regional background site. Atmos. Environ. 2011, 45, 215–222. [Google Scholar] [CrossRef]
  6. Bernardoni, V.; Calzolai, G.; Chiari, M.; Fedi, M.; Lucarelli, F.; Nava, S.; Piazzalunga, A.; Riccobono, F.; Taccetti, F.; Valli, G.; et al. Radiocarbon analysis on organic and elemental carbon in aerosol samples and source apportionment at an urban site in Northern Italy. J. Aerosol Sci. 2013, 56, 88–99. [Google Scholar] [CrossRef]
  7. Chen, B.; Andersson, A.; Lee, M.; Kirillova, E.N.; Xiao, Q.; Kruså, M.; Shi, M.; Hu, K.; Lu, Z.; Streets, D.G.; et al. Source forensics of black carbon aerosols from China. Environ. Sci. Technol. 2013, 47, 9102–9108. [Google Scholar] [CrossRef] [PubMed]
  8. Dusek, U.; ten Brink, H.M.; Meijer, H.A.J.; Kos, G.; Mrozek, D.; Röckmann, T.; Holzinger, R.; Weijers, E.P. The contribution of fossil sources to the organic aerosol in The Netherlands. Atmos. Environ. 2013, 74, 169–176. [Google Scholar] [CrossRef]
  9. Dusek, U.; Hitzenberger, R.; Kasper-Giebl, A.; Kistler, M.; Meijer, H.A.J.; Szidat, S.; Wacker, L.; Holzinger, R.; Röckmann, T. Sources and formation mechanisms of carbonaceous aerosol at a regional background site in the Netherlands: Insights from a year-long radiocarbon study. Atmos. Chem. Phys. 2017, 17, 3233–3251. [Google Scholar] [CrossRef]
  10. Fushimi, A.; Wagai, R.; Uchida, M.; Hasegawa, S.; Takahashi, K.; Kondo, M.; Hirabayashi, M.; Morino, Y.; Shibata, Y.; Ohara, T.; et al. Radiocarbon (14C) diurnal variations in fine particles at Sites Downwind from Tokyo, Japan in Summer. Environ. Sci. Technol. 2011, 45, 6784–6792. [Google Scholar] [CrossRef] [PubMed]
  11. Heal, M.R.; Naysmith, P.; Cook, G.T.; Xu, S.; Duran, T.R.; Harrison, R.M. Application of 14C analyses to source apportionment of carbonaceous PM2.5 in the UK. Atmos. Environ. 2011, 45, 2341–2348. [Google Scholar] [CrossRef]
  12. Minguillón, M.C.; Perron, N.; Querol, X.; Szidat, S.; Fahrni, S.M.; Alastuey, A.; Jimenez, J.L.; Mohr, C.; Ortega, A.M.; Day, D.A.; et al. Fossil versus contemporary sources of fine elemental and organic carbonaceous particulate matter during the DAURE campaign in Northeast Spain. Atmos. Chem. Phys. 2011, 11, 12067–12084. [Google Scholar] [CrossRef] [Green Version]
  13. Morino, Y.; Takahashi, K.; Fushimi, A.; Tanabe, K.; Ohara, T.; Hasegawa, S.; Uchida, M.; Takami, A.; Yokouchi, Y.; Kobayashi, S. Contrasting diurnal variations in fossil and nonfossil secondary organic aerosol in Urban Outflow, Japan. Environ. Sci. Technol. 2010, 44, 8581–8586. [Google Scholar] [CrossRef] [PubMed]
  14. Szidat, S.; Jenk, T.M.; Synal, H.A.; Kalberer, M.; Wacker, L.; Hajdas, I.; Kasper-Giebl, A.; Baltensperger, U. Contributions of fossil fuel, biomass-burning, and biogenic emissions to carbonaceous aerosols in Zurich as traced by 14C. J. Geophys. Res. Atmos. 2006, 111, D07206. [Google Scholar] [CrossRef]
  15. Uchida, M.; Kumata, H.; Koike, Y.; Tsuzuki, M.; Uchida, T.; Fujiwara, K.; Shibata, Y. Radiocarbon-based source apportionment of black carbon (BC) in PM10 aerosols from residential area of suburban Tokyo. Nucl. Instrum. Methods Phys. Res. Sect. B Beam Interact. Mater. Atoms 2010, 268, 1120–1124. [Google Scholar] [CrossRef]
  16. Zencak, Z.; Elmquist, M.; Gustafsson, Ö. Quantification and radiocarbon source apportionment of black carbon in atmospheric aerosols using the CTO-375 method. Atmos. Environ. 2007, 41, 7895–7906. [Google Scholar] [CrossRef]
  17. Cavalli, F.; Viana, M.; Yttri, K.E.; Genberg, J.; Putaud, J.P. Toward a standardised thermal-optical protocol for measuring atmospheric organic and elemental carbon: the EUSAAR protocol. Atmos. Meas. Tech. 2010, 3, 79–89. [Google Scholar] [CrossRef] [Green Version]
  18. Chow, J.C.; Watson, J.G.; Chen, L.W.A.; Chang, M.C.O.; Robinson, N.F.; Trimble, D.; Kohl, S. The IMPROVE-A temperature protocol for thermal/optical carbon analysis: Maintaining consistency with a long-term database. J. Air Waste Manag. Assoc. 2007, 57, 1014–1023. [Google Scholar] [CrossRef] [PubMed]
  19. Chow, J.C.; Watson, J.G.; Crow, D.; Lowenthal, D.H.; Merrifield, T. Comparison of IMPROVE and NIOSH Carbon Measurements. Aerosol Sci. Technol. 2001, 34, 23–34. [Google Scholar] [CrossRef]
  20. Chiappini, L.; Verlhac, S.; Aujay, R.; Maenhaut, W.; Putaud, J.P.; Sciare, J.; Jaffrezo, J.L.; Liousse, C.; Galy-Lacaux, C.; Alleman, L.Y.; et al. Clues for a standardised thermal-optical protocol for the assessment of organic and elemental carbon within ambient air particulate matter. Atmos. Meas. Tech. 2014, 7, 1649–1661. [Google Scholar] [CrossRef] [Green Version]
  21. Panteliadis, P.; Hafkenscheid, T.; Cary, B.; Diapouli, E.; Fischer, A.; Favez, O.; Quincey, P.; Viana, M.; Hitzenberger, R.; Vecchi, R.; et al. ECOC comparison exercise with identical thermal protocols after temperature offset correction—Instrument diagnostics by in-depth evaluation of operational parameters. Atmos. Meas. Tech. 2015, 8, 779–792. [Google Scholar] [CrossRef] [Green Version]
  22. Cachier, H.; Bremond, M.P.; Buat-Ménard, P. Determination of atmospheric soot carbon with a simple thermal method. Tellus B 1989, 41B, 379–390. [Google Scholar] [CrossRef]
  23. Dusek, U.; Monaco, M.; Prokopiou, M.; Gongriep, F.; Hitzenberger, R.; Meijer, H.A.J.; Röckmann, T. Evaluation of a two-step thermal method for separating organic and elemental carbon for radiocarbon analysis. Atmos. Meas. Tech. 2014, 7, 1943–1955. [Google Scholar] [CrossRef] [Green Version]
  24. Zhang, Y.L.; Perron, N.; Ciobanu, V.G.; Zotter, P.; Minguillón, M.C.; Wacker, L.; Prévôt, A.S.H.; Baltensperger, U.; Szidat, S. On the isolation of OC and EC and the optimal strategy of radiocarbon-based source apportionment of carbonaceous aerosols. Atmos. Chem. Phys. 2012, 12, 10841–10856. [Google Scholar] [CrossRef] [Green Version]
  25. Elmquist, M.; Cornelissen, G.; Kukulska, Z.; Gustafsson, Ö. Distinct oxidative stabilities of char versus soot black carbon: Implications for quantification and environmental recalcitrance. Glob. Biogeochem. Cycles 2006, 20, GB2009. [Google Scholar] [CrossRef]
  26. Yu, J.Z.; Xu, J.; Yang, H. Charring characteristics of atmospheric organic particulate matter in thermal analysis. Environ. Sci. Technol. 2002, 36, 754–761. [Google Scholar] [CrossRef] [PubMed]
  27. Szidat, S.; Bench, G.; Bernardoni, V.; Calzolai, G.; Czimczik, C.I.; Derendorp, L.; Dusek, U.; Elder, K.; Fedi, M.E.; Genberg, J.; et al. Intercomparison of 14C analysis of carbonaceous aerosols: Exercise 2009. Radiocarbon 2013, 55, 1496–1509. [Google Scholar] [CrossRef]
  28. Chow, J.C.; Watson, J.G. PM2.5 carbonate concentrations at regionally representative Interagency Monitoring of Protected Visual Environment sites. J. Geophys. Res. Atmos. 2002, 107, 8344. [Google Scholar] [CrossRef]
  29. de Rooij, M.; van der Plicht, J.; Meijer, H.A.J. Porous iron pellets for AMS 14C analysis of small samples down to ultra-microscale size (10–25 µgC). Nucl. Instrum. Methods Phys. Res. Sect. B Beam Interact. Mater. Atoms 2010, 268, 947–951. [Google Scholar] [CrossRef]
  30. van der Plicht, J.; Wijma, S.; Aerts, A.T.; Pertuisot, M.H.; Meijer, H.A.J. Status report: The Groningen AMS facility. Nucl. Instrum. Methods Phys. Res. Sect. B Beam Interact. Mater. Atoms 2000, 172, 58–65. [Google Scholar] [CrossRef]
  31. Reimer, P.J.; Brown, T.A.; Reimer, R.W. Discussion: Reporting and Calibration of post-bomb 14C Data. Radiocarbon 2004, 46, 1299–1304. [Google Scholar] [CrossRef]
  32. Santos, G.M.; Southon, J.R.; Griffin, S.; Beaupre, S.R.; Druffel, E.R.M. Ultra small-mass AMS 14C sample preparation and analyses at KCCAMS/UCI Facility. Nucl. Instrum. Methods Phys. Res. Sect. B Beam Interact. Mater. Atoms 2007, 259, 293–302. [Google Scholar] [CrossRef]
  33. Ruff, M.; Wacker, L.; Gäggeler, H.W.; Suter, M.; Synal, H.A.; Szidat, S. A gas ion source for radiocarbon measurements at 200 kV. Radiocarbon 2007, 49, 307–314. [Google Scholar] [CrossRef]
  34. Salazar, G.; Zhang, Y.L.; Agrios, K.; Szidat, S. Development of a method for fast and automatic radiocarbon measurement of aerosol samples by online coupling of an elemental analyzer with a MICADAS AMS. Nucl. Instrum. Methods Phys. Res. Sect. B Beam Interact. Mater. Atoms 2015, 361, 163–167. [Google Scholar] [CrossRef]
  35. Synal, H.A.; Stocker, M.; Suter, M. MICADAS: A new compact radiocarbon AMS system. Nucl. Instrum. Methods Phys. Res. Sect. B Beam Interact. Mater. Atoms 2007, 259, 7–13. [Google Scholar] [CrossRef]
  36. Zotter, P.; El Haddad, I.; Zhang, Y.; Hayes, P.L.; Zhang, X.; Lin, Y.H.; Wacker, L.; Schnelle-Kreis, J.; Abbaszade, G.; Zimmermann, R.; et al. Diurnal cycle of fossil and nonfossil carbon using radiocarbon analyses during CalNex. J. Geophys. Res. Atmos. 2014, 119, 6818–6835. [Google Scholar] [CrossRef] [Green Version]
  37. Calzolai, G.; Bernardoni, V.; Chiari, M.; Fedi, M.; Lucarelli, F.; Nava, S.; Riccobono, F.; Taccetti, F.; Valli, G.; Vecchi, R. The new sample preparation line for radiocarbon measurements on atmospheric aerosol at LABEC. Nucl. Instrum. Methods Phys. Res. Sect. B Beam Interact. Mater. Atoms 2011, 269, 203–208. [Google Scholar] [CrossRef]
  38. Piazzalunga, A.; Bernardoni, V.; Fermo, P.; Valli, G.; Vecchi, R. Technical Note: On the effect of water-soluble compounds removal on EC quantification by TOT analysis in urban aerosol samples. Atmos. Chem. Phys. 2011, 11, 10193–10203. [Google Scholar] [CrossRef]
  39. Subramanian, R.; Khlystov, A.Y.; Robinson, A.L. Effect of peak inert-mode temperature on elemental carbon measured using thermal-optical analysis. Aerosol Sci. Technol. 2006, 40, 763–780. [Google Scholar] [CrossRef]
  40. Weingartner, E.; Saathoff, H.; Schnaiter, M.; Streit, N.; Bitnar, B.; Baltensperger, U. Absorption of light by soot particles: Determination of the absorption coefficient by means of aethalometers. J. Aerosol Sci. 2003, 34, 1445–1463. [Google Scholar] [CrossRef]
  41. Birch, M.E.; Cary, R.A. Elemental carbon-based method for monitoring occupational exposures to particulate diesel exhaust. Aerosol Sci. Technol. 1996, 25, 221–241. [Google Scholar] [CrossRef]
  42. Cheng, Y.; He, K.B. Measurement of carbonaceous aerosol with different sampling configurations and frequencies. Atmos. Meas. Tech. 2015, 8, 2639–2648. [Google Scholar] [CrossRef]
  43. Szidat, S.; Ruff, M.; Perron, N.; Wacker, L.; Synal, H.A.; Hallquist, M.; Shannigrahi, A.S.; Yttri, K.E.; Dye, C.; Simpson, D. Fossil and non-fossil sources of organic carbon (OC) and elemental carbon (EC) in Göteborg, Sweden. Atmos. Chem. Phys. 2009, 9, 1521–1535. [Google Scholar] [CrossRef] [Green Version]
  44. Zotter, P.; Ciobanu, V.G.; Zhang, Y.L.; El-Haddad, I.; Macchia, M.; Daellenbach, K.R.; Salazar, G.A.; Huang, R.J.; Wacker, L.; Hueglin, C.; et al. Radiocarbon analysis of elemental and organic carbon in Switzerland during winter-smog episodes from 2008 to 2012—Part 1: Source apportionment and spatial variability. Atmos. Chem. Phys. 2014, 14, 13551–13570. [Google Scholar] [CrossRef]
  45. Gustafsson, Ö.; Gschwend, P.M. Soot as a strong partition medium for polycyclic aromatic hydrocarbons in aquatic systems. In Molecular Markers in Environmental Geochemistry; ACS Publication: Washington, DC, USA, 1997; pp. 365–381. [Google Scholar] [CrossRef]
  46. Gustafsson, O.; Bucheli, T.D.; Kukulska, Z.; Andersson, M.; Largeau, C.; Rouzaud, J.N.; Reddy, C.M.; Eglinton, T.I. Evaluation of a protocol for the quantification of black carbon in sediments. Glob. Biogeochem. Cycles 2001, 15, 881–890. [Google Scholar] [CrossRef]
  47. Reddy, C.M.; Pearson, A.; Xu, L.; McNichol, A.P.; Benner, B.A.; Wise, S.A.; Klouda, G.A.; Currie, L.A.; Eglinton, T.I. Radiocarbon as a tool to apportion the sources of polycyclic aromatic hydrocarbons and black carbon in environmental samples. Environ. Sci. Technol. 2002, 36, 1774–1782. [Google Scholar] [CrossRef] [PubMed]
  48. Sun, X.; Hu, M.; Guo, S.; Liu, K.; Zhou, L. 14C-Based source assessment of carbonaceous aerosols at a rural site. Atmos. Environ. 2012, 50, 36–40. [Google Scholar] [CrossRef]
  49. Winiger, P.; Andersson, A.; Yttri, K.E.; Tunved, P.; Gustafsson, Ö. Isotope-based source apportionment of EC aerosol particles during winter high-pollution events at the Zeppelin Observatory, Svalbard. Environ. Sci. Technol. 2015, 49, 11959–11966. [Google Scholar] [CrossRef] [PubMed]
  50. Minoura, H.; Morikawa, T.; Mizohata, A.; Sakamoto, K. Carbonaceous aerosol and its characteristics observed in Tokyo and south Kanto region. Atmos. Environ. 2012, 61, 605–613. [Google Scholar] [CrossRef]
  51. Liu, J.; Li, J.; Ding, P.; Zhang, Y.; Liu, D.; Shen, C.; Zhang, G. Optimizing isolation protocol of organic carbon and elemental carbon for 14C analysis using fine particulate samples. Atmos. Environ. 2017, 154, 9–19. [Google Scholar] [CrossRef]
Figure 1. TC, OC and EC concentrations determined with the EUSAAR_2 protocol on untreated (EUSAAR_2) and water-extracted (EUSAAR_2 WE) filter samples and determined with the 2stepCIO protocol on the Sunset analyzer with an intermediate step (450 °C) of 2 min (2stepCIO (Sunset) 2 min) and 3 min (2stepCIO (Sunset) 3 min) and the 2stepCIO protocol on the aerosol combustion system (ACS) (2stepCIO (ACS) 2 min) for a five-day filter (8) and a two-day filter (9).
Atmosphere 08 00226 g001
Figure 2. Ratio of the EC concentration on water-extracted (EC WE) and untreated (EC) filter samples versus the TC concentration on the untreated filter samples, red circles show results from this study determined with the EUSAAR_2 protocol and black triangles show results from Dusek et al. [9] determined with the QUARTZ protocol.
Atmosphere 08 00226 g002
Figure 3. Ratio of the EC concentration on long-term filter samples to the sum of the EC concentration on the corresponding 24-h filter samples in dependence of the sampling duration in days determined with the EUSAAR_2 protocol on untreated (EUSAAR_2) and water-extracted (EUSAAR_2 WE) filter and for the 2stepCIO protocol on the Sunset (2stepCIO (Sunset) 3 min).
Atmosphere 08 00226 g003
Figure 4. EC recovery defined as ratio of the EC concentration determined with the respective protocol to the EC concentration determined with the EUSAAR_2 protocol on water-extracted filter samples, red bars show the average value with the standard deviation and individual data points are shown as black crosses.
Atmosphere 08 00226 g004
Figure 5. Fraction modern of EC measured at CIO with different applied correction steps: AMS correction-normalization, correction for isotopic fractionation and background contamination correction (F14C AMS corr CIO); AMS correction + sampling blank correction (F14C blank corr CIO); AMS correction + sampling blank correction + OC charring correction (F14C final CIO); and fraction modern of EC measured at LARA and LABEC before (raw) and after (final) application of the corrections listed in Table 2.
Atmosphere 08 00226 g005
Figure 6. (a) F 14 C of EC (AMS correction) measured at CIO plotted versus the EC recovery and (b) versus the water-insoluble OC (WIOC) concentration determined with the Sunset OC-EC analyzer (EUSAAR_2 protocol, water-extracted filter).
Atmosphere 08 00226 g006
Figure 7. F 14 C (EC) analyzed multiple times for four different filter samples with a 2 min intermediate step (F14C AMS corr). Two filters are additionally analyzed with an intermediate temperature step of 3 min (F14C AMS corr 3 min). No sampling blank and OC charring correction is applied.
Atmosphere 08 00226 g007
Table 1. Filter samples taken and analyzed by CIO; marked with an o are samples used for a comparison of carbon concentrations with 24-h filter samples from TNO and marked with an x are samples analyzed additionally by two other laboratories (LARA and LABEC) for an inter-comparison of F 14 C of EC.
SampleSamplingSamplingSamplingMain Air
IdentityStartEndDuration (days)Mass
12 September 20144 September 20142mixed
24 September 20147 September 20143continentalx
37 September 201412 September 20145regionalx
412 September 201416 September 20144mixedx
516 September 201418 September 20142continentalo
618 September 201421 September 20143continentalo
721 September 201425 September 20144regionalo
825 September 201430 September 20145mixedo
930 September 20142 October 20142mixed
102 October 20145 October 20143mixedx
115 October 20149 October 20144mixed
129 October 201414 October 20145.39mixed
Table 2. Main characteristics of sample treatment for radiocarbon analysis of elemental carbon from the laboratories, which took part in the inter-comparison study.
LaboratoryLARALABECCIO
Pretreatmentwater extractionwater extractionwater extraction
Type Ovencommercial
OC-EC analyzer
self-builtself-built
Thermal ProtocolStep 1180 °C, 50 s+
375 °C, 150 s, O2
375 °C, 40 min, O2375 °C, 10 min, O2
Step 2475 °C, 120 s, O2750 °C, flash heating, He450 °C, 2 min/3 min, O2
Step 3450 °C, 180 s+
650 °C, 180 s, He
800 °C, 20 min, O2650 °C, 5 min, O2
Step 4500 °C, 120 s+
760 °C, 150 s, O2
AMS Measurementsdirect CO2 injection
MICADAS
graphitization
on iron powder
3 MV Tandetron
accelerator (HVEE)
graphitization
on iron pellets
3 MV Tandetron
accelerator (HVEE)
14 C Corrections•background contamination•background contamination•background contamination
• cross contamination • blank correction
• EC yield correction • OC charring correction
• OC charring correction

