Article

Sources and Formation Processes of Short-Chain Saturated Diacids (C2–C4) in Inhalable Particles (PM10) from Huangshi City, Central China

1
Hubei Key Laboratory of Mine Environmental Pollution Control & Remediation, School of Environmental Science and Engineering, Hubei Polytechnic University, Huangshi 435003, China
2
Institute of Low Temperature Science, Hokkaido University, Sapporo 060-0819, Japan
3
Now at Chubu Institute for Advanced Studies, Chubu University, Kasugai 487-8501, Japan
4
Key Laboratory of Aerosol Chemistry and Physics (KLACP), Institute of Earth Environment, Chinese Academy of Sciences, Xi’an 710075, China
*
Author to whom correspondence should be addressed.
Atmosphere 2017, 8(11), 213; https://doi.org/10.3390/atmos8110213
Submission received: 14 August 2017 / Revised: 5 November 2017 / Accepted: 6 November 2017 / Published: 8 November 2017
(This article belongs to the Special Issue Formation and Transformation of Organic Aerosol)

Abstract

:
PM10 samples were collected from Huangshi (HS) city, Central China during April 2012 to March 2013, and were analyzed for short-chain saturated dicarboxylic acids (diacids) using a capillary gas chromatograph (GC). We found that oxalic acid (C2, 318 ± 104 ng·m−3) was the most abundant diacid species, followed by malonic acid (C3, 25.4 ± 9.11 ng·m−3) and succinic acid (C4, 2.09 ± 0.52 ng·m−3). The concentrations of C2 and C4 diacids were highest in winter, followed by summer and spring, and lowest in autumn. C3 diacid was decreased in the order of summer > winter > autumn > spring. Further, the seasonal variations of WSOC (water-soluble organic carbon)- and OC (organic carbon)-normalized diacid concentrations were similar to those of diacid concentrations, suggesting that both primary emission and secondary production are important sources for diacids in Huangshi (HS) aerosols. Strong correlations were found among C2 diacid and the three ions SO42−, NO3, and NH4+ in summer and winter, suggesting that the species could undergo a similar secondary oxidation processing. C2 had good correlation with K+ in summer and autumn, which indicates an enhanced contribution of combustion sources for C2 diacid. Moreover, according to the ratio of C2/K+, we can conclude that C2 diacid should be formed by a secondary reaction of biomass combustion in HS aerosols, especially in summer and autumn. The ratios of C2/C4 and C3/C4 were compared with those reported in other sites, and the results suggest that HS aerosols should be more photochemically aged than at other urban areas. Principal component analysis of diacids and selected water-soluble inorganic ions over four seasons suggests that HS aerosols are influenced not only from primary emission, but also from secondary reaction. According to the linear relation between C2 and C3 diacids, the results indicate that C2 diacid is formed from the oxidation of hydrocarbon compounds in spring, while it is from the oxidation of C3 and C4 diacids in summer, autumn, and winter.

1. Introduction

Due to their high water-solubility and hygroscopic property, the particles enriched with dicarboxylic acids (diacids) can act as cloud condensation nuclei (CCN) and perturb the earth’s radiative forcing, and then affect regional and global climate [1,2]. As a result, from laboratory experiments, oxalic acid (C2) was confirmed to have an important effect on CCN activity of mineral dust aerosols [3]. Also, the particles enriched with diacids may have an adverse effect on human health [4]. Diacids can be emitted from various primary sources, such as vehicular exhausts [5], fossil fuel combustion [6], biomass burning [7], cooking activities [8], and natural marine sources [9]. They are also secondarily formed via atmospheric oxidation of inorganic and organic precursors in the presence of sunlight and oxidants [10,11]. For example, C2 diacid can be formed by photochemical oxidation of various hydrocarbons through intermediates such as pyruvic (Pyr), glyoxylic (ωC2), maleic (M), fumaric (F), malic (hC4), and ketomalonic (kC3) acids, as well as glyoxal (Gly) and methylglyoxal (MeGly) [12,13]. Moreover, diacids can be produced in the atmosphere by the oxidation of cyclic olefins [14]. More recently, biogenic volatile organic compounds such as isoprene and monoterpenes are considered the sources of diacids by photochemical processes [15,16].
Studies on diacids in atmospheric particles have been conducted in different urban regions of China, such as the Yangtze River Delta [17,18,19], the Beijing–Tianjin–Hebei region and Guanzhong Plain [20,21,22,23], and the Pearl River Delta [24,25,26]. However, no studies have been conducted on diacids in the small and medium-size inland cities, especially in Central China. Located in the southeast of Hubei province, Huangshi (HS, 30.12° N, 115.06° E) is a representative mining and industrial city known as the “Hometown of Chinese Bronze” and the “Cradle of the Nation’s Iron and Steel industry”. HS is also an important industrial base of raw materials in Central China. Using coal as its main energy, the rapid development of HS’s heavy industry has caused high energy consumption and severe environmental pollution. In recent years, with the expansion of industrial scale (with mean annual growth rate of 12%) and an increase of urban vehicles (with mean annual growth rate of 20%) (http://www.huangshi.gov.cn), atmospheric particulates have become the major pollutants that affect air quality and endanger human health [27,28,29]. HS is more than 4500 square km (1700 square miles) in area, and has a population of more than two million. It has a subtropical humid monsoon climate with abundant rainfall and sufficient sunshine. The annual mean sunshine time adds up to 2300 h. Moreover, it has four distinct seasons with high temperature and abundant precipitation in summer, and is moist and not very cold in winter. In this study, the molecular distributions and seasonal variations of short-chain saturated diacids (C2–C4) are reported, for the first time, in the HS aerosols. Organic carbon (OC), elemental carbon (EC) and water-soluble organic carbon (WSOC) were also measured in the PM10 samples. Moreover, we discuss possible sources of organic aerosols and the formation of secondary organic aerosol in HS city.

2. Samples and Analytical Procedure

2.1. Sample Collection

The collection of aerosol samples was performed on the rooftop of the School of Environmental Science and Engineering building (about 20 m above the ground level) at the Hubei Polytechnic University campus (30°12′35.34″ N, 115°01′30.17″ E). The site is surrounded by residential areas, and is about 1.5 km away from a major road with busy traffic. Each sample was collected for 24 h once every sixth day. PM10 samples (n = 61) were collected using an Airmetrics Tactical air sampler (with the flow rate of 300 L·h−1) and quartz fiber filters (with the diameter of 47 mm, British Whatman Company, Maidstone, UK). Before sampling, quartz filter was baked at 800 °C for 3 h in order to remove organic impurities. After sampling, sample was stored at −20 °C prior to chemical analysis.
The study period from April 2012 to March 2013 was classified into the four seasons, such as spring (April, May, June), summer (July, August, September), autumn (October, November, December) and winter (January, February, March). During the summer in the sampling period, the weather was sunny and hot (31.0–37.2 °C). In winter, the weather was moist (with the relative humidity of 87.1–94.0%) and not very cold (3.1–7.2 °C), which was compared with the winter of northern cities in China (with the temperature below 0 °C). Specifically, the monthly mean highest temperature (37.2 °C) appeared in July 2012 (summer), whereas the lowest (3.1 °C) appeared in February 2013 (winter). May 2012 (spring) was recognized as the driest month (relative humidity of 66.7%), and February 2013 (winter) was the most humid (relative humidity of 94.0%). The monthly highest wind speed was observed as 3.0 m/s in May, June, and July of 2012, and no sustained wind was observed during the sampling time of each sample (24 h) in January, February, and March of 2013.

2.2. Chemical Analysis

Filter samples were analyzed for water-soluble diacids by the improved method of Kawamura and Ikushima [10] and Kawamura [30]. A known area of filter (with the diameter of 8 mm) was extracted under ultrasonication with organic-free Milli-Q water (10 mL × 3). The water extract was adjusted to pH = 8.5–9.0 and concentrated to dryness by a rotary evaporator [31]. The dried sample was then reacted with 14% boron trifluoride (BF3) in n-butanol at 100 °C for 1 h. During this procedure, carboxyl functional groups were derived to butyl ester [30]. The derivatives were extracted with 10 mL of n-hexane after adding 10 mL of Milli-Q water and 0.2 mL of acetonitrile, which helps to transfer excess n-butanol more efficiently into aqueous phase. The n-hexane layer was further washed by Milli-Q water (10 mL × 2). The extract was concentrated by a rotary evaporator, dried under a gentle pure nitrogen stream, and dissolved in 50 μL of n-hexane. The butyl esters were determined by an Agilent 7890 gas chromatograph (GC) equipped with a split/splitless injector, a fused silica capillary column (HP-5, 25 m length × 0.20 mm inner diameter × 0.50 μm film thickness), and a flame ionization detector. The GC peaks were identified by the comparison of retention times with those of authentic standards. We also performed the recovery experiments by spiking authentic diacids onto precombusted quartz filters. The recoveries of spiked diacids were 85% for C2 and more than 90% for malonic (C3) and succinic (C4). The reproducibility analysis of samples indicated that analytical errors for C2–C4 were less than 10%. The concentrations of all species reported here were corrected for blanks, but not for recoveries.
OC and EC were measured using a Desert Research Institute (DRI) Model 2001 Carbon Analyzer (Atmoslytic Inc., Calabasas, CA, USA) following the Interagency Monitoring Protected Visual Environments (IMPROVE) thermal/optical evolution protocol. Analytical errors in duplicate analysis were within 9%. Detailed procedure was consistent with the reported in Zhan et al. [27]. WSOC was measured by a total organic carbon (TOC) analyzer (Shimadzu TOC-VCSH). Analytical errors in duplicate analysis were less than 12%. The detailed analytical procedure for WSOC was identical with those reported in Kunwar and Kawamura [31] and Hoque [32]. Water-soluble inorganic ions (WSIIs) were analyzed by an ion chromatograph (Dionex Inc. Sunnyvale, CA, USA). The allowable variation for ion concentrations should be in the range of 10–15%. Detailed analytical procedures can be found elsewhere [29].

3. Results and Discussion

3.1. Molecular Characteristics of Diacids

Table 1 lists the concentrations of diacids in HS aerosols, and Figure 1 presents the mean concentrations of diacids in HS aerosols together with those reported at other urban sites. Oxalic diacid (C2) was found as the most abundant species, followed by malonic (C3) and succinic (C4) in the four seasons, which were similar to those reported from Hongkong, China [24], Sapporo, Japan [33], and Chennai, India [34]. The mean concentration of C2 diacid (318 ± 104 ng·m−3) in HS was 2–3 times higher than those in Guangzhou, China (182 ng·m−3) [26], Sapporo (196 ng·m−3) [33] and Tokyo (186 ng·m−3) [35], Japan, and Ulaanbaatar, Mongolia (107 ng·m−3) [36]. The dominant presence of C2 diacid has been reported in many aerosol samples from urban areas [5,6,10], because C2 is not only the final photooxidation product of aromatic hydrocarbons, isoprene, ethylene and acetylene [12], but also directly emitted from fossil fuel combustion [5] and biomass burning [34]. The mean concentration of C3 diacid in HS aerosols (25.4 ± 9.11 ng·m−3) was lower than those in urban areas except for Guangzhou, China (13.3 ng·m−3) [26] and Ulaanbaatar, Mongolia (13.0 ng·m−3) [36] (Figure 1). The mean concentration of C4 diacid in HS (2.09 ± 0.52 ng·m−3) was lower than all those in other urban aerosols (Figure 1). It has been proposed that C4 diacid can be degraded to C3 and C2 diacids due to the abstraction of its hydrogen by OH radicals and subsequent decarboxylation reactions [10,31]. Therefore, such low concentrations of C4 diacid suggest that HS aerosols should be more photochemically aged than at other urban sites.

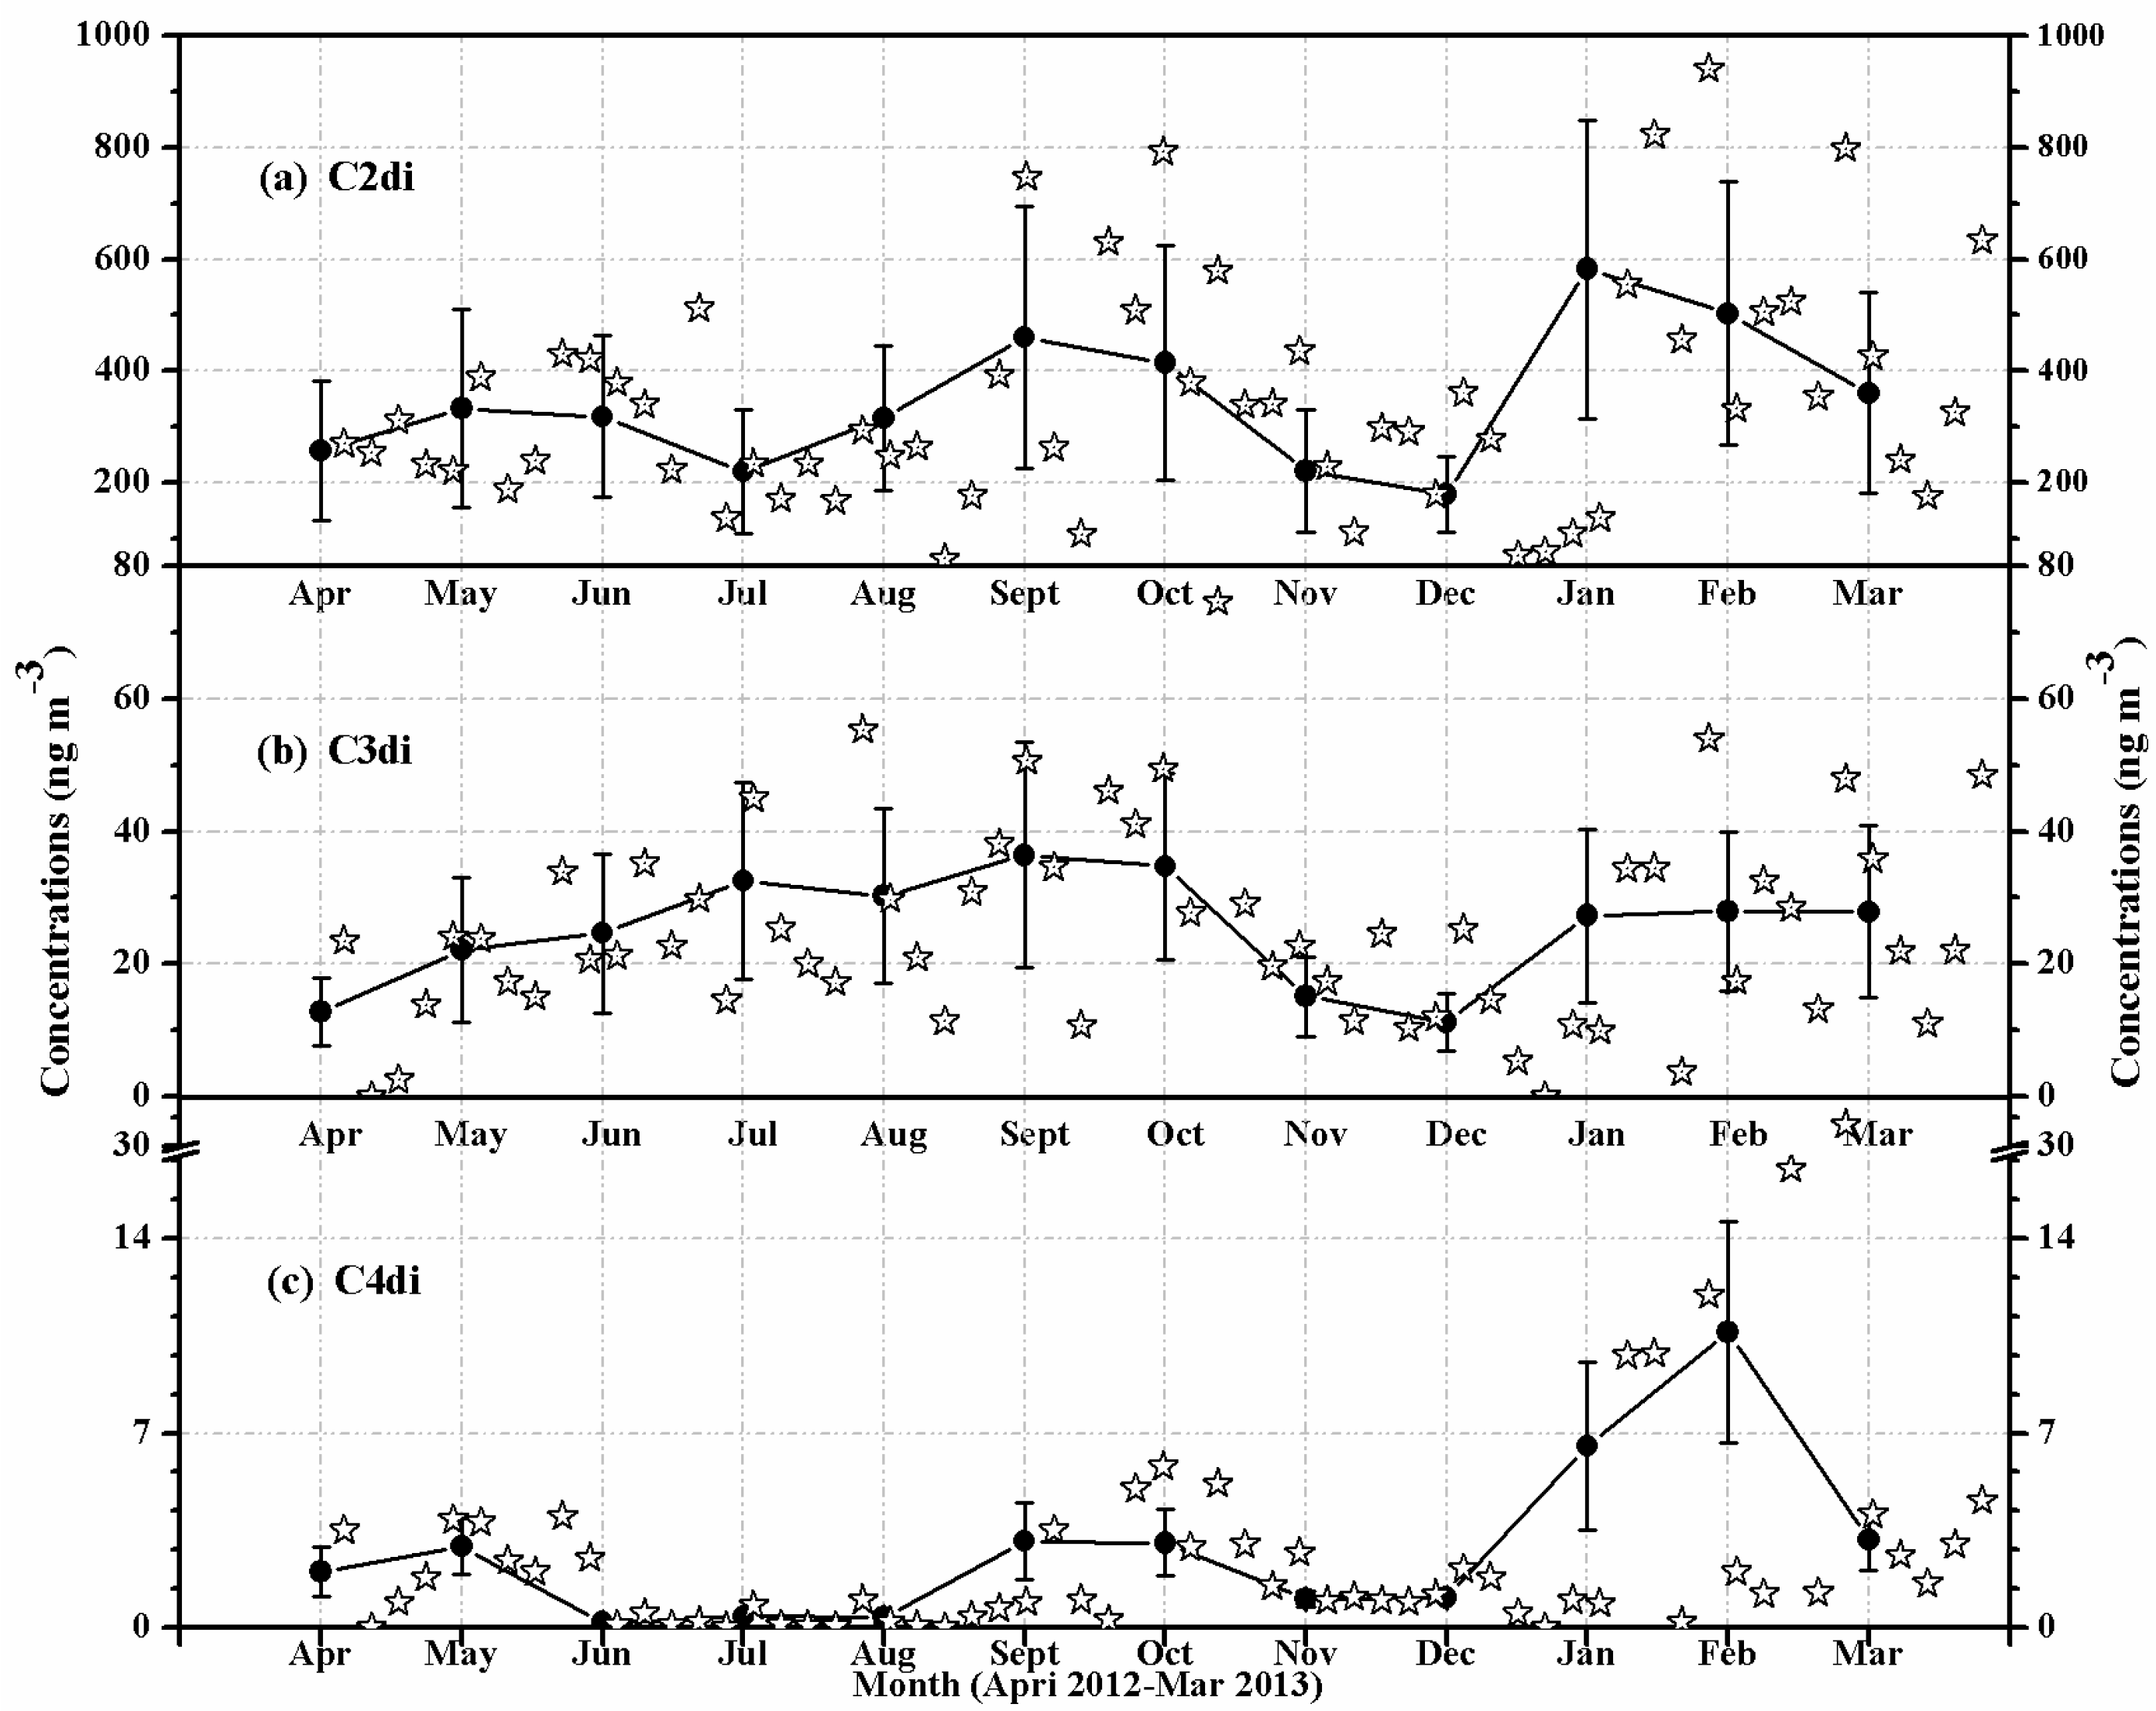
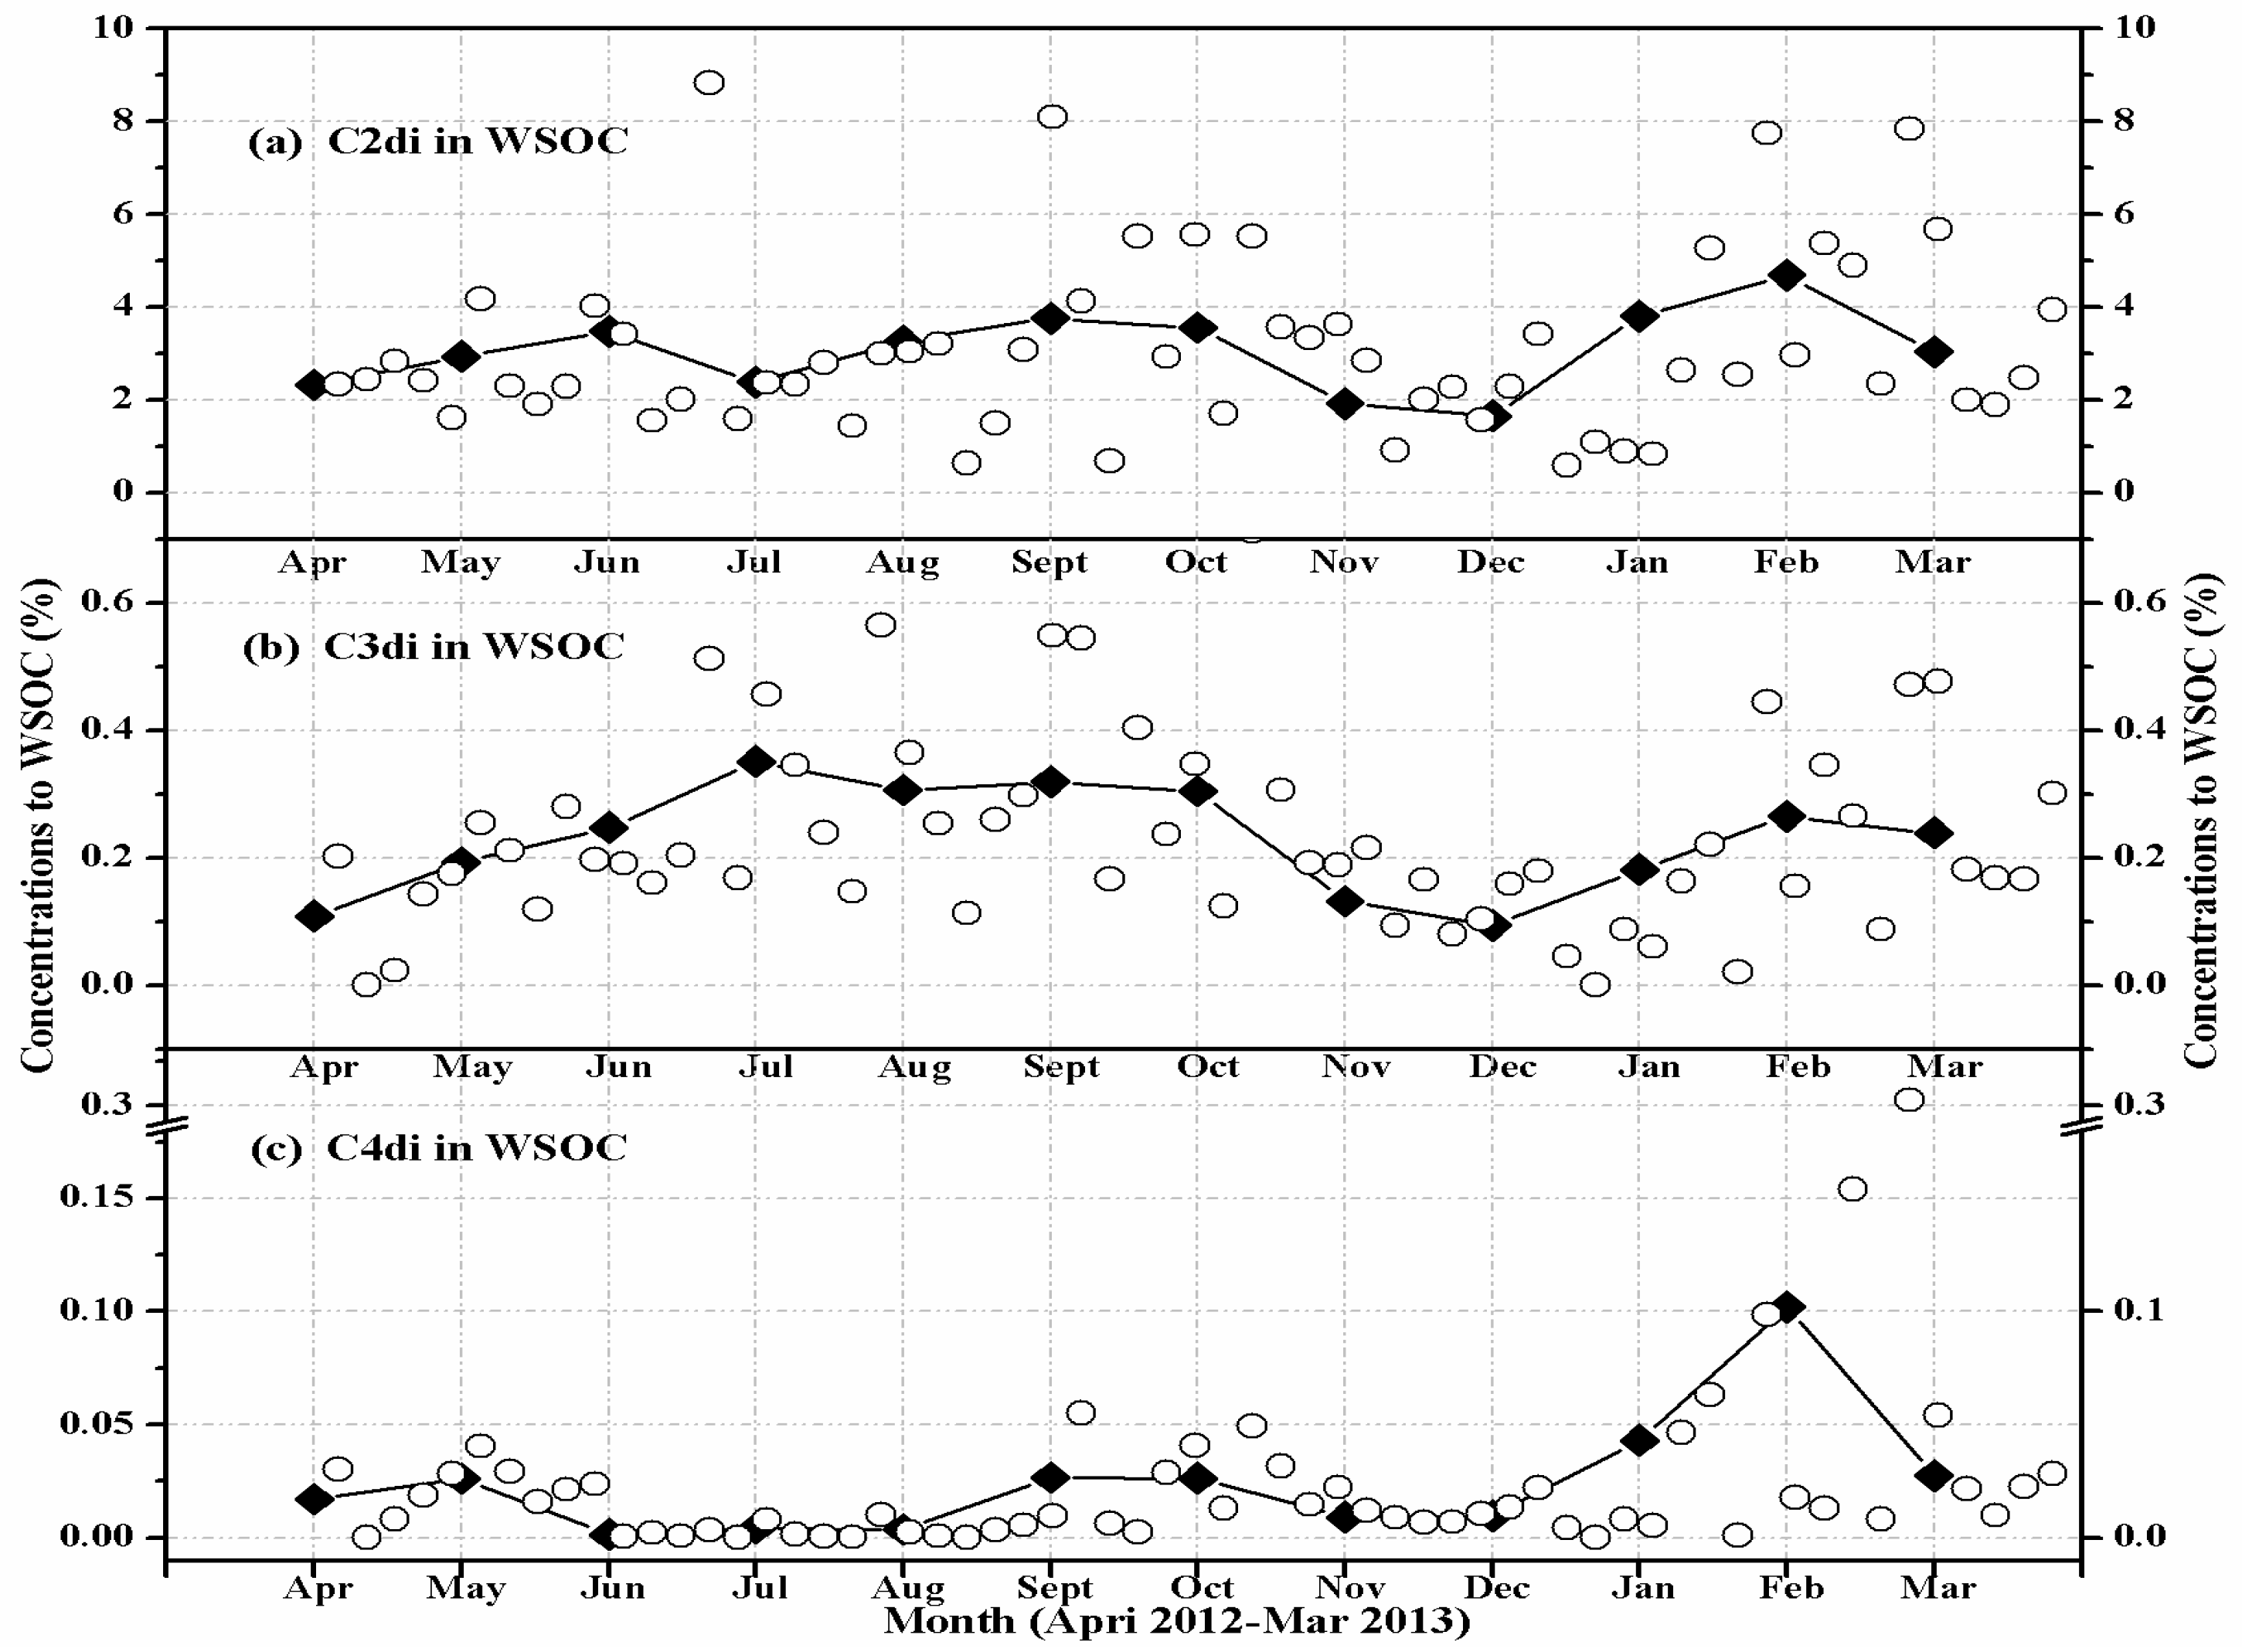
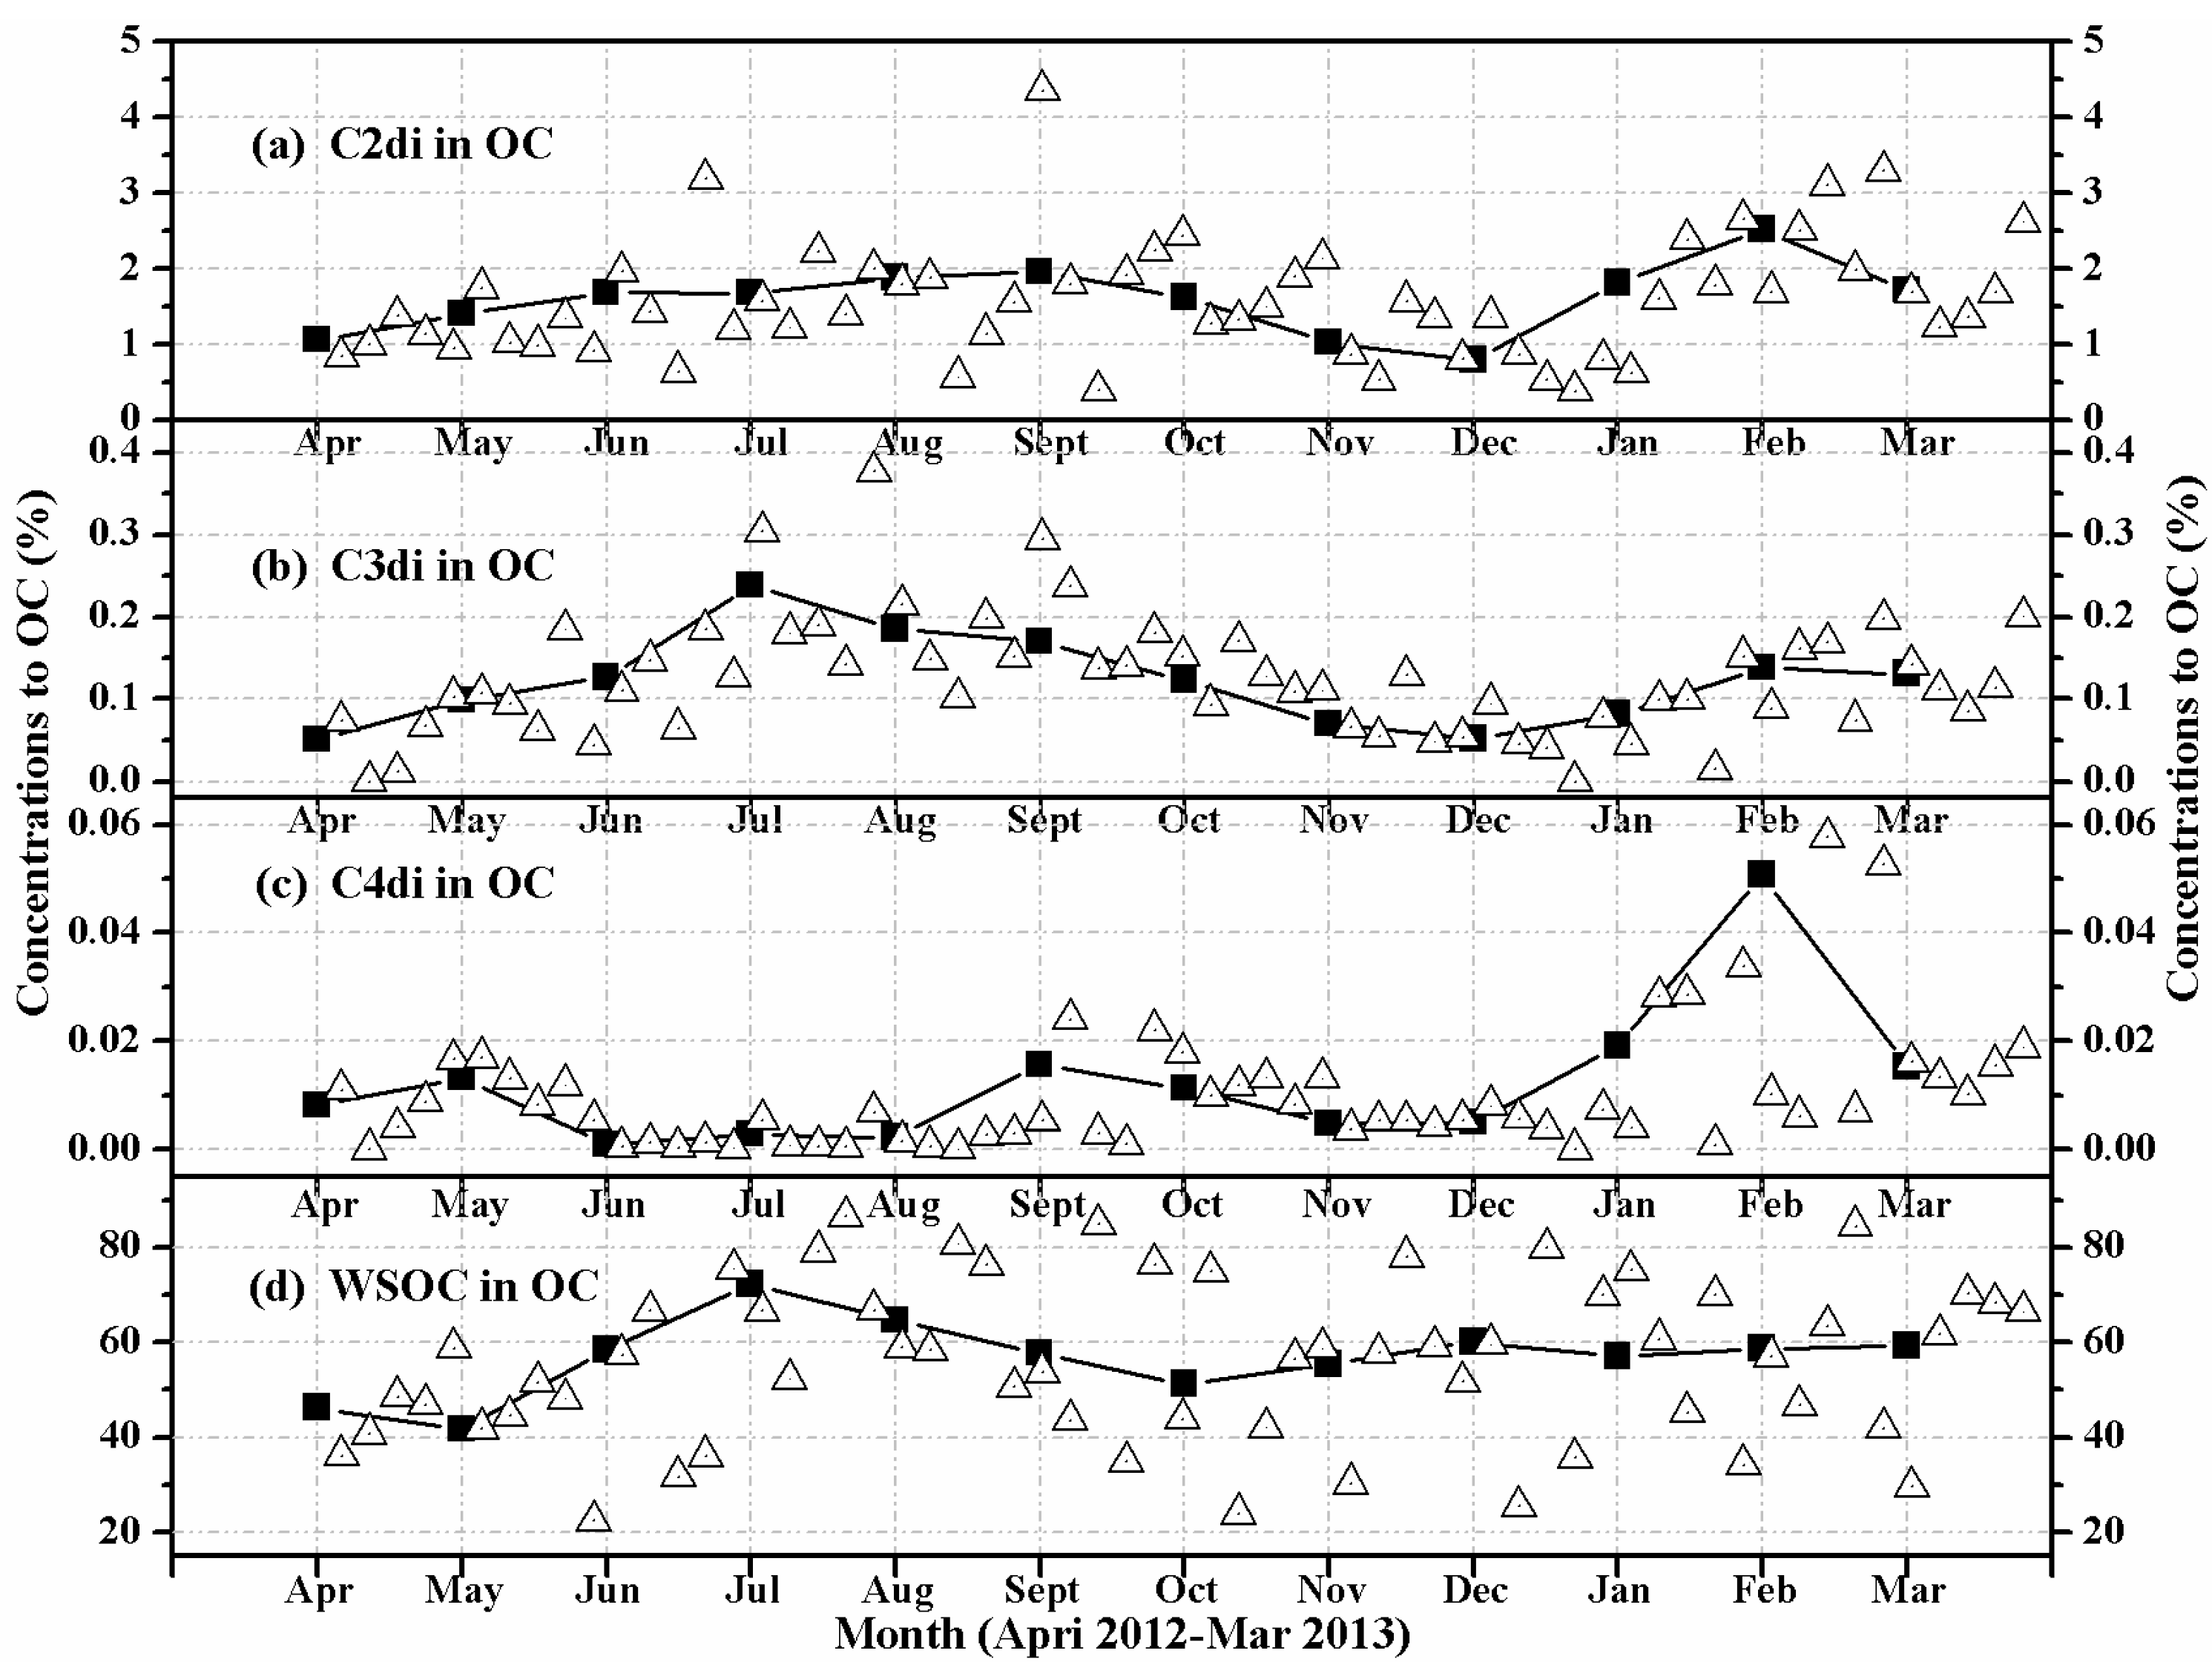
3.2. Seasonal Variations of Diacids

In Table 1, the concentration of C2 diacid was highest in winter (482 ± 187 ng·m−3), followed by summer (331 ± 111 ng·m−3) and spring (303 ± 100 ng·m−3), and lowest in autumn (272 ± 92 ng·m−3). C3 diacid showed the highest concentrations in summer (32.9 ± 9.08 ng·m−3), followed by winter (27.7 ± 10.1 ng·m−3) and autumn (21.8 ± 5.08 ng·m−3), and lowest in spring (21.3 ± 10.1 ng·m−3). The concentration of C4 diacid was decreased in the order of winter (7.25 ± 2.73 ng·m−3) > spring (2.53 ± 1.01 ng·m−3) > summer (2.34 ± 0.97 ng·m−3) > autumn (1.84 ± 0.78 ng·m−3). Seen from Figure 2, individual species of diacids (C2–C4) showed two different seasonal trends. C2 and C4 diacids showed maximum concentrations in winter (January, February, March) (Figure 2a,c). In contrast, C3 diacid showed maxima in summer (July, August, September) (Figure 2b). The different seasonal variations among the species suggest a difference in the sources or atmospheric processing. If the physical parameters such as lower mixing heights, surface inversion layers, and infrequent precipitations were the causes for the maximum concentrations, the concentrations of diacids should indicate the same seasonal trend [7]. Thus, the different seasonal trends between C2 or C4 and C3 diacid in HS aerosols should be caused by the difference in the emission sources or photochemical processing [10,31]. It had been reported that organic precursors that produce the compounds that showed maximum concentrations in winter are mainly aromatics and glyoxal (Gly), which can lead to the formation of C2 diacid [7,13]. Moreover, the huge emission source from coal/biomass combustion in Chinese megacities is more than seven times higher in winter than in summer [7,13,20].
To better understand the seasonal variations of diacids (C2–C4), the carbon content of an individual diacid was normalized by water-soluble organic carbon (WSOC) (Figure 3) and organic carbon (OC) (Figure 4). The results show that WSOC- and OC-normalized seasonal concentrations are similar to the variations of diacid concentrations (Figure 2). Higher values were found in winter (January, February, March) for C2 (Figure 3a and Figure 4a) and C4 (Figure 3c and Figure 4c), suggesting an enhanced emission potentially from coal/biomass combustion. In contrast, higher values were observed in summer (July, August, September) for C3 diacid (Figure 3b and Figure 4b), which is consistent with an enhanced secondary production due to higher oxidant concentrations and warmer temperatures [10,31]. The higher values for the contribution of WSOC to OC were found in summer (July, August, September) (Figure 4d), which further implies an enhanced secondary photochemical production, although it should also exist in other diacids and the related compounds except C2–C4 diacids. From all of the above, we can conclude that the C2–C4 diacids in HS aerosols are affected both from primary emissions and from secondary photochemical processing.

3.3. Possible Sources of Diacids

3.3.1. Correlation Analysis of Diacids

In Table 2, there was no significant correlation among the C2, C3, and C4 diacids in spring. Meanwhile, strong correlations were observed for C2 and C3 diacids in summer (r = 0.74, p < 0.01), autumn (r = 0.85, p < 0.01), and winter (r = 0.82, p < 0.01), and for C2 and C4 diacids in summer (r = 0.54, p < 0.05), autumn (r = 0.89, p < 0.01), and winter (r = 0.65, p < 0.01). The results suggest that during summer, autumn, and winter, the three diacids could have the same primary sources [36], or photochemical oxidation could exist for the species, since C3 and C4 diacids can be oxidized to C2 diacid via the breakdown of certain intermediates [10]. Moreover, for C2 diacid, a good correlation coefficient with SO42− was 0.69 (p < 0.05) in summer and 0.74 (p < 0.01) in winter, with NO3 was 0.81 (p < 0.01) in summer and 0.74 (p < 0.01) in winter, and with NH4+ was 0.74 (p < 0.01) in summer and 0.70 (p < 0.01) in winter. The results imply that the species could undergo a similar secondary oxidation processing in summer and winter, considering that the three ions SO42−, NO3, and NH4+ are secondary converted from gas precursors SO2, NOx, and NH3, respectively [37,38,39].
In order to evaluate the impacts of combustion sources, correlation analysis was examined between combustion tracer (EC) and diacids (Table 2). Although no statistically significant correlation was observed in spring, fair to good positive correlations were obtained for C2 diacid and EC in summer (r = 0.57, p < 0.05), autumn (r = 0.60, p < 0.05), and winter (r = 0.68, p < 0.01). Specifically, C2 had good correlation with the ion K+ in summer (r = 0.64, p < 0.01) and autumn (r = 0.58, p < 0.05). These results signify an enhanced contribution of combustion sources for C2 diacid in summer and autumn, possibly due to biomass burning [11,40,41]. More significantly, the ion K+ is mainly from the biomass combustion process, while the process also produces diacids [42]. That is to say, the biomass combustion process may be a primary source or secondary source of diacids in aerosols. The ratio of C2/K+ in HS aerosols were 0.05–1.05 in summer, and 0.03–0.27 in autumn, which was higher than those from a primary source (0.03–0.1) [42,43]. Therefore, we can conclude that C2 diacid should be formed by secondary reaction based on the process of biomass combustion in HS aerosols, especially in summer and autumn.

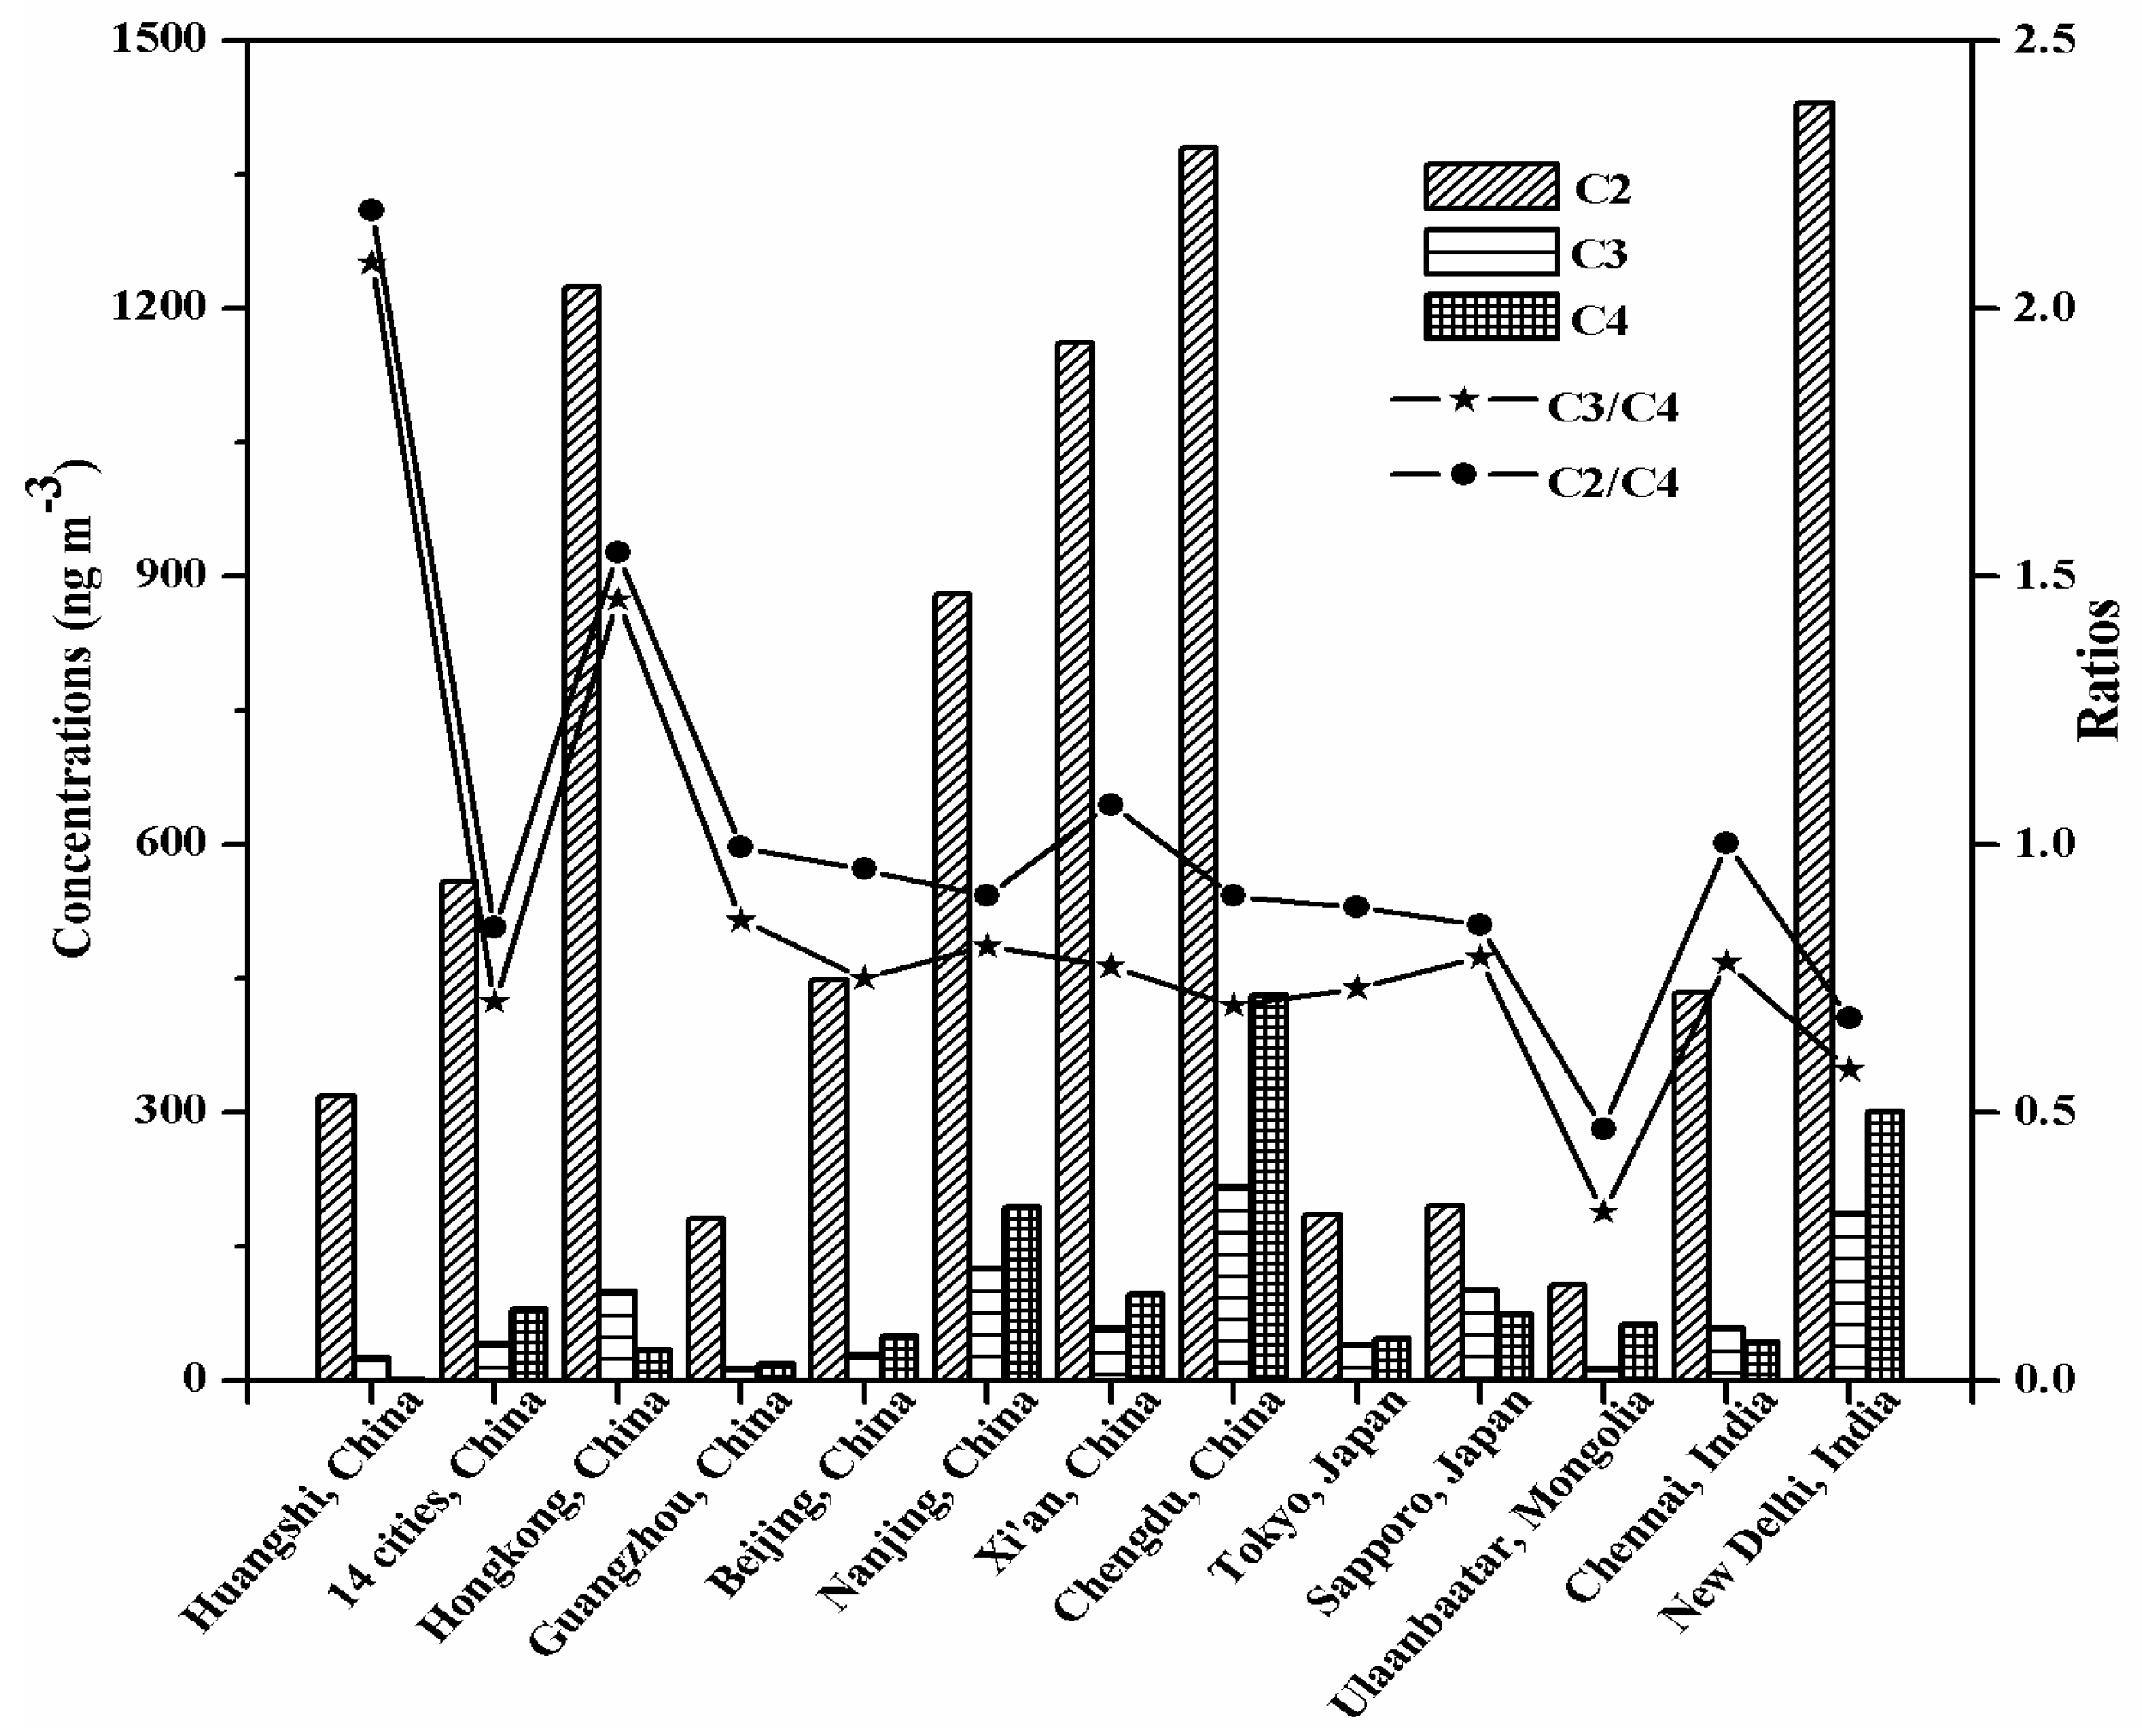
3.3.2. Concentration Ratios of Diacids

The C4 diacid can be degraded to C3 and C2 due to the decarboxylation reactions [10,31]. Therefore, the ratios of C2/C4 and C3/C4 were used in many previous studies to evaluate photochemical aging and track the possible sources of diacids [36,41,44]. As seen in Figure 1, the ratios of C2/C4 and C3/C4 in HS aerosols were higher than those reported from other sites at urban areas. Moreover, all of the ratios of C2/C4 and C3/C4 during the four seasons in this study were higher than those from other sites. The results suggest that no matter what the meteorological situation throughout the sampling period, HS aerosols should be more photochemically aged than at other urban sites.
The ratios of C2/C4 and C3/C4 showed the same seasonal variation in the decreased trend of summer > autumn > spring > winter. Moreover, it should be noted that C2 and C4 diacids presented the highest concentration in winter (482 ± 187 ng·m−3 and 7.25 ± 2.73 ng·m−3, respectively) compared with other three seasons. Therefore, we can conclude that possible sources for C2 and C4 diacids should exist, especially in winter.

3.3.3. Principal Component Analysis of Diacids

To further investigate the possible sources and/or formation processing of diacids in the HS aerosols, principal component analysis (PCA) [41,45] was performed for the data sets of selected water-soluble species (n = 9). The results using varimax rotation with Kaiser normalization (PCA, SPSS version 17.0, SPSS Inc. 2008, Chicago, IL, USA) are listed in Table 3. The major factors accounted for 80%, 82%, 80%, and 89% of the total variances in spring, summer, autumn, and winter, respectively.
In the spring samples, these species, including SO42−, NO3, NH4+, Mg2+, and Ca2+ showed strong correlations with component 1 (F1). It should be associated with anthropogenic sources because they are emitted from industrial emissions, coal combustion, vehicular exhaust, and urban dust [29,41]. C2, C3, and K+ showed good correlations with component 2 (F2), suggesting an importance of the photochemical process, followed by anthropogenic source. Due to that, C2 and C3 diacids are formed by photochemical oxidation [36,41], and K+ is from biomass burning [29,33]. C4 diacid presented good correlations with component 3 (F3), indicating that the photochemical process is significant [36,41]. In summer, SO42−, NO3, NH4+, Mg2+, Ca2+, K+, and C2, C3 showed good correlations with F1, suggesting important anthropogenic sources [29,41] followed by photochemical oxidation [36,41]. In F2, C4 diacid presented high loadings, which is associated with the photochemical process [36,41]. During autumn, C2, C3, C4, Mg2+, Ca2+, and K+ showed good correlations with F1, which is associated with photochemical oxidation [36,41], followed by anthropogenic sources [29,33]. SO42−, NO3, and NH4+ showed good correlations with F2, indicating significant anthropogenic sources [29,41]. In winter, C2, C3, C4, SO42−, NO3, and NH4+ showed strong correlations with F1, suggesting important photochemical oxidation [36,41] and anthropogenic sources [29,41]. Moreover, Mg2+ and K+ showed strong correlations with F2, while Ca2+ showed strong correlations with F3, indicating significant anthropogenic sources [29,33]. From the above, these results suggest that HS aerosols are influenced not only from primary emission, but also from secondary reaction.

3.4. Formation Processes of Diacids

There are two main pathways for the formation of C2 diacid through liquid phase oxidation in aerosols. Pathway 1 is from the oxidation of common precursors, including unsaturated fatty acids, which can produce C4 diacid. C4 diacid can be oxidized to C3 diacid by OH radicals, and C3 diacid can be further oxidized to C2 diacid [45]. Thus, strong correlations are often observed for C2, C3, and C4 diacids during pathway 1 [10,45]. Pathway 2 is from the oxidation of hydrocarbon compounds such as toluene, isoprene, and ethylene. The oxidation process can produce the intermediates, such as acetaldehyde, without C3 and C4 diacids [46,47]. That is to say, C3 and C4 diacids are ubiquitous during pathway 1, but can’t be found during pathway 2. Therefore, C3 and C4 diacids should play an important role for determining the formation process of C2 diacid between pathway 1 and pathway 2. Since C3 diacid can be formed during pathway 1 but can’t be found during pathway 2, it is reasonable to discuss the relative contribution of different pathways to C2 diacids, according to the linear relation between C2 and C3 diacids in aerosols. In Table 4, the intercept of the linear relation between C2 and C3 diacids represented the concentration of C2 diacid formed by pathway 2, and the slope represented the formation rate of C2 diacid via pathway 1. During spring, the mean concentration of C2 diacid was 303 ng·m−3, while the C2 concentration formed by pathway 2 was 201 ng·m−3. Therefore, the contribution of pathway 2 to the formation of C2 diacid was 66%, and then the contribution of pathway 1 to the formation of C2 diacid was 34%. The result indicates that C2 diacid was mainly produced from the oxidation of hydrocarbon compounds without C3 and C4 diacids in spring. Also, the result can be confirmed by the state that there was no significant correlation among C2, C3, and C4 in spring (Table 2). The contribution of pathway 2 to the formation of C2 diacid was 15% in summer, 46% in autumn, and 27% in winter, and then the contribution of pathway 1 to the formation of C2 diacid was 85% in summer, 54% in autumn, and 73% in winter, respectively. The results show that C2 diacid was predominantly formed from C3 or C4 diacids. These results are in accordance with the good correlation among C2, C3, and C4 in summer, autumn, and winter (Table 2), respectively.

4. Summary and Conclusions

Short-chain saturated diacids (C2–C4) were detected in Huangshi (HS) aerosols during April 2012 to March 2013. Oxalic acid (C2, 318 ± 104 ng·m−3) was found as the most abundant diacid, followed by malonic acid (C3, 25.4 ± 9.11 ng·m−3) and succinic acid (C4, 2.09 ± 0.52 ng·m−3). The result suggests that HS aerosols have aged due to the production of C2 and C3 diacid via the photochemical oxidation of C4 diacid. The seasonal variations of diacids and seasonal contributions of diacids to WSOC and OC suggest that both primary emission and secondary production are important for diacids in the HS aerosols. We found significant correlations between C2 and the three ions SO42−, NO3, and NH4+ in summer and winter, which suggests that the species could undergo the same secondary oxidation processing. Also, C2 had good correlation with K+ in summer and autumn, which indicated an enhanced contribution of combustion sources for diacids. Moreover, according to the ratio of C2/K+, we can conclude that C2 diacid should be formed by secondary reaction of biomass combustion in HS aerosols, especially in summer and autumn. After comparing the ratios of C2/C4 and C3/C4 with those reported at other urban sites, the results suggest that HS aerosols should be more photochemically aged than at other urban areas. Principal component analysis of diacids and selected water-soluble inorganic ions in the four seasons suggests that HS aerosols are influenced not only from primary emission, but also from secondary reaction. According to the linear relation between C2 and C3 diacids, the results indicate that C2 diacid is formed from the oxidation of hydrocarbon compounds in spring, while it is from the oxidation of C3 and C4 diacids in summer, autumn, and winter.

Reference

Acknowledgments

This study was supported by the Key Research Project of Hubei Polytechnic University (16xjz05A), the Open Foundation of Hubei Key Laboratory of Mine Environmental Pollution Control & Remediation (2014105, 2016109), the Open Research Fund of Joint Innovative Centre for Pollution Control and Resource Utilization Technology in Mining Area (xt201303), and the Science and Technology of State Ministry of Science and Technology Special Fund (2013FY112700). We are thankful to the editors and the reviewers for their help in improving the quality of manuscript. Also, we gratefully thank Zhang Wei and Zhang Yuan for polishing the language sincerely. Special thanks are given to Eri Tachibana and Kaori Ono for their help in chemical analysis. We acknowledge the financial support by Japan Society for the Promotion of Science (JSPS) through grant-in-aid (24221001).

Author Contributions

Hongxia Liu, Kimitaka Kawamura and Junji Cao designed the study and wrote the manuscript; Bhagawati Kunwar, Changlin Zhan, Jingru Zheng, Ruizhen Yao and Ting Liu analyzed the data; Jiaquan Zhang, Xianli Liu and Wensheng Xiao collected the data, coordinated the data-analysis and revised the paper.

Conflicts of Interest

The authors declare no conflict of interest.

References

  1. Kawamura, K.; Usukura, K. Distributions of low molecular weight dicarboxylic acids in the North Pacific aerosol samples. J. Oceanogr. 1993, 49, 271–283. [Google Scholar] [CrossRef]
  2. Kerminen, V.M.; Teinila, K.; Hillamo, R.; Makela, T. Size-segregated chemistry of particulate dicarboxylic acids in the Arctic atmosphere. Atmos. Environ. 1999, 33, 2089–2100. [Google Scholar] [CrossRef]
  3. Gierlus, K.M.; Laskina, O.; Abernathy, T.L.; Grassian, V.H. Laboratory study of the effect of oxalic acid on the cloud condensation nuclei activity of mineral dust aerosol. Atmos. Environ. 2012, 46, 125–130. [Google Scholar] [CrossRef]
  4. Highwood, E.J.; Kinnersley, R.P. When smoke gets in our eyes: The multiple impacts of atmospheric black carbon on climate, air quality and health. Environ. Int. 2006, 32, 560–566. [Google Scholar] [CrossRef] [PubMed]
  5. Kawamura, K.; Kaplan, I.R. Motor exhaust emissions as a primary source for dicarboxylic acids in Los Angeles ambient air. Environ. Sci. Technol. 1987, 21, 105–110. [Google Scholar] [CrossRef]
  6. Ho, K.F.; Lee, S.C.; Cao, J.J.; Kawamura, K.; Watanabe, T.; Cheng, Y.; Chow, J.C. Dicarboxylic acids, ketocarboxylic acids and dicarbonyls in the urban roadside area of Hong Kong. Atmos. Environ. 2006, 40, 3030–3040. [Google Scholar] [CrossRef]
  7. Kundu, S.; Kawamura, K.; Andreae, T.W.; Hoffer, A.; Andreae, M.O. Molecular distributions of dicarboxylic acids, ketocarboxylic acids and α-dicarbonyls in biomass burning aerosols: Implications for photochemical production and degradation in smoke layers. Atmos. Chem. Phys. 2010, 10, 2209–2225. [Google Scholar] [CrossRef]
  8. Schauer, J.J.; Kleeman, M.J.; Cass, G.R.; Simoneit, B.R.T. Measurement of emission from air pollution sources. 4. C1–C27 organic compounds from cooking with seed oils. Environ. Sci. Technol. 2002, 36, 567–575. [Google Scholar] [CrossRef] [PubMed]
  9. Tedetti, M.; Kawamura, K.; Charriere, B.; Chevalier, N.; Sempéré, R. Determination of low molecular weight dicarboxylic and ketocarboxylic acids in seawater samples. Anal. Chem. 2006, 78, 6012–6018. [Google Scholar] [CrossRef] [PubMed]
  10. Kawamura, K.; Ikushima, K. Seasonal changes in the distribution of dicarboxylic acids in the urban atmosphere. Environ. Sci. Technol. 1993, 27, 2227–2235. [Google Scholar] [CrossRef]
  11. Kawamura, K.; Tachibana, E.; Okuzawa, K.; Aggarwal, S.G.; Kanaya, Y.; Wang, Z.F. High abundances of water-soluble dicarboxylic acids, ketocarboxylic acids and α-dicarbonyls in the mountain top aerosols over the North China Plain during wheat burning season. Atmos. Chem. Phys. 2013, 13, 8285–8302. [Google Scholar] [CrossRef]
  12. Kawamura, K.; Kasukabe, H.; Barrie, L.A. Source and reaction pathways of dicarboxylic acids, ketoacids and dicarbonyls in arctic aerosols: One year of observations. Atmos. Environ. 1996, 30, 1709–1722. [Google Scholar] [CrossRef]
  13. Ervens, B.; Feingold, G.; Frost, G.J.; Kreidenweis, S.M. A modeling study of aqueous production of dicarboxylic acids: 1. Chemical pathways and speciated organic mass production. J. Geophys. Res. Atmos. 2004, 109, 1265–1277. [Google Scholar] [CrossRef]
  14. Hatakeyama, S.; Ohno, M.; Weng, J.H.; Takagi, H.; Akimoto, H. Mechanism for the formation of gaseous and particulate products from ozone-cycloalkene reactions in air. Environ. Sci. Technol. 1987, 21, 52–57. [Google Scholar] [CrossRef]
  15. Myriokefalitakis, S.; Tsigaridis, K.; Mihalopoulos, N.; Sciare, J.; Nenes, A.; Kawamura, K.; Segers, A.; Kanakidou, M. In-cloud oxalate formation in the global troposphere: A 3-D modeling study. Atmos. Chem. Phys. 2011, 11, 5761–5782. [Google Scholar] [CrossRef] [Green Version]
  16. Bikkina, S.; Kawamura, K.; Miyazaki, Y.; Fu, P.Q. High abundances of oxalic, azelaic, and glyoxylic acids and methylglyoxal in the open ocean with high biological activity: Implication for secondary OA formation from isoprene. Geophys. Res. Lett. 2014, 41, 3649–3657. [Google Scholar] [CrossRef]
  17. Wang, G.H.; Kawamura, K. Molecular characteristics of urban organic aerosols from Nanjing: A case study of a mega-city in China. Environ. Sci. Technol. 2005, 39, 7430–7438. [Google Scholar] [CrossRef] [PubMed]
  18. Wang, G.H.; Kawamura, K.; Xie, M.J.; Hu, S.Y.; Cao, J.J.; An, Z.S.; Waston, J.G.; Chow, J.C. Organic molecular compositions and size distributions of Chinese summer and autumn aerosols from Nanjing: Characteristic haze event caused by wheat straw burning. Environ. Sci. Technol. 2009, 43, 6493–6499. [Google Scholar] [CrossRef] [PubMed]
  19. Cao, J.J.; Zhu, C.S.; Tie, X.X.; Geng, F.H.; Xu, H.M.; Ho, S.; Wang, G.H.; Han, Y.M.; Ho, K.F. Characteristics and sources of carbonaceous aerosols from Shanghai, China. Atmos. Chem. Phys. 2013, 13, 803–817. [Google Scholar] [CrossRef]
  20. Wang, Y.; Zhuang, G.S.; Chen, S.; An, Z.S.; Zheng, A.H. Characteristics and sources of formic, acetic and oxalic acids in PM2.5 and PM10 aerosols in Beijing, China. Atmos. Res. 2007, 84, 169–181. [Google Scholar] [CrossRef]
  21. Ho, K.F.; Lee, S.C.; Ho, S.S.H.; Kawamura, K.; Tachibana, E.; Cheng, Y.; Zhu, T. Dicarboxylic acids, ketocarboxylic acids, α-dicarbonyls, fatty acids, and benzoic acid in urban aerosols collected during the 2006 Campaign of Air Quality Research in Beijing (CAREBeijing-2006). J. Geophys. Res. Atmos. 2010, 115, D19312. [Google Scholar] [CrossRef]
  22. Yang, F.; Huang, L.; Duan, F.; Zhang, W.; He, K.; Ma, Y.; Brook, J.R.; Tan, J.; Zhao, Q.; Cheng, Y. Carbonaceous species in PM2.5 at a pair of rural/urban sites in Beijing, 2005–2008. Atmos. Chem. Phys. 2011, 11, 7893–7903. [Google Scholar] [CrossRef]
  23. Cheng, C.L.; Wang, G.H.; Zhou, B.H.; Meng, J.J.; Li, J.J.; Cao, J.J.; Xiao, S. Comparison of dicarboxylic acids and related compounds in aerosol samples collected in Xi’an, China during haze and clean periods. Atmos. Environ. 2013, 81, 443–449. [Google Scholar] [CrossRef]
  24. Li, Y.C.; Yu, J.Z. Composition profile of oxygenated organic compounds and inorganic ions in PM2.5 in Hong Kong. Environ. Chem. 2010, 7, 338–349. [Google Scholar] [CrossRef]
  25. Ma, S.X.; Peng, P.A.; Song, J.Z.; Zhao, J.P.; He, L.L.; Sheng, G.Y.; Fu, J.M. Stable carbon isotopic compositions of organic acids in total suspended particles and dusts from Guangzhou, China. Atmos. Res. 2010, 98, 176–182. [Google Scholar] [CrossRef]
  26. Ho, K.F.; Ho, S.S.H.; Lee, S.C.; Kawamura, K.; Zou, S.C.; Cao, J.J.; Xu, H.M. Summer and winter variations of dicarboxylic acids, fatty acids and benzoic acid in PM2.5 in Pearl Delta River Region, China. Atmos. Chem. Phys. 2011, 11, 2197–2208. [Google Scholar] [CrossRef]
  27. Zhan, C.L.; Zhang, J.Q.; Cao, J.J.; Han, Y.M.; Wang, P.; Zheng, J.R.; Yao, R.Z.; Liu, H.X.; Xiao, W.S. Characteristics and sources of black carbon in atmospheric dustfall particles from HS, China. Aerosol Air Qual. Res. 2016, 16, 2096–2106. [Google Scholar] [CrossRef]
  28. Zhang, J.Q.; Qu, C.K.; Qi, S.H.; Cao, J.J.; Zhan, C.L.; Xing, X.L.; Xiao, Y.L.; Zheng, J.R.; Xiao, W.S. Polycyclic aromatic hydrocarbons (PAHs) in atmospheric dustfall from the industrial corridor in Hubei Province, Central China. Environ. Geochem. Health 2015, 37, 891–903. [Google Scholar] [CrossRef] [PubMed]
  29. Liu, H.X.; Zheng, J.R.; Qu, C.K.; Zhang, J.Q.; Wang, Y.K.; Zhan, C.L.; Yao, R.Z.; Cao, J.J. Characteristics and source analysis of water-soluble inorganic ions in PM10 in a typical mining city, Central China. Atmosphere 2017, 8, 74. [Google Scholar] [CrossRef]
  30. Kawamura, K. Identification of C2-C10 ω-oxocarboxylic acids, pyruvic acid, and C2-C3 α-dicarbonyls in wet precipitation and aerosol samples by capillary GC and GC/MS. Anal. Chem. 1993, 65, 3505–3511. [Google Scholar] [CrossRef]
  31. Kunwar, B.; Kawamura, K. Seasonal distributions and sources of low molecular weight dicarboxylic acids, ω-oxocarboxylic acids, pyruvic acid, α-dicarbonyls and fatty acids in ambient aerosols from subtropical Okinawa in the western Pacific Rim. Environ. Chem. 2014, 11, 673–689. [Google Scholar] [CrossRef]
  32. Hoque, M.M.M.; Kawamura, K. Longitudinal distributions of dicarboxylic acids, ω-oxoacids, pyruvic acid, α-dicarbonyls, and fatty acids in the marine aerosols from the central Pacific including equatorial upwelling. Glob. Biogeochem. Cycles 2016, 30, 534–548. [Google Scholar] [CrossRef]
  33. Pavuluri, C.M.; Kawamura, K.; Kikuta, M.; Tachibana, E.; Aggarwal, S.G. Time-resolved variations in the distributions of inorganic ions, carbonaceous components, dicarboxylic acids and related compounds in atmospheric aerosols from Sapporo, northern Japan during summertime. Atmos. Environ. 2012, 62, 622–630. [Google Scholar] [CrossRef]
  34. Pavuluri, C.M.; Kawamura, K.; Swaminathan, T. Water-soluble organic carbon, dicarboxylic acids, ketoacids, and α-dicarbonyls in the tropical Indian aerosols. J. Geophys. Res. Atmos. 2010, 115, 302. [Google Scholar] [CrossRef]
  35. Kawamura, K.; Yasui, O. Diurnal changes in the distribution of dicarboxylic acids, ketocarboxylic acids and dicarbonyls in the urban Tokyo atmosphere. Atmos. Environ. 2005, 39, 1945–1960. [Google Scholar] [CrossRef]
  36. Jung, J.; Tsatsral, B.; Kim, Y.J.; Kawamura, K. Organic and inorganic aerosol compositions in Ulaanbaatar, Mongolia, during the cold winter of 2007 to 2008: Dicarboxylic acids, ketocarboxylic acids, and α-dicarbonyls. J. Geophys. Res. Atmos. 2010, 115, 1842–1851. [Google Scholar] [CrossRef]
  37. Cheng, C.L.; Wang, G.H.; Meng, J.J.; Wang, Q.Y.; Cao, J.J.; Li, J.J.; Wang, J.Y. Size-resolved airborne particulate oxalic and related secondary organic aerosol species in the urban atmosphere of Chengdu, China. Atmos. Res. 2015, 161–162, 134–142. [Google Scholar] [CrossRef]
  38. Deshmukh, D.K.; Kawamura, K.; Lazaar, M.; Kunwar, B.; Boreddy, S.K.R. Dicarboxylic acids, oxoacids, benzoic acid, α-dicarbonyls, WSOC, OC, and ions in spring aerosols from Okinawa Island in the western North Pacific Rim: Size distributions and formation processes. Atmos. Chem. Phys. Discuss. 2016, 16, 5263–5282. [Google Scholar] [CrossRef]
  39. Huang, T.; Chen, J.; Zhao, W.T.; Cheng, J.X.; Cheng, S.G. Seasonal variations and correlation analysis of water-soluble inorganic ions in PM2.5 in Wuhan, 2013. Atmosphere 2016, 7, 49. [Google Scholar] [CrossRef]
  40. Cong, Z.Y.; Kawamura, K.; Kang, S.C.; Fu, P.Q. Penetration of biomass-burning emissions from South Asia through the Himalayas: New insights from atmospheric organic acids. Sci. Rep. 2015, 5, 9580. [Google Scholar] [CrossRef] [PubMed]
  41. Kunwar, B.; Torii, K.; Zhu, C.M.; Fu, P.Q.; Kawamura, K. Springtime variations of organic and inorganic constituents in submicron aerosols (PM1.0) from Cape Hedo, Okinawa. Atmos. Environ. 2016, 130, 84–94. [Google Scholar] [CrossRef]
  42. Yamasoe, M.A.; Artaxo, P.; Miguel, A.H.; Allen, A.G. Chemical composition of aerosol particles from direct emissions of vegetation fires in the Amazon Basin: Water soluble species and trace elements. Atmos. Environ. 2000, 34, 1641–1653. [Google Scholar] [CrossRef]
  43. Gao, S.; Hegg, D.A.; Hobbs, P.V.; Kirchstetter, T.W.; Magi, B.I.; Sadilek, M. Water-soluble organic components in aerosols with savanna fires in southern Africa: Identification, evolution, and distribution. J. Geophys. Res. 2003, 108, 471–475. [Google Scholar] [CrossRef]
  44. Ho, K.F.; Cao, J.J.; Lee, S.C.; Kawamura, K.; Zhang, R.J.; Chow, J.C.; Watson, J.G. Dicarboxylic acids, ketocarboxylic acids, and dicarbonyls in the urban atmosphere of China. J. Geophys. Res. Atmos. 2007, 112, S27-1–S27-12. [Google Scholar] [CrossRef]
  45. Kawamura, K.; Sakaguchi, F. Molecular distributions of water soluble dicarboxylic acids in marine aerosols over the Pacific Ocean including tropics. J. Geophys. Res. Atmos. 1999, 104, 3501–3509. [Google Scholar] [CrossRef]
  46. Carlton, A.G.; Turpin, B.J.; Lim, H.J.; Altieri, K.E.; Seitzinger, S. Link between isoprene and secondary organic aerosol (SOA): Pyruvic acid oxidation yields low volatility organic acids in clouds. Geophy. Res. Lett. 2006, 33, 272–288. [Google Scholar] [CrossRef]
  47. Sullivan, R.C.; Prather, K.A. Investigations of the diurnal cycle and mixing state of oxalic acid in individual particles in Asian aerosol outflow. Environ. Sci. Technol. 2007, 41, 8062–8069. [Google Scholar] [CrossRef] [PubMed]
Figure 1. Comparison of the concentrations of oxalic (C2), malonic (C3), and succinic (C4) diacids, and mass ratios of C2/C4 and C3/C4 in the PM10 aerosols from Huangshi, Central China with the literature data for urban atmospheric aerosols. All of the ratios of C2/C4 and C3/C4 are plotted on a logarithmic scale.
Atmosphere 08 00213 g001
Figure 2. Seasonal variations in the mass concentrations of (a) oxalic (C2), (b) malonic (C3), and (c) succinic (C4) in the PM10 aerosols of Huangshi, Central China. The solid lines indicate monthly mean data points.
Atmosphere 08 00213 g002
Figure 3. Seasonal variations in the contributions of (a) oxalic (C2), (b) malonic (C3), and (c) succinic (C4) to water-soluble organic carbon (WSOC) in the PM10 aerosols of Huangshi, Central China. The solid lines indicate monthly mean data points.
Atmosphere 08 00213 g003
Figure 4. Seasonal variations in the contributions of (a) oxalic (C2), (b) malonic (C3), (c) succinic (C4), and (d) water-soluble organic carbon (WSOC) to organic carbon (OC) in the PM10 aerosols of Huangshi, Central China. The solid lines indicate monthly mean data points.
Atmosphere 08 00213 g004
Table 1. Concentrations of dicarboxylic acids, carbonaceous components, and water-soluble inorganic ions in PM10 collected from Huangshi, Central China during April 2012 to March 2013.
CompoundsSpring (n = 15)Summer (n = 16)Autumn (n = 15)Winter (n = 15)
Median and RangeMean ± SDMedian and RangeMean ± SDMedian and RangeMean ± SDMedian and RangeMean ± SD
Dicarboxylic Acids (ng·m−3)
Oxalic, C2270 (137−513)303 ± 100255 (63.5−793)331 ± 111291 (69.7−579)272 ± 92457 (137−941)482 ± 187
Malonic, C321.9 (2.57−35.1)21.3 ± 10.132.7 (10.7−55.3)32.9 ± 9.0818.5 (5.31−74.6)21.8 ± 5.0828.5 (3.67−53.9)27.7 ± 10.1
Succinic, C42.45 (0.00−4.00)2.53 ± 1.012.00 (0.03−5.80)2.34 ± 0.971.35 (0.50−5.17)1.84 ± 0.786.54 (0.86−32.2)7.25 ± 2.73
Carbonaceous Components (μg·m−3)
EC2.95 (1.41−3.58)3.06 ± 0.775.17 (2.64−12.4)5.84 ± 1.917.89 (4.15−12.0)7.77 ± 1.017.52 (4.84−14.3)8.67 ± 2.07
OC22.6 (11.4−46.6)24.0 ± 6.3714.6 (7.75−32.8)17.1 ± 4.8821.6 (13.1−43.8)23.3 ± 3.5521.8 (12.9−35.5)23.5 ± 10.8
WSOC11.0 (5.81−21.8)11.6 ± 2.989.93 (6.36−17.4)10.8 ± 3.1211.8 (7.04−22.2)11.8 ± 3.0913.2 (7.51−21.1)13.7 ± 3.99
Water-Soluble Inorganic Ions (μg·m−3)
F0.44 (0.25−1.01)0.53 ± 0.190.31 (0.23−0.64)0.35 ± 0.260.62 (0.35−1.16)0.68 ± 0.450.60 (0.32−0.99)0.61 ± 0.19
Cl3.09 (1.70−5.57)3.26 ± 1.112.11 (1.04−4.83)2.31 ± 1.064.97 (2.23−11.0)5.31 ± 2.018.27 (3.60−37.6)8.14 ± 3.66
NO312.5 (4.82−33.8)15.4 ± 5.054.99 (1.31−15.7)6.73 ± 2.1022.4 (7.52−38.3)21.1 ± 7.9643.6 (16.8−77.7)39.8 ± 11.9
SO42−29.4 (13.1−43.4)29.2 ± 9.1518.2 (2.65−60.4)23.1 ± 5.2325.3 (14.6−42.8)25.4 ± 10.844.6 (16.7−99.8)42.5 ± 11.4
Na+5.28 (4.43−6.38)5.34 ± 2.225.02 (0.78−6.05)4.94 ± 1.995.11 (4.71−7.40)5.31 ± 2.105.19 (4.19−6.67)5.15 ± 1.02
NH4+6.39 (1.37−12.2)6.08 ± 2.362.13 (0.24−13.3)3.52 ± 0.677.34 (1.78−15.7)6.30 ± 2.7615.6 (5.30−32.0)14.7 ± 3.01
K+1.45 (0.46−6.37)1.86 ± 0.900.71 (0.16−2.33)0.92 ± 0.291.57 (1.09−3.38)1.68 ± 0.772.83 (0.87−27.4)2.62 ± 1.04
Mg2+0.54 (0.23−0.91)0.56 ± 0.350.38 (0.11−0.71)0.41 ± 0.110.59 (0.40−0.93)0.61 ± 0.210.63 (0.22−2.00)0.61 ± 0.17
Ca2+5.01 (2.39−8.28)5.37 ± 2.414.58 (1.46−6.78)4.44 ± 1.956.89 (3.80−10.7)6.63 ± 2.054.31 (1.97−8.50)4.83 ± 1.31
Table 2. Correlation (r) analysis among diacids, elemental carbon (EC), and water-soluble inorganic ions in the PM10 aerosols in Huangshi, Central China.
SpringC2C3C4ECFClNO3SO42−Na+NH4+K+Mg2+Ca2+
C21.000.500.12−0.23−0.26−0.150.030.160.210.110.37−0.130.01
C31.000.33−0.06−0.55−0.53−0.53−0.17−0.20−0.420.11−0.27−0.09
C41.00−0.200.040.180.20−0.190.27−0.140.170.430.12
SummerC2C3C4ECFClNO3SO42−Na+NH4+K+Mg2+Ca2+
C21.000.74 **0.54 *0.57 *0.440.410.81 **0.69 **0.340.74 **0.64 **0.71 **0.74 **
C31.000.430.51 *0.430.210.51 *0.480.330.420.310.62 *0.77 **
C41.000.170.190.350.480.100.050.240.320.310.37
AutumnC2C3C4ECFClNO3SO42−Na+NH4+K+Mg2+Ca2+
C21.000.85 **0.89 **0.60 *0.120.110.280.48−0.040.260.58 *0.400.29
C31.000.90 **0.66 **0.23−0.04−0.030.12−0.07−0.120.65 **0.57 *0.51
C41.000.490.08−0.050.030.290.090.030.57 *0.470.37
WinterC2C3C4ECFClNO3SO42−Na+NH4+K+Mg2+Ca2+
C21.000.82 **0.65 **0.68 **0.260.090.74 **0.74 **0.220.70 **0.140.290.49
C31.000.62 *0.510.280.110.52 *0.40−0.070.350.170.320.56 *
C41.000.370.03−0.010.61 *0.66 *−0.030.64 *−0.050.030.23
** represents significant correlation (p ≤ 0.01); * represents significant correlation (p ≤ 0.05).
Table 3. Results of principal component analysis of diacids and selected water-soluble inorganic ions in the PM10 aerosols of Huangshi, Central China.
CompoundsSpringSummerAutumnWinter
F1F2F3F1F2F1F2F1F2F3
C20.000.79−0.310.890.240.910.170.930.140.16
C3−0.440.740.130.700.500.92−0.220.750.240.49
C40.080.510.770.460.720.90−0.060.79−0.09−0.05
NO30.92−0.060.110.95−0.100.220.810.89−0.28−0.17
SO42−0.850.16−0.400.87−0.370.400.850.870.05−0.38
NH4+0.90−0.02−0.340.89−0.330.120.980.87−0.25−0.40
K+0.150.61−0.360.79−0.230.780.180.050.97−0.21
Mg2+0.830.030.520.93−0.130.59−0.550.180.970.00
Ca2+0.760.140.210.870.130.55−0.620.46−0.090.78
Characteristic Value3.841.851.446.201.173.973.134.592.121.24
Contribution Rate (%)43211669134535512414
Cumulative Contribution Rate (%)43648069824580517589
Table 4. Contribution of different pathways to the formation of C2 diacid according to the linear relation between C2 and C3 diacids in the PM10 aerosols of Huangshi, Central China.
SeasonLinear Relation between C2 and C3 DiacidsMean Concentration of C2 Diacid (ng·m−3) *C2 Concentration Formed by Pathway 2 (ng·m−3) **Contribution from Pathway 2 ***Contribution from Pathway 1 ****
SpringC(C2) = 5.14 C(C3) + 201 (R2 = 0.24)30320166%34%
SummerC(C2) = 11.56 C(C3) + 49.0 (R2 = 0.55)33149.015%85%
AutumnC(C2) = 7.15 C(C3) + 126 (R2 = 0.72)27212646%54%
WinterC(C2) = 12.77 C(C3) + 129 (R2 = 0.67)48212927%73%
* The mean concentration can be seen from Table 1. ** The concentration is the intercept of the linear relation between C2 and C3 diacids. *** The result is calculated by the ratio of C2 concentration formed by pathway 2 to the mean concentration of C2 diacid in each season. **** The result is calculated by one hundred percent minus the contribution from Pathway 2.

