Article

Effects of Mixed Phase Microphysical Process on Precipitation in a Simulated Convective Cloud

1
Hubei Key Laboratory for Heavy Rain Monitoring and Warning Research, Institute of Heavy Rain, China Meteorological Administration, Wuhan 430205, China
2
Key Laboratory for Aerosol Cloud-Precipitation, China Meteorological Administration, Nanjing University of Information Science and Technology, Nanjing 210044, China
3
Hubei Lightning Protecting Center, Wuhan 430074, China
4
Wuhan Central Meteorological Observatory, Wuhan 430074, China
*
Author to whom correspondence should be addressed.
Atmosphere 2016, 7(8), 97; https://doi.org/10.3390/atmos7080097
Submission received: 12 July 2016 / Revised: 18 July 2016 / Accepted: 21 July 2016 / Published: 29 July 2016
(This article belongs to the Special Issue Advances in Clouds and Precipitation)

Abstract

:
The effects of the liquid water content (LWC) and mixing ratio of hydrometeors in the simulation of convective precipitation in Wuhan, Hubei Province, China, are investigated using a three-dimensional convective rainstorm model. The microphysical processes of warm and cold clouds are considered into microphysical parameterization. The warm-cloud process is dominated by the combined effects of condensation and drop coalescence. The cold-cloud process is initiated mainly by production of graupel, and the microphysical parameterizations are used to predict the mixing ratio of cloud droplets, rain, ice crystals, snow, and graupel. The simulations results show that 80% rainfall is derived from warm cloud microphysical processes, and the rest is produced by cold cloud microphysical processes. The mixed phase microphysical process can invigorate the production of convective rainfall and enhance the liquid water content (LWC). In addition, the vertical distribution of LWC is mainly concentrated at the height isotherms of −10 to −20 °C in precipitation and the concentration area of LWC matches the distribution range of graupel particles. However, the growth of graupel particles depend on the microphysical processes of nucleation and propagation between rain and graupel particles (NUrg) and collision and coalescence between cloud droplets and graupel (CLcg), in which NUrg is a major source of graupel particles and the contribution of the process accounts for 77% of the amount of graupel particles.

1. Introduction

Convective precipitation is usually organized into a rainfall band along the southeastern coast of South China in the early morning hours [1], and the formation of precipitation has been a hot topic in cloud and precipitation physics research. The formation of precipitation is a result of interactions between dynamic and cloud microphysical processes. In particular, convective rainfall is associated with the convergence of water vapor, radiative effects, aerosols, and microphysical processes [2,3,4,5]. The microphysical process affects the development of precipitation, and the majority of relevant studies have focused on the selection of parameterization and microphysical factors for different weather backgrounds [6]. Cloud microphysical factors include the cloud phase, cloud microphysical characteristics, particle concentration, particle size distribution, liquid water content (LWC), ice water content, and effective radius, and it is essential to study the distribution and evolution of LWC on the formation of cloud, precipitation and weather modification. It can be found that the value of LWC can increase obviously before precipitation and the formation of surface precipitation fall behind the increasing of LWC from observations, but when the LWC is higher, the corresponding of surface precipitation is decreased in the process of rainfall [7,8], which illustrates the generation of precipitation may be linked to the vertical distribution of LWC, especially the distribution of LWC at low-level clouds has a direct relation to rainfall increase on ground. Therefore, we study the factors to understand the effects of LWC on precipitation, and the vertical distribution of LWC in different term of precipitation.
In order to further study the internal formation of precipitation, cloud modelers have developed numerous types of bulk cloud and precipitation parameterization, and these parameterizations are very simple to use for studying the development of cloud or rain, which led to parameterizations developed by Kessler, Simpson and Wiggert [9,10], and these parameterizations are used to predict vapor, cloud droplets, and rain. Further expansion to study ice phase process is encouraged by Wisner et al., and Rutledge and Hobbs [11,12]. With the development of cloud models and parameterization, the microphysical parameterization mainly includes cloud droplets, rain drops, ice crystals, snow, graupel, frozen drops, and hail in the model.
Precipitation in convective clouds develops via some combination of particles and the formation mechanism is divided into warm and cold cloud processes. Burning et al. showed that the warm-cloud process is dominated by the combined effects of condensation and coalescence [13]. Liu and Zipser proposed that the ice phase process enhanced updraft velocity and surface precipitation, but the ice phase process was not important in the environment of weak instability [14]. Additionally, Konwar et al. believed the ice phase plays an important role in mixed-phase cloud development [15], and the cold-cloud process is initiated mainly by emergence of graupel embryos, and subsequent precipitation growth is dominated by graupel riming of cloud droplets [16,17,18]. It is suggested that the ice phase is necessary in the formation of precipitation.
The change of hydrometeor particles, ice phase microphysical process, and morphology of precipitation are the topics of interest in this modeling study. In addition, we investigate the effects of LWC and ice phase process on the evolution of precipitation and graupel particles in this study. For this purpose, a three-dimensional cloud model with detailed description of cloud microphysics as well as a dynamic parameterization is used [19]. Numerical experiments are conducted as shown in Section 1 (warm cloud process) and Section 2 (warm and cold cloud process) in the convective cloud, and the effects of cold cloud microphysical process on precipitation is analyzed. Our results provide us with new insight into the modification of microphysical parameterization in models and precipitation forecast.

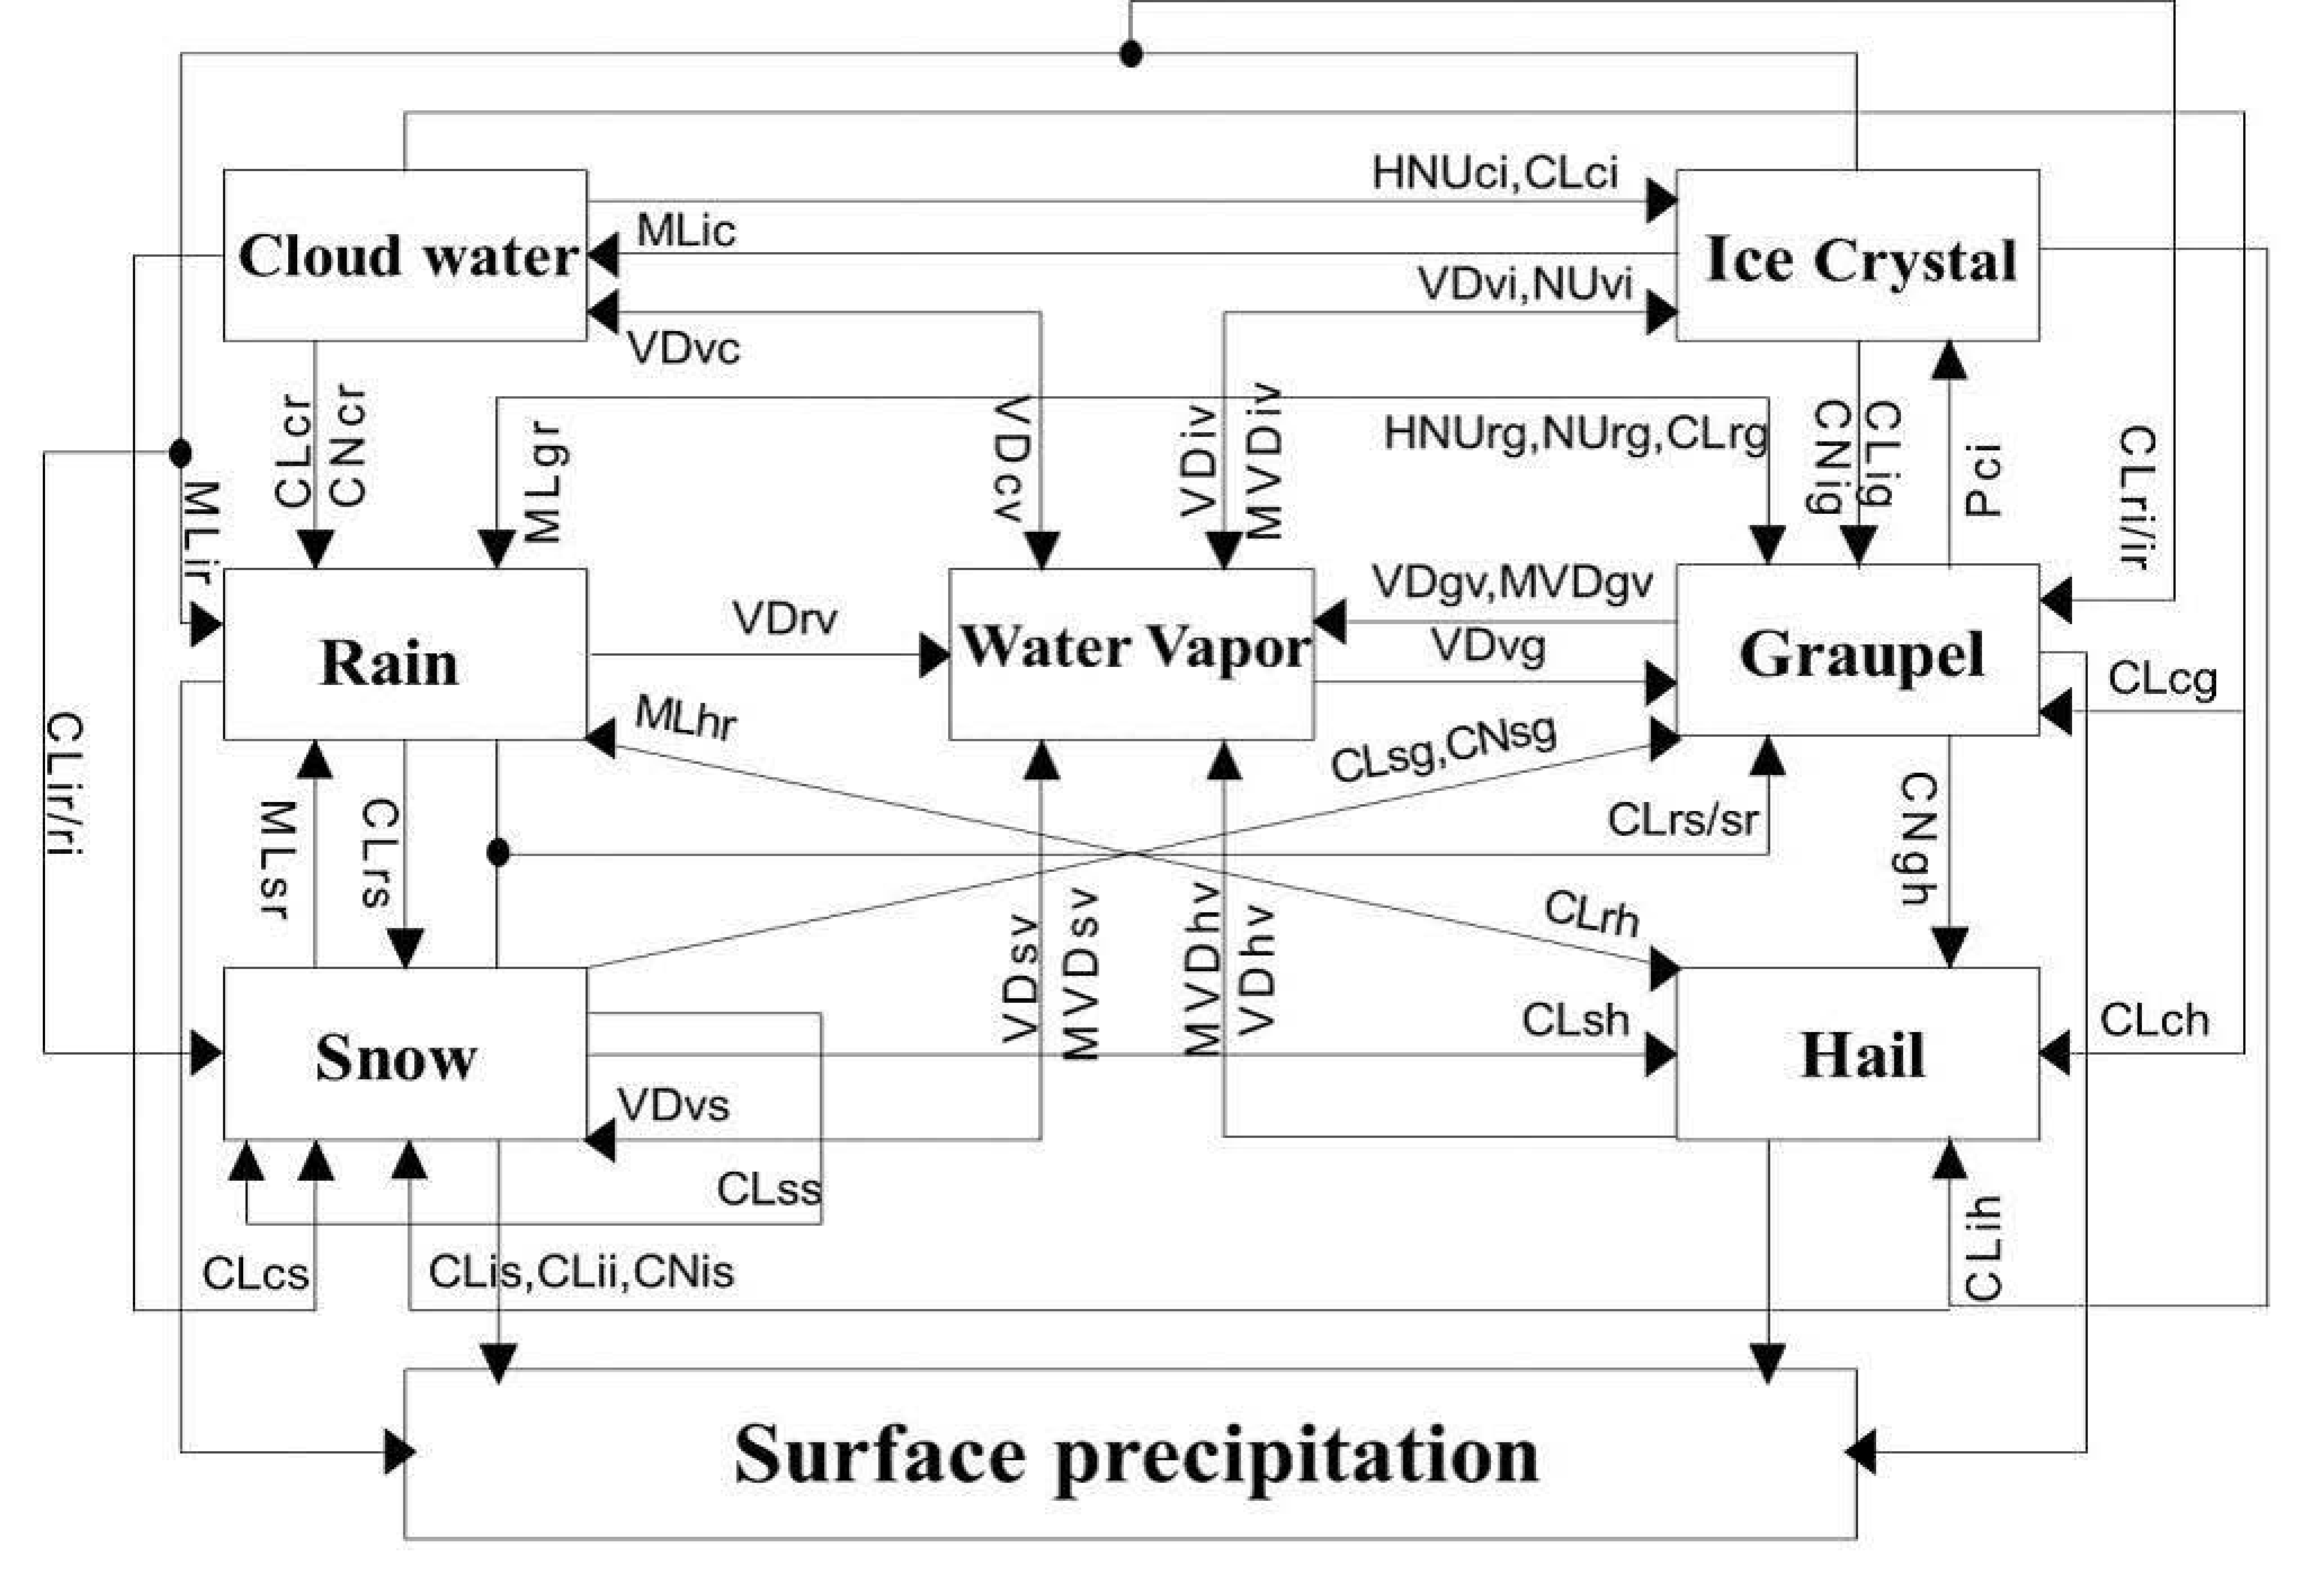
2. Model Description

The study used the Institute of Atmospheric Physics-Convective storms model 3D (IAP-CSM3D) [20,21,22]. The model uses the basic equation set from Klemp and Wilhelmson, including momentum, pressure, potential temperature, and turbulent kinetic energy [23]. The standard especially staggered mesh system is used in the model, where the thermodynamically variables and hydrometer quantities are located in the center of grid element, and the velocity components are displaced by one-half of a grid interval. In solving the compressible equations of motion, a time-splitting method is used in the model [24]. For the horizontal and vertical advection terms, tracers or momentum, fourth- and second-order finite differences are used, respectively.

Microphysics, Model Domain, Initialization

The microphysics parameterization is an outgrowth and adaptation of Hu [25], and the parameterizations of microphysics in this model are based on the work of Orville and Kopp and Tripoli and Cotton [26,27]. The dynamic framework of the present model is similar to that established by Klemp and Wilhelmson [28], and the governing equations for momentum in the horizontal and vertical directions, thermodynamic energy, and mass continuity can be written as
d u d t + c p θ v ¯ π x = D u
d v d t + c p θ v ¯ π y = D v
d w d t + c p θ v ¯ π z = g ( θ θ ¯ + 0.608 q v q T ) + D w
d θ d t = Q u l + Q l i + Q v i + D θ
d π d t + c ¯ 2 c p ρ ¯ θ v ¯ 2 x j ( ρ ¯ θ v ¯ u j ) = R d c v π u j x j + c 2 c p θ v 2 d θ v d t + D π
where d / d t = / t + u j / x j . Here, u, v, and w are the velocity components in the x, y and z directions, respectively; θ is the potential temperature; θ′ is the perturbation potential temperature; θ v is the virtual potential temperature; q T is the mixing ratio of total hydrometeors; q v is the perturbation pressure from the initial state; ρ is the moist air density; R d is the gas constant for dry air; c p is the specific heat of air at constant pressure; c v is the specific heat of air at constant volume; c is the adiabatic sound speed; and Q a b represents the heating or cooling as a result of water phase change form status a to b or vice versa in Equation (4). The subscripts υ , l , and i indicate water vapor, liquid water and ice, respectively. The term D represents the turbulent diffusion and is evaluated with a prognostic equation for turbulent kinetic energy k .
The prognostic equations for the hydrometeor mixing ratio q x and the number of hydrometeors per unit mass of air N y can be written as
d q x d t = S q x + D q x + 1 ρ ¯ z ( ρ ¯ q x V x )
d N y d t = S N y + D N y + 1 ρ ¯ z ( ρ ¯ N y V y )
where the mass-weighted average fall speeds are represented by V x and V y . Here, q x includes water vapor and six hydrometeors (cloud water, rain, cloud ice, snow, graupel, and hail). Included in N y are rain, cloud ice, snow, graupel, and hail (the number of cloud water drops per unit mass of air is specified). Notice that ρ N y is the number density of hydrometeor (m−3).
The convective-stratiform mixed cloud model employs a two-moment bulk microphysical parameterization that describes form and phase changes among a range of liquid and ice hydrometeors [19]. The microphysical parameterization predicts the mass mixing ratio and number concentration of cloud droplets, raindrops, ice crystals, graupel and snow particles, and considers the change of mixing ratio and number concentration for hail and frozen droplets, and establishes the prognostic equations of the particles [24]. The size distribution of particles is described by the Gamma function. Seven hydrometeors (water vapor, cloud droplets, rain, ice crystal, snow, graupel and hail) and seven microphysical processes are considered in the model, including condensation (VD), collection and coalescence (CL), nucleation (NU), melting (ML), evaporation (MVD) and auto conversion (CN). The interactions between the microphysical processes of hydrometeors and variables are shown in Figure 1 and Appendix.
In this study, the microphysical parameterizations are divided into two sections: Section 1, only warm cloud microphysical process; and Section 2, warm cloud and cold cloud microphysical processes. The warm cloud microphysical process mainly includes the condensation and drop coalescence (i.e., binary coalescence or self-collection of cloud droplets to form raindrops, followed by rain collection of cloud and rain self-collection), while the cold cloud microphysical process is initiated mainly by production of graupel. Details of the microphysical processes are provided in the Appendix.
The size of model domain is 36 km × 36 km × 38 km, with a horizontal grid interval of 1 km and a vertical grid interval of 500 m. The large and small time steps are 10 and 5 s, respectively. At the lateral boundaries, the radiation boundary condition is used for normal velocity. The initial-state wind, temperature, and moisture profiles used for numerical simulations are taken from observations in Wuhan on 12 July 2012. Convection is initiated using a warm bubble with a maximum magnitude of 1.8 K located at the lowest 2 km of the model. Numerical integaration is carried out for 60 min.

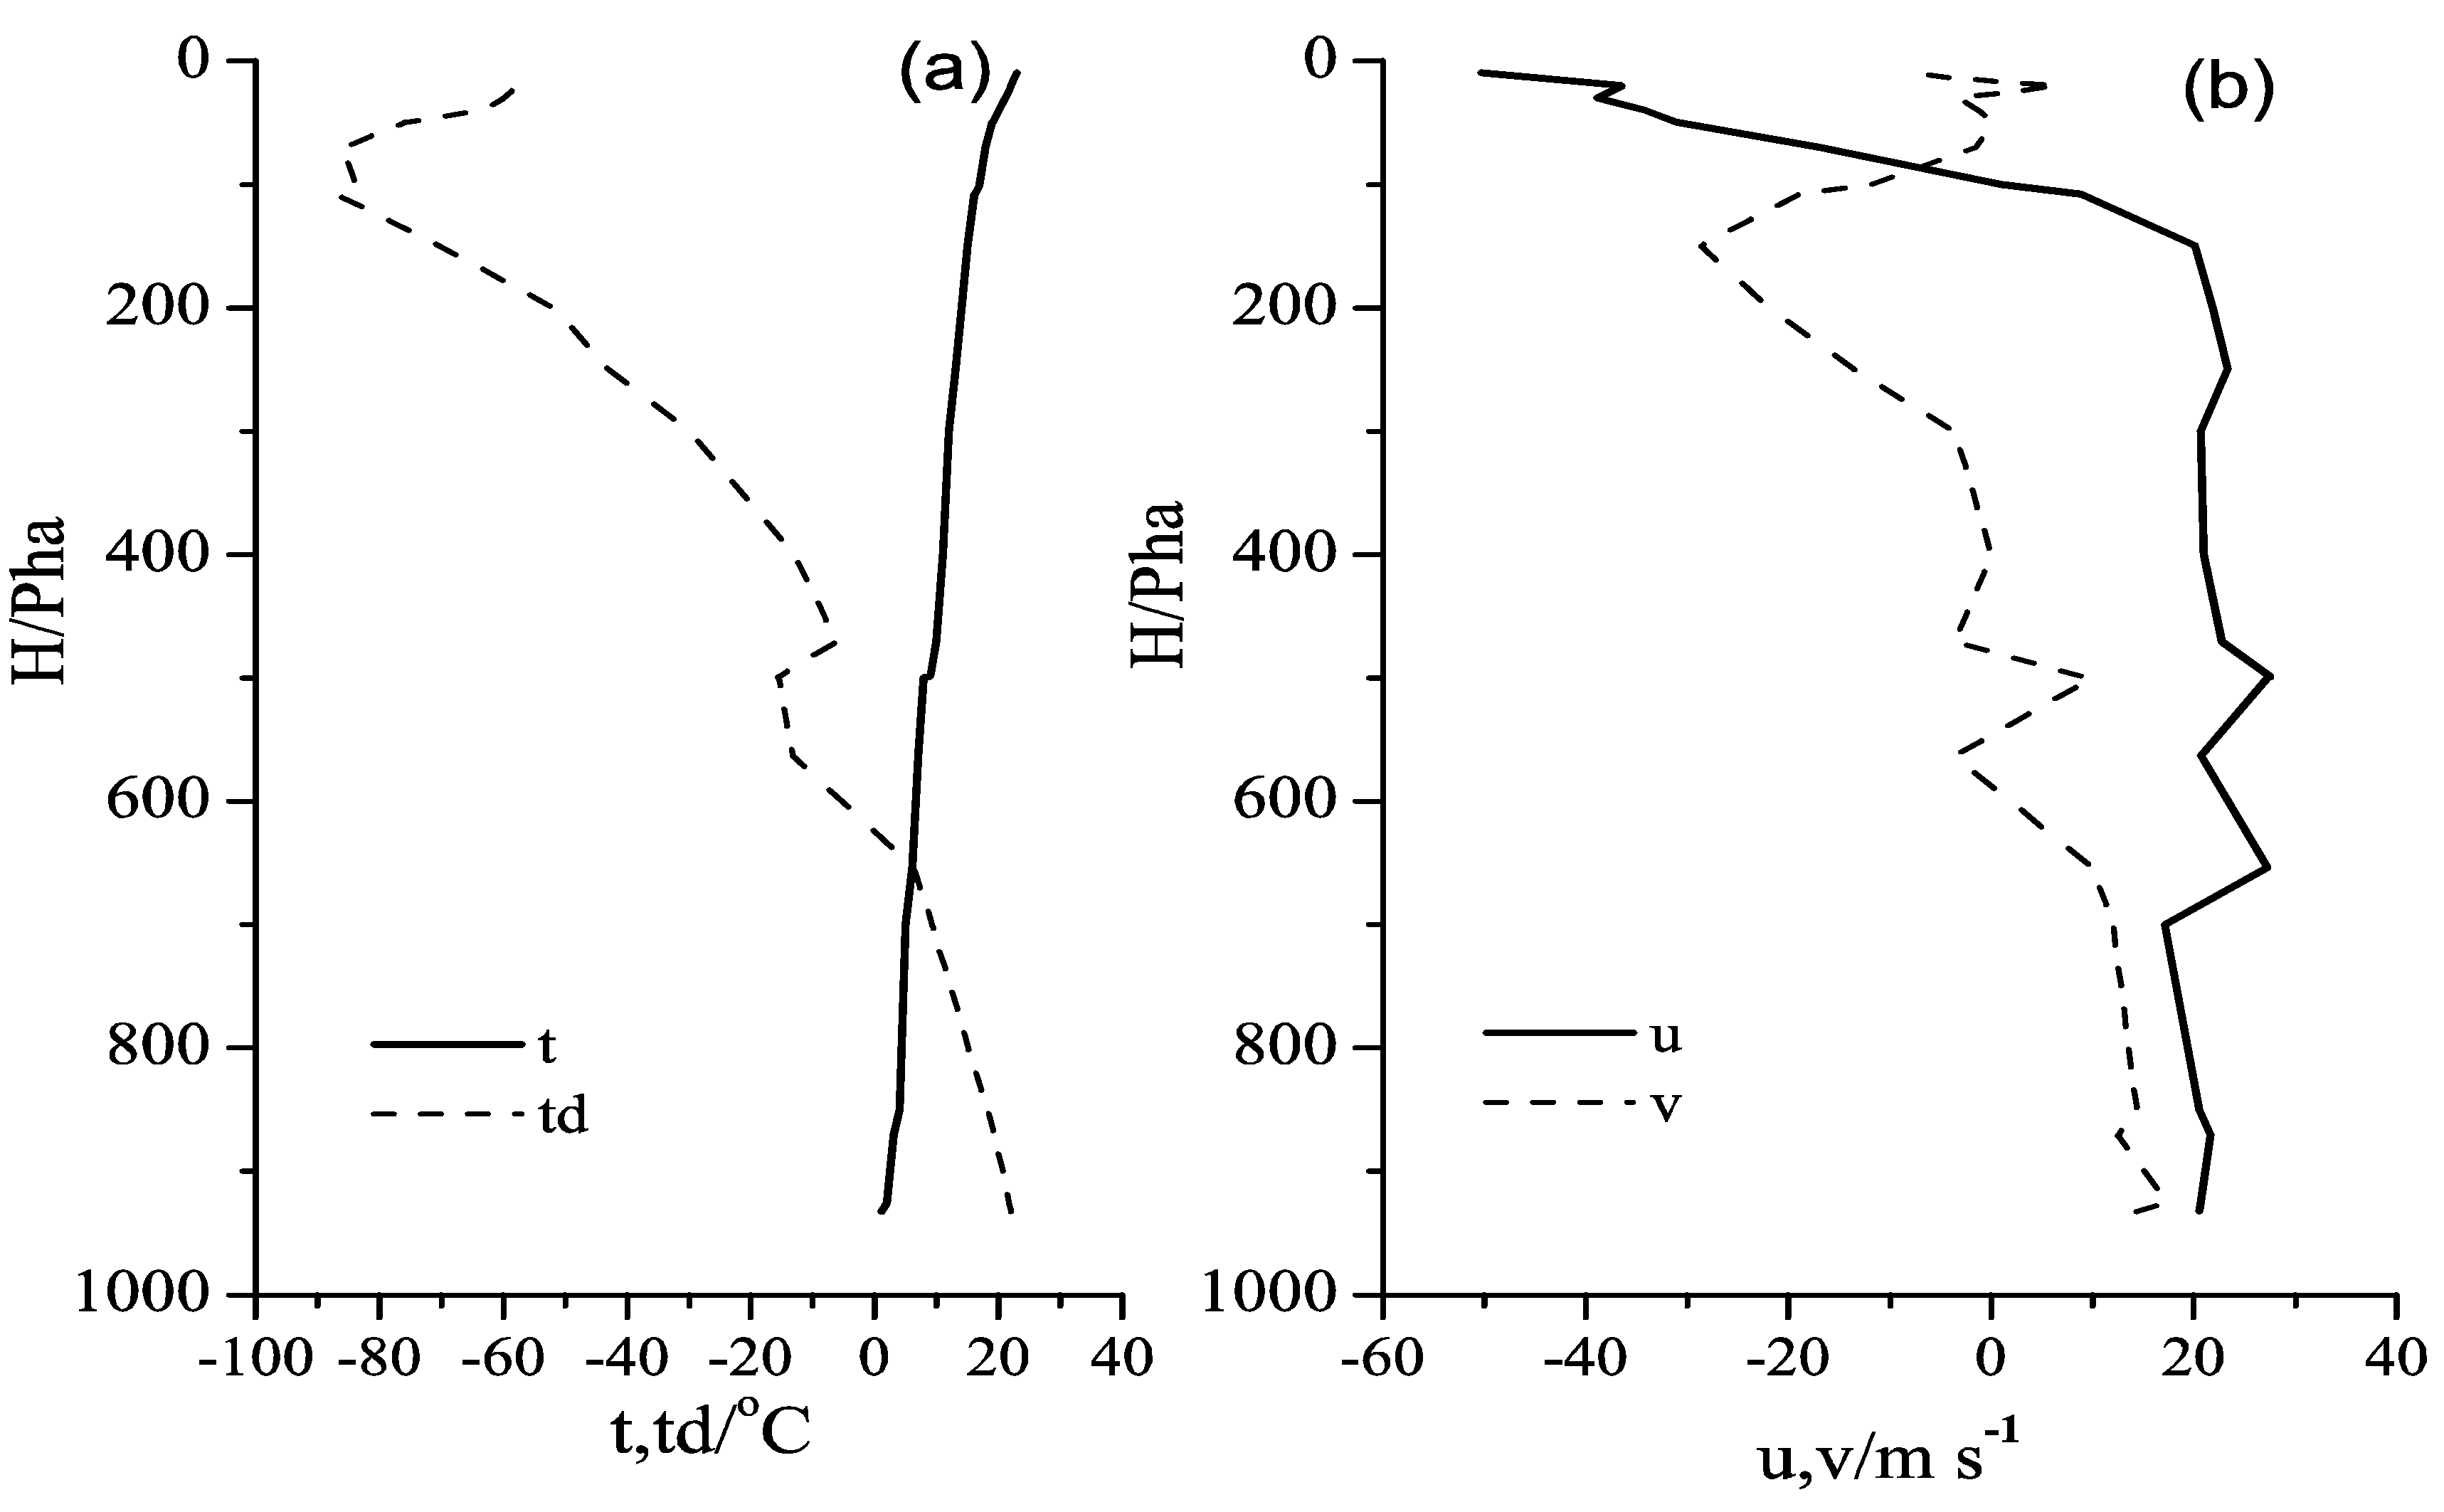
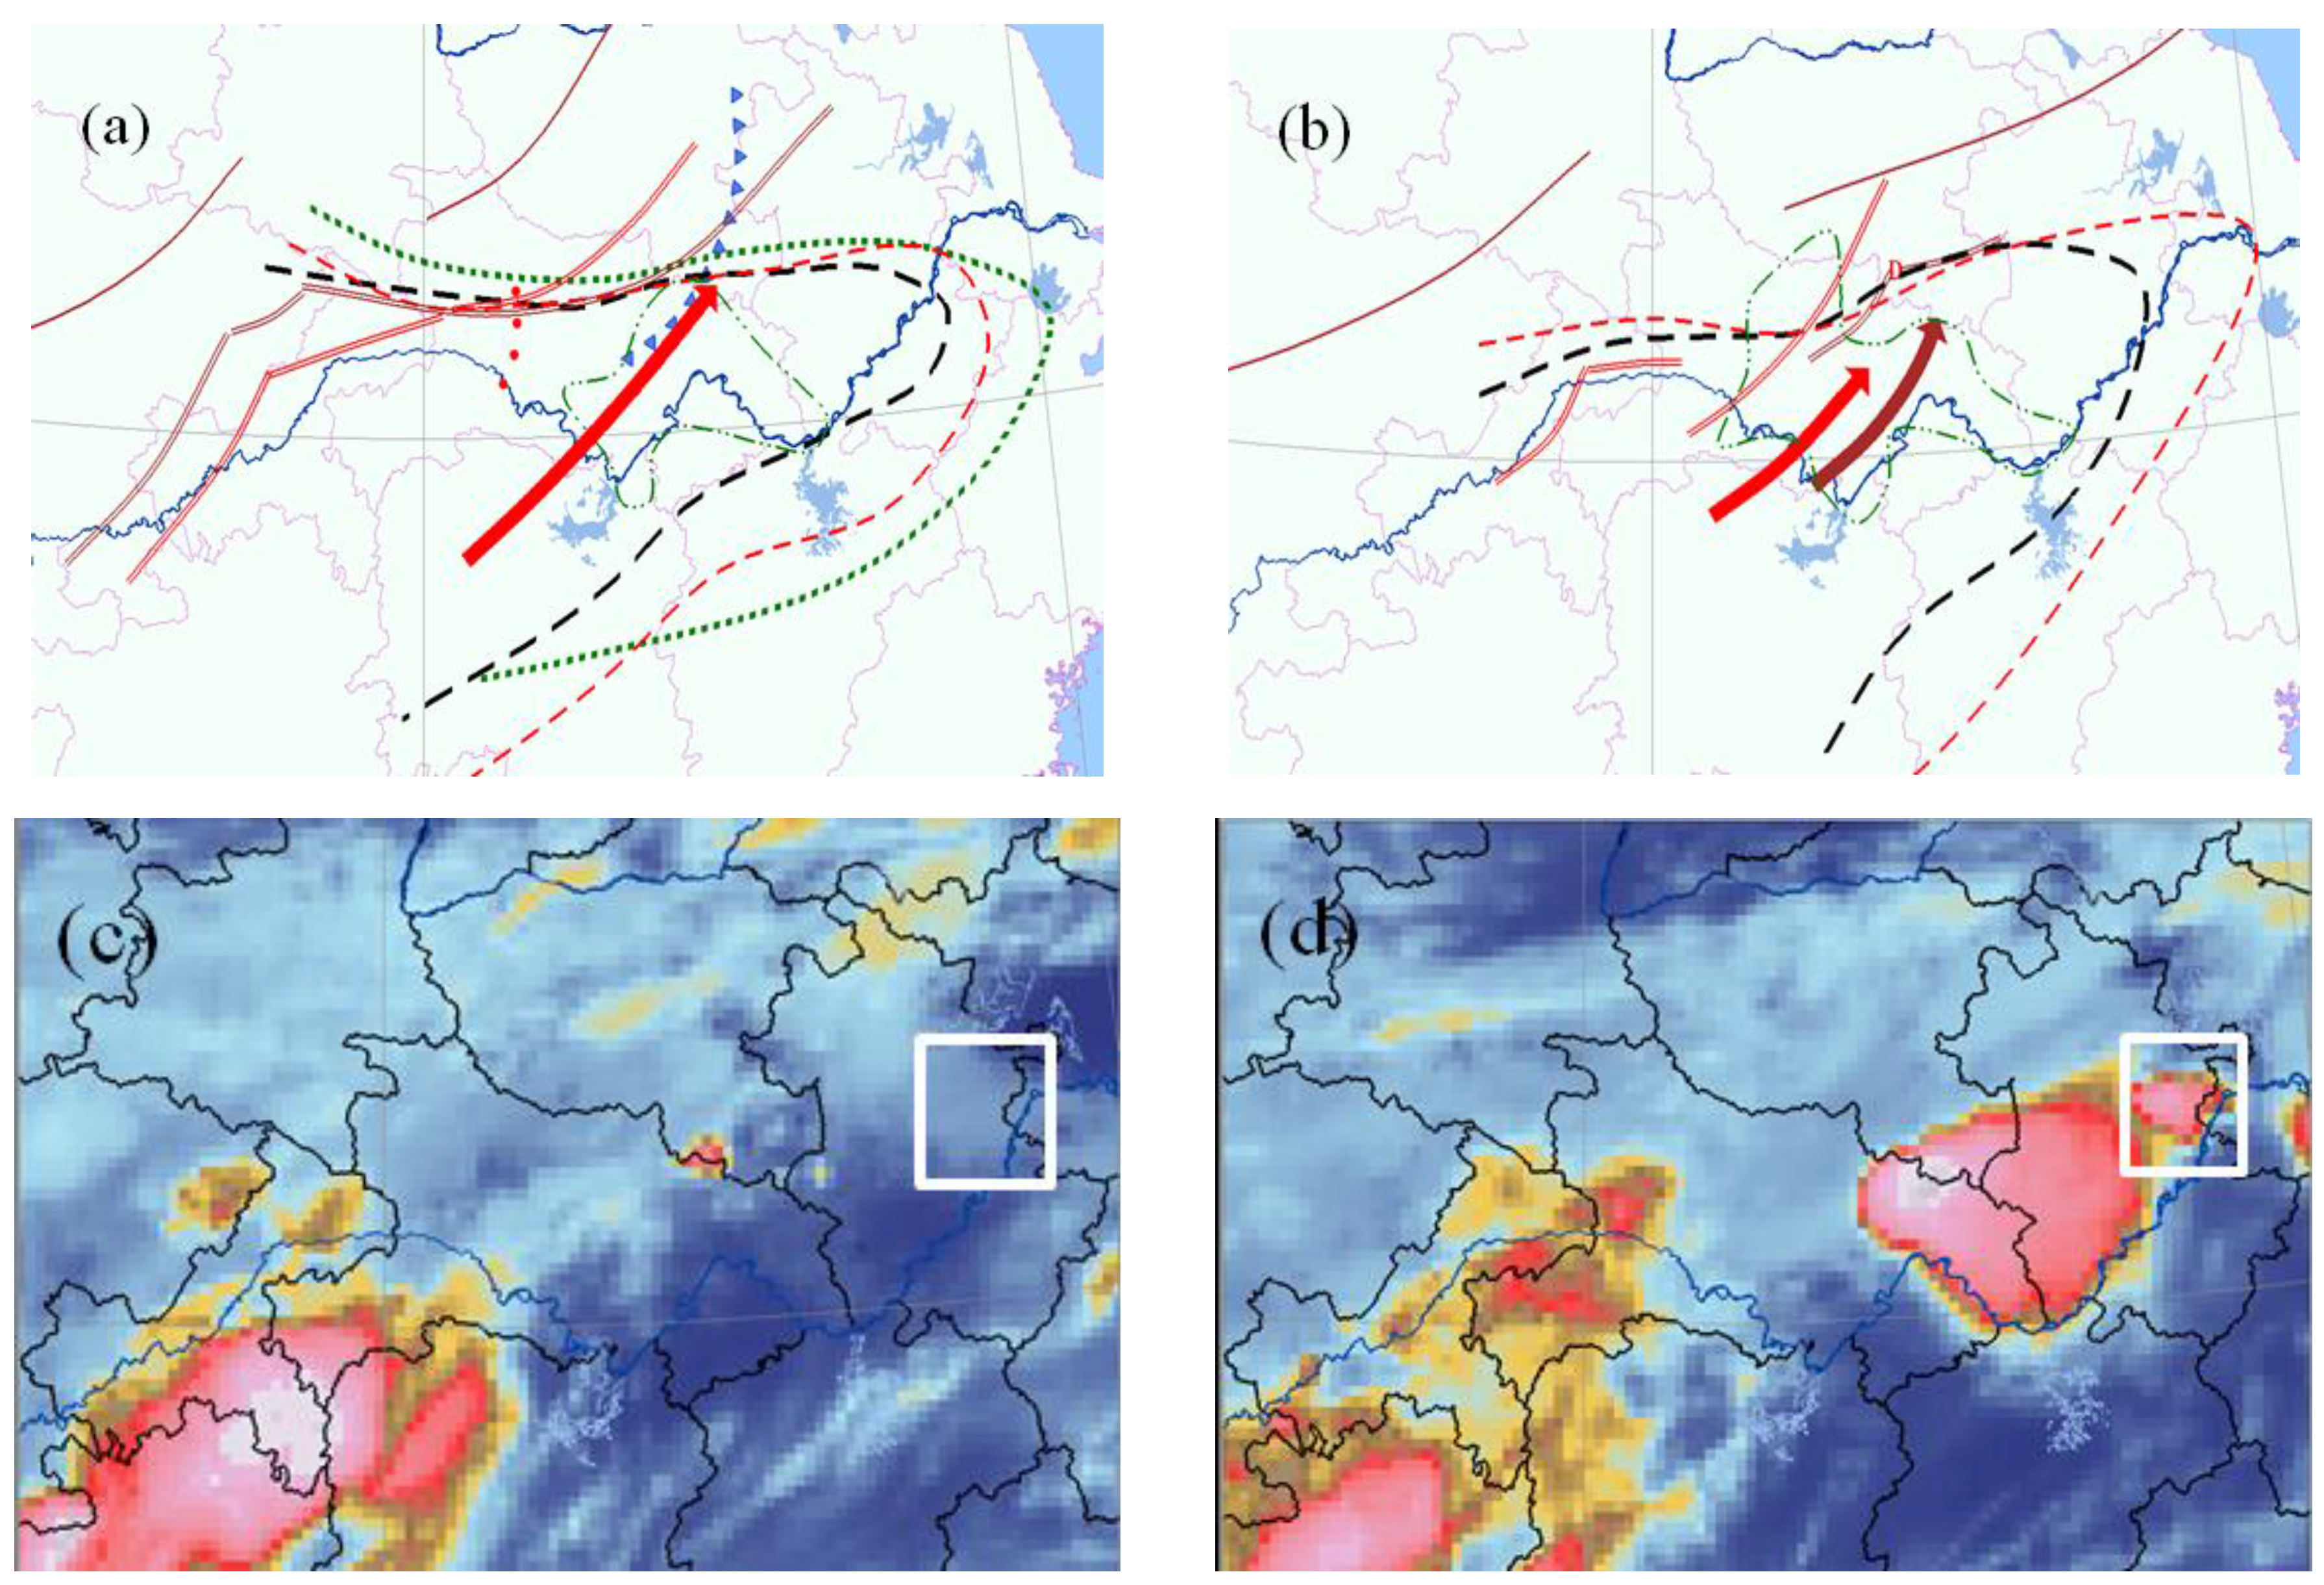
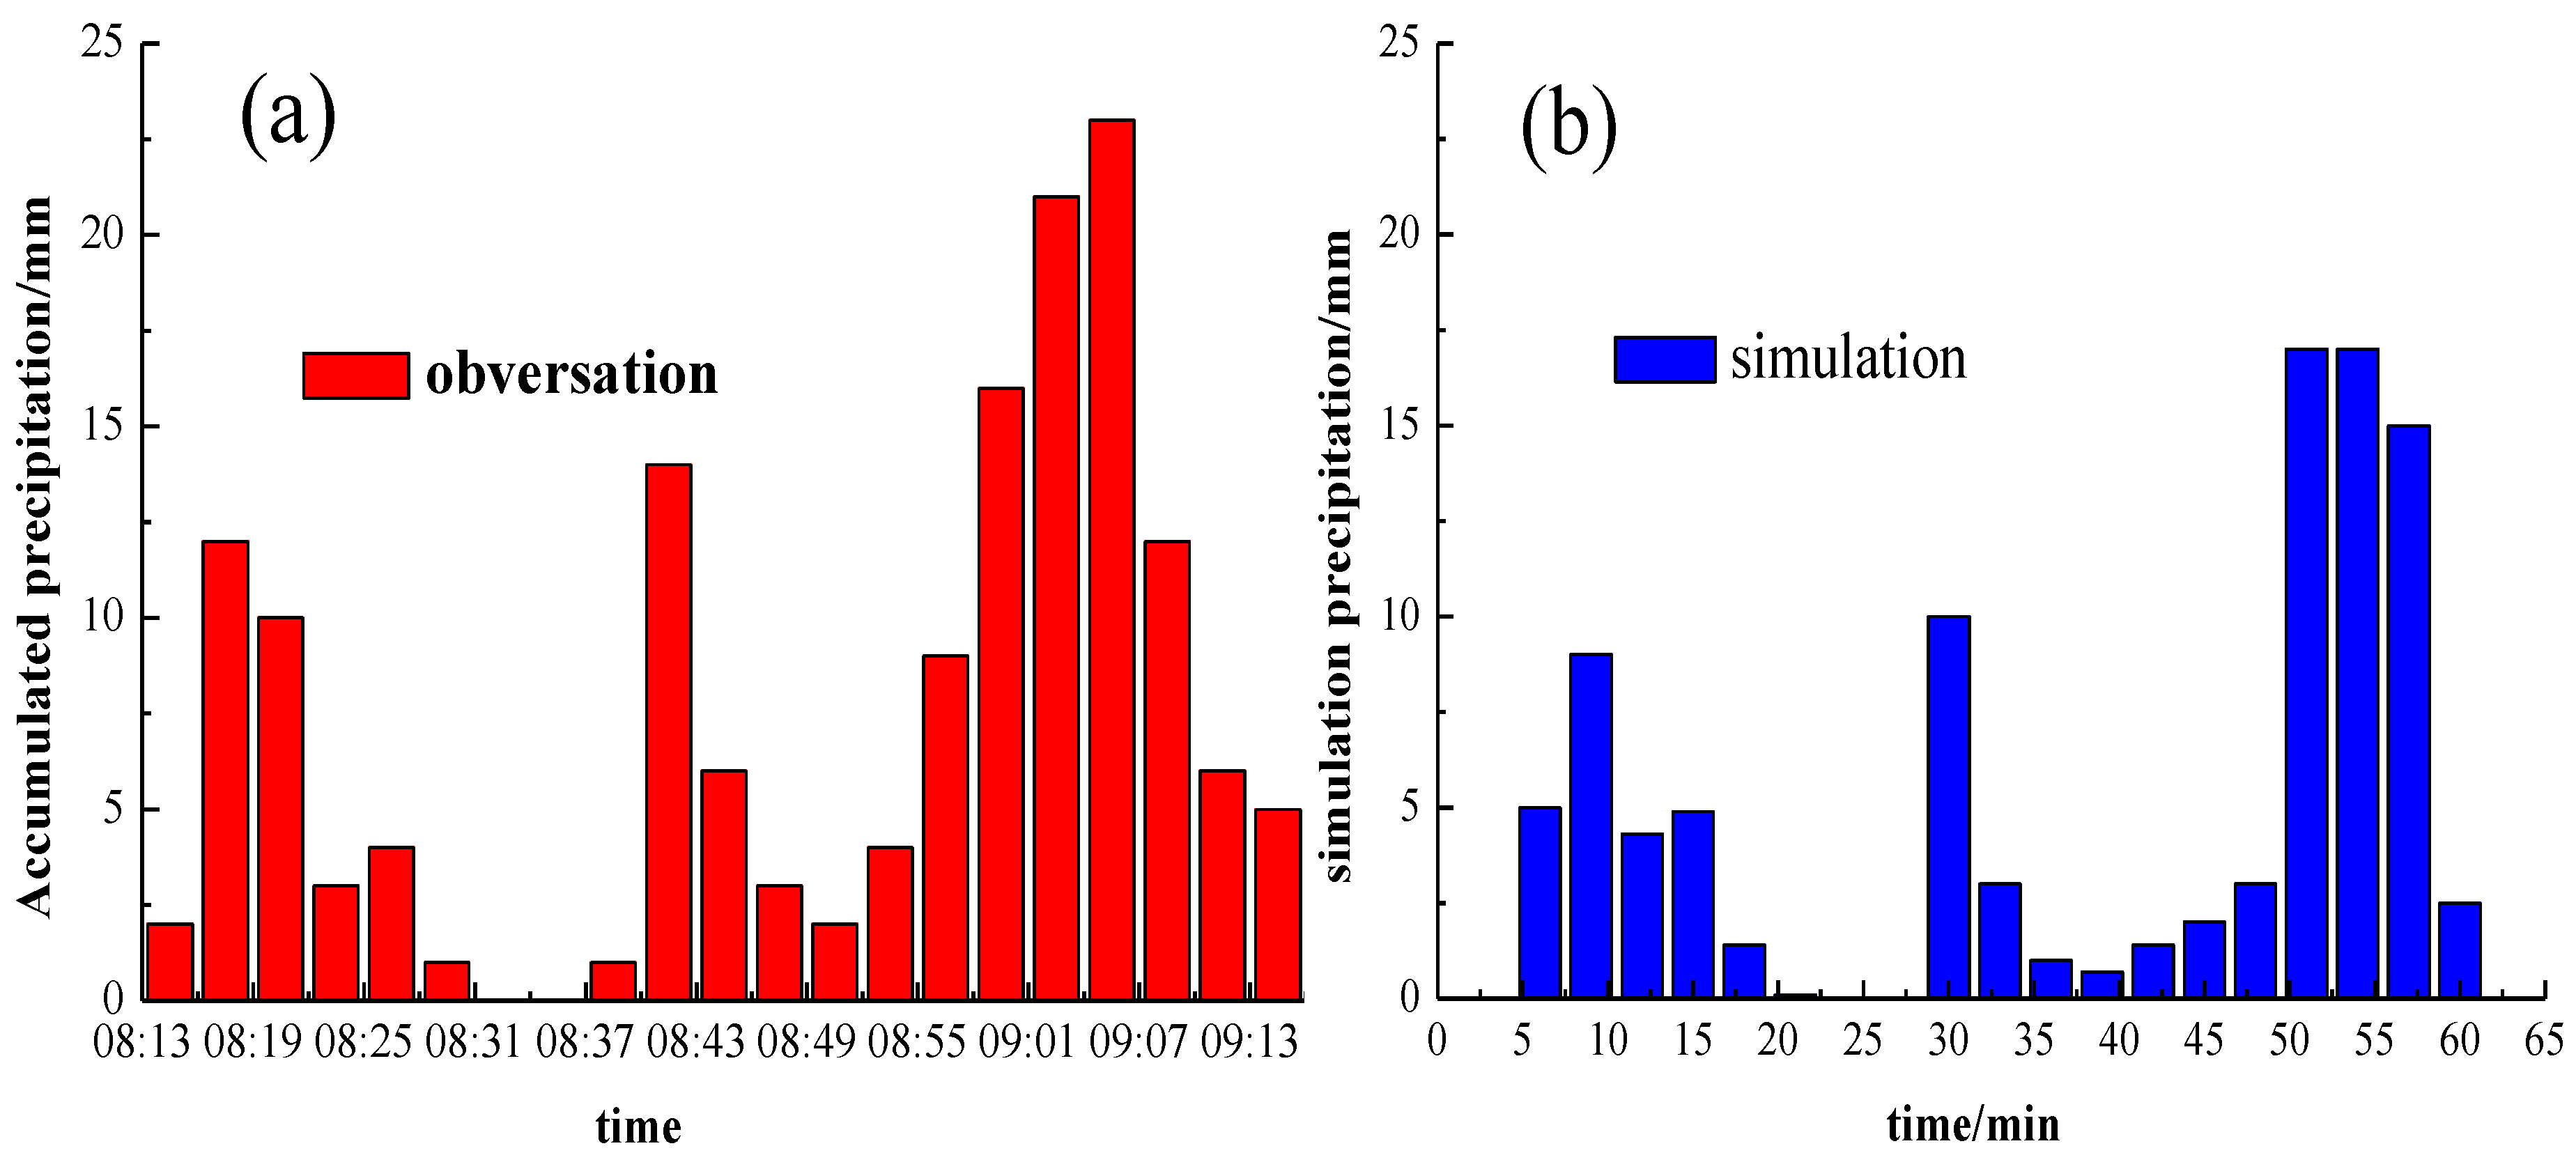
3. Observation and Simulations

The case of 08:00 LST on 12 July 2012 in Wuhan is chosen, wtih the gegoraphical position north latitude 30°37′12″, east longitude 114°07′48″. In Figure 2, shear lines corresponding to 700 and 850 hPa located from the northeast of Hubei Province to the north of the Jianghan Plain at 02:00 on 12 July, and the wind speed was 12 m·s−1 at 850 hPa. The mesoscale analysis shows that northeast of Hubei, a high energy and moist region is located, and the precipitation is mainly concentrated in Hong’an, Da’wu and Guangshui (Figure 2a,b). Based on the analysis of the satellite image characteristics in Figure 2c,d, the results show that the development of cloud cluster correspondences in precipitation area, and the quasi-north–south direction of convective cloud cluster had formed on the influence of shear lines, which enhances the precipitation intensity of Wuhan, and the maximum precipitation was 98 mm/h.
With the development of subtropical high and southweaterly jet, the wind speed of 700 hPa was 14 m·s−1 at 08:00 (Figure 3) and the high-energy region and moist regions were stably located from the Jianghan Plain to the northeast of Hubei Province, which met the conditions of dynamics, vapour and stratification instability required to produce heavy rain. In addition, the peak value of echo strength was 65 dBz in simulated cloud higher than observation in Table 1.
According to sounding calculations, the convective available energy cape (CAPE) value was 2534.6 J·kg−1 and the Showalter index (SI) value was −2.07 (Figure 3). Using precipitation data recorded every minute at an observation station in Wuhan, the process of precipitation during 08:15–09:15 on 12 July 2012 is investigated. The 3-min accumulated precipitation obtained using the model is compared to the observation result (Figure 4). It is found that the maximum rainfall in a 3-min period (17 mm) is close to the value (23 mm) obtained from observation, and there is no precipitation from 08:31 (23 min) to 08:37 (29 min) in either the observation or simulation. The three-dimensional numerical model has an ability to simulate the heaviest rainfall in the case of severe convective precipitation. To reduce the memory required in computation, the simulation domain moves with the centroid motion of the cloud in the model. Therefore, the precipitation accumulated over 3 min does not exactly match a fixed-point observation.

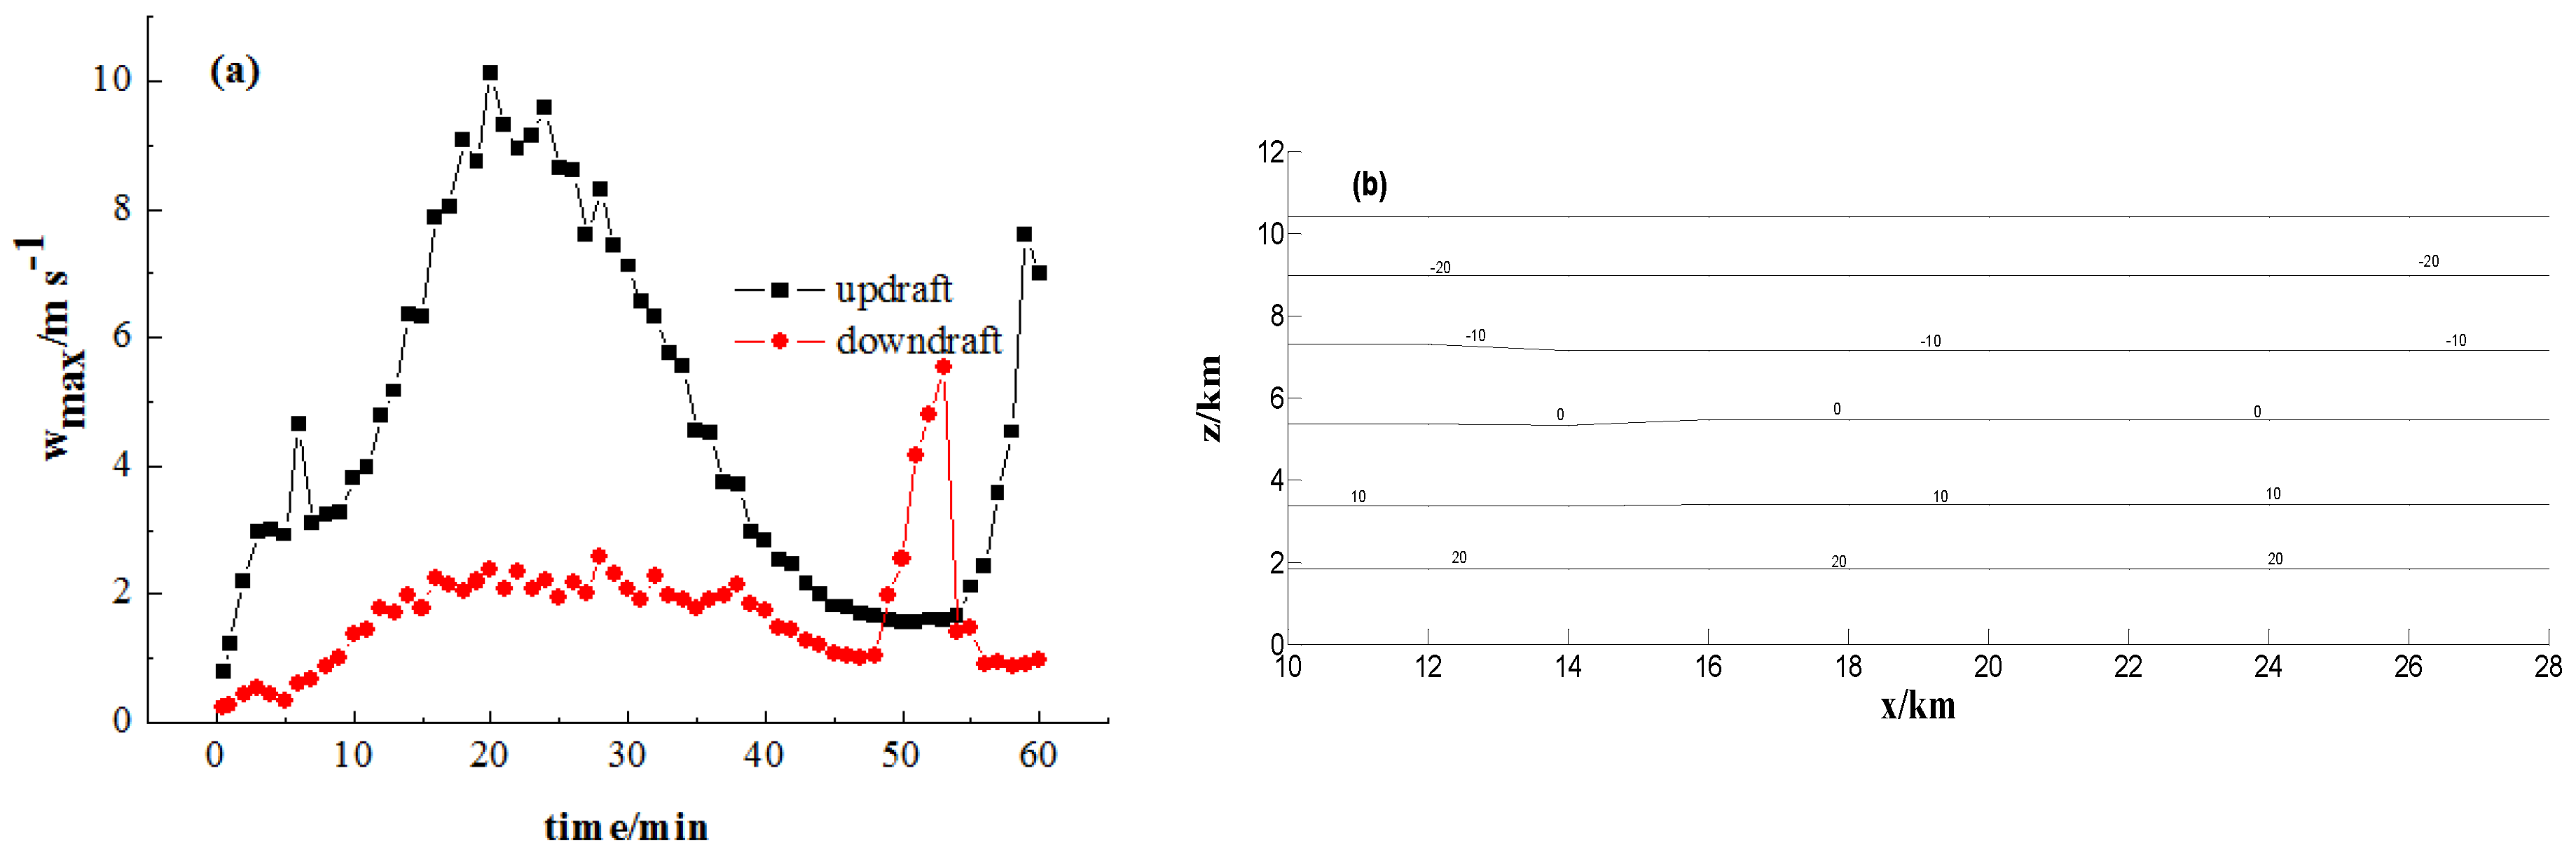
4. Results and Discussion

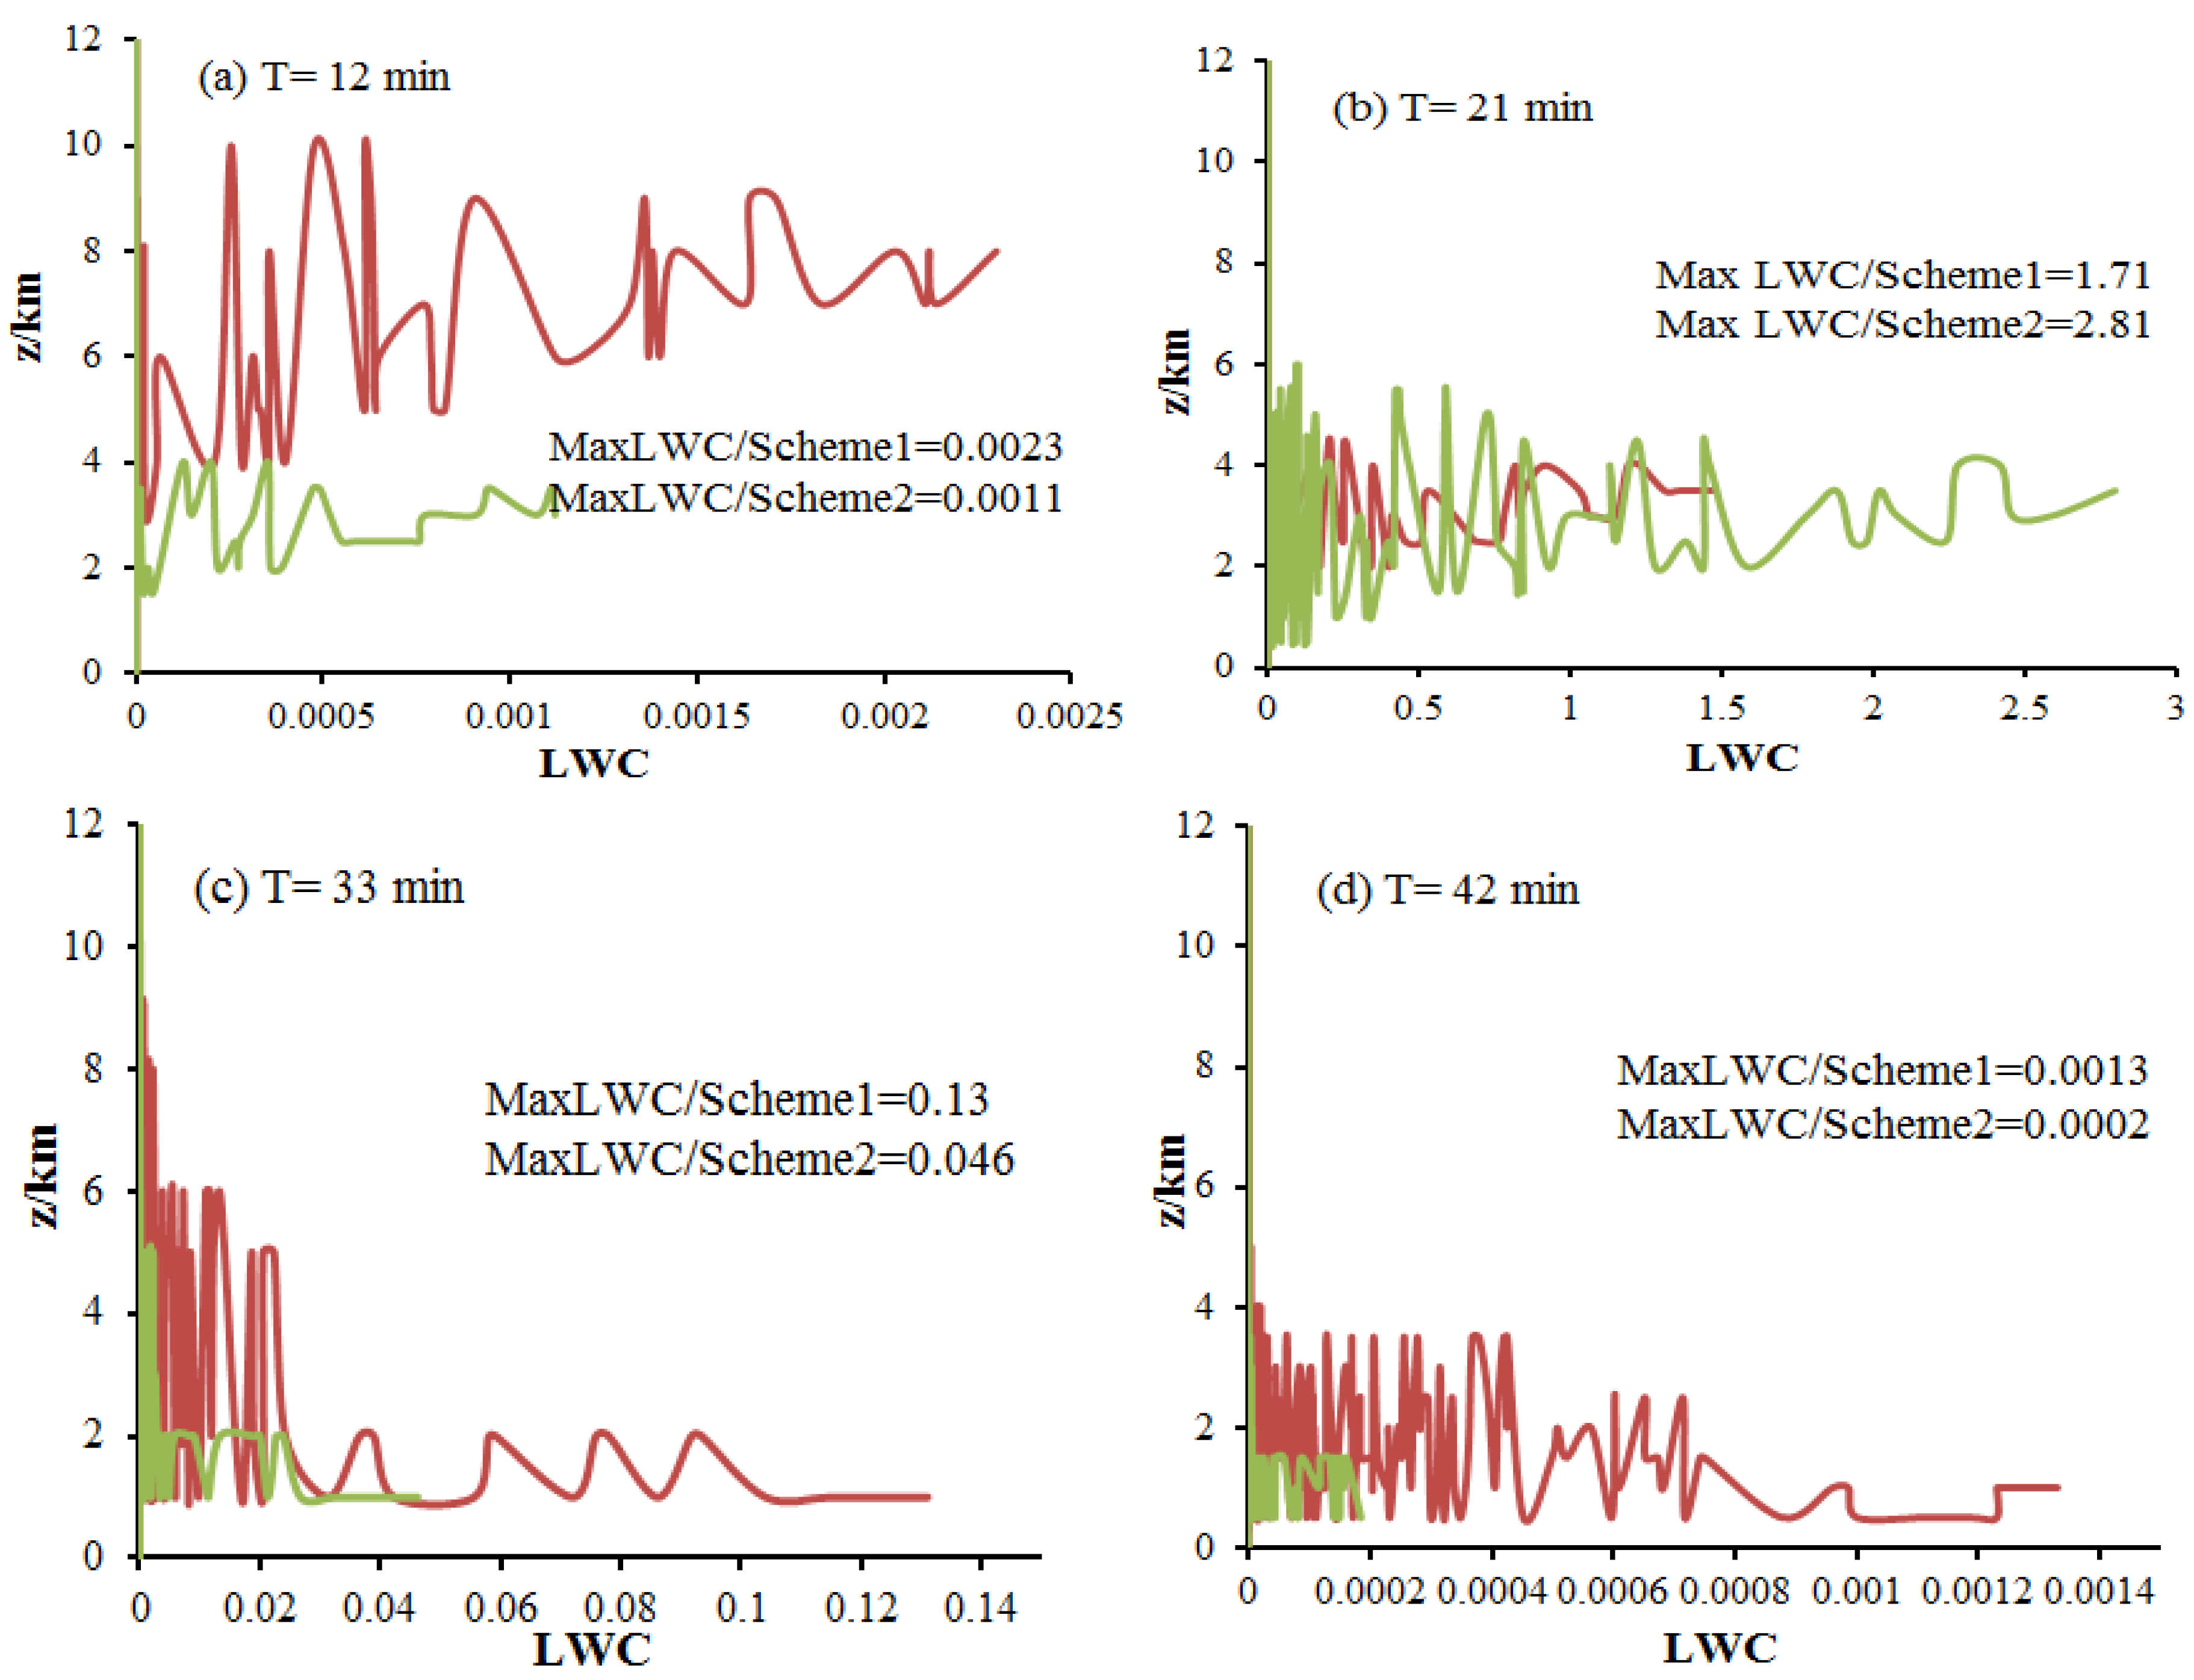
4.1. Distribution of the LWC

Since the liquid water content (LWC) has a great effect on raindrops formation, a warm-cloud parameterization (Section 1) is used to study the spatial distribution of the LWC and Section 2 includes both warm-cloud and ice-phase processes.
As can been seen in Figure 5, the liquid water content (LWC) of Section 1 is mainly concentrated at z = 3.8 km~10 km in the early precipitation, the LWC of warm cloud (Section 1) is always higher than mixed cloud (Section 2), and the LWC of Section 2 is mainly concentrated at the lower region of cloud in precipitation. This is principally because more graupel particles have appeared in cloud, and the mixing ratio of graupel has reached a peak value at 21 min (Table 2). With the development of precipitation, ice crystals, raindrops and snow particles appear continuously; the mixing ratio of graupel and LWC begin to decrease; and a large amount of LWC is consumed by warm and cold cloud microphysical process, which illustrates that the change of LWC has a relation to the distribution of particles and the atmospheric environment is more moist at the lower cloud, which will enhance the formation of rain and the maintenance of precipitation. Thus, the precipitation occurred mainly after 30 min, which is consistent with observations (Figure 4).
Combined with the change of isotherm (Figure 6b), the vertical distribution of LWC mainly concentrates at z = 1.5~6 km and correspond to the isotherms of 10 °C~−20 °C, and the cloud droplets and raindrops are frozen into graupel particles at the isotherm of −10 °C, which shows that the variation of LWC plays an important role in the growth of graupel and raindrops. Therefore, it is necessary to understand the growth of LWC in different terms of precipitation.
In general, the evolution of LWC is related to the distribution of graupel particles in convective cloud. To further understand the effects of LWC on precipitation, we will revise the number concentration of cloud droplets and establish reasonable prediction equation, and combine with the variation of cloud saturation to analyze the effects of saturation on LWC.

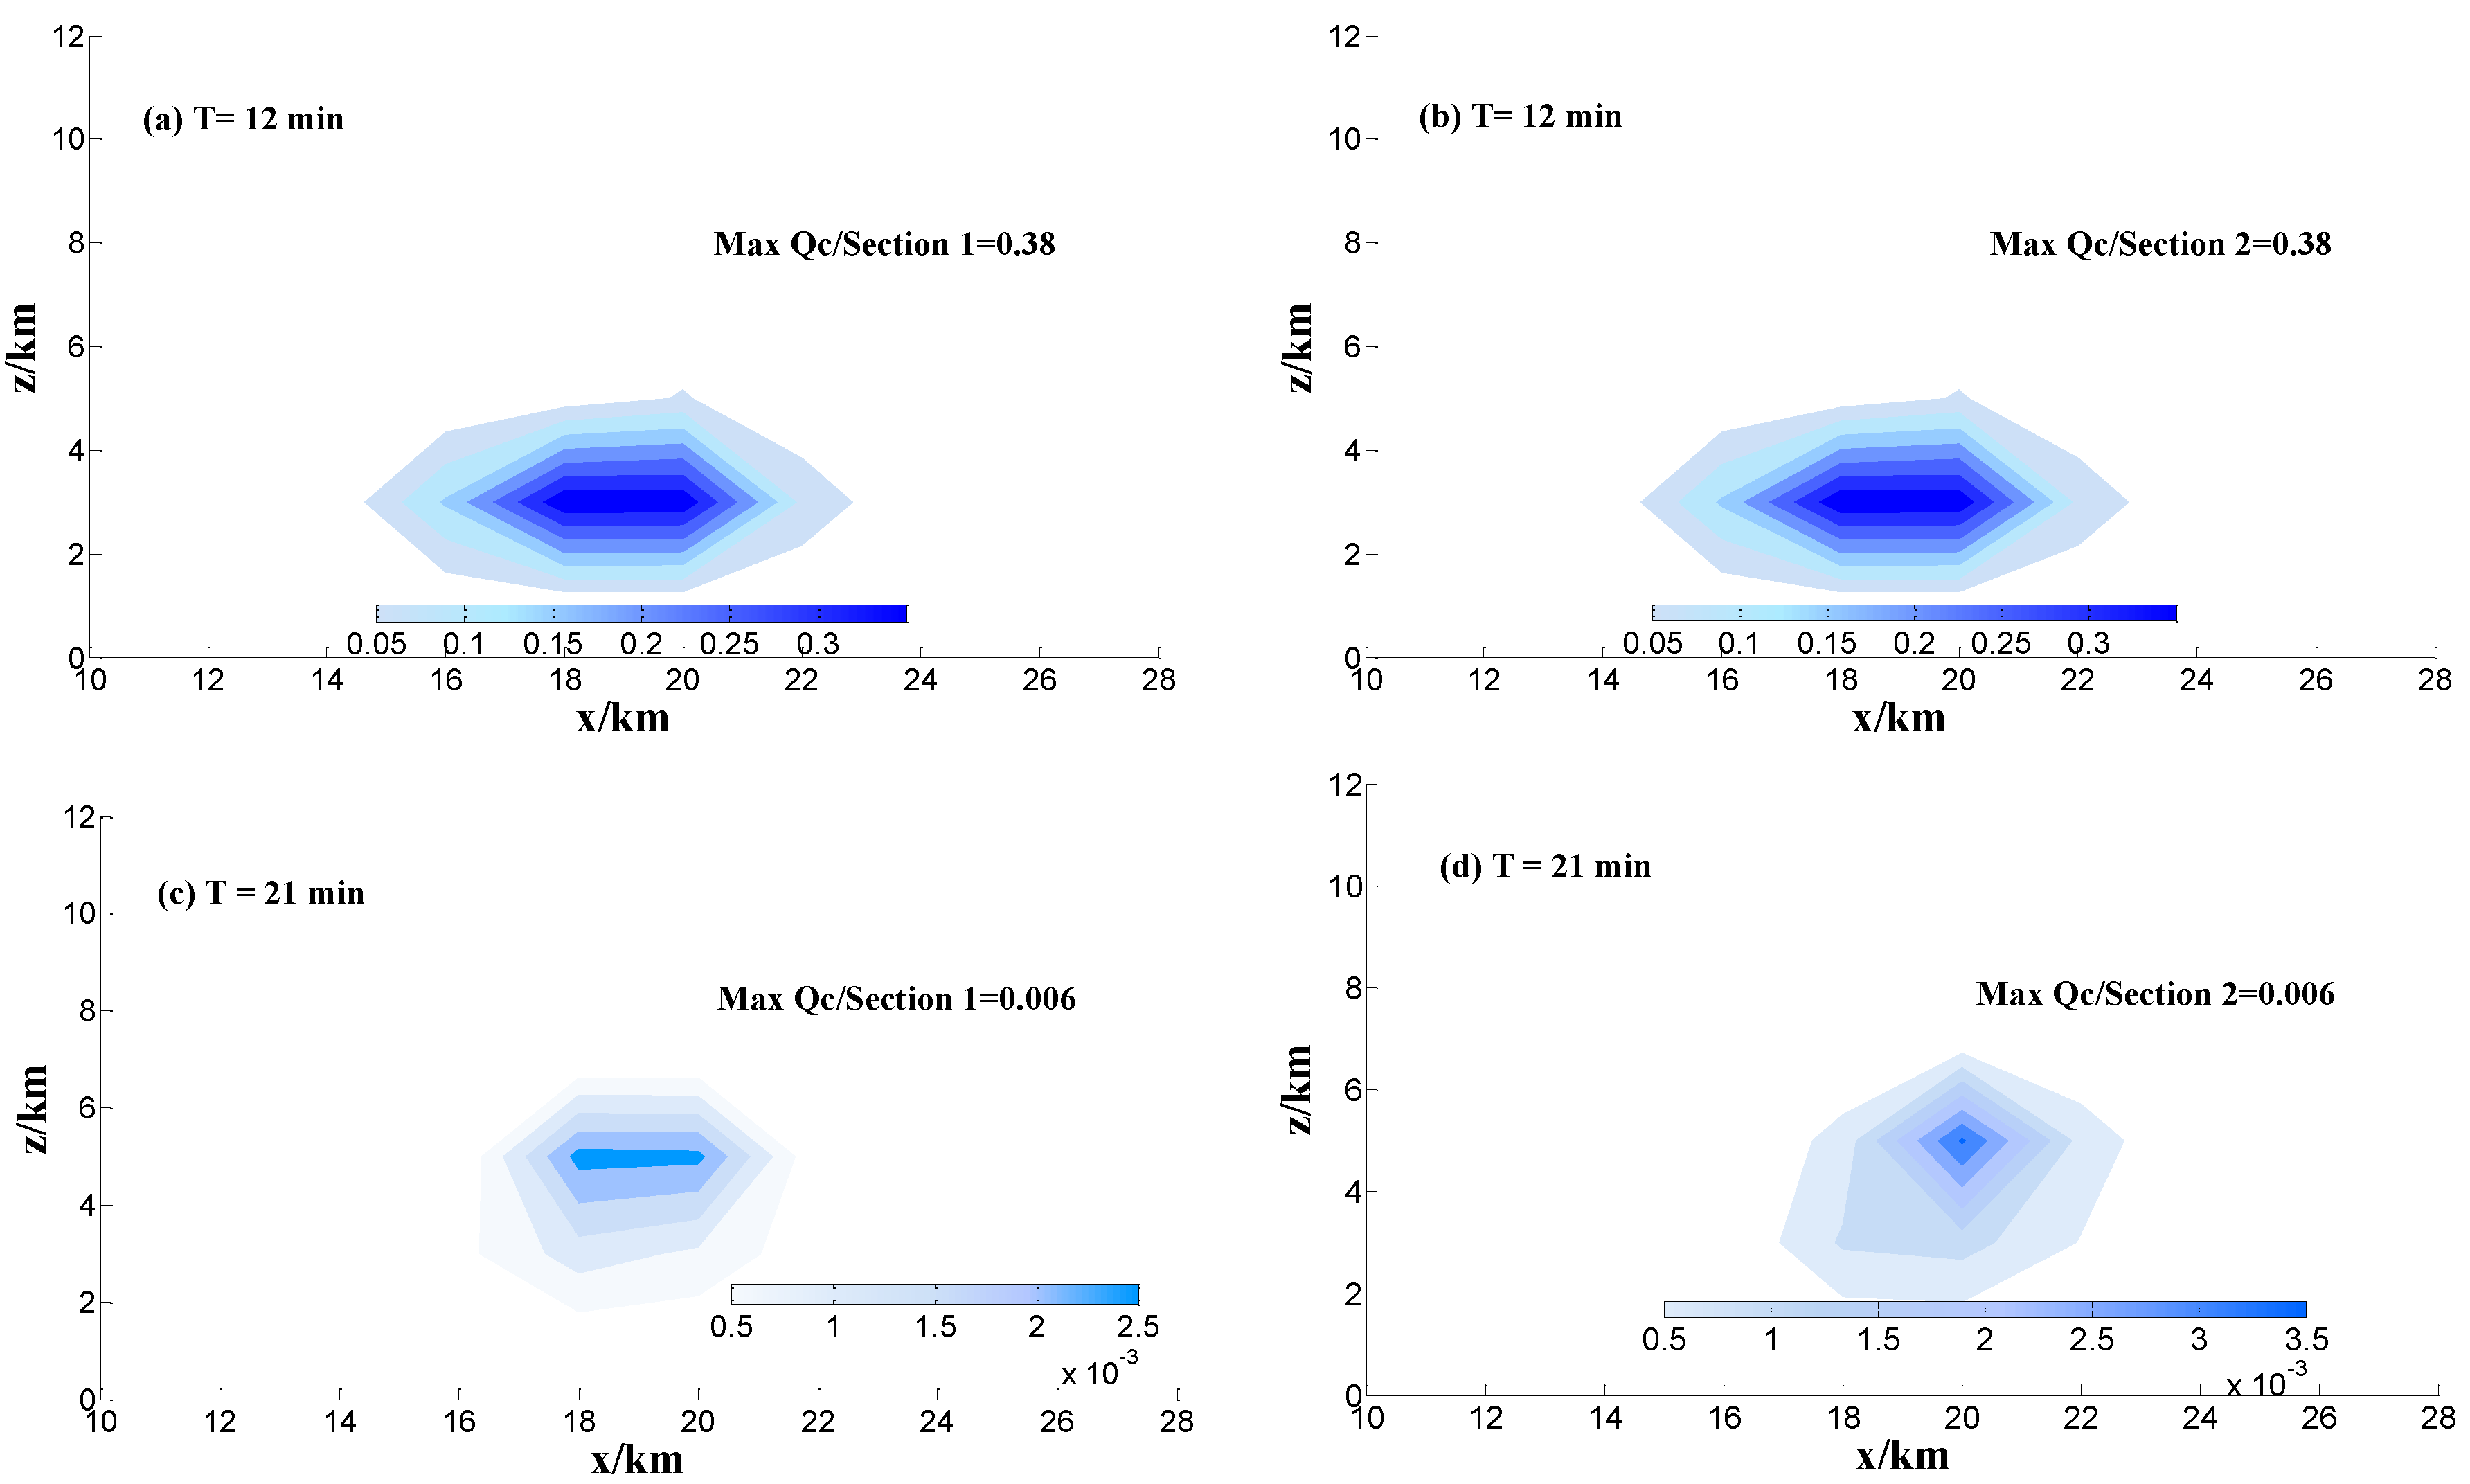
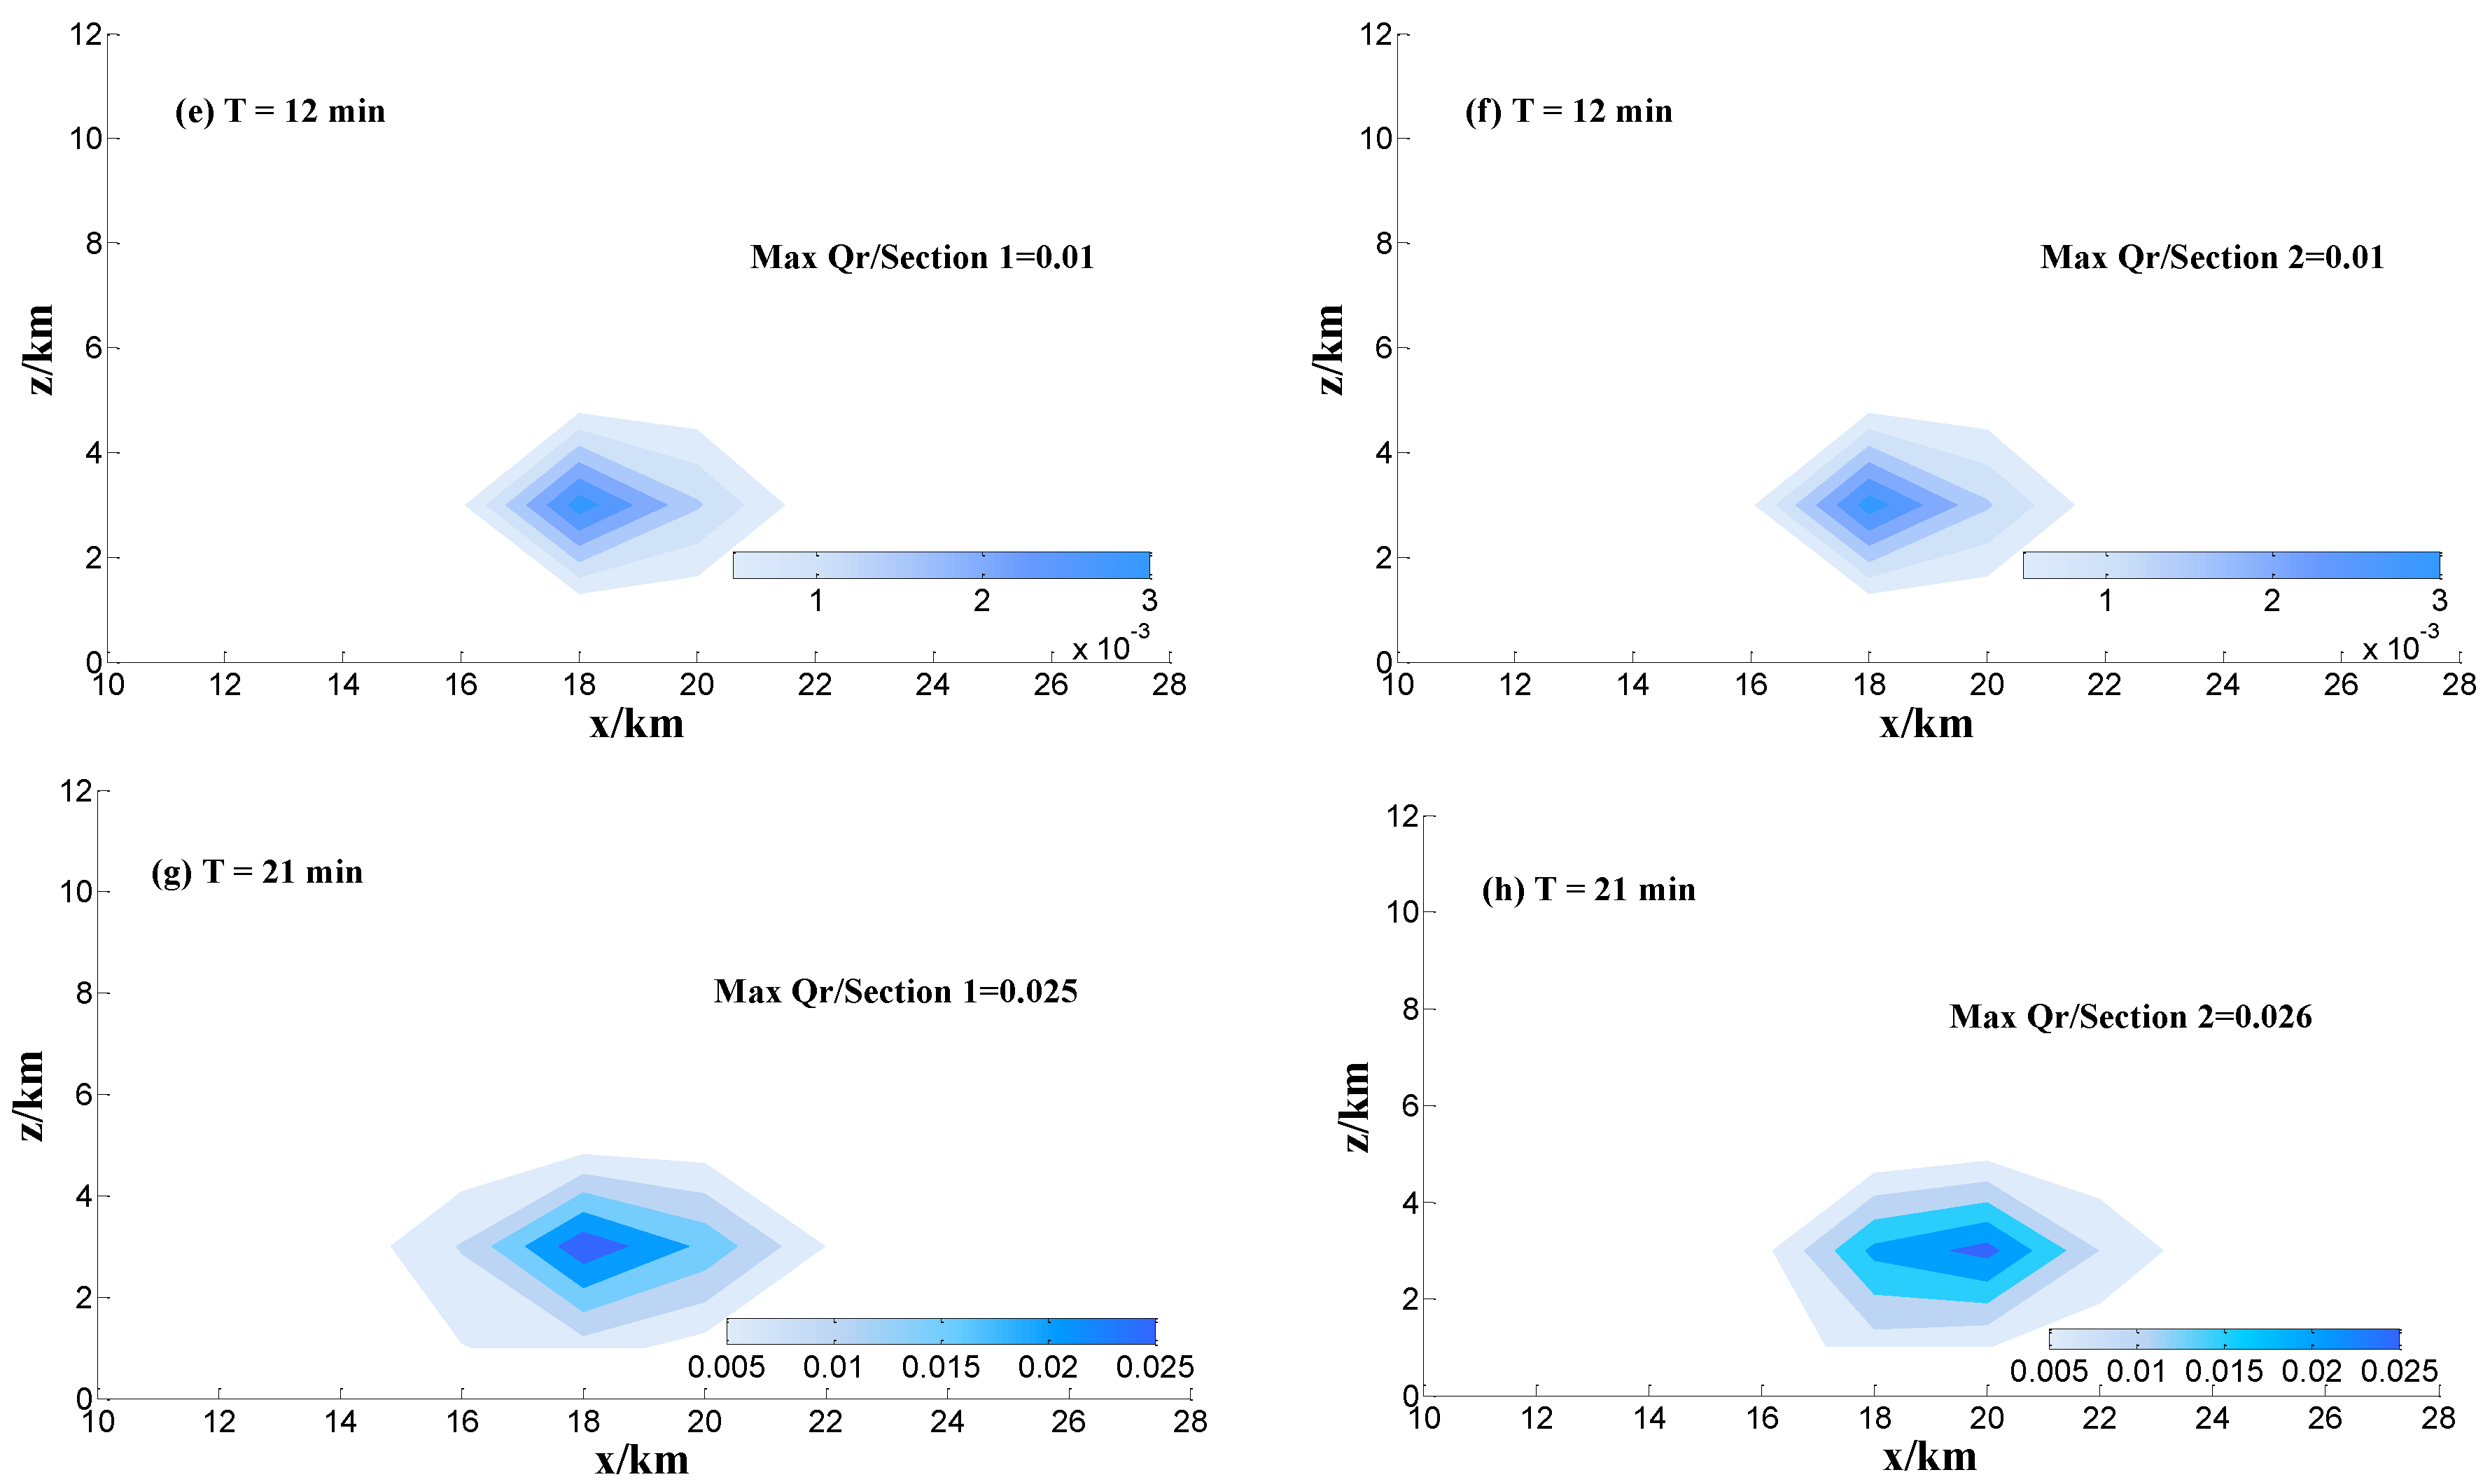
4.2. Distribution of Cloud and Rain Drops

Observations reveal that the process of precipitation does not include the falling of hail, so the processes of hail melting and coalescing are not considered in this study. The distribution of the mean value of the cloud mixing ratio ( Q c ¯ ) and rain mixing ratio ( Q r ¯ ) are listed in Figure 7.
The mixing ratio of cloud droplets and raindrops are listed in Figure 7. The simulation results show that Q c ¯ and Q r ¯ have nearly the same peak value in Sections 1 and 2 at 12 min, because the massive ice particles are unprecedented before 21 min. Then, the center height of cloud droplets and rain mainly locates at z = 3.5 km, which corresponds to the isotherms of 0 °C (Figure 6 and Figure 7). Combined with the change of updraft and downdraft with time, the simulation results show that the updraft velocity has the peak value at 21 min with latent heat release in atmospheric environment. With the development of convection, more cloud droplets and rain drops are transported into the middle of cloud by updraft and the maximum updraft velocity is 10.8 m·s−1 at 21 min (Figure 6a). Although Q c ¯ and Q r ¯ have the same peak value in the Sections 1 and 2, the distribution range in the sections is different. The maximum of Q c ¯ at 21 min is less than 12 min, because rain drops are increased by the auto conversion between cloud droplets and rain drops.
In Table 2, the peak value of cloud droplets appear first and is followed by rain drops, graupel, ice crystals and snow, as in Section 2. The maximum of rain drops ratio (Qr) is 6.6 g·m−3 and appears at the bottom of cloud, the structure of which is similar to a normal convective cloud. In Section 1, the maximum of Qr is less than that in Section 2, with a value of 6.5. Thus, the cold cloud microphysical processes have no great influence on the peak value of Qr.

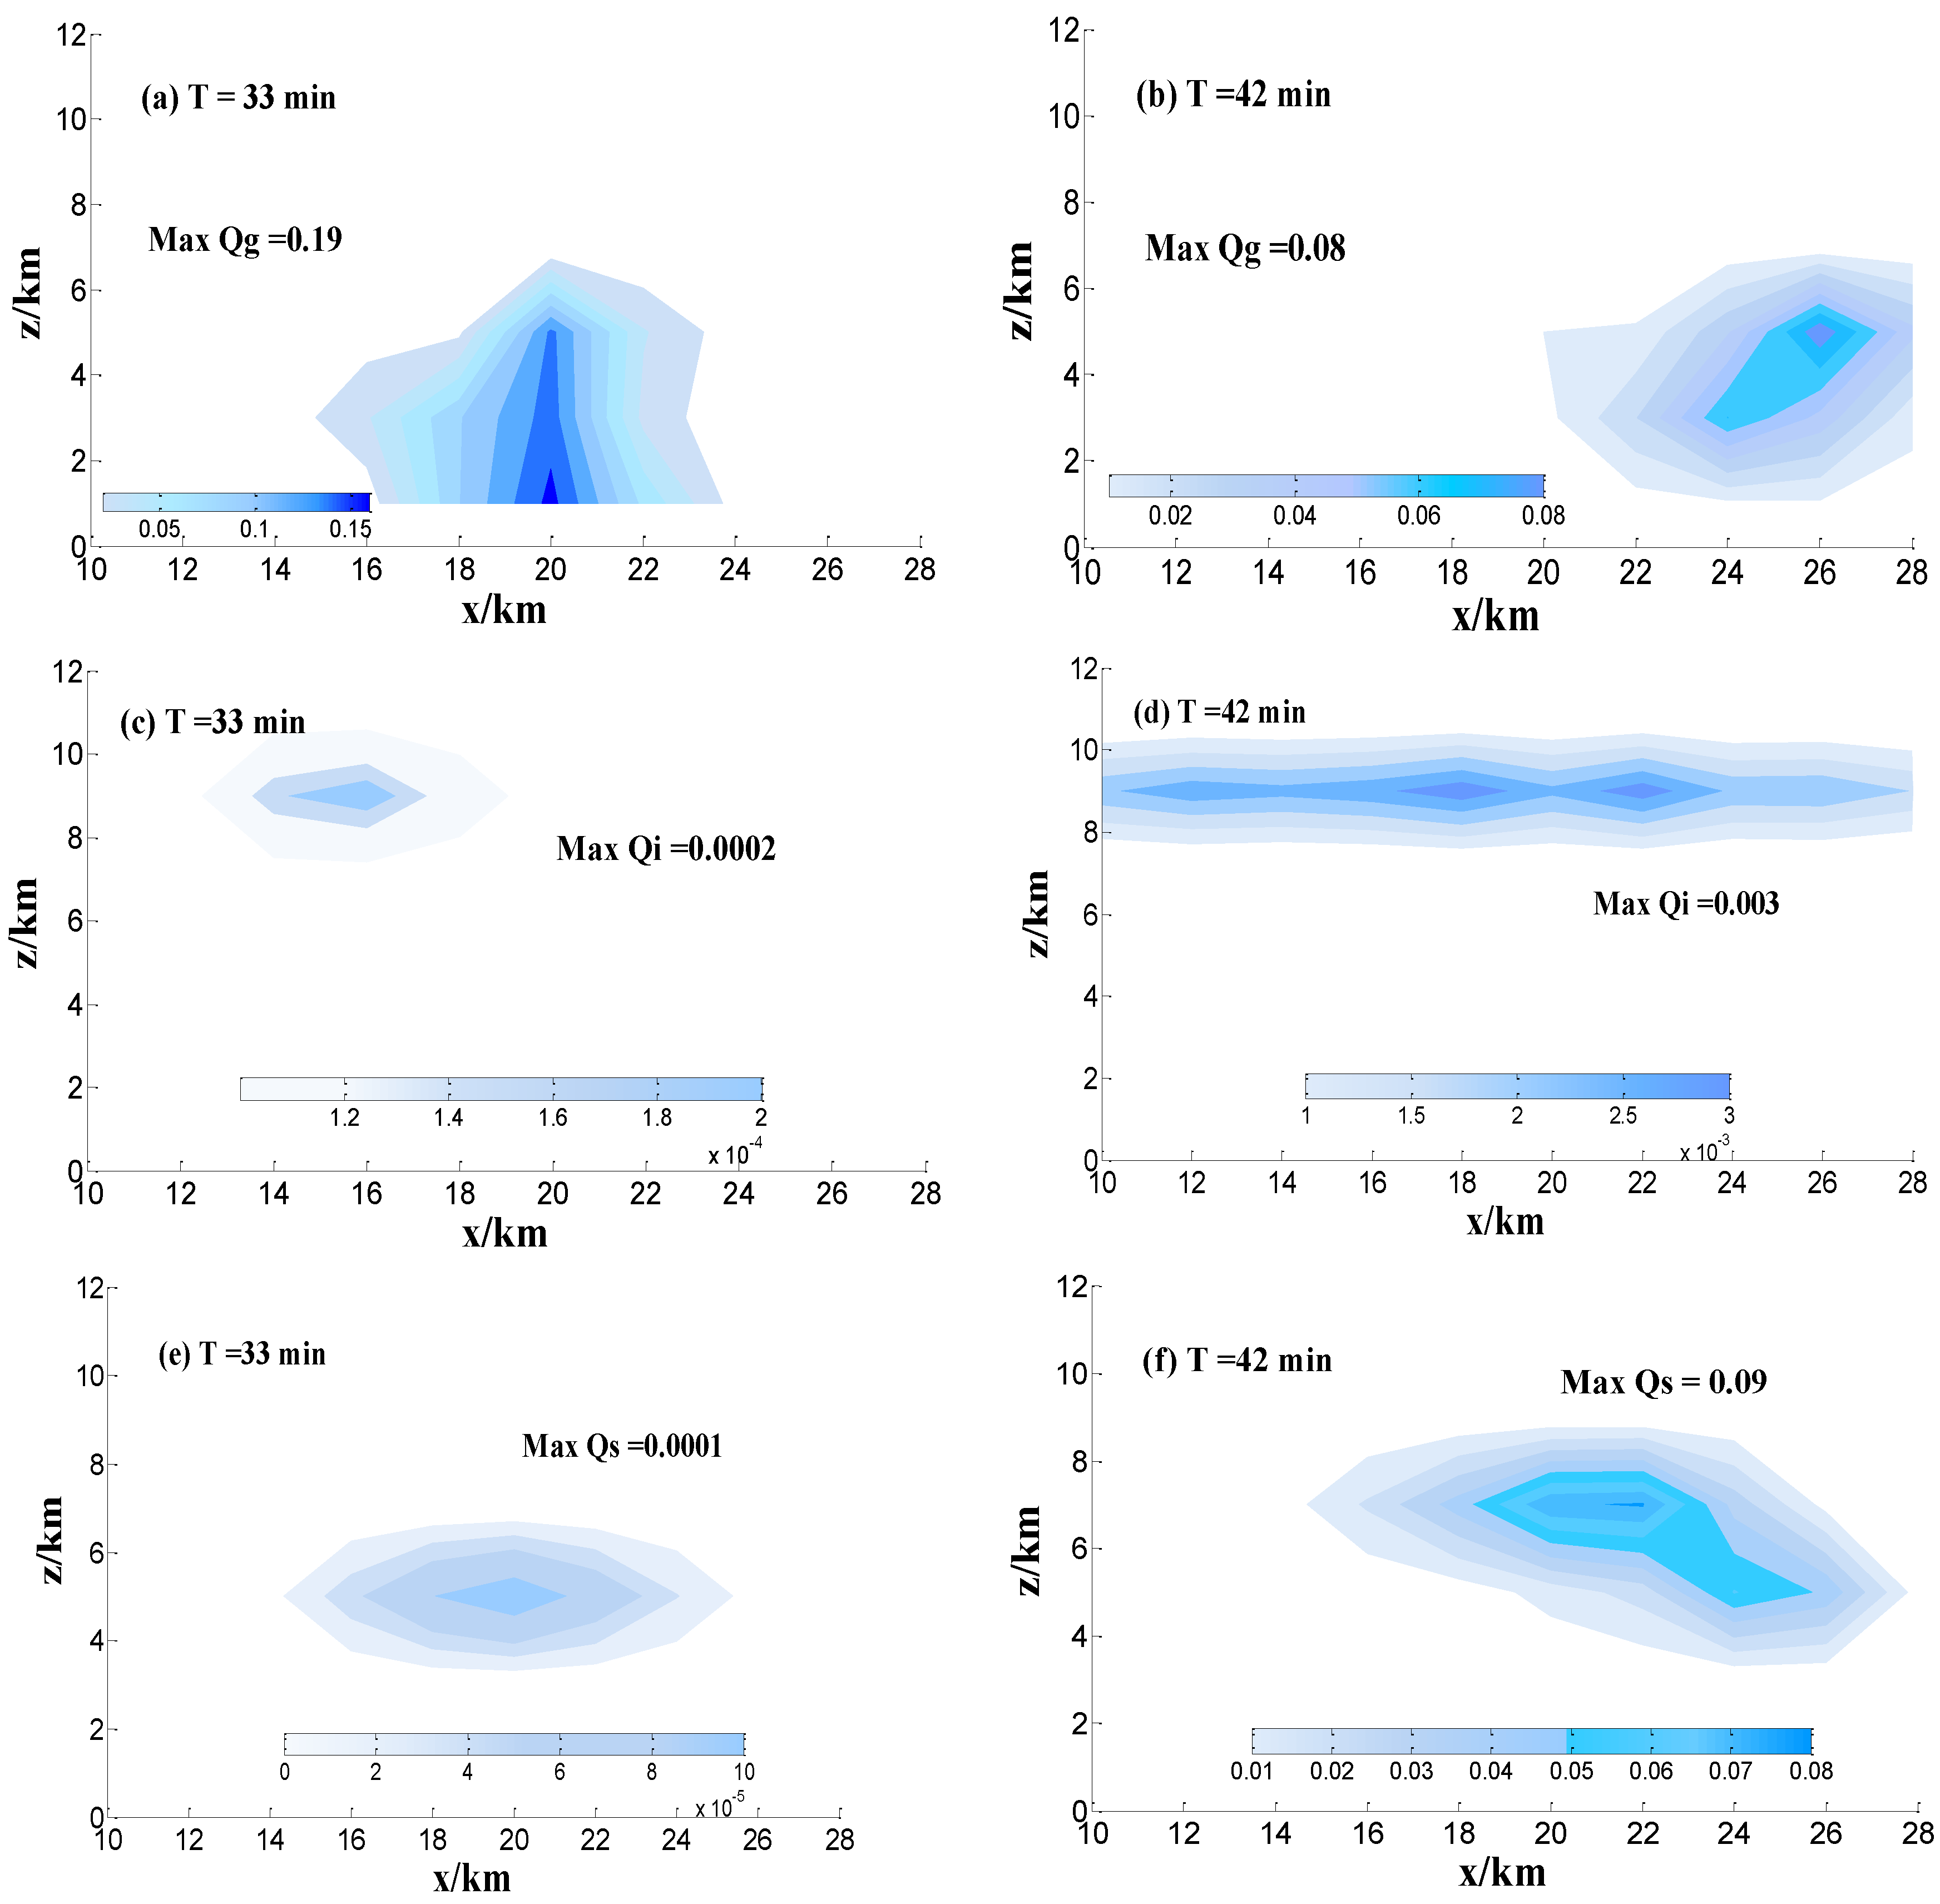
4.3. Distribution of Graupel Particles, Ice Crystals and Snow

Ice crystal and snow particles occurred after 32 min, and the mean value of the graupel mixing ratio ( Q g ¯ ), ice crystal mixing ratio ( Q i ¯ ) and snow mixing ratio ( Q s ¯ ) are described at 33 min and 42 min in Figure 8.
At 33 min, graupel particles mainly reside at z = 2~6.5 km and the maximum of Q g ¯ is 0.19 g·m−3, and the ice crystal particles are primary located in the middle–high cloud by updraft, while snow particles mainly concentrate at z = 3.8~6.5 km. With the development of convective cloud, most of ice crystals generate in the temperature layer of −30 °C at 42 min, and then the distribution range of snow particles expand at the vertical height of z = 3~9 km at 42 min and the peak value of Qs 0.5 g·m−3 at 54 min in the end of precipitation (Table 1). In addition, the maximum of Q g ¯ and Q s ¯ far outweigh Q i ¯ and the concentration area of graupel and snow particles concur with the vertical distribution of LWC at 33 min and 42 min. Combined with the distribution of LWC (Figure 5), the LWC mainly concentrates at z = 1.5~5 km at 33 min; the concentration area of LWC matches the distribution range of graupel (Figure 8a). Then, the mixing ratio of snow particles begin to increase and the maximum of Q s ¯ approximates to Q g ¯ at 42 min, which illustrates that the variation of graupel and snow particles play an important role in maintenance and development of the later precipitation, and the mixing ratio of graupel and snow particles contribute to the variation of LWC.

4.4. Microphysical Processes of Rain and Graupel

Table 3 shows the formation of rain at different times in simulated cloud, and the transformation of microphysical quantities can reveal the formation of precipitation. The simulation results show that the formation of rain depend on the warm cloud microphysical (CNcr and CLcr) in the case, and the amount of rainfall of processes is about 85% of total rainfall by the microphysical processes. In the early and medium stages of precipitation, the collection and coalescence (CLcr) between rain and cloud droplets help to increase the formation of rain, and the contribution of auto conversion is less for the production of rain. However, the auto conversion is mainly a microphysical process in the middle term of precipitation, and the amount of rainfall of ice phase processes (MLgr, MLir and MLsr) are less than warm cloud microphysical processes, which illustrates that the formation of rain is less than that produced from the microphysical process of ice phase, but the ice phase process can enhance the formation of rain, and the process of auto-conversion becomes the main mechanism of the production of raindrops in later precipitation, which is verified by the numerical model. According to the results, one can conclude that the growth of raindrops depends on the microphysical processes of cloud droplet auto conversion and melting of graupel particles.
The mixing ratio of graupel particles is larger than other particles. What are the main processes that produce graupel particles? As can be seen in Table 4, the formation of graupel particles mainly depend on nucleation and propagation between rain and graupel particles (NUrg) in early precipitation, and these processes account for about 77% of the total formation of graupel, while the process of collection and coalescence between cloud droplets and graupel (CLcg) is second. It can be seen that the graupel particles contribute the most to the melting of ice-phase particles, which is consistent with Xiao et al. [21]. Later, the process of NUrg and collection and coalescence between rain and graupel (CLrg) are the main reason for the formation of graupel in later precipitation.

5. Conclusions

A heavy rainfall event that occurred in Wuhan, China on 12 July 2012 was simulated using a three-dimensional numerical model of a convective rainstorm. Using the microphysical parameterization of cold and warm clouds, we investigate the effects of cloud microphysical processes on the formation of precipitation and the modeling results are close to observations. The comparisons of simulation results and observations indicate that the three-dimensional numerical model of a convective rainstorm is able to simulate severe convective precipitation. The main results of our study are listed below.
The simulations suggest that ice phase microphysical processes have a vital catalytic role in the development of convective cloud precipitation, and there are some effects of ice phase microphysical processes on updraft velocity, the peak value of rain and the LWC. Especially, the ice phase microphysical process can increase the development of convective rainfall, enhance the growth of the liquid water content (LWC) and increase the mixing ratio of cloud droplets and rain, which enhances the formation of rain and the maintenance of precipitation.
The microphysical processes of ice phase have a great influence on the distribution of LWC and the occurrence of ice particle can increase the value of LWC. For the vertical structure of LWC, LWC mainly concentrates at the isotherms of 10 °C~ −20 °C and the concentration area of LWC matches the distribution range of graupel; thus, the evolution of LWC is related to the graupel particles in convective cloud.
The simulation results demonstrate that 80 percent of rainfall is corroborated by warm cloud microphysical processes, and 20 percent of rain is produced from cold cloud microphysical processes, which illustrates that precipitation is primarily a warm cloud process, and that ice phase processes significantly increase the range of precipitation. In the mixed-phase convective clouds, the growth of raindrops depends on the microphysical processes of cloud droplet auto-conversion (CNcr), collection and coalescence between cloud droplets and rain (CLcr), and the melting of graupel particles (MLgr). However, an increase in graupel particle content depend on the microphysical processes of nucleation and Propagation between rain and graupel particles (NUrg) and collection and coalescence between cloud droplets and graupel (CLcg), in which NUrg is the major source of graupel particles and these processes account for 77% of graupel particles.
In addition, these results also indicate that each particles feature and microphysical process can provide a different perspective in selecting the microphysical parameterization. Therefore, this study will contribute to understanding the formation of convective cloud precipitation and improve the precipitation forecast of models by a systematic analysis of these results.

Acknowledgments

This work is supported by the National Natural Science Foundation of China (41375041), open youth fund of the Institute of Heavy Rain, China Meteorological Administration, Wuhan (201304) and the Nation Natural Science Foundation of China (41275008).

Author Contributions

Jing Sun and Zheng Shi conceived and designed the experiments; Jing Sun performed the experiments; Jian Chai and Guirong Xu analyzed the data; Ben Niu provided the data for the simulations and contributed to analyse the weather situation; Jing Sun wrote the paper.

Conflicts of Interest

The authors declare no conflict of interest.

Appendix

The aerosol size distribution is the most basic microphysical properties of precipitation particles. The term d represents the equivalent diameter of the same sphere and d describes the size of raindrops. The spectrum distribution of various particles is N ( D ) = N 0 D α exp ( λ D ) . In the process of microphysical parameterization, M-P distribution is the widely used raindrop spectrum, namely α = 0 . However, the difference is larger between the M-P distribution and the measured raindrop spectrum, which mainly embodies raindrop concentration, precipitation intensity and rainwater content. The value of α is equal to 2 in this study because the fitting result of M-P distribution is closer to the observation when α 0 , namely N r ( D r ) = N D 0 r r 2 exp ( λ r D r ) . The hydrometeor classes and size distribution parameters are summarized in Table A1.
Table A1. Particles spectrum and characteristic quantity.
ParticlesαN0λm(g) V ¯ ( m / s ) D ¯ ( m )
Cloud droplets5 ρ N λ 6 / Γ ( 6 ) ( 56 π ρ L N / Q ) 1 3 π 6 ρ L D 3 6 λ 1
Raindrops2 1 2 ρ N λ 3 ( 10 π ρ L N / Q ) 1 3 π 6 ρ L D 3 2.4 A vr ( ρ λ ) 1 2 3 λ 1
Ice crystals1 ρ N λ 2 ( 6 A mi N / Q ) 1 2 A mi D 2 1.54 A vi λ 1 3 ( P 0 / P ) 1 4 2.88 λ 1
Snow0 ρ N λ ( 2 A ms N / Q ) 1 2 A mi D 2 1.39 A vs λ 1 3 λ 1
Graupel0 ρ N λ ( π ρ g N / Q ) 1 3 π 6 ρ g D 3 1.94 A vg ( ρ λ ) 1 2 λ 1
The shape of ice crystal and snow are hexagonal plate, and other particles are spherical; A v r = 2.13 ( G ρ L / 2 ) 1 / 2 = 4714.96 , A v g = ( 4 ρ g G / 3 C D ) 1 / 2 , A m i = 10 g m 2 , A v i = 3.25 ( 1 + F i ) m 2 / 3 s 1 , A m s = 4.64 ( 1 + 0.5 F s ) m 2 / 3 s 1 , P 0 = 1000 h P a , ρ L = 10 6 g m 3 , G is the acceleration of gravity. D ¯ is average diameter of particles. Fi and Fs are the riming ratio of ice crystal and snow, respectively.
The density range of graupel is from ρ g = 0.124 × 10 6   g m 3 to ρ g = 0.92 × 10 6   g m 3 . The value of CD is 0.45 when graupel content ρ Q g < 0.5 g m 3 , and the value of CD is 0.6 when ρ Q g 1.0 g m 3 and ρ g = 0.9 × 10 6   g m 3 .
There are four ice phase hydrometeor (ice crystal, snow, graupel and hail) and seven microphysical processes considered in the model, including condensation (VD), collection and coalescence (CL), nucleation (NU), propagation (P), melting (ML), evaporation (MVD) and auto-conversion (CN) (Hong, 1998). The interaction between the microphysical processes of hydrometeors and variables are shown in Figure 1 and Table 2, respectively. The subscripts v, c, r, i, g, s and h represent the water vapor, cloud droplets, raindrops, ice crystal, graupel, snow, and hail, respectively. For example, MLir denotes the ice crystal transferred by raindrops through the melting process. The main microphysical parameterizations of the model are introduced into the study as follows.

Appendix 1. Warm cloud Microphysical Parameterization

The warm-cloud microphysics follows Hong [19]. For the first appearance of supersaturation at grid point, the mass of initiated droplets is calculated either by a one-step adjustment as Klemp and Wilhelmson [23]. Four microphysical processes are considered in the warm cloud parameterization, including VDvc, CNcr, CLcr and MVDrv. VD, CN, CL and MVD denote the condensation, auto conversion, collection and coalescence, melting and evaporation, respectively. The subscripts v, c, and r represent the water vapor, cloud droplets and raindrops, respectively. For example, VDvc denotes the water vapor transferred by cloud droplets through the condensation process.
The assumed conditions are met in the model as follow: (1) there is enough and effective CCN in the atmosphere, which makes the embryo of cloud droplets is formed when the vapor air is more than the saturation of surface; (2) the raindrops spectrum follows the distribution of Marshall–Palmer, and the shape of raindrops is spherical; (3) the fall speed of cloud droplets is not considered in the model; and (4) there is no the supersaturation of cloud water surface, and the condensation and evaporation process of cloud droplets can be completed instantaneously.
  • The cloud droplets transferred by raindrops through the collection and coalescence process (CLcr)
    C L c r = π 4 q c 0 E r c D 2 V r ( D ) N ( D ) d D
    where Erc is the efficiency of collision, and E r c = 0.9 D is the diameter of raindrops. Vr(D) is the terminal fall speed of raindrops.
    V r = 0 V r ( D ) m ( D ) d D 0 m ( D ) d D = 14.08 ρ ¯ 0.375 q r 0.125
    where ρ is the air density, and q r is the raindrops mixing ratio. The integrated Vr(D) and N(D) (in Table 1) are then
    C L c r = 149.1 π E r c N 0 Γ ( 7 2 ) 4 ρ 1 / 2 λ 7 / 2 q c
    where Γ ( 7 2 ) = 15 8 π , then the Equation (A3) is given by
    C L c r = 2.2 ρ 0.375 q c q r 0.875
    where ρ is air density, and q c and q r are the mixing ratio of cloud droplets and raindrops, respectively.
  • The cloud droplets transferred by raindrops through the auto conversion process (CNcr), and the auto conversion formula of Kessler is used in the model.
    C N c r = 10 3 ( q c 10 3 )
In addition, the method of saturation adjustment to study the variation of the water vapor transferred by cloud droplets is through the auto conversion process (VDvc). The cloud droplets and raindrops are transferred by water vapor through the evaporation process (VDcv and VDrv) [19].

Appendix 2. Cold Cloud Microphysical Parameterization

  • Melting and Evaporation processes (MVD)
The shape of ice crystal and snow are hexagonal plate, and for a single particle:
( d m i , s d t ) e v = 4 π C ( 1 S ) f i , s ( R e ) C x      ( S < 1 )
where C x = 1.0 / [ L v 2 K R v T 2 + R v T D f e ( T ) ] , C = D π , and D is the diameter of particles.
The ice crystal and snow transferred by water vapor through the melting and evaporation processes (MVDiv and MVDsv) are expressed when T = T0 as follows, respectively:
M V D i v = 1 ρ 0 N i ( D i ) ( d m i d t ) e v d D i = 8 ( 1 S ) A i N o i C x ρ 1 λ i 3
M V D s v = 1 ρ 0 N s ( D s ) ( d m s d t ) e v d D s = 4 ( 1 S ) A s N o s C x ρ 1 λ s 3
where, A i = 1 + 0.462 ( A v i / γ ) 1 / 2 λ i 2 / 3 , A v i = 70 ( 1 + F i ) c m 2 3 s 1 , and Fi is the riming ratio of ice crystal; A s = 1 + 0.346 ( A v s / γ ) 1 / 2 λ s 2 / 3 ; and A v s = 100   c m 2 3 s 1 . Here, S is saturation; N o i and N o s are the number of ice crystals and snow particles per unit mass of air, respectively, and are specified; λ is the representative diameter; and γ is fall speed factor. The subscripts i and s represent ice crystal and snow particles.
The shape of graupel particle is sphere, and for a single particle:
( d m g d t ) e v = 2 π D g ( 1 S ) f g ( R e ) C x      ( S < 1 )
where C x = 1.0 / [ L v 2 K R v T 2 + R v T D f e ( T ) ] , and C = D π , Dg is the diameter of graupel particles. The graupel transferred by water vapor through the melting and evaporation processes (MVDgv) is expressed as follow:
M V D g v = 1 ρ 0 N g ( D g ) ( d m g d t ) e v d D g = 2 π ( 1 S ) A g N o g C x ρ 1 λ g 2
where A g = 1 + 0.37 ( A v g / γ ) 1 / 2 ρ 1 / 4 λ g 3 4 and A v g = 500 c m 0.2 s 1
The melting and evaporation process of hail particle is the same as graupel.
M V D h v = 1 ρ 0 N h ( D h ) ( d m h d t ) e v d D h = 2 π ( 1 S ) A h N o h C x ρ 1 λ h
where A h = 1 + 0.29 ( A v g / γ ) 1 / 2 ρ 1 / 4 λ h 1 and A v h = 4427.19 c m 0.2 s 1
2.
Condensation process (VD)
The condensation ratio of a single ice crystal is given as follow:
V D v i = 1 ρ 0 N i ( D i ) ( d m i d t ) c d D i = [ 8 N 0 i ( S i 1 ) A i / ( ρ λ s 2 ) d C L c i ] c x 1
where S i is relative humidity of ice surface, A i = 1 + 0.32 ( A v i / γ ) 1 / 2 λ i 2 / 3 ; C L c i is the cloud droplets transferred by ice crystal through collection and coalescence process; and ( d m i d t ) c = [ 4 π C ( S i 1 ) f i ( R e ) d ( d m i d t ) r i m ] c x 1 . Equation (A12) should meet the conditions: (1) if the relative humidity of ice surface S i 1 , and ( d m i d t ) r i m = 0 , ( d m i d t ) r i m is the riming ratio of a single ice crystal particle; and (2) if the relative humidity of ice surface S i > 1 , V D v i = 0 .
Similar to ice crystal, the condensation ratio of snow particle is denoted by:
V D v s = [ 4 N 0 s ( S i 1 ) A s / ( ρ λ s 2 ) d C L c s ] c x 1
where A s = 1 + 0.346 ( A v s / γ ) 1 / 2 λ s 2 / 3 , and A v s = 100   c m 2 3 s 1 . Here, S is saturation, and the application condition is similar to ice crystal particles.
For graupel particles, only consider the sublimation process:
V D g v = 1 ρ 0 N g ( D g ) ( d m g d t ) c d D g = 2 π ( 1 S i ) N o g A g c x 1 / ( ρ λ g 2 )
where A g = 1 + 0.37 ( A v g / γ ) 1 / 2 ρ 1 / 4 λ g 3 / 4 . N o g is the number of graupel particles per unit mass of air is specified.
3.
The collection and coalescence process (CL)
(1)
The collection and coalescence process between raindrops and ice crystal
If the water content of rain meets the condition Q r 10 4 g / g when T < T 0 , and C L r i , then C L i r is the source term of graupel particles. Otherwise, C L r i and C L i r will contribute to the formation of snow particles. Then, C L i r is transformed into raindrops when T T 0 .
C L i r = 120 λ i 2 x 1 ( 3 λ r 2 + 6 λ r 1 λ i 1 + 5 λ i 2 ) C L r i = 30 π ρ L λ r 3 x 1 ( λ r 2 + 4 λ r 1 λ i 1 + 7 λ r 2 )
where the value of λ is the same as Hong [19], x 1 = π E i r | V r ¯ V i ¯ | N o i N o r λ i 2 λ r 3 ρ 1 , in which Eir is coagulation efficiency between ice crystal and rain droplets and the value is 0.8. N o i and N o r are the number of ice crystals and raindrops per unit mass of air, respectively, and are specified; and λ is the representative diameter.
(2)
The collection and coalescence process between raindrops and ice crystal
C L i s = 30 x 2 ( 10 λ i 2 + 4 λ r 1 λ i 1 + λ s 2 )
where x 2 = π E i s | V s ¯ V i ¯ | N o i N o s λ s 1 λ i 4 ρ 1 , and Eis is coagulation efficiency between ice crystal and snow. E i s = exp [ 0.025 ( T T 0 ) ] when T < T 0 , E i s = 1.0 , and T T 0 .
(3)
The collection and coalescence process between graupel particles and ice crystal
C L i g = 30 x 3 ( 10 λ g 2 + 4 λ r 1 λ g 1 + λ g 2 )
where x 3 = π E i g | V g ¯ V i ¯ | N o i N o g λ g 1 λ i 4 ρ 1 , and E i g is the same as E i s . Here, N o i and N o g are the number of ice crystals and graupel particles per unit mass of air, respectively and are specified.
(4)
The collection and coalescence process between snow particles and raindrops
If the water content of rain meets the condition Q r 10 4 g / g when T < T 0 , and C L r s , then C L s r is transformed into graupel particles. Otherwise, C L r s contributes to the formation of snow particles.
C L r s = 10 π ρ L x 4 ( λ s 2 + 6 λ s 1 λ r 1 + 21 λ r 2 )
C L s r = 6 A m s λ r 3 λ s 2 x 4 ( 2 λ s 2 + 3 λ s 1 λ r 1 + 2 λ r 2 )
where x 4 = π | V r ¯ V s ¯ | E r s N o r N o s λ s 1 λ r 6 ρ 1 . Here, E r s = 1.0 ; N o r and N o s are the number of raindrops and snow particles per unit mass of air, respectively, and are specified; λ is the representative diameter of particles; and A m s = 0.003 g c m 2 .
(5)
The collection and coalescence process between graupel and raindrops
C L r g = 10 π ρ L x 5 ( 21 λ r 2 + 6 λ r 1 λ g 1 + λ g 2 )
where x 5 = π | V g ¯ V r ¯ | E r g N o r N o g λ r 6 λ g 1 ρ 1 and E r g = 0.8 .
(6)
The collection and coalescence process between graupel and snow particles
C L s g = 30 x 6 ( 21 λ r 2 + 6 λ r 1 λ g 1 + λ g 2 )
where x 6 = π | V g ¯ V s ¯ | E s g N o s N o g λ s 3 λ g 1 ρ 1 . Here, E i s = 1.0 when T T 0 and E i s = exp [ 0.09 ( T T 0 ) ] when T < T 0 .
(7)
The collection and coalescence process between cloud droplets and other particles
C L c A = 1 ρ 0 π 4 D A 2 υ A E c A ( ρ Q c ) N A ( D A ) d D A
where the subscripts of A represent rain (r), ice crystal (i), snow (s) and graupel (g), and the formula are denoted as follows:
C L c r = π 4 Γ ( 5.5 ) A v r E c r Q c N o r λ r 5.5 ρ 0.5     ( E c r = 1.0 )
C L c s = π 4 Γ ( 3.3 ) A v s E c s Q c N o s λ s 3.3     ( E c s = 1.0 )
C L c g = π 4 Γ ( 3.5 ) A v g E c g Q c N o g λ g 3.5 ρ 0.5     ( E c g = 1.0 )
(8)
When the diameters of cloud droplets and ice crystals meet the conditions: D C 15 × 10 6 m and D i 300 × 10 6 m , respectively, then collection and coalescence process between cloud droplets and ice crystals is denoted by:
C L c i = π 4 Γ ( 4.3 ) A v i E c i Q c N o i ( P 0 / P ) 1 4 exp ( β 2 ) ( 1 + i = 1 β 2 / i ! ) λ i 4.3
where the value of E c i see the reference of Hu [25]. Here, C L c i , C L c s and C L c g are transformed into raindrops when T T 0 .
4.
The Nucleation process (NU)
(1) The formation of Ice crystal by nucleation
The nucleation concentration of ice nuclear is expressed by the equations of Fletcher in the super cooled cloud when T < T 0 :
ρ N = A exp [ β ( T 0 T ) ]
N N U v i = d N i d t = A β [ β ( T 0 T ) ] / ρ ω T z
N U v i = m i o N N U v i
where ω T z < 0 , A = 10 2 , β = 0.6 , and m i o is the quality of a single ice crystal. Because the concentration of ice nuclear is higher in low temperature,
N U v i = min { N U v i , ( Q v Q v s ) / 2 Δ t }
where ( Q v Q v s ) / 2 Δ t is the change rate of water vapor content.
(2) Heterogeneous-nucleation process
According to the method of Wisner [11], the super cooled water droplets is transformed into the graupel particles by heterogeneous-nucleation process:
N U r g = 1 ρ 0 N r ( D r ) π 6 B D r 3 C m π 6 ρ L D r 3 d D r = Γ ( 9 ) π 2 ρ L B N o r C m / ( 36 ρ λ r 9 )
where C m = exp [ β ( T T 0 ) ] 1 ; B = 10 2 ; and β = 0.66 .
(3) Ice crystal multiplication process (NPci)
The Hallett–Mossop is used in the study of ice crystal multiplication process, and secondary ice crystals are produced by the process of coalescence between graupel particles and large cloud-drops of D > 24 μ m .
N P c i = A ( T ) N c C L c g exp ( β 1 ) ( 1 + i = 1 5 β 1 i / i ! ) / ( 250 Q C )
where β 1 = D c λ c , and the value of A ( T ) is according to Hu [25]. Here, C L c g is the cloud droplets transferred by graupel particles through the collection and coalescence process; N c is the number density of cloud droplets; and Q c is the water content of cloud droplets.
5.
Melting process (ML)
The melting ratio of a single ice crystal is denoted:
M L i = 1 L f [ 8 f j N 0 i A i ρ 1 λ i 3 + C w ( T T 0 ) C L c i ]
where C w is water specific heat. Here, M L i r = M L i when M L i 2 Δ t / N i > 5.24 × 10 7 g , or M L i c = M L i . M L i r denotes the ice crystal transferred by raindrops through the melting process. f j = K ( T T 0 ) + L v D f ρ ( Q v Q v s ) ; N 0 i is the initial number density of ice crystal; A i is the transformation rate of ice crystal; and C L c i denotes the cloud droplets transferred by ice crystal through the collection and coalescence process.
The melting ratio of snow is the same as a single ice crystal,
M L s r = 1 L f [ 4 f j N 0 s A s ρ 1 λ s 3 + C w ( T T 0 ) ( C L c s + C L r s ) ]
where N 0 s is the initial number density of snow; A s is the transformation rate of snow; and C L c s denotes the cloud droplets transferred by snow through the collection and coalescence process.
The melting ratio of graupel is denoted by:
M L g r = 1 L f [ 2 π f j N 0 g A g ρ 1 λ g 2 + C w ( T T 0 ) ( C L c g + C L r g ) ]
where N 0 g is the initial number density of graupel particles; A g is the transformation rate of graupel; and C L c g denotes the cloud droplets transferred by graupel through the collection and coalescence process.
6.
Atuo conversation process (CN)
(1) Cloud droplets are converted into raindrops
Because of cloud droplet spectra distributes in a narrow range by condensation and the raindrops is produced by the wide of cloud droplet spectra under random collision. With the development of cloud droplet spectra, little raindrops are produced when the radius of cloud droplets is 40 um, and the time development of cloud t c is described as:
t c ( 120 ρ Q c + 1.6 N b / D b ) / ( ρ Q c ) 2
where N b / D b = 1200 . Here, the cloud droplets begin to convert when t t > t c , and the conversion rate C N c r uses the corrected formula:
C N c r = J ( ρ Q c ) 2 / [ 360 ρ + 1.2 N b / ( D b Q c ) ]
where J = 0.25 . Here, Q c is the water content of cloud droplets, and ρ is air density [25].
(2) Ice crystals are converted into snow and graupel
The ice crystal are converted into snow and graupel with the change of riming ratio when the diameter of ice crystals is D i * = 3 × 10 4 m , and the ice crystals are converted into graupel particles when the riming ratio of ice crystal F i 0.5 , otherwise the ice crystals are converted into snow.
C N i g ( s ) = A Q i exp ( β 1 ) ( 1 + i = 1 3 β 1 i / i ! )
where A = 0.01 s 1 , and β 1 = λ i D i
(3) Snow particles are converted into graupel
The snow particles are converted into graupel when the riming ratio of snow F s 0.5 , and the diameter of snow is D s * = 3 × 10 4 m .
C N s g = A Q s exp ( β 2 ) ( 1 + β 2 + β 2 2 )
where β 2 = λ s D s .
7.
Accumulation process (NCL)
According to Hu [25], the accumulation process of ice crystal and snow are described as:
N C L i i = 0.051 ρ A v i E i i Q i 7 / 6 N i 5 / 6
N C L s s = 9.406 × 10 3 ρ A v s E s s Q s 7 / 6 N s 5 / 6
where E i i and E s s are the average of coagulation coefficient of ice crystal and snow particles, respectively. Because there is little research on the value of E i i and E s s , we use the formula E ¯ S S = E ¯ i i , and
E i i = A 1 exp [ A 2 ( T 273 ) ] { 1 + A 3 exp [ A 4 ( T 259 ) 2 ] }
where A 1 = 0.2 , A 2 = 0.35 , A 3 = 4 , and A 4 = 0.4 .

Abbreviations

The following abbreviations are used in this manuscript:
VDvc(cv)
Water vapor-cloud droplets (auto conversion)
VDrv
Raindrops-water vapor (evaporation)
CLcr
Cloud droplets-raindrops (collection and coalescence)
CNcr
Cloud droplets-rain drops (auto conversion)
MVDiv
Ice crystal (melting and evaporation)
MVDsv
Snow (melting and evaporation)
MVDgv
Graupel (melting and evaporation)
VDvi(iv)
Water vapor-ice crystal (condensation)
VDvs(sv)
Water vapor- snow (condensation)
VDvg(gv)
Water vapor-snow (condensation)
NUvi
Water vapor-ice crystal (nucleation)
NUrg
Raindrops-graupel (nucleation)
NPci
Ice crystal (multiplication)
MLic(r)
Ice crystal-cloud droplets/raindrops (melting)
MLsr
Snow-raindrops (melting)
MLgr
Graupel-raindrops (melting)
CLci
Cloud droplets–ice crystal (collection and coalescence)
CLcs
Cloud droplets–snow (collection and coalescence)
CLcg
Cloud droplets–graupel (collection and coalescence)
CLir(ri)
Ice crystal-raindrops (collection and coalescence)
CLrs(sr)
Snow-raindrops (collection and coalescence)
CLrg
Raindrops-graupel (collection and coalescence)
NCLii
Ice crystal-ice crystal (Accumulation)
CLis
Graupel-ice crystal (collection and coalescence)
CLig
Ice crystal-graupel (collection and coalescence)
NCLss
Snow-snow (Accumulation)
CLsg
Graupel-snow (collection and coalescence)
CNis
Ice crystal-snow (Atuoconversation)
CNig
Ice crystal-graupel (Atuoconversation)
CNsg
snow-graupel (Atuoconversation)
qv
Mixing ratio of water vapor
qc
Mixing ratio of cloud
qr
Mixing ratio of rain
qg
Mixing ratio of graupel
qs
Mixing ratio of snow
qi
Mixing ratio of ice crystal
qh
Mixing ratio of hail
Nr
Number of raindrops per unit mass of air
Ng
Number of graupel per unit mass of air
Ns
Number of snow per unit mass of air
Ni
Number of ice crystal per unit mass of air
Nh
Number of hail per unit mass of air
Fi
The riming ratio of ice crystal
FS
The riming ratio of snow
T0
Standard freezing temperature of water
ρ
Air density
LV
Latent heat
E
The efficiency of collision
D
The diameter of particles
V
Terminal fall speed
S
saturation

References

  1. Zhao, Y.C. Diurnal variation of rainfall associated with tropical depression in south China and its relationship to Land-sea contrast and topography. Atmosphere 2014, 5, 16–44. [Google Scholar] [CrossRef]
  2. Cui, X.P.; Li, X.F. A cloud-resolving modeling study of short-term surface rainfall processes. Meteorol. Atmos. Phys. 2011, 111, 1–11. [Google Scholar] [CrossRef]
  3. Tao, W.; Chen, J.; Li, Z.; Wang, C.; Zhang, C. Impact of aerosols on convective clouds and precipitation. Rev. Geophys. 2012, 50, RG2001. [Google Scholar] [CrossRef]
  4. Liu, J.; Shen, X.Y.; Li, X.F. Radiative effects of water clouds on heat, cloud microphysical and surface rainfall budgets associated with pre-summer Torrential rainfall. Terr. Atmos. Ocean. Sci. 2014, 25, 39–48. [Google Scholar] [CrossRef]
  5. Liu, Y.; Du, D.G.; Li, Z.L.; Shi, C.X. Analysis and application of the relation between cumulonimbus (Cb) cloud features and precipitation based on FY-2C image. Atmosphere 2014, 5, 211–229. [Google Scholar] [CrossRef]
  6. Mansell, E.R. On sedimentation and advection in multi-moment bulk microphysics. J. Atmos. Sci. 2010, 67, 3084–3094. [Google Scholar] [CrossRef]
  7. Zhang, Z.; Zhou, Y. Analyses of composite observations of cloud liquid water and precipitation on the evolution features. Meteorol. Mon. 2010, 36, 83–89. [Google Scholar]
  8. Solheim, F.; Godwin, J.R.; Westwater, E.R.; Han, Y.; Stephen, J.K.; Marsh, K.; Ware, R. Radiometric profiling of Temperature, water vapor and cloud liquid water using various inversion methods. Radio Sci. 1998, 33, 393–404. [Google Scholar] [CrossRef]
  9. Kessler, E. On the distribution and continuity of water substance in atmospheric circulation. Meteorol. Monogr. Am. Meteorol. Soc. 1969, 32, 84–85. [Google Scholar] [CrossRef]
  10. Simpson, J.; Wiggert, V. Models of precipitating cumulus towers. Mon. Weather Rev. 1969, 97, 471–489. [Google Scholar] [CrossRef]
  11. Wisner, C.; Orville, H.D.; Meyers, C. A numerical model of a hail-bearing cloud. J. Atmos. Sci. 1972, 29, 1160–1181. [Google Scholar] [CrossRef]
  12. Rutledge, S.A.; Hobbs, P.V. The mesoscale and microscale structure and organization of clouds and precipitation in mid latitude cyclones. XII: A diagnostic modeling study of precipitation development in narrow cold-frontal rainbands. J. Atmos. Sci. 1984, 41, 2949–2972. [Google Scholar] [CrossRef]
  13. Burning, E.C.; Rust, W.D.; Schuur, T.J.; MacGorman, D.R.; Krehbiel, P.R.; Rison, W. Electrical and polarimetric radar observations of a multicell storm in TELEX. Mon. Wea. Rev. 2007, 135, 2525–2544. [Google Scholar] [CrossRef]
  14. Liu, C.; Zipser, E.J. The dynamic influence of microphysics in tropical squall lines: A numerical study. Mon. Weather Rev. 1997, 125, 2193–2210. [Google Scholar] [CrossRef]
  15. Konwar, M.; Maheskumar, R.S.; Kulkarni, J.R.; Freud, E.; Goswami, B.N.; Rosenfeld, D. Aerosol control on depth of warm rain in convective clouds. J. Geophys. Res. 2012, 117, D13204. [Google Scholar] [CrossRef]
  16. Trier, S.B.; Skamarock, W.C.; Lemone, M.A. Structure and evolution of the 22 February 1993 TOGA COARE squall line: Numerical simulations. J. Atmos. Sci. 1996, 53, 2861–2886. [Google Scholar] [CrossRef]
  17. Milbrandt, J.A.; Morrison, H. Predicting graupel density in a bulk microphysics scheme. J. Atmos. Sci. 2013, 70, 410–429. [Google Scholar] [CrossRef]
  18. Mansell, E.R.; Ziegler, C.L. Aerosol effects on simulated storm electrification and precipitation in a two-moment bulk microphysics model. J. Atmos. Sci. 2013, 70, 2032–2049. [Google Scholar] [CrossRef]
  19. Hong, Y.C. The numerical simulation study of convective stratiform mixed cloud, Part (I)—The model and parameterization of microphysical processes. Acta Meteorol. Sin. 1996, 54, 544–557. [Google Scholar]
  20. Wang, X.; Xiao, H.; Du, B. Numerical simulation on severe convective rainfall. J. Nanjing Inst. Meteorol. 2002, 25, 656–663. [Google Scholar]
  21. Xiao, H.; Wang, X.; Zhou, F.; Hong, Y.; Huang, M. A three-dimensional numerical simulation on microphysical processes of Torrential Rain storms. Chin. J. Atmos. Sci. 2004, 28, 385–404. [Google Scholar]
  22. Guo, F.X.; Zhang, Y.J.; Yan, M.H. Comparison of two parameterization sections for non-inductive mechanism before the first discharge in a simulated single cell storm. Chin. J. Atmos. Sci. 2010, 34, 361–373. (In Chinese) [Google Scholar]
  23. Klemp, J.B.; Wilhelmson, R.B. Simulations of right- and left-moving storms produce through storm splitting. J. Atmos. Sci. 1978, 35, 1097–1110. [Google Scholar] [CrossRef]
  24. Hong, Y.C. A 3-D cloud numerical seeding model. Atca Meteorol. Sin. 1998, 56, 641–653. [Google Scholar]
  25. Hu, Z.J.; He, G.F. Numerical simulation of microprocesses in cumulonimbus clouds (I): Microphysical model. Acta Meteorol. Sin. 1987, 45, 468–484. [Google Scholar]
  26. Orville, H.D.; Kopp, F.J. Numerical simulation of the life history of a hailstorm. J. Atmos. Sci. 1977, 34, 1596–1618. [Google Scholar] [CrossRef]
  27. Tripoli, G.J.; Cotton, W.R. Numerical study of an observed orogenic mesoscale convective system. Part Ⅰ: Simulated genesis and comparison with observations. Mon. Wea. Rev. 1989, 117, 273–304. [Google Scholar] [CrossRef]
  28. Klemp, J.B.; Wilhelmson, R.B. The simulation of three dimensional convective storm dynamics. J. Atmos. Sci. 1978, 35, 1070–1096. [Google Scholar] [CrossRef]
Figure 1. The microphysical process in the cloud model: Melting and Evaporation processes: MVDiv, MVDsv, MVDgv and MVDhv; Condensation processes: VDvi, VDvs, VDvg, VDiv, VDsv, VDgv, and VDhv; Nucleation processes: HNUci, NUvi, and HNUrg, NUrg, NPci; Melting process: MLir, MLsr, MLgr, and MLhr; Collection and coalescence: CLci, CLcs, CLcg, CLch, CLir, CLri, CLrs, CLsr, CLrg, CLrh, CLis, CLig, CLih, CLsg, CLsh, and CLgh; Atuoconversation: CNis, CNig, CNsg, CNgh; and Accumulation process: NCLii and NCLss.
Atmosphere 07 00097 g001
Figure 2. Mesoscale analysis (a,b) and the analysis of satellite image characteristics (c,d) of 12 July 2012 rainstorm process in Wuhan: (a): 02:00; (b):08:00; (c): 07:00; and (d): 08:00 (red arrow: 850 hPa streamline; brown arrow: 700 hPa streamline; white square frame: the location of Wuhan).
Atmosphere 07 00097 g002
Figure 3. (a) Temperature and dew-point temperature and (b) environmental wind velocity profile observed at 08:00 LST on 12 July 2012 in Wuhan.
Atmosphere 07 00097 g003
Figure 4. Ground rainfall accumlated in 3 min versus time: (a) observed durin 08:00–09:30 on 12 July 2012 in Wuhan; and (b) simulation.
Atmosphere 07 00097 g004
Figure 5. x–z cross sections (ad) of the cloud water content (LWC, unit: g·m−3) with height at different times of precipitation and y = 18 km; red dotted line: Section 1; green dotted line: Section 2.
Atmosphere 07 00097 g005
Figure 6. The maximum of updraft velocity and downdraft velocity with time (a) and the distribution of isotherms (b).
Atmosphere 07 00097 g006
Figure 7. x–z cross sections of the mixing ratio of cloud (a–d) and rain drops (g·m−3) (e–h) at different times for Sections 1 and 2 and y = 18 km.
Atmosphere 07 00097 g007aAtmosphere 07 00097 g007b
Figure 8. x–z cross sections (af) of the distribution of hydrometeors (graupel, ice crystal, and snow) at different times of precipitation and y = 18 km.
Atmosphere 07 00097 g008
Table 1. The result of radar echo’s observation and simulation in convective cloud.
ParameterizationInitial Echo Height/kmHeight of 45 dBz Radar Echo’s/kmMaximum of Radar Echo’s/dbzWidth of Cloud/km
observation5.37.46025
simulation5.27.06520
Table 2. Changes in hydrometeors in the Sections 1 and 2.
ParameterSection 1Section 2
Qc Maximum (g·m−3)2.842.84
Time of Qc Maximum (min)99
Qr Maximum (g·m−3)6.56.66
Time of Qr Maximum (min)1818
Qg Maximum (g·m−3)-0.5
Time of Qg Maximum (min)-21
Qi Maximum (g·m−3)-0.3
Time of Qi Maximum (min)-42
Qs Maximum (g·m−3)-0.5
Time of Qs Maximum (min)-54
Table 3. Total microphysical quantities in the formation of rain at different times for simulated cloud (unit: t).
0–15 min15–30 min30–45 min45–60 min
CNcr00.02356031,201.5
CLcr910.71059.896.460
MLgr00.30.10
MLir00.10.10
MLsr00.10.30
Table 4. Total microphysical quantities in the formation of graupel particles at different times for simulated cloud (unit: t).
0–15 min15–30 min30–45 min45–60 min
NUrg1380.15957.46140192.7
CNsg0693.9293.30
CLcg01416.712170
CLrg1.155.6307.9412.1
CLig08.226.115.3
CNig00.212.56.8

