Article

Seasonal Variation of Nitrate Concentration and Its Direct Radiative Forcing over East Asia

Key Laboratory of Regional Climate-Environment for Temperate East Asia (RCE-TEA), Institute of Atmospheric Physics (IAP), Chinese Academy of Sciences (CAS), Beijing 100029, China
*
Author to whom correspondence should be addressed.
Atmosphere 2016, 7(8), 105; https://doi.org/10.3390/atmos7080105
Submission received: 4 July 2016 / Revised: 30 July 2016 / Accepted: 2 August 2016 / Published: 10 August 2016
(This article belongs to the Special Issue Atmospheric Aerosols and Their Radiative Effects)

Abstract

:
This study investigated the seasonal variation of nitrate concentration and its radiative forcing over East Asia by using an online-coupled regional climate model. Comparison with a series of in-situ observations from Acid Deposition Monitoring Network in East Asia (EANET) and China demonstrated a good skill of the model in reproducing the magnitude and seasonality of nitrate concentration across East Asia. It was found that nitrate concentration in Beijing and Tianjin exhibited the maximum in summer and the minimum in winter possibly due to stronger chemical oxidation and regional transport effect of larger emissions from the north China Plain in summer, whereas in most areas of East Asia, nitrate concentration was higher in winter and lower in summer, consistent with the seasonality of NOx emission. Surface nitrate concentration was higher over the lower reaches of the Yellow River, followed by the middle to lower reaches of the Yangtze River and portions of south China, and lower in Korean Peninsula and Japan. The annual mean surface nitrate concentration was predicted to be 2.9 μg·m−3 for East Asia and 8.5 μg·m−3 for east China. All-sky direct radiative forcing (DRF) due to nitrate at the top of the atmosphere (TOA) exhibited the largest forcing up to −7 W·m−2 over the lower reaches of the Yellow River, and lower forcing of ~−2 W·m−2 in the Korean Peninsula and Japan. Clear-sky DRF by nitrate reached the maximum in spring and the minimum in summer over both East Asia and east China, whereas DRF under all-sky condition showed its maximum in autumn, associated with seasonalities of nitrate column burden, relative humidity, and cloud effect. Annual mean all-sky DRFs at TOA were estimated to be −1.7 W·m−2 and −3.7 W·m−2 over East Asia and east China, respectively, significantly larger than global annual mean, suggesting the important role of nitrate aerosol in environment and climate change over East Asia.

1. Introduction

Aerosol pollution in East Asia has become a serious problem in the past decades mainly due to continuous economic growth and ineffective emission control in this region. As a result, more and more attention has been paid to aerosol pollution problems in East Asia. Sulfate, nitrate, black carbon, organic carbon, and mineral dust are major aerosol types in this region. Among these aerosols, many studies have been conducted concerning the origin, transport and transformation, removal, and environmental and climatic effects of sulfate, black carbon, and dust; however, nitrate, one of the major anthropogenic aerosol components, dose not attracted as many concerns.
In recent years, nitrate aerosol increases along with increasing emission of NOx, the gaseous precursor of nitrate, which is mainly from automobile and industry. Nitrate account for about 4%–30% in PM2.5/PM10 mass concentration in urban areas of China in terms of seasonal or annual mean [1,2,3,4,5,6]. Wang et al. [5] reported that nitrate accounted for 25% of PM2.1 mass concentration, just less than the mass fraction of sulfate (30%), at five sites in the Yangtze River Delta of east China during 2012–2013, demonstrating a comparable contribution of sulfate and nitrate to fine aerosol in east China at present time. Nitrate concentration was consistently increased in the past decade in China. For example, in Beijing, Yang et al. [3] found that although annual sulfate and ammonium concentrations decreased by 5% and 8% during 2000–2008, respectively, nitrate concentration experienced a solid growth by 20%. The increase of nitrate precursor emission led to this change. Xie and Han [7] has analyzed emission inventories from previous studies [8,9,10] and found that the annual emission of NOx in China had persistently increased from 15.4 Tg/year in 2000 to 21.0 Tg/year in 2006 and further to 28.5 Tg/year in 2010, 85% increment between 2010 and 2000. On the contrary, the annual emission of sulfur dioxide (SO2), the gaseous precursor of sulfate, was estimated to increase from 22.8 Tg/year in 2000 to 31.4 Tg/year in 2006 but decrease to 28.4 Tg/year in 2010. Meanwhile, the overall increment of anthropogenic PM2.5 emission and black carbon emission was 30% and 20%, respectively, between 2010 and 2000, while anthropogenic PM10 emission decreased sharply by 74%. It was clear that NOx emission had the most rapid increase among pollutants relating with aerosols. This implies that nitrate aerosol plays a more and more important role in China in recent years.
Nitrate is formed through a series of multi-phase chemical transformation including thermodynamic equilibrium and in-cloud aqueous oxidation. NOx is first oxidized by OH radical to form gaseous nitric acid (HNO3), and then HNO3 is neutralized by NH3 via thermodynamic equilibrium or/and in-cloud processes, forming nitrate aerosol. Heterogeneous reaction is another important formation pathway of nitrate. Gaseous species, such as HNO3, diffuses onto surface of preexisting aerosol (e.g., dust), and then reacts with alkaline components of the aerosol, finally forming nitrate.
Optical properties of nitrate, such as refractive index, are similar to those of sulfate [11,12], so the increase of nitrate concentration can also lead to increase of extinction coefficient, resulting in visibility reduction and a negative aerosol direct radiative forcing (DRF) at the surface and the top of the atmosphere. As the increase of NOx emission in recent years, the strength of DRF exerted by nitrate aerosol increases accordingly [12,13,14,15]. Based on observations of aerosol optical properties (such as aerosol optical depth), total aerosol DRF can be estimated (e.g., [16,17]); however, the observation-based estimation is just available at limited sites and not able to identify DRF due to each aerosol component. Numerical simulation can overcome this shortcoming and can simulate aerosol DRF in past/present/future times. Using a global atmospheric chemistry-climate model, Liao et al. [12] suggested an increasing trend of DRF due to anthropogenic nitrate and a decreasing trend of DRF due to anthropogenic sulfate, and nitrate DRF was expected to exceed sulfate DRF in the future, implying a potentially more important role of nitrate in radiation transfer and climate. By running a global model, Bauer et al. [13] predicted that the nitrate burden and nitrate DRF in 2030 would be about 1.3 times those in 2000. Li et al. [14] projected an increasing global importance of nitrate DRF in the future especially over East Asia based on a global atmospheric general circulation model. With the Hadley Center global climate model, Bellouin et al. [15] suggested that nitrate will partially replace sulfate to become an important anthropogenic pollutant in the remainder of 21st century in terms of radiative effects.
Although nitrate plays important roles in environment and climate change, concerns paid to nitrate are much less than other aerosol types such as sulfate, black carbon, and mineral dust, especially over East Asia/China where intensive emissions of nitrate precursors (NOx) exist. Previous studies on nitrate aerosol over East Asia/China were limited although nitrate accounts for a large fraction of anthropogenic aerosols. Most of those studies only investigated the spatial distribution of nitrate concentration in a short time period and model comparison with observation was usually insufficient (e.g., [18,19,20,21]). Thus far, only a few studies were conducted regarding DRF due to nitrate in East Asia/China [22,23,24] in which nitrate was found to be important in estimating aerosol radiative and climatic effects. Given the above limitation, this study aims to investigate seasonal variations of nitrate concentration and its direct radiative forcing over East Asia by using an online-couple regional climate model (RIEMS-Chem: Regional Integrated Environmental Model System with atmospheric chemistry).
This paper is organized as follows: First, RIEMS-Chem and relevant inputs and observational data are described. Then, model comparison with in-situ observations of surface nitrate concentration will be conducted. Finally, the regional distribution and seasonal variation of nitrate concentration and induced DRF are analyzed and the estimation of DRF over East Asia and east China are presented. This study provides valuable information for further understanding the aerosol’s roles in radiation and climate change in this region and for global estimation of nitrate aerosol.

2. Model and Data Descriptions

2.1. Model Description

RIEMS-Chem is an online-coupled regional climate-chemistry model [25]. It couples the host model RIEMS with full atmospheric chemistry processes. The host model was developed based on the nonhydrostatic dynamic structure of the fifth-generation NCAR/Penn State Mesoscale Model (MM5) [26]. It includes several sub-models and parameterizations to describe a series of important physical processes, such as the Biosphere-Atmosphere Transfer Scheme (BATS) for land surface process [27], the Medium-Range Forecast (MRF) scheme for planetary boundary layer process [28], the Grell cumulus convective parameterization scheme [29], and a modified radiation sub-model based on the radiation package of the NCAR Community Climate Model (CCM3) [30] for radiation transfer calculation. RIEMS has been successfully used to simulate East Asian monsoon climate and to explore the interaction among physical, biological, and chemical processes [31,32,33]. RIEMS is also one of the key models participating in the Regional Climate Model Inter-comparison Project (RMIP) for Asia [34].
Chemistries in RIEMS-Chem include CB-IV gas phase mechanism [35], ISORROPIA thermodynamics model [36], aqueous phase chemical reactions [37], and heterogeneous reactions [38,39]. Major aerosol components, namely sulfate, nitrate, ammonium, black carbon (BC), organic carbon (OC), other anthropogenic particulate matters (AnthPM), dust, and sea salt are considered in this model. Nitrate and ammonium aerosols are formed via thermodynamic equilibrium process represented by ISORROPIA. Nitrate formation through aqueous phase reaction is considered as well using a treatment similar to that in Chang et al. [37]. Nine heterogeneous reactions of gaseous species (SO2, NO2, HNO3, O3, N2O5, NO2, NO3, OH, and HO2) on dust surface are parameterized and incorporated into RIEMS by Li and Han [39]. Based on the OPAC database (Optical Properties of Aerosols and Clouds), which was introduced in detail by Hess et al. [40], a lognormal size distribution is assumed for inorganic aerosols (sulfate, nitrate, ammonium), with median radius of 0.07 µm and geometric standard deviations of 2.0, respectively. Dust deflation and sea salt generation are calculated using the same schemes as those in Han et al. [41], but five size bins (0.1–1.0, 1.0–2.0, 2.0–4.0, 4.0–8.0, 8.0–20.0 μm) are used to save computation time.
Dry deposition velocities of gases are parameterized by the scheme of Walmsley and Wesely [42]. Dry deposition velocities of aerosols are calculated as the inverse of total resistances plus the gravitational settling term for different aerosol types and sizes. Below-cloud scavenging of aerosols is parameterized based on an expression scavenging rate which is a function of precipitation rate and collision efficiency of particle by hydrometeor [41].
A Mie-theory based parameterization proposed by Ghan and Zaveri [43] is used to calculate aerosol optical properties including extinction coefficient, single scattering albedo, and asymmetry factor. The advantage of this parameterization is that aerosol optical properties are pre-calculated by a Mie code and then fitted by Chebyshev polynomials to create a table of polynomial coefficients. By using this table, the calculation of aerosol optical properties becomes much faster than the traditional Mie solution. The kappa (κ) parameterization [44,45,46] with the form of
g ( R H ) = ( 1 + κ × R H 1 R H ) 1 3
is adopted to represent aerosol hygroscopic growth. g(RH), RH, and κ denote aerosol diameter hygroscopic growth factor, fractional relative humidity, and aerosol hygroscopicity parameter, respectively. Values of κ for inorganic components (sulfate, nitrate, and ammonium) are set to 0.65 [47]. DRF is estimated as the differences in the net radiative fluxes at the top of the atmosphere (TOA) or at the earth’s surface. At one model time step, radiative fluxes are calculated twice, with and without aerosols. The model with above treatment performs well for aerosol optical depth compared with AERONET and MODIS measurements in east China in previous studies [48,49]. More details on RIEMS-Chem also refer to Han et al. [50].
The domain in this study covers most of East Asia. The model applies a Lambert conformal projection with 60 km horizontal resolution, and 16 sigma layers distribute unevenly in the vertical direction with eight layers in the boundary layer. Monthly varied anthropogenic emissions (SO2, NOx, CO, NMVOC, BC, primary OC, etc.) with 0.25° × 0.25° resolution for the base year 2010 are from the MIX emission inventory prepared for the Model Inter-Comparison Study for Asia (MICS-Asia) [51] and the biomass burning emissions with 0.5° × 0.5° resolution are derived from the IPCC AR5 (the Intergovernmental Panel on Climate Change Fifth Assessment Report) inventory [52]. The above emissions are bilinearly interpolated to the model projection. NOx emission (figure not shown) is mainly concentrated in north China and east China, with intensive emissions in megacities such as Beijing, Tianjin, Nanjing, Shanghai, Wuhan, Guangzhou, etc. The NOx emission over East Asia shows the maximum in winter (Table S1). The seasonality of NOx emission over east China (20°N–42°N and 100°E–123°E) resembles that over East Asia but the mean intensity is about 15–16 times larger (Table S1).
The simulation period is from 1 December 2009 to 31 December 2010, with the first month as the model spin up. Six hourly NCEP (National Centers for Environmental Prediction) final reanalysis data [53] with 1.0° × 1.0° resolution is used to provide initial and boundary conditions for meteorology fields. Boundary conditions of chemical species are derived from MOZART-4 (Model for Ozone and Related chemical Tracers, version 4 [54] simulations and updated every six hour.

2.2. Observations

Monthly mean surface nitrate concentration observations for 2010 are obtained from Acid Deposition Monitoring Network in East Asia (EANET) [55]. The EANET is a regional cooperation project aimed at sharing acid deposition data and at reaching a common understanding on the state of acid deposition problems among participating countries. This network began its regular monitoring in January 2001. Until now, 13 countries have participated in this network, namely China, Indonesia, Japan, Malaysia, Mongolia, Philippines, Republic of Korea, Russia, Thailand, Viet Nam, Cambodia, Laos PDR, and Myanmar. Nitrate is measured using a filter pack method at EANET sites. Data quality is assured using a rigid and common quality assurance/quality control (QA/QC) program. Monitoring sites used in this study (Figure 1) are classified into three types: urban, rural, and remote. There are only one urban site (Hongwen) in China, two rural sites (Kanghwa and Imsil) and one remote site (Cheju) in Republic of Korea, and two urban sites and four remote sites in Japan.
Because there is only one EANET site in China providing nitrate measurement, observations of nitrate around the year 2010 in China are also collected from previous publications for model validation.

3. Model Results

3.1. Comparison with Surface Nitrate Observations

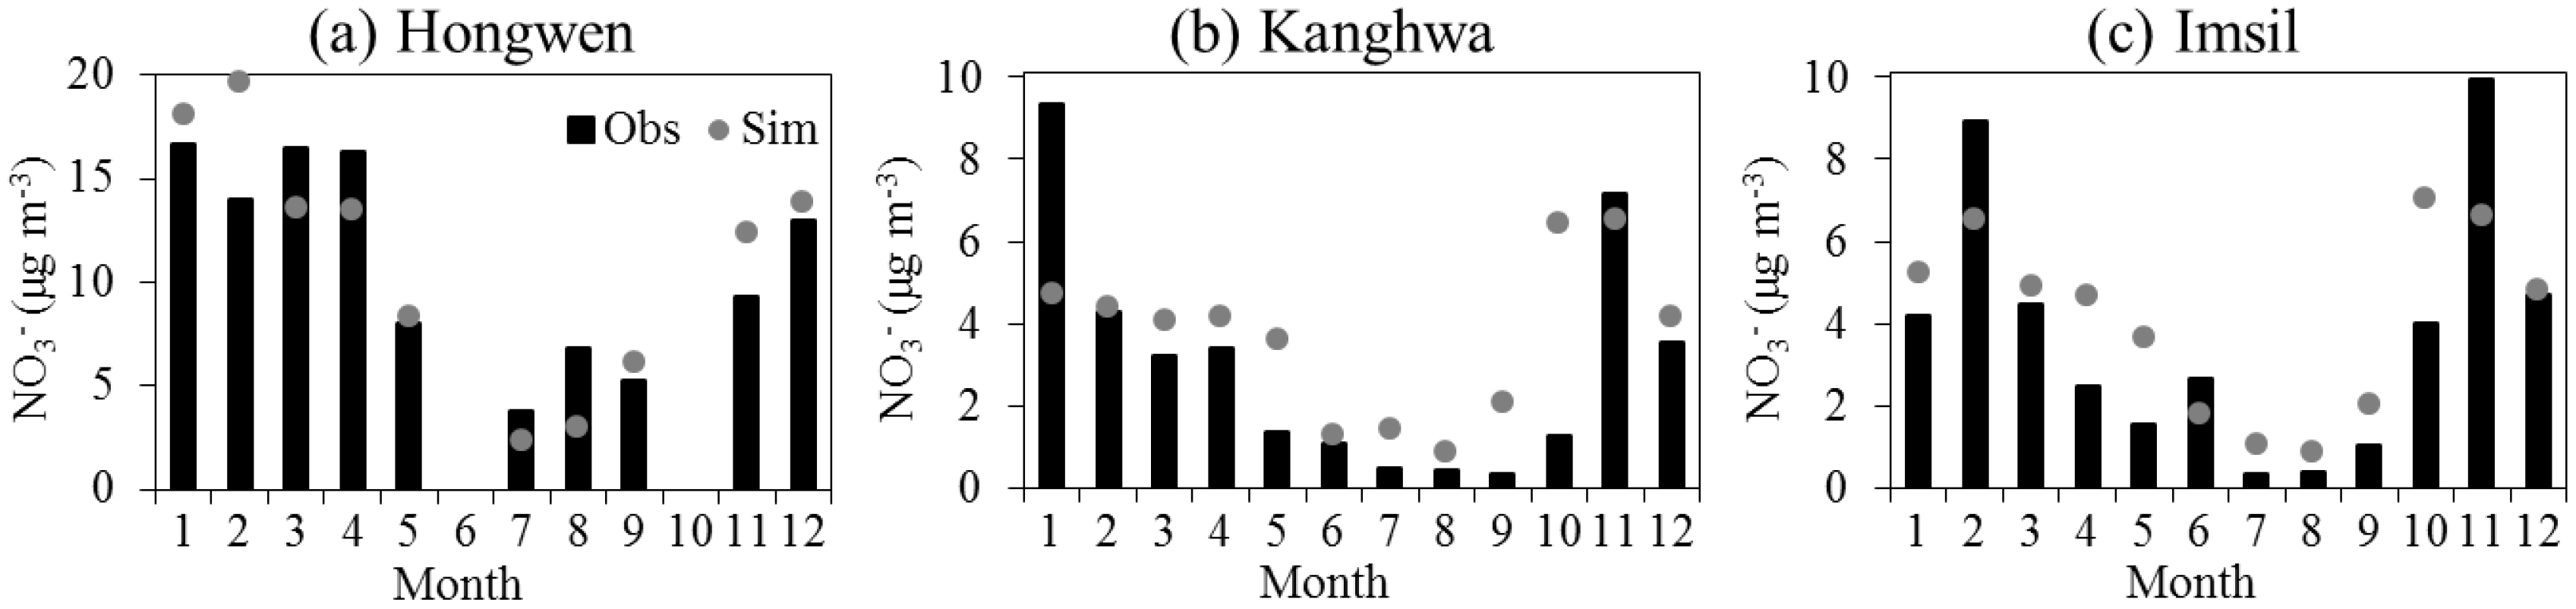
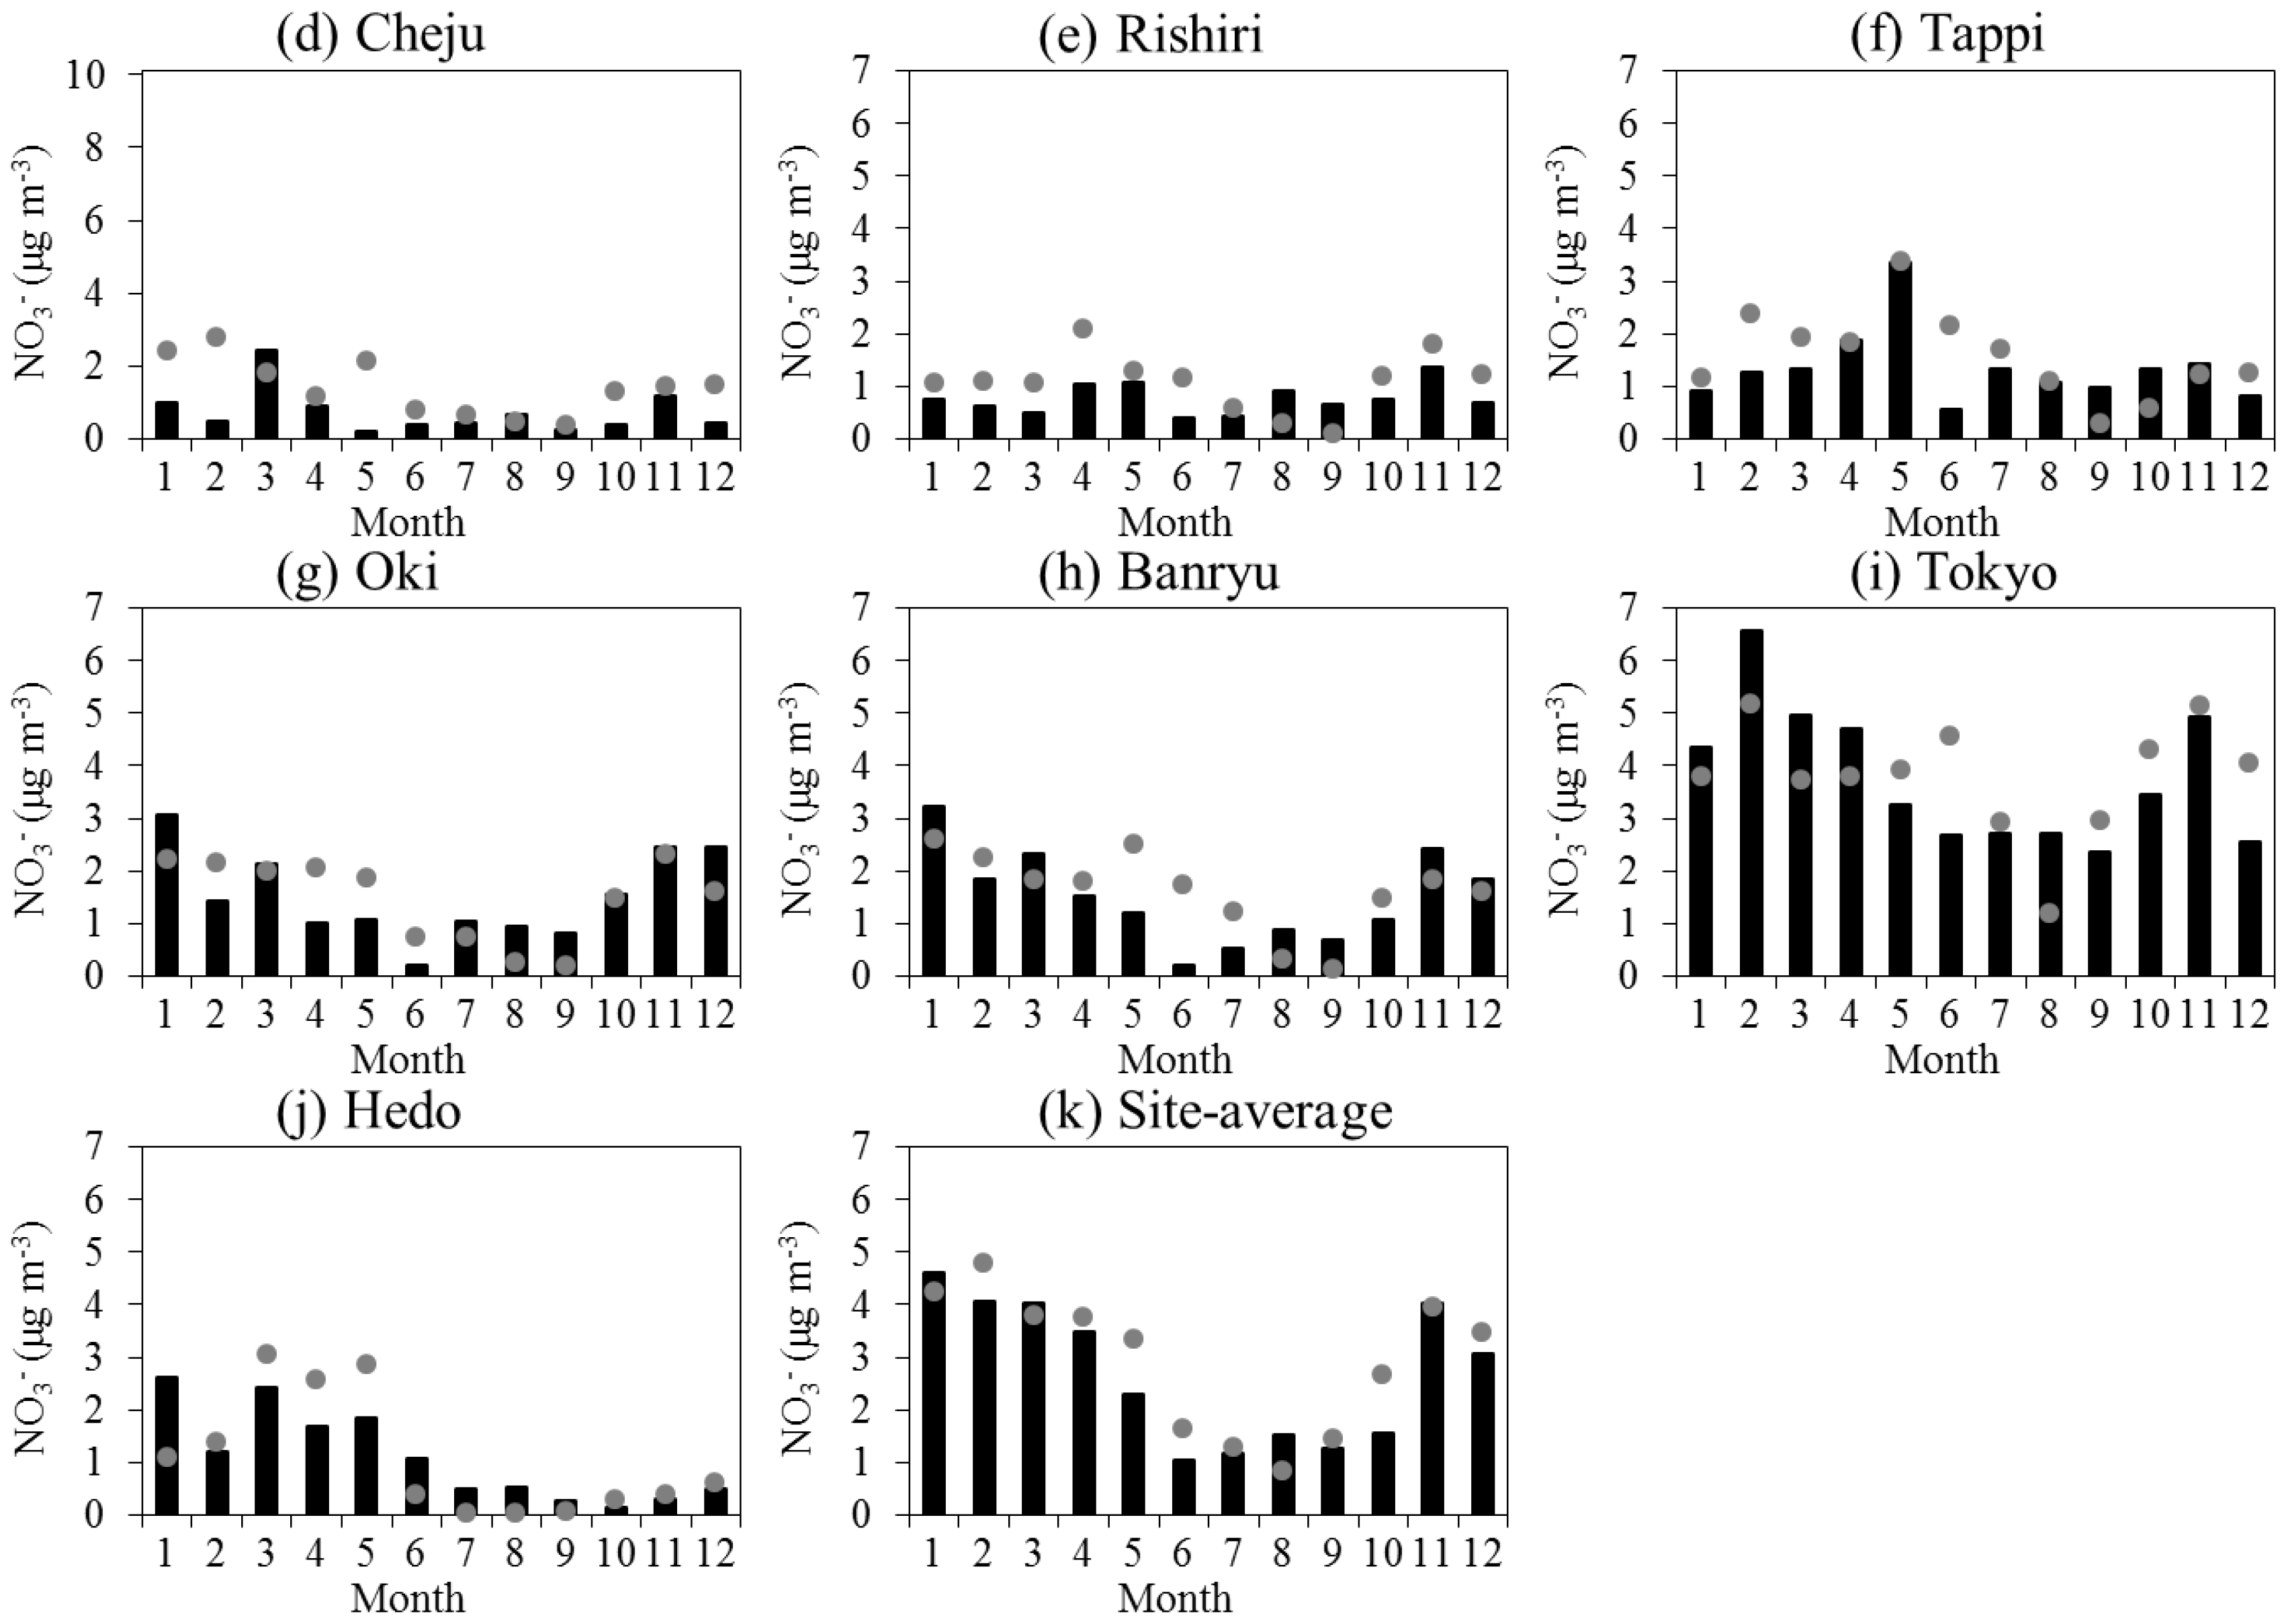
3.1.1. Comparison with EANET Data

First, the modeled nitrate concentration was compared with EANET observations. Figure 1 shows the monthly mean nitrate concentrations in 2010 at ten EANET sites and the statistics for model performance are listed in Table 1. The Hongwen site (Figure 1a) located in southeast China showed higher nitrate concentration observed in winter and spring (January to April and December, 13–17 μg·m−3) than that in summer and autumn, with annual mean of 11.0 μg·m−3. The model reproduced the seasonality and magnitude quite well, with the annual mean of 11.1 μg·m−3 and the correlation coefficient (R) of 0.87 for monthly mean values.
The Kanghwa and Imsil sites in Korea (Figure 1b,c) exhibited higher levels in winter (~9 μg·m−3) and late autumn (November, 6–10 μg·m−3), followed by spring (1–5 μg·m−3), and the lowest levels in summer and early autumn (July to September, <1 μg·m−3). The model generally reproduced the seasonal variation but tended to predict lower values in winter and higher values in autumn at both sites. The remote site Cheju showed similar variation pattern to the above two sites but with much lower levels (Figure 1d). The observed annual mean nitrate concentrations in Kanghwa, Imsil, and Cheju were 3.0 μg·m−3, 3.7 μg·m−3, and 0.7 μg·m−3, while the model simulations were 3.7 μg·m−3, 4.1 μg·m−3, and 1.4 μg·m−3, with R of 0.63, 0.81, and 0.22, respectively. The relatively large model bias at Cheju site could be associated with the coarse model resolution, which could not well represent the large gradients in terrain and land use. The Cheju site is located on a sharp sea cliff; specific local circulation and sea salt process could affect evolution of nitrate aerosol, but cannot be reflected well in the model.
The monthly variation was not evident in the remote site Rishiri in north Japan (Figure 1e) due to low emissions there and frequent influence by clean air from the sea. The model reproduced the seasonal variation but tended to generally overpredict observations. The observed and simulated nitrate concentrations in Rishiri were 0.8 μg·m−3 and 1.1 μg·m−3, respectively, with R of 0.5. Differently, the other site Tappi in north Japan displayed apparent higher nitrate levels than in Rishiri (Figure 1f), with maximum reaching 3.4 μg·m−3 in May, which was mainly due to local sources because long-range transport from continent was not strong at this time. The model overpredicted observation in June mainly due to an underprediction of precipitation and thus wet scavenging. Oki (Figure 1g) and Banryu (Figure 1h) are close in location and nitrate concentrations showed similar levels and monthly variations, lower in summer than those in the other seasons, which were also well captured by the model except overprediction in summer in Banryu. Nitrate level in Tokyo (Figure 1i) was the highest among the Japanese sites, with the monthly mean concentrations in a range of 2.4–6.6 μg·m−3, and the annual mean value of 3.8 μg·m−3. The seasonality of nitrate in Tokyo resembled those in Oki and Banryu, showing maximums in winter and minimums in summer. The model reproduced the monthly variation quite well except for the overprediction in June. The annual mean nitrate concentration was accurately predicted (3.8 μg·m−3) in Tokyo, with a moderate R of 0.56. Hedo is a remote site located in the downwind ocean area of the East Asian continent (Figure 1j). When northwesterly winds prevailed in winter and spring, aerosols can be transported to Hedo, resulting in an elevation of nitrate concentration (1.2–2.6 μg·m−3), whereas in summer when southeasterly winds prevailed, clean air from remote ocean dominated this site, leading to a much lower nitrate level (0.1–0.5 μg·m−3). The simulated seasonality was consistent with observation reasonably well, but the model predicted a lower nitrate level in summer. The simulated nitrate concentration in terms of annual mean in Hedo was 1.1 μg·m−3 with R of 0.78, agreeing well with observation (1.1 μg·m−3).
The monthly mean nitrate concentrations averaged over all the ten EANET sites are also presented to illustrate the typical seasonal variation of surface nitrate concentration and the overall model performance over East Asia (Figure 1k). It is encouraging that the model simulation agreed with observation quite well in terms of both seasonal variation pattern and magnitude, with the maximum of about 4 μg·m−3 in winter and the minimum of 1.5 μg·m−3 in summer. The annual mean nitrate concentrations for all sites were 2.7 μg·m−3 and 2.9 μg·m−3 from observation and simulation, respectively, with an overall correlation coefficient of 0.92. Both EANET observation and simulation also demonstrated that nitrate concentration was higher over the continent than in the western Pacific region (Korea, Japan).

3.1.2. Comparison with Observations across China

As there was only one EANET site in China reported nitrate concentration in 2010, observations conducted in China from previous publications around the year 2010 were also collected and used for model validation. Observations were mainly conducted in major cities (Table 2) locating in north China (Shangdianzi, Beijing, Tianjin, Shijiazhuang, and Chengde), east China (Nanjing), central China (Wuhan), south China (Guangzhou), and northwest China (Xi’an). Filter pack methods were applied in the above observations. It was noticed that in north China, nitrate concentrations were apparently higher in urban areas (Beijing, Tianjin, and Shijiazhuang) than those in rural and remote areas (Shangdianzi and Chengde). Shijiazhuang exhibited the highest annual mean concentration (30.4 μg·m−3) among all sites mainly due to the intensive emission there (Table S1). Beijing and Tianjin had nitrate levels of about 20 μg·m−3, whereas Chengde experienced the lowest nitrate level (5.8 μg·m−3). Both Beijing and Tianjin showed the highest nitrate concentrations in summer, followed by autumn and spring, and the lowest one in winter. It was noticed that although NOx emissions were low in Beijing and Tianjin in summer, NOx emission in the north China Plain was very high (in a similar level to the winter maximum) during this season (Table S1). The strong northward (under prevailing southerly winds) transport effect of emissions from the north China Plain could lead to elevated nitrate concentrations in the two cities. Besides, stronger chemical oxidation in summer in this region may also enhance nitrate formation as proposed by [56]. The minimum concentration occurred in winter in these cities mainly due to frequent passage of strong westerly winds and weak photochemical activity in the cold season. The model reasonably captured the major features in seasonal variation in Beijing and Tianjin but predicted lower nitrate levels in spring and winter due to uncertainties in prediction of meteorological variables and emission inventories. Differently, the observed maximum nitrate in Shijiazhuang, another megacity in north China, appeared in autumn. The model failed to predict the autumn maximum possibly due to uncertainties in the emission inventory (peak in summer and winter) (Table S1). Chengde (a rural site) and Shangdianzi (a background site) experienced lower nitrate levels than those in Beijing, Tianjin, and Shijiazhuang. It is well known that there is little anthropogenic emission north and northwest of Chengde and Shangdianzi, and in seasons except summer, northerlies and northwesterlies prevailed in that region. At the two sites, nitrate levels were observed higher in spring than in other seasons. Heterogeneous reactions on the surface of mineral dust, which is often transported from northwest China in springtime, could be a reason [39]. The model generally reproduced the springtime nitrate levels but predicted higher nitrate levels in summer possibly due to an overprediction of the influence from the north China Plain.
The seasonality of nitrate concentration in Nanjing, Wuhan, Guangzhou, and Xi’an were similar to each other and resembled to those at EANET sites (maximum in winter, followed by spring and autumn, and minimum in summer), which was mainly attributed to the seasonality of NOx emission (Table S1). The model well captured such seasonal variation in the above cities except that it predicted lower values by 30%–50% than observations in winter in Nanjing, Wuhan, and Xi’an.
In summary, the seasonality of nitrate concentration in north China generally exhibited the highest nitrate level in summer and the lowest level in winter, whereas that in the other parts of east China showed the maximum nitrate concentration in winter, then in spring and autumn, and the minimum in summer, same as those at EANET sites. In general, the annual mean nitrate concentrations averaged over all the sites in China were 15.6 μg·m−3 and 12.3 μg·m−3 from observation and simulation, respectively, and exhibited a decreasing level from north China to south China.
The above comparisons between model simulation and observation from EANET dataset and field experiments in east China demonstrated that RIEMS-Chem was capable in reasonably reproducing the major features in spatial distribution and seasonal variation of nitrate concentration over East Asia.

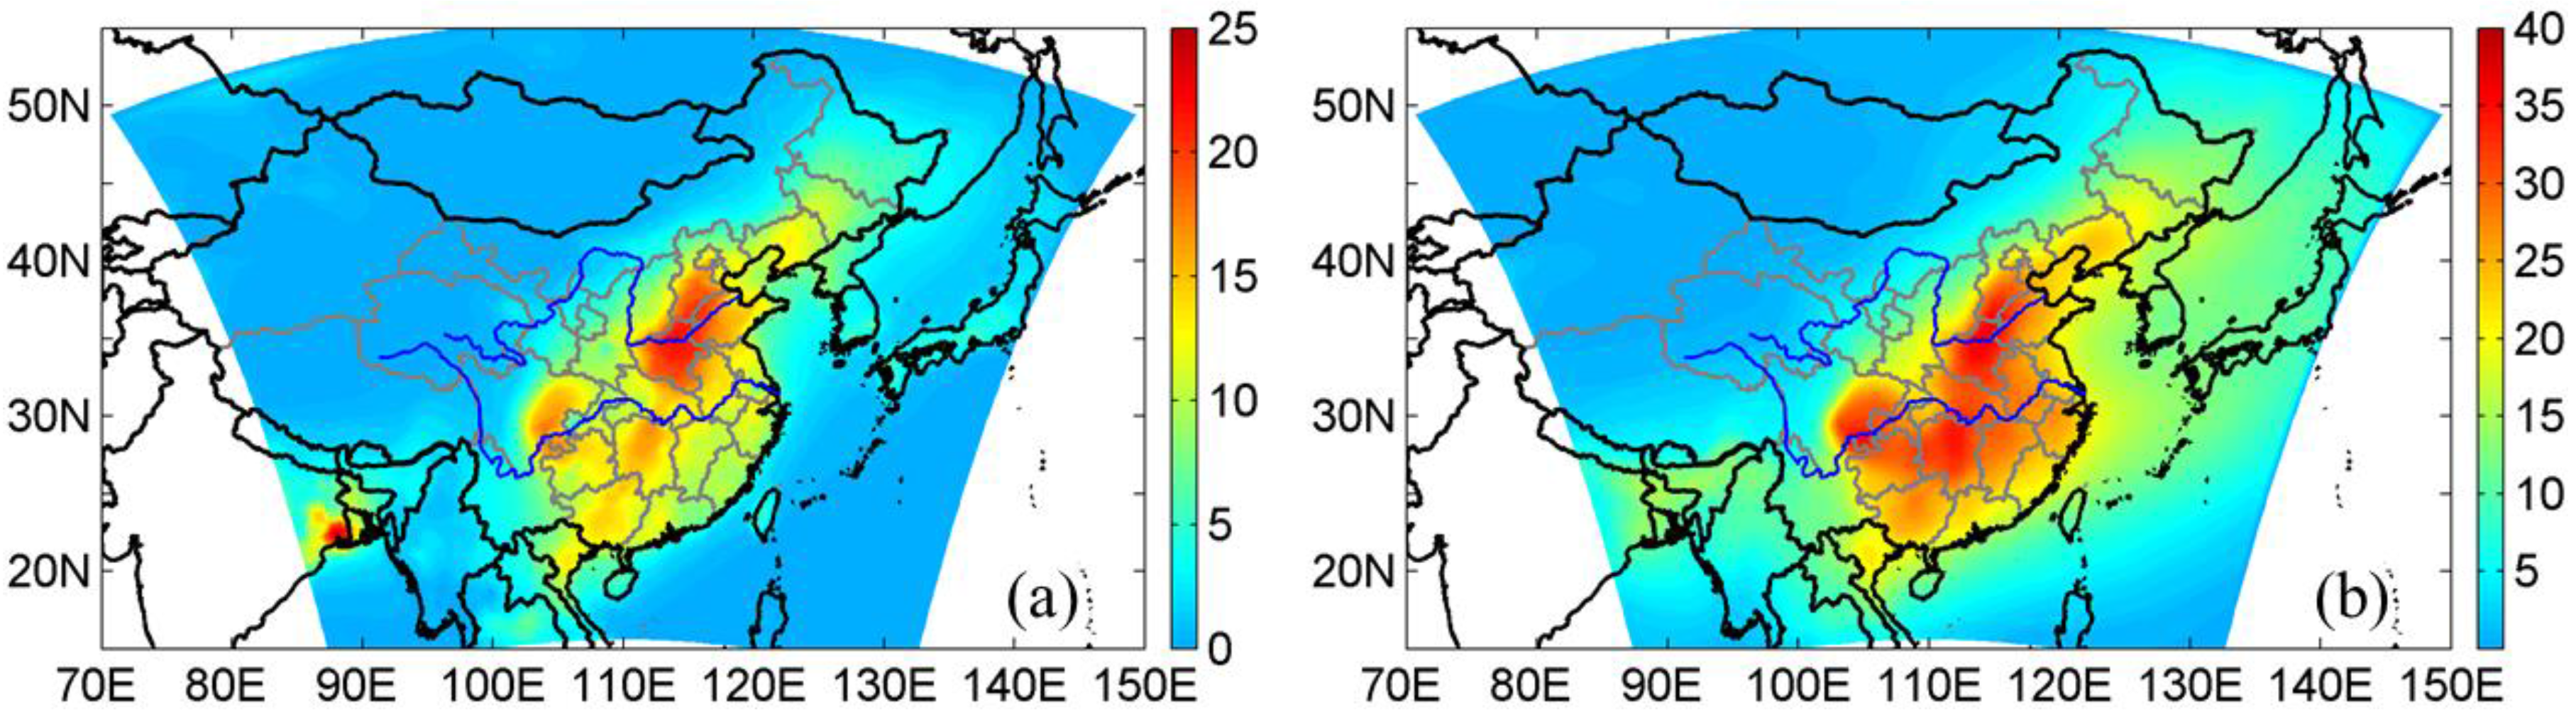
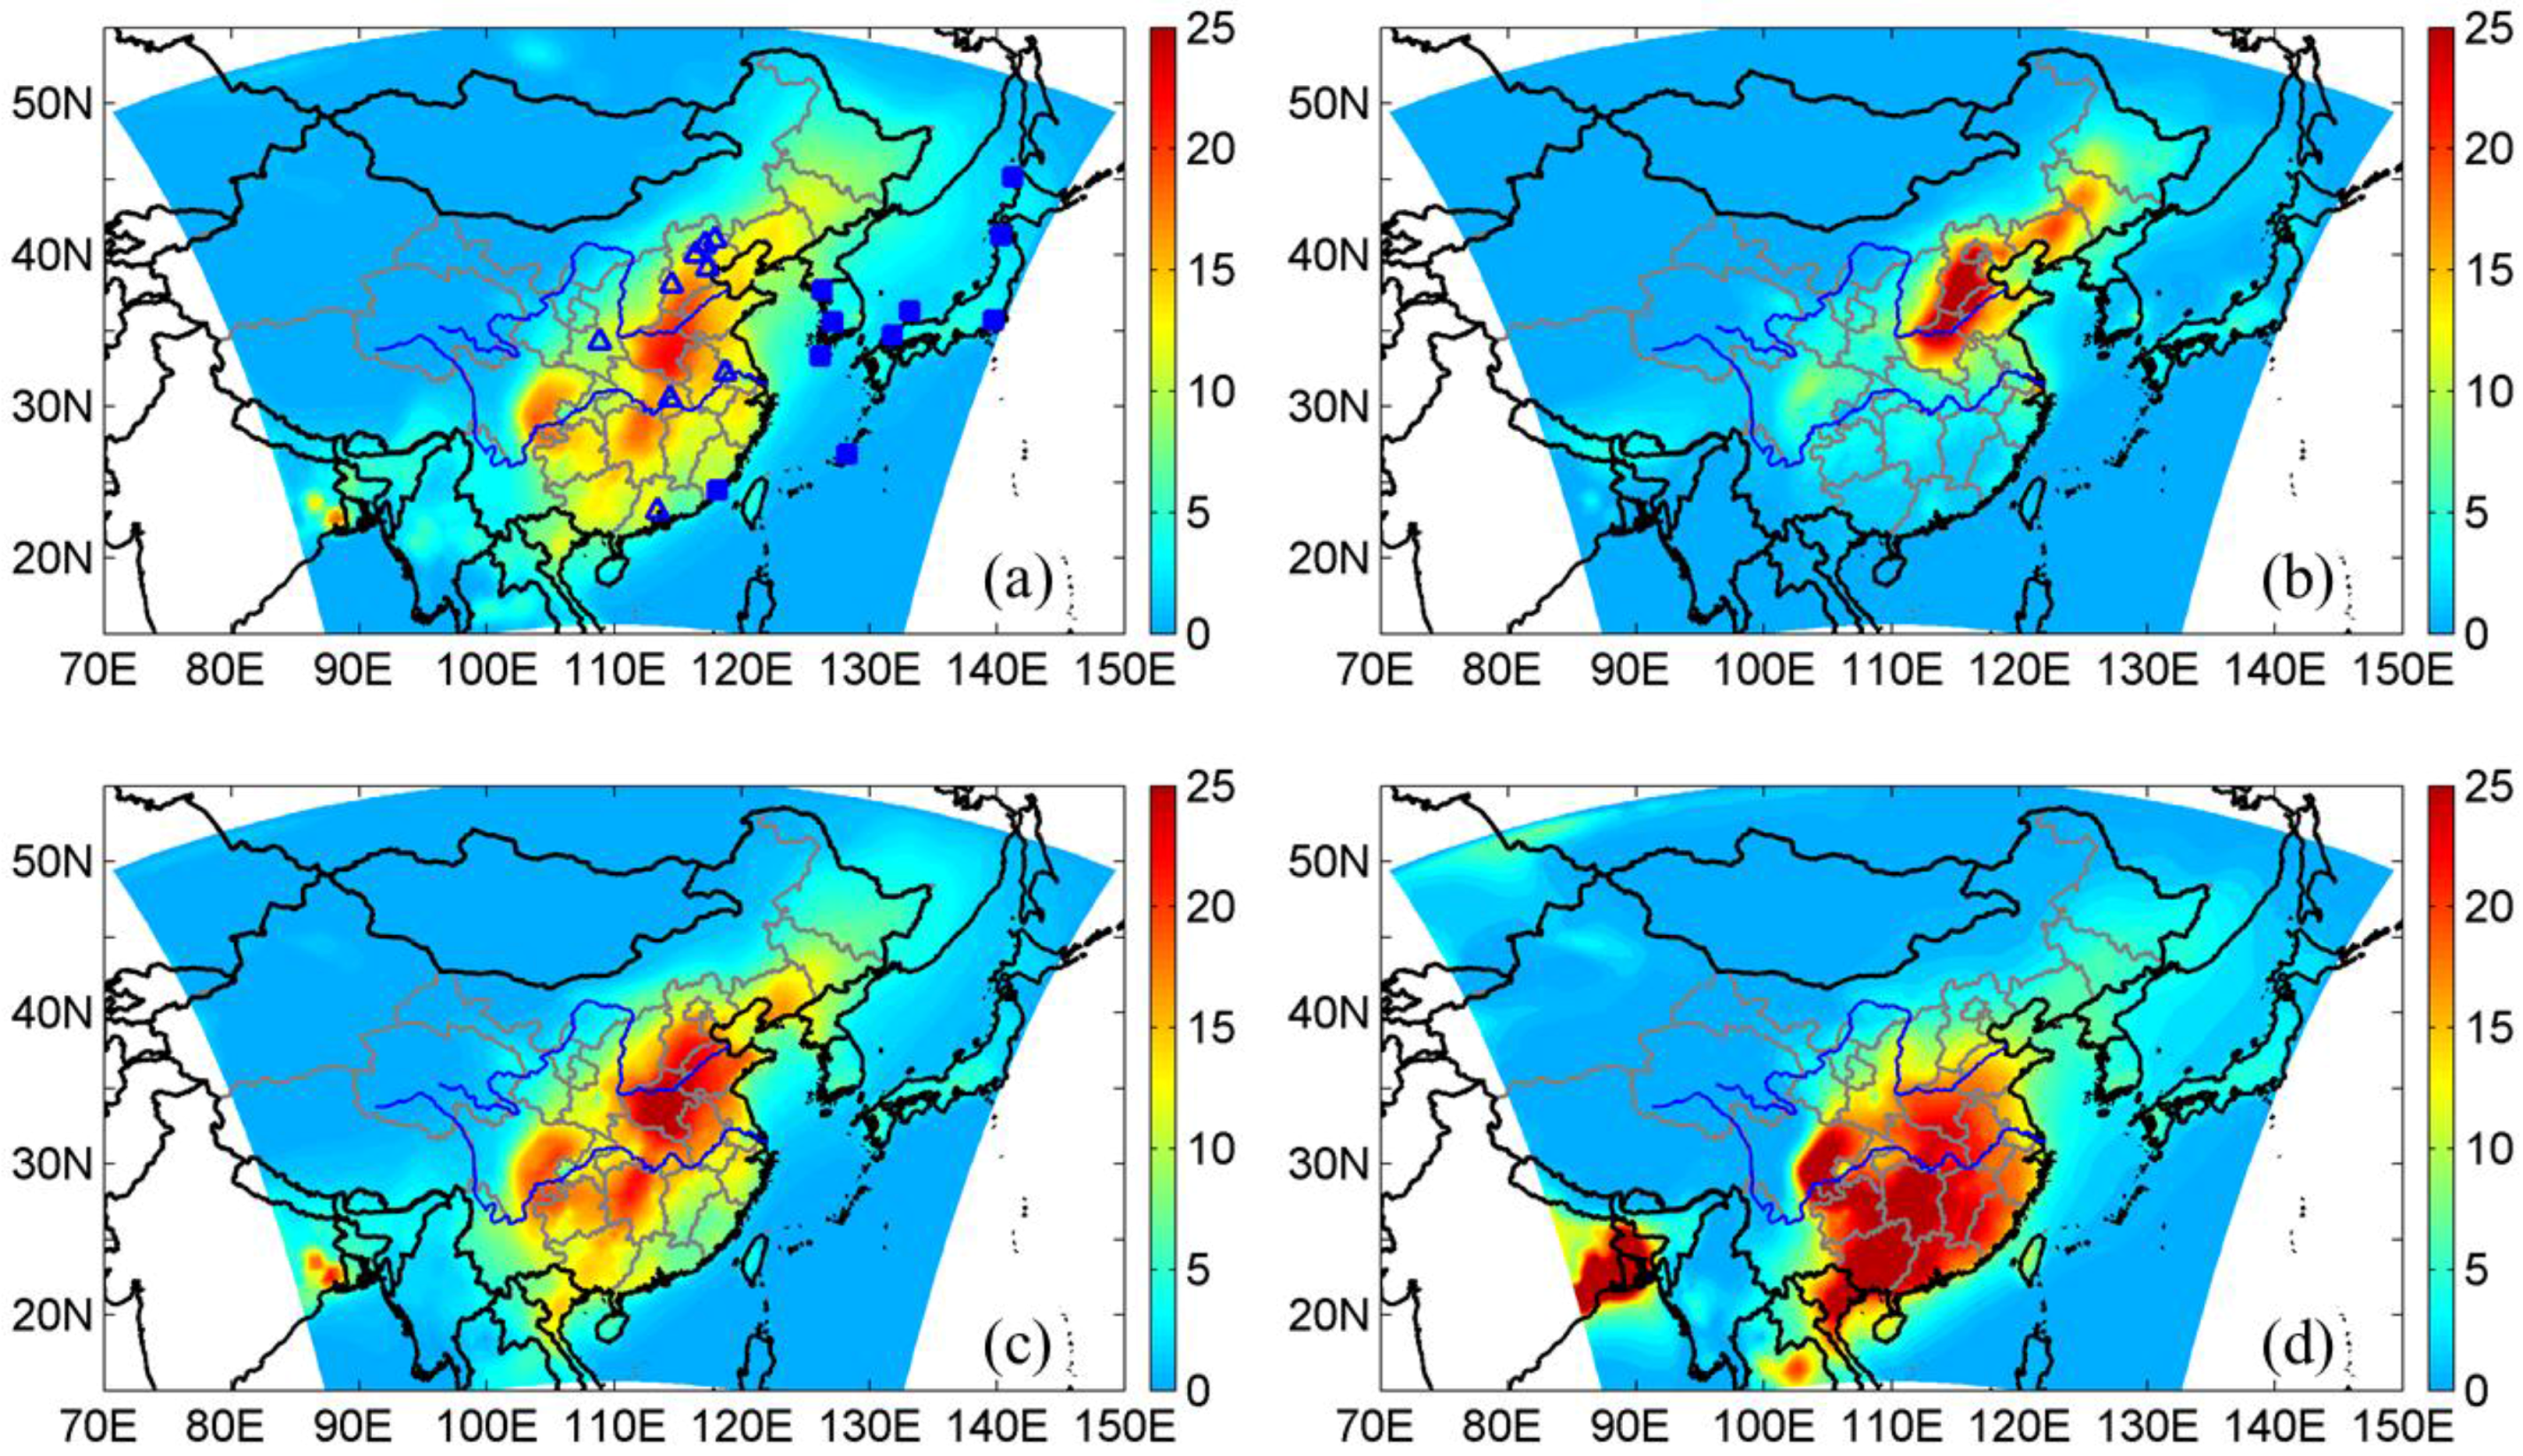
3.2. Nitrate Distribution in East Asia

Distributions of seasonal mean surface nitrate concentration are presented in Figure 2. Nitrate concentration in spring (Figure 2a) was general higher in the areas including south of the north China Plain and Henan province with mean values in a range of 15–25 μg·m−3. Hunan province and the Sichuan basin also experienced relatively high nitrate levels (15–20 μg·m−3). It was noted that nitrate concentration over the Bohai Sea was as high as ~14 μg·m−3 because of the eastward transport from the north China Plain under prevailing westerly. In summer (Figure 2b), nitrate aerosols were distributed in the north China Plain and the south portions of northeast China, with the maximum exceeding 25 μg·m−3 in the north China Plain. In other regions, such as the Sichuan basin, south of the Yangtze River, the Korean Peninsula, and Japan, nitrate concentrations became much lower due to larger precipitation and efficient wet scavenging as well as relatively clean marine air mass from the western Pacific under southeasterlies. Nitrate distribution in autumn (Figure 2c) resembled that in spring, but had higher level of 15–25 μg·m−3 in most areas of east China. It was noteworthy that the distribution pattern in winter (Figure 2d) was different from those in other seasons: nitrate concentrations were simulated to be higher in southern China and the Sichuan basin (20–25 μg·m−3), and decreased with increasing latitude, ranged from 15–20 μg·m−3 in areas between the Yangtze and the Yellow Rivers, and further to about 5–10 μg·m−3 in the north China Plain. Low temperature both favored formation of nitrate aerosol and reduction of vertical mixing, resulting in relatively higher nitrate level in winter, but the relatively weak photochemical activity and more effective wet scavenging by snow could reduce nitrate concentration at high latitudes.
The annual mean distribution of nitrate concentration near the surface (Figure 3a) was characterized by high levels of 15–25 μg·m−3 in the lower reaches of the Yellow River (including south of the north China Plain and Henan province) and in the Sichuan basin. In the middle to lower reaches of the Yangtze River and south China, nitrate concentrations ranged from 5 μg·m−3 to 15 μg·m−3. Relatively low nitrate levels (5–10 μg·m−3) occurred in southeast China and northeast China. The Korean Peninsula and Japan experienced lower nitrate concentration than those in east China, in a range of ~5 μg·m−3. Figure 3b shows the distribution of annual mean column concentration of nitrate, which was generally similar to that of the surface concentration, with values of 25–35 mg·m−2 over broad areas of east China, and 10–15 mg·m−2 in the Korean Peninsula and Japan.
The domain averages of annual and seasonal mean nitrate concentration over East Asia and east China (20°N–42°N and 100°E–123°E) are listed in Table 3. Seasonality of nitrate concentrations in East Asia and east China both showed the maximum in winter (4.2 μg·m−3 and 12.9 μg·m−3), followed by spring and autumn, and the minimum in summer (1.6 μg·m−3 and 4.5 μg·m−3), with annual mean value in east China (8.5 μg·m−3) about 3 times that in East Asia (2.9 μg·m−3). The nitrate column concentration reached maximum in autumn (9.3 mg·m−2 and 22.7 mg·m−2) and minimum in summer (6.3 mg·m−2 and 12.9 mg·m−2), with annual mean burden of 8.0 mg·m−2 and 18.6 mg·m−2 for East Asia and east China, respectively.

3.3. Direct Radiative Forcing Due to Nitrate

As already mentioned above, DRF by nitrate was estimated as the differences in the net radiative fluxes at the top of the atmosphere (TOA) or at the earth’s surface with and without nitrate aerosol.

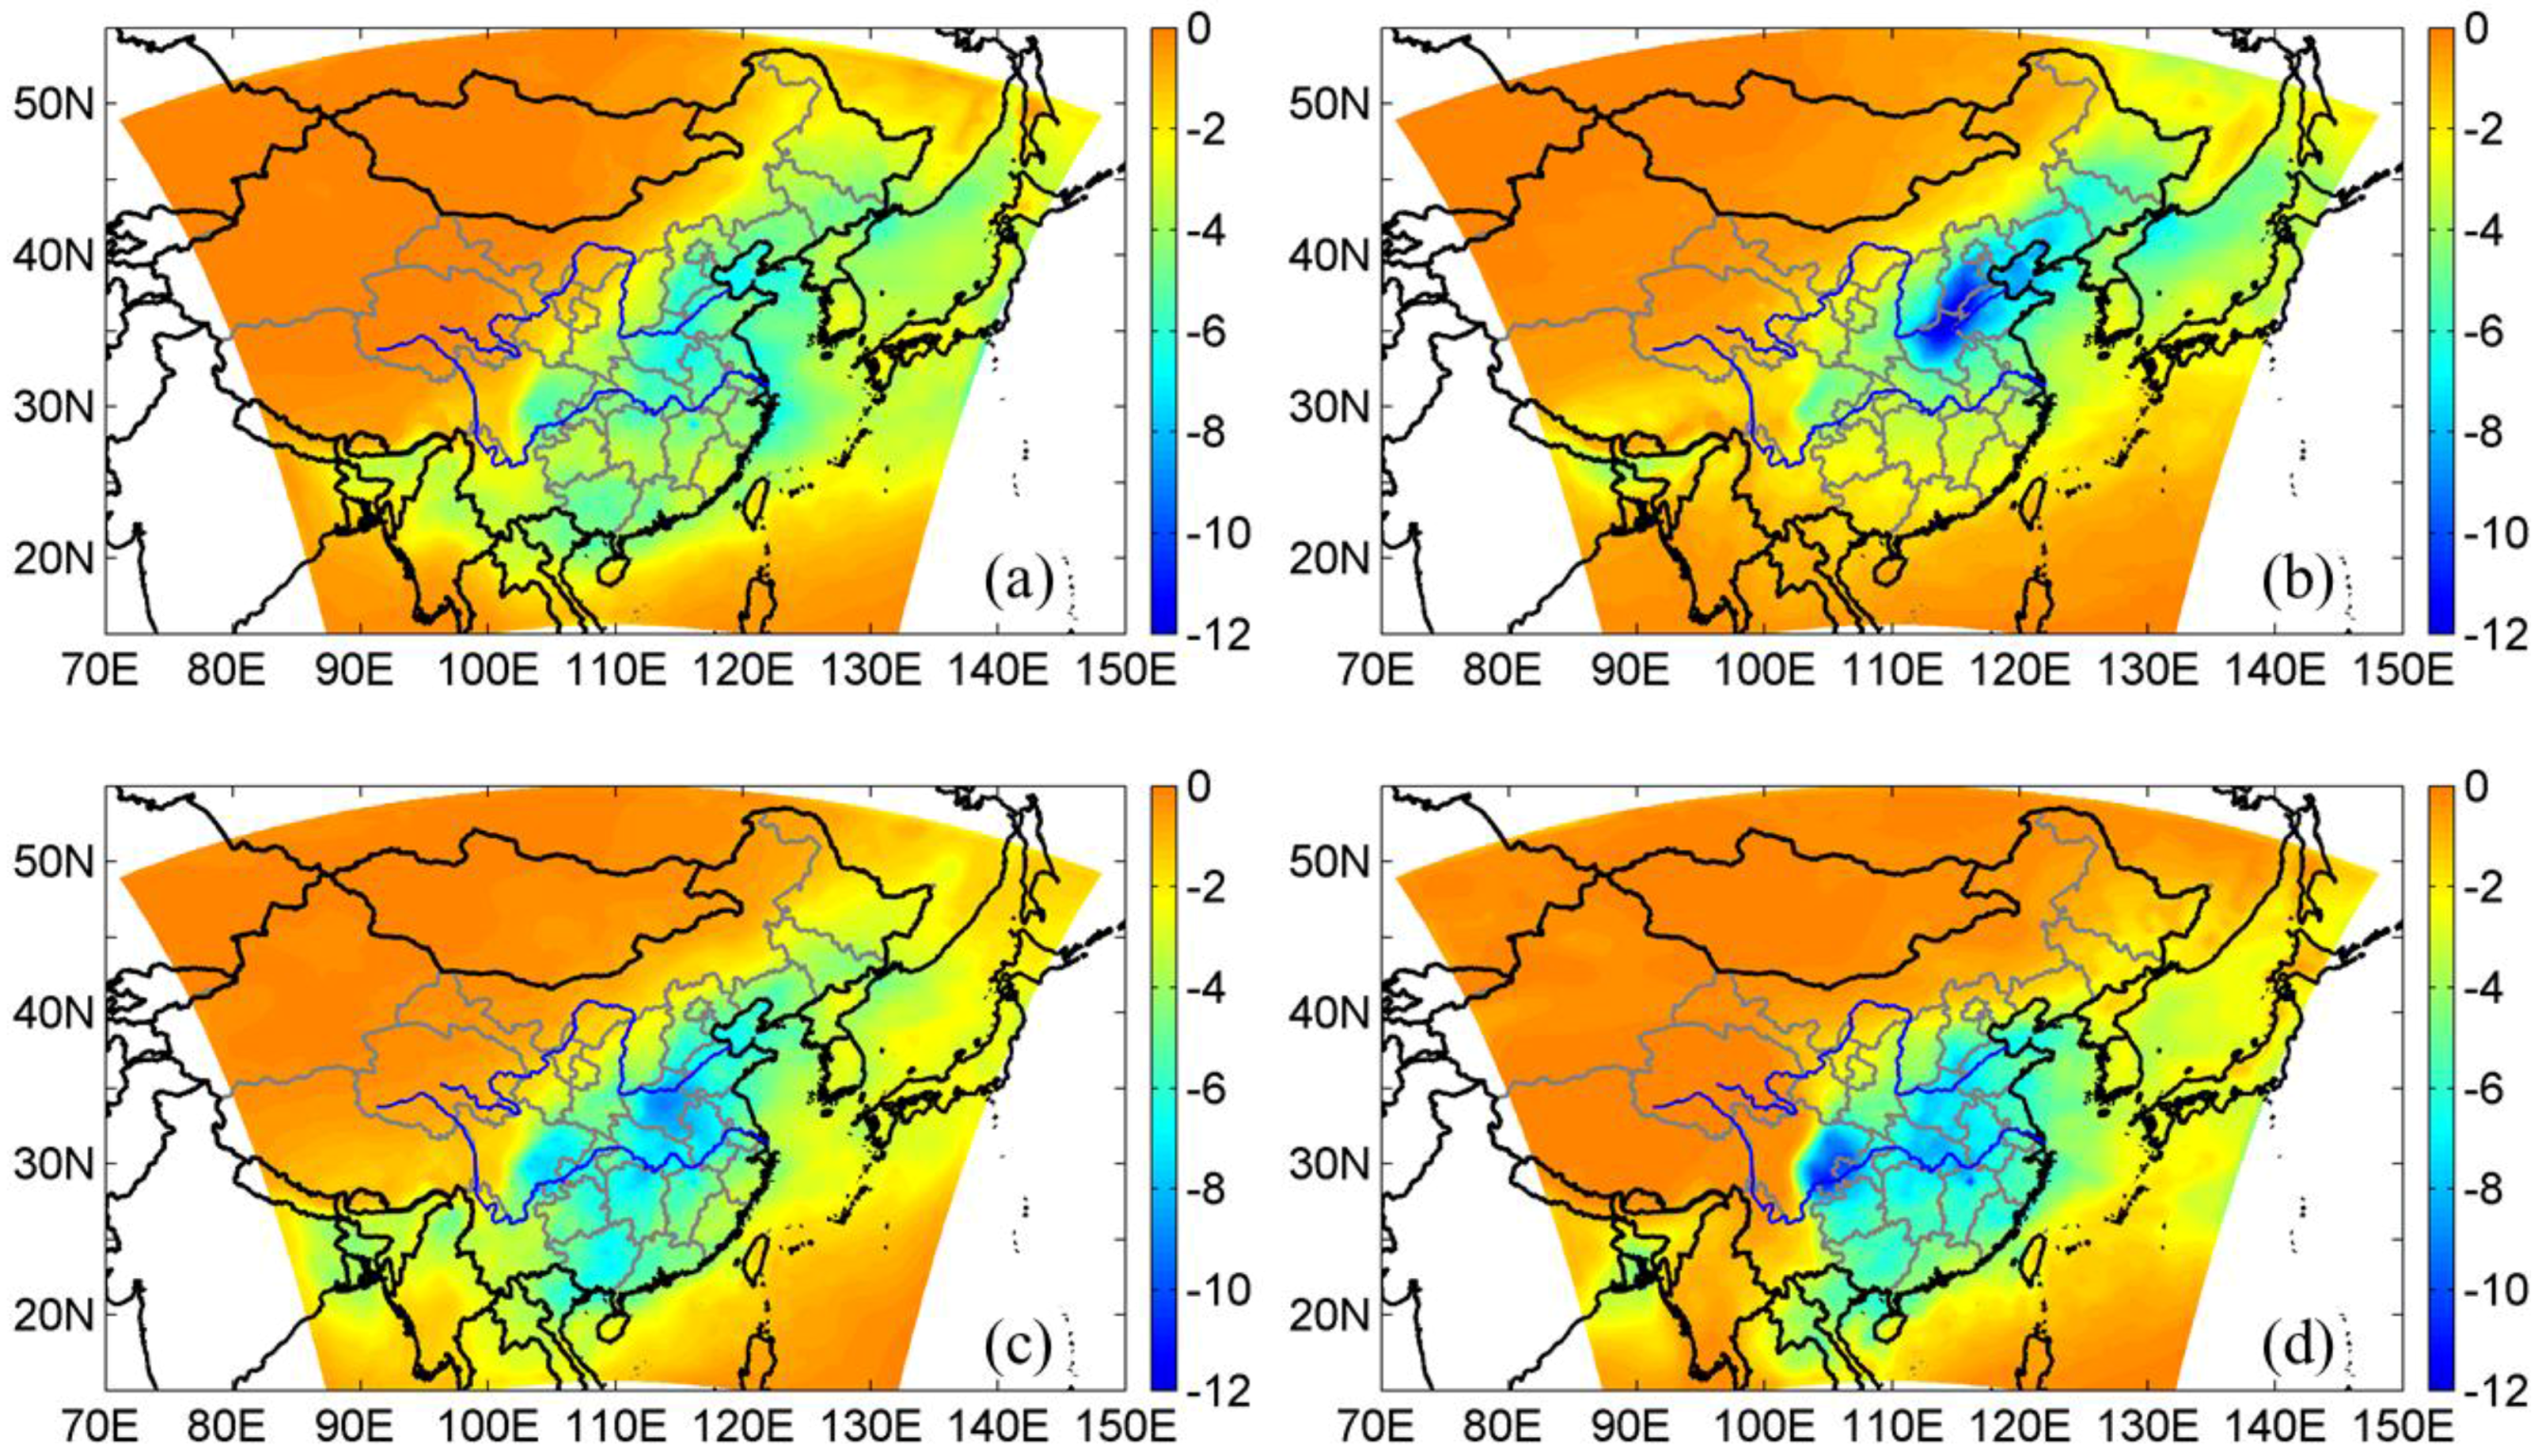
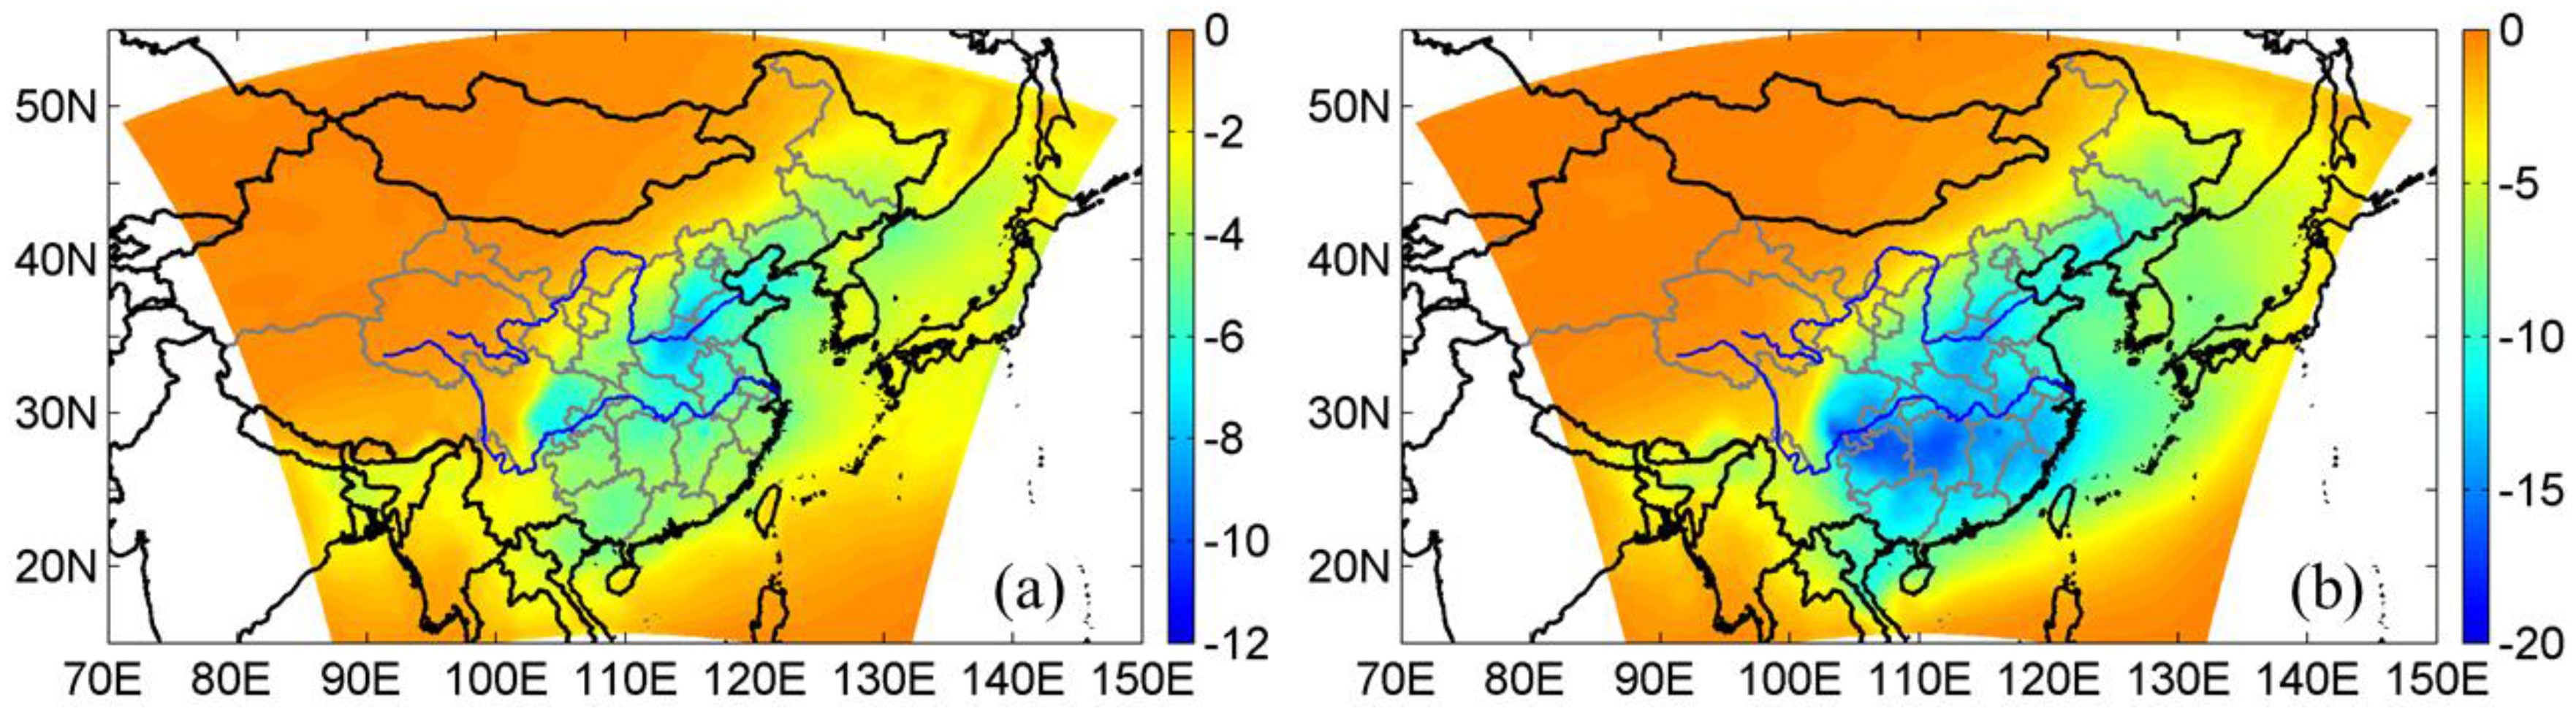
3.3.1. The Distribution of Seasonal Mean DRF Due to Nitrate

Figure 4 shows the spatial distributions of seasonal mean DRF due to nitrate at TOA under all-sky condition. Nitrate exerted a consistent negative forcing in the studying domain in all seasons both at TOA and at the surface (not shown) due to its scattering property. In spring, DRF were mainly distributed over the lower reaches of the Yellow River including the north China Plain, the Bohai Sea, and the East China Sea, with the maximum approaching −6 W·m−2 (Figure 4a). The distribution of DRF in summer was similar to that in spring, with the maximum negative forcing reaching −12 W·m−2 in north China, and DRF over the East China Sea was weakened due to change in wind direction (Figure 4b). In autumn (Figure 4c), DRF in the lower reaches of the Yellow River reached −7 W·m−2, and DRF in southern China and the Sichuan basin (−4–−6 W·m−2) were stronger than those in summer (0–−4 W·m−2). DRF in winter exhibited the maximum as high as −10 W·m−2 in the Sichuan basin, and −5–−7 W·m−2 in central China between the Yellow River and the Yangtze River (Figure 4d). It was noticed that all-sky DRF distribution (Figure 4) did not follow that of surface concentration (Figure 2) exactly because DRF was also associated with distribution of nitrate column concentration and affected by cloud.
Figure 5 shows the spatial distributions of annual mean DRF due to nitrate at TOA under both all-sky and clear-sky conditions. The all-sky DRF (Figure 5a) exhibited maximum (up to −7 W·m−2) over the lower reaches of the Yellow River, about −6 W·m−2 over the Sichuan basin, and −2–−6 W·m−2 over the rest areas of east China. It is noteworthy that the nitrate DRF in the western Pacific regions was at the same level as those in south China, indicating the strong outflow from the continent. In Korean peninsula and Japan, DRF were around −2 W·m−2, apparently lower than that in east China. Figure 5b shows DRF under clear-sky condition, ranging from 0 to −15 W·m−2, which was apparently stronger than that under all-sky condition. Compared with clear-sky condition (Figure 5b), DRF under all-sky condition (Figure 5a) was obviously reduced due to cloud effect, with maximum reduction occurring in south China where cloud occurrence and amount were significantly higher than in north China.
Wang et al. [22] and Zhang et al. [23] simulated the nitrate-induced all-sky DRF at TOA in China by using regional climate models with emission inventories from Streets et al. [8] for the base year 2000. The spatial distribution of the annual mean DRF from this study was generally consistent with their results; however, the magnitude of DRF at TOA was higher in this work, with the maximum value up to −7 W·m−2 over east China, about 2.3 times those in their studies (−3 W·m−2). Considering the fact that nitrate precursor (NOx) emission in China increased by about 85% from 2000 to 2010 [7], the larger DRF was expected and the estimation in this study was realistic.

3.3.2. Seasonal Variation of Domain-Averaged DRF Due to Nitrate

The seasonal mean DRF at TOA and at the surface by nitrate aerosol averaged over East Asia and east China under clear-sky and all-sky conditions are presented in Table 3.
Under clear-sky condition, DRF reached its maximum in spring and its minimum in summer over East Asia and east China both at TOA and at the surface, with stronger forcing in east China than that in East Asia. Annual mean DRF was up to −9 W·m−2 at TOA over east China, more than twice that over East Asia (−3.8 W·m−2). DRFs at TOA and at the surface are almost the same due to strong scattering property of nitrate. It was noteworthy that the nitrate column concentration reached the maximum in autumn, not consistent with the DRF spring maximum. Model results showed higher relative humidity (figure not shown) in the middle and upper troposphere in spring than that in autumn in East Asia. Given the similar level of column burdens between spring (9.0 mg·m−2) and autumn (9.3 mg·m−2), the higher RH could lead to stronger aerosol hygroscopic growth and thus larger DRF in spring than in autumn.
Under all-sky condition, the maximum DRF occurred in autumn, which was consistent with the seasonal variation of column burden. Although clear-sky DRF peaked in spring, it was noted that cloud amount in spring was more than that in autumn as well, thus cloud effect, which tended to reduce DRF by reflecting the incoming solar energy, was larger in spring than in autumn, resulting in larger DRF in autumn than in spring under cloudy condition. In terms of annual average, all-sky DRFs due to nitrate at TOA were estimated to be −1.7 W·m−2 and −3.7 W·m−2 over East Asia and east China, respectively. The global annual mean DRF due to nitrate aerosol reported in the 5th IPCC report was about −0.11 W·m−2 [61], considerably smaller than that over East Asia, especially over east China. This indicates the increasing important role of nitrate aerosol in climate change.

4. Conclusions

The spatial distribution and seasonal variation of nitrate concentration and its radiative forcing in East Asia were investigated by using an online-coupled region climate model RIEMS-Chem. Model validation with a series of in-situ measurements of nitrate concentration from EANET and from China demonstrated that RIEMS-Chem was able to simulate reasonably well the magnitude and seasonal variation of nitrate concentration in this region. Annual mean surface nitrate concentration was higher over the lower reaches of the Yellow River, the middle to lower reaches of the Yangtze River and portions of south China, and was lower in the Korean Peninsula and Japan. Nitrate concentration in Beijing and Tianjin exhibited the maximum in summer and the minimum in winter mainly due to stronger chemical oxidation and regional transport effect of larger emissions from the north China Plain in summer. In most areas of East Asia (including other parts of east China, the Korean Peninsula, and Japan), nitrate concentration generally peaked in winter and lower in summer, which was consistent with the seasonality of NOx emission. The domain averages over East Asia and east China both showed the maximum in winter (4.2 μg·m−3 and 12.9 μg·m−3) and the minimum in summer (1.6 μg·m−3 and 4.5 μg·m−3), with annual means of 2.9 μg·m−3 and 8.5 μg·m−3, respectively. The distribution of annual mean nitrate column concentration was similar to that of the surface. The maximum seasonal mean nitrate burden appeared in autumn (9.3 mg·m−2 and 22.7 mg·m−2) while the minimum in summer (6.3 mg·m−2 and 12.9 mg·m−2) for both East Asia and east China.
Nitrate exerted negative forcing in all seasons both at TOA and at the surface due to its scattering property. DRF due to nitrate at TOA under all-sky condition generally exhibited stronger negative forcing over the lower reaches of the Yellow River, with the maximum annual mean forcing up to −7 W·m−2 there. DRF level was strong over the Sichuan basin (−6 W·m−2), moderate over the rest parts of east China (−2–−6 W·m−2), and relatively low in the Korean Peninsula and Japan (~−2 W·m−2). Compared with clear-sky condition, all-sky DRF was reduced by cloud effect, with maximum reduction occurring in south China. In terms of domain and seasonal average, DRF by nitrate under clear-sky condition reached the maximum in spring and the minimum in summer over East Asia and east China both at TOA and at the surface, associated with the seasonal variations of both column burden and relative humidity. On the contrary, DRF under all-sky condition showed its maximum in autumn, which was consistent with the seasonality of nitrate column burden. The domain and annual mean all-sky DRFs due to nitrate at TOA were estimated to be −1.7 W·m−2 and −3.7 W·m−2 over East Asia and east China, respectively, which were significantly larger than global annual mean, indicating the important role of nitrate aerosol in environment and climate change in this region.

Supplementary Materials

The following are available online at www.mdpi.com/2073-4433/7/8/105/s1, Figure S1: Monthly anthropogenic NOx emission. (a) Beijing, Tianjin, and Shijiazhuang; (b) domain averages for north China (35°N–42°N and 100°E–123°E), south China (20°N–35°N and 100°E–123°E), and north China Plain (36°N–42°N and 113°E–120°E); (c) domain averages for East Asia (the whole domain) and east China (20°N–42°N and 100°E–123°E). Grid resolution is 0.25° × 0.25°, Table S1: Monthly anthropogenic NOx emission used in the simulation (unit: Gg/month/grid). Emission data are extracted from the 0.25° × 0.25° inventory. Regional mean data are presented for East Asia (the whole domain), east China (20°N–42°N and 100°E–123°E), north China (35°N–42°N and 100°E–123°E), south China (20°N–35°N and 100°E–123°E), and north China Plain (36°N–42°N and 113°E–120°E).

Acknowledgments

This study was supported by the National 973 Project of China (No. 2014CB953703) and the National Natural Science Foundation of China (No. 41375151, 41075106, and 41405140). The authors appreciate scientists and staffs of Network Center for EANET for maintaining and offering EANET data.

Author Contributions

Zhiwei Han conceived and designed the numerical experiment. Jiawei Li conducted the experiment and validated and analyzed model results.

Conflicts of Interest

The authors declare no conflict of interest.

References

  1. Zhang, X.Y.; Wang, Y.Q.; Niu, T.; Zhang, X.C.; Gong, S.L.; Zhang, Y.M.; Sun, J.Y. Atmospheric aerosol compositions in China: Spatial/temporal variability, chemical signature, regional haze distribution and comparisons with global aerosols. Atmos. Chem. Phys. 2012, 12, 779–799. [Google Scholar] [CrossRef]
  2. Van Pinxteren, D.; Brüggemann, D.; Gnauk, T.; Iinuma, Y.; Müller, K.; Nowak, A.; Achter, P.; Wiedensohler, A.; Herrmann, H. Size- and time-resolved chemical particle characterization during CAREBeijing-2006: Different pollution regimes and diurnal profiles. J. Geophys. Res. 2009, 114, D00G09. [Google Scholar] [CrossRef]
  3. Yang, F.; Tan, J.; Zhao, Q.; Du, Z.; He, K.; Ma, Y.; Duan, F.; Chen, G.; Zhao, Q. Characteristics of PM2.5 speciation in representative megacities and across China. Atmos. Chem. Phys. 2011, 11, 5207–5219. [Google Scholar] [CrossRef]
  4. Zhang, R.; Jing, J.; Tao, J.; Hsu, S.-C.; Wang, G.; Cao, J.; Lee, C.S.L.; Zhu, L.; Chen, Z.; Zhao, Y.; et al. Chemical characterization and source apportionment of PM2.5 in Beijing: Seasonal perspective. Atmos. Chem. Phys. 2013, 13, 7053–7074. [Google Scholar] [CrossRef]
  5. Wang, H.L.; Zhu, B.; Shen, L.J.; Xu, H.H.; An, J.L.; Xue, G.Q.; Cao, J.F. Water-soluble ions in atmospheric aerosols measured in five sites in the Yangtze River Delta, China: Size-fractionated, seasonal variations and sources. Atmos. Res. 2015, 123, 370–379. [Google Scholar] [CrossRef]
  6. Zhao, M.F.; Huang, Z.S.; Qiao, T.; Zhang, Y.K.; Xiu, G.L.; Yu, J.Z. Chemical characterization, the transport pathways and potential sources of PM2.5 in Shanghai: Seasonal variations. Atmos. Res. 2015, 158–159, 66–78. [Google Scholar] [CrossRef]
  7. Xie, Z.X.; Han, Z.W. Investigation of interannual variations in anthropogenic emission in China based on several emission inventories. J. Univ. Chin. Acad. Sci. 2014, 31, 289–296. (In Chinese) [Google Scholar]
  8. Streets, D.G.; Bond, T.C.; Carmichael, G.R.; Fernandes, S.D.; Fu, Q.; He, D.; Klimont, Z.; Nelson, S.M.; Tsai, N.Y.; Wang, M.Q.; et al. An inventory of gaseous and primary aerosol emissions in Asia in the year 2000. J. Geophys. Res. 2003. [Google Scholar] [CrossRef]
  9. Zhang, Q.; Streets, D.G.; Carmichael, G.R.; He, K.; Huo, H.; Kannari, A.; Klimont, Z.; Park, I.; Reddy, S.; Fu, J.S.; et al. Asian emission in 2006 for the NASA INTEX-B mission. Atmos. Chem. Phys. 2009, 9, 5131–5153. [Google Scholar] [CrossRef]
  10. Zhao, H.Y.; Zhang, Q.; Guan, D.B.; Davis, S.J.; Liu, Z.; Huo, H.; Lin, J.T.; Liu, W.D.; He, K.B. Assessment of China’s virtual air pollution transport embodied in trade by using a consumption-based emission inventory. Atmos. Chem. Phys. 2015, 15, 5443–5456. [Google Scholar]
  11. Liao, H.; Seinfeld, J.H. Global impacts of gas-phase chemistry-aerosol interactions on direct radiative forcing by anthropogenic aerosols and ozone. J. Geophys. Res. 2005, 110, D18208. [Google Scholar] [CrossRef]
  12. Liao, H.; Seinfeld, J.H.; Adams, P.J.; Mickley, L.J. Global radiative forcing of coupled tropospheric ozone and aerosols in a unified general circulation model. J. Geophys. Res. 2004, 109, D16207. [Google Scholar] [CrossRef]
  13. Bauer, S.E.; Koch, D.; Unger, N.; Metzger, S.M.; Shindell, D.T.; Streets, D.G. Nitrate aerosols today and in 2030: A global simulation including aerosols and tropospheric ozone. Atmos. Chem. Phys. 2007, 7, 5043–5059. [Google Scholar] [CrossRef]
  14. Li, J.D.; Wang, W.C.; Liao, H.; Chang, W.Y. Past and future direct radiative forcing of nitrate aerosol in East Asia. Theor. Appl. Climatol. 2015, 131, 445–458. [Google Scholar] [CrossRef]
  15. Bellouin, N.; Rae, J.; Jones, A.; Johnson, C.; Haywood, J.; Boucher, O. Aerosol forcing in the Climate Model Intercomparison Project (CMIP5) simulations by HadGEM2-ES and the role of ammonium nitrate. J. Geophys. Res. 2011, 116, D20206. [Google Scholar] [CrossRef]
  16. Xia, X.; Che, H.; Zhu, J.; Chen, H.; Cong, Z.; Deng, X.; Fan, X.; Fu, Y.; Goloub, P.; Jiang, H.; et al. Ground-based remote sensing of aerosol climatology in China: Aerosol optical properties, direct radiative effect and its parameterization. Atmos. Environ. 2016, 124, 243–251. [Google Scholar] [CrossRef]
  17. Alam, K.; Sahar, N.; Iqbal, Y. Aerosol characteristics and radiative forcing during pre-monsoon and post-monsoon seasons in an urban environment. Aerosol Air Qual. Res. 2014, 14, 99–107. [Google Scholar] [CrossRef]
  18. Han, Z.W.; Ueda, H.; Sakurai, T. Model study on acidifying wet deposition in East Asia during wintertime. Atmos. Environ. 2006, 40, 2360–2373. [Google Scholar] [CrossRef]
  19. Zhang, M.G.; Gao, L.J.; Ge, C.; Xu, Y.P. Simulation of nitrate aerosol concentrations over East Asia with the model system RAMS-CMAQ. Tellus B 2007, 59, 372–380. [Google Scholar] [CrossRef]
  20. Hayami, H.; Sakurai, T.; Han, Z.W.; Ueda, H.; Carmichael, G.R.; Streets, D.; Holloway, T.; Wang, Z.; Thongboonchoo, N.; Engardt, M.; et al. MICS-Asia II: Model intercomparison and evaluation of particulate sulfate, nitrate and ammonium. Atmos. Environ. 2008, 42, 3510–3527. [Google Scholar] [CrossRef]
  21. Li, J.W.; Han, Z.W. A modeling study of seasonal variation of atmospheric aerosols over East Asia. Adv. Atmos. Sci. 2012, 29, 101–117. [Google Scholar] [CrossRef]
  22. Wang, T.; Li, S.; Shen, Y.; Deng, J.; Xie, M. Investigations on direct and indirect effect of nitrate on temperature and precipitation in China using a regional climate chemistry modeling system. J. Geophys. Res. 2010, 115, D00K26. [Google Scholar] [CrossRef]
  23. Zhang, H.; Shen, Z.; Wei, X.; Zhang, M.; Li, Z. Comparison of optical properties of nitrate and sulfate aerosol and the direct radiative forcing due to nitrate in China. Atmos. Res. 2012, 113, 113–125. [Google Scholar] [CrossRef]
  24. Li, S.; Wang, T.J.; Zhuang, B.L.; Han, Y. Indirect Radiative forcing and climatic effect of the anthropogenic nitrate aerosol on regional climate of China. Adv. Atmos. Sci. 2009, 26, 543–552. [Google Scholar] [CrossRef]
  25. Han, Z. Direct radiative effect of aerosols over East Asia with a regional coupled climate/chemistry model. Meteorol. Z. 2010, 19, 287–298. [Google Scholar] [CrossRef]
  26. Grell, G.A.; Dudhia, J.; Stauffer, D.R. A Description of the Fifth-Generation Penn State/NCAR Mesoscale Model (MM5); NCAR Technical Note, NCAR/TN-398tSTR; National Center for Atmospheric Research: Boulder, CO, USA, 1995. [Google Scholar]
  27. Dickinson, R.E.; Henderson-Sellers, A.; Kennedy, P.J. Biosphere-Atmosphere Transfer Scheme (BATS) Version 1e as coupled to NCAR Community Climate Model; NCAR Technical Note, NCAR/TN-387+STR; National Center for Atmospheric Research: Boulder, CO, USA, 1993. [Google Scholar]
  28. Hong, S.H.; Pan, H.L. Nonlocal boundary layer vertical diffusion in a medium-range forecast model. Mon. Weather Rev. 1996, 124, 2322–2339. [Google Scholar] [CrossRef]
  29. Grell, G.A. Prognostic evaluation of assumptions used by cumulus parameterizations. Mon. Weather Rev. 1993, 121, 764–787. [Google Scholar] [CrossRef]
  30. Keihl, J.T.; Hack, J.J.; Bonan, G.B.; Boville, B.A.; Briegleb, B.P.; Williamson, D.L.; Rasch, P.J. Description of the NCAR Community Climate Model (CCM3); NCAR Technical Note, NCAR/TN-420+STR; National Center for Atmospheric Research: Boulder, CO, USA, 1996. [Google Scholar]
  31. Xiong, Z.; Fu, C.B.; Yan, X.D. Regional Integrated environmental model system and its simulation of East Asia summer monsoon. Chin. Sci. Bull. 2009, 54, 4253–4261. [Google Scholar] [CrossRef]
  32. Zhao, D.M. Performance of Regional Integrated Environment Modeling System (RIEMS) in precipitation simulations over East Asia. Clim. Dyn. 2013, 40, 1767–1787. [Google Scholar] [CrossRef]
  33. Wang, S.Y.; Fu, C.B.; Wei, H.L.; Qian, Y.; Xiong, Z.; Feng, J.M.; Zhao, D.M.; Dan, L.; Han, Z.W.; Su, B.K.; et al. Regional integrated environmental modeling system: Development and application. Clim. Chang. 2015, 129, 499–510. [Google Scholar] [CrossRef]
  34. Fu, C.B.; Wang, S.Y.; Xiong, Z.; Gutowski, W.J.; Lee, D.; Mcgregor, J.L.; Sato, Y.; Kato, H.; Kim, J.; Suh, M. Regional climate model intercomparison project for Asia. Bull. Am. Meteorol. Soc. 2005, 86, 257–266. [Google Scholar] [CrossRef]
  35. Gery, M.W.; Whitten, G.Z.; Killus, J.P.; Dodge, M.C. A photochemical kinetics mechanism for urban and regional scale computer modeling. J. Geophys. Res. 1989, 94, 12925–12956. [Google Scholar] [CrossRef]
  36. Nenes, A.; Pandis, S.N.; Pilinis, C. ISORROPIA: A new thermodynamic equilibrium model for multiphase multicomponent inorganic aerosols. Aquat. Geochem. 1998, 4, 123–152. [Google Scholar] [CrossRef]
  37. Chang, J.S.; Brost, R.A.; Isaksen, I.S.A.; Madronich, S.; Middleton, P.; Stockwell, W.R.; Walcek, C.J. A three-dimensional Eulerian acid deposition model: physical concepts and formulation. J. Geophys. Res. 1987, 92, 14681–14700. [Google Scholar] [CrossRef]
  38. Jacob, D.J. Heterogeneous chemistry and tropospheric ozone. Atmos. Environ. 2000, 34, 2131–2159. [Google Scholar] [CrossRef]
  39. Li, J.W.; Han, Z.W. A modeling study of the impact of heterogeneous reactions on mineral aerosol surfaces on tropospheric chemistry over East Asia. Particuology 2010, 8, 433–441. [Google Scholar] [CrossRef]
  40. Hess, M.; Koepke, P.; Schuit, I. Optical properties of aerosols and clouds: the software package OPAC. Bull. Am. Meteorol. Soc. 1998, 79, 831–844. [Google Scholar] [CrossRef]
  41. Han, Z.W.; Ueda, H.; Matsuda, K.; Zhang, R.J.; Arao, K.; Kanai, Y.; Hasome, H. Model study on particle size segregation and deposition during Asian dust events in March 2002. J. Geophys. Res. 2004, 109, D19205. [Google Scholar] [CrossRef]
  42. Walmsley, J.L.; Wesely, M.L. Modification of coded parameterizations of surface resistances to gaseous dry deposition. Atmos. Environ. 1996, 30, 1181–1188. [Google Scholar] [CrossRef]
  43. Ghan, S.; Zaveri, R.A. Parameterization of optical properties for hydrated internally mixed aerosol. J. Geophys. Res. 2007, 112, D10201. [Google Scholar] [CrossRef]
  44. Kreidenweis, S.M.; Koehler, K.; DeMott, P.J.; Prenni, A.J.; Carrico, C.; Ervens, B. Water activity and activation diameters from hygroscopicity data—Part I: Theory and application to inorganic salts. Atmos. Chem. Phys. 2005, 5, 1357–1370. [Google Scholar] [CrossRef]
  45. Rissler, J.; Vestin, A.; Swietlicki, E.; Fisch, G.; Zhou, J.; Artaxo, P.; Andreae, M.O. Size distribution and hygroscopic properties of aerosol particles from dry-season biomass burning in Amazonia. Atmos. Chem. Phys. 2006, 6, 471–491. [Google Scholar] [CrossRef]
  46. Petters, M.D.; Kreidenweis, S.M. A single parameter representation of hygroscopic growth and cloud condensation nucleus activity. Atmos. Chem. Phys. 2007, 7, 1961–1971. [Google Scholar] [CrossRef]
  47. Riemer, N.; West, M.; Zaveri, R.; Easter, R. Estimating black carbon aging time-scales with a particle-resolved aerosol model. J. Aerosol Sci. 2010, 41, 143–158. [Google Scholar] [CrossRef]
  48. Han, X.; Zhang, M.G.; Han, Z.W.; Xin, J.Y.; Liu, X.H. Simulation of aerosol direct radiative forcing with RAMS-CMAQ in East Asia. Atmos. Environ. 2011, 45, 6576–6592. [Google Scholar] [CrossRef]
  49. Li, J.W.; Han, Z.W.; Zhang, R.J. Influence of aerosol hygroscopic growth parameterization on aerosol optical depth and direct radiative forcing over East Asia. Atmos. Res. 2014, 140–141, 14–27. [Google Scholar] [CrossRef]
  50. Han, Z.W.; Li, J.W.; Xia, X.A.; Zhang, R.J. Investigation of direct radiative effects of aerosols in dust storm season over East Asia with an online coupled regional climate-chemistry-aerosol model. Atmos. Environ. 2012, 54, 688–699. [Google Scholar] [CrossRef]
  51. Li, M.; Zhang, Q.; Kurokawa, J.; Woo, J.-H.; He, K.B.; Lu, Z.; Ohara, T.; Song, Y.; Streets, D.G.; Carmichael, G.R.; et al. MIX: A mosaic Asian anthropogenic emission inventory for the MICS-Asia and the HTAP projects. Atmos. Chem. Phys. Discuss. 2015, 15, 34813–34869. [Google Scholar] [CrossRef]
  52. Lamarque, J.-F.; Bond, T.C.; Eyring, V.; Granier, C.; Heil, A.; Klimont, Z.; Lee, D.; Liousse, C.; Mieville, A.; Owen, B.; et al. Historical (1850–2000) gridded anthropogenic and biomass burning emissions of reactive gases and aerosols: methodology and application. Atmos. Chem. Phys. 2010, 10, 7017–7039. [Google Scholar] [CrossRef] [Green Version]
  53. Six Hourly NCEP (National Centers for Environmental Prediction) Final Reanalysis Data. Available online: http://rda.ucar.edu/datasets/ds083.2/ (accessed on 29 July 2016).
  54. Emmons, L.K.; Walters, S.; Hess, P.G.; Lamarque, J.-F.; Pfister, G.G.; Fillmore, D.; Granier, G.; Guenther, A.; Kinnison, D.; Laepple, T.; et al. Description and evaluation of the Model for Ozone and Related chemical Tracers, version 4 (MOZART-4). Geosci. Model Dev. 2010, 3, 43–67. [Google Scholar] [CrossRef] [Green Version]
  55. Acid Deposition Monitoring Network in East Asia. Available online: http://www.eanet.asia/jpn/index.html (accessed on 29 July 2016).
  56. Zhao, P.S.; Dong, F.; He, D.; Zhao, X.J.; Zhang, X.L.; Zhang, W.Z.; Yao, Q.; Liu, H.Y. Characteristics of concentrations and chemical compositions for PM2.5 in the region of Beijing, Tianjin, and Hebei, China. Atmos. Chem. Phys. 2013, 13, 4632–4644. [Google Scholar] [CrossRef]
  57. Wang, H.L.; An, J.L.; Cheng, M.T.; Shen, L.J.; Zhu, B.; Li, Y.; Wang, Y.S.; Duan, Q.; Sullivan, A.; Xia, L. One year online measurements of water-soluble ions at the industrially polluted town of Nanjing, China: Sources, seasonal and diurnal variations. Chemosphere 2006, 148, 526–536. [Google Scholar] [CrossRef] [PubMed]
  58. Zhang, F.; Wang, Z.W.; Cheng, H.R.; Lv, X.P.; Gong, W.; Wang, X.M.; Zhang, G. Seasonal variations and chemical characteristics of PM2.5 in Wuhan, central China. Sci. Total Environ. 2015, 518–519, 97–105. [Google Scholar] [CrossRef] [PubMed]
  59. Tao, J.; Zhang, L.M.; Ho, K.F.; Zhang, R.J.; Lin, Z.J.; Zhang, Z.S.; Lin, M.; Cao, J.J.; Liu, S.X.; Wang, G.H. Impact of PM2.5 chemical compositions on aerosol light scattering in Guangzhou—The largest magecity in south China. Atmos. Res. 2014, 135–136, 48–58. [Google Scholar] [CrossRef]
  60. Shen, Z.X.; Cao, J.J.; Arimoto, R.; Han, Y.M.; Zhu, C.S.; Tian, J.; Liu, S.X. Chemical characteristics of fine particles (PM1) from Xi’an, China. Aerosol Sci. Technol. 2010, 44, 461–472. [Google Scholar] [CrossRef]
  61. Boucher, O.; Randall, D.; Artaxo, P.; Bretherton, C.; Feingold, G.; Forster, P.; Kerminen, V.-M.; Kondo, Y.; Liao, H.; Lohmann, U.; et al. Clouds and aerosols. In Climate Change 2013: The Physical Science Basis; Contribution of Working Group I to the Fifth Assessment Report of the Intergovernmental Panel on Climate Change; Stocker, T.F., Qin, D., Plattner, G.-K., Tignor, M., Allen, S.K., Boschung, J., Nauels, A., Xia, Y., Bex, V., Midgley, P.M., Eds.; Cambridge University Press: Cambridge, UK; New York, NY, USA, 2013. [Google Scholar]
Figure 1. Comparisons of monthly mean surface nitrate concentration between observation and simulation at ten EANET (Acid Deposition Monitoring Network in East Asia) sites (aj). The site-average monthly mean nitrate concentration across all the ten sites is also shown (k). Note that y-axis in each panel is different. Site locations see Figure 2a and Table 1.
Atmosphere 07 00105 g001aAtmosphere 07 00105 g001b
Figure 2. Seasonal mean surface nitrate concentrations (μg·m−3) from simulation for (a) spring; (b) summer; (c) autumn; and (d) winter in 2010. Observation sites including ten EANET sites (solid blue squares) and eight Chinese sites (open blue triangles) are marked and their locations refer to Table 1 and Table 2, respectively.
Atmosphere 07 00105 g002
Figure 3. Annual mean (a) surface concentration (μg·m−3) and (b) column burden (mg·m−2) of nitrate aerosol from simulation in 2010.
Atmosphere 07 00105 g003
Figure 4. Seasonal mean direct radiative forcing (DRF) due to nitrate at the top of the atmosphere (TOA) under all-sky condition for (a) spring; (b) summer; (c) autumn; and (d) winter in 2010.
Atmosphere 07 00105 g004
Figure 5. Annual mean direct radiative forcing (DRF) due to nitrate at the top of the atmosphere (TOA) under (a) all-sky and (b) clear-sky conditions in 2010.
Atmosphere 07 00105 g005
Table 1. Statistics of surface nitrate concentrations between EANET observation and simulation. Obs (μg·m−3) and Sim (μg·m−3) are annual average of monthly nitrate concentrations from observation and simulation, respectively, R is correlation coefficient, MBE (μg·m−3) is mean bias error, and NMB (%) is normalized mean bias.
SitesLongitude (°E)Latitude (°N)TypeObsSimRMBENMB
Hongwen118.1324.47Urban11.011.10.870.131.2
Kanghwa126.2837.70Rural3.03.70.630.6521.8
Imsil127.1835.60Rural3.74.10.810.3910.4
Cheju126.1733.30Remote0.71.40.220.6690.0
Rishiri141.2345.12Remote0.81.10.500.3140.3
Tappi140.3541.25Remote1.41.60.640.2216.6
Oki133.1836.28Remote1.51.50.67−0.05−3.1
Banryu131.8034.68Urban1.51.60.580.128.4
Tokyo139.7635.69Urban3.83.80.560.020.6
Hedo128.2526.87Remote1.11.10.78−0.03−28.0
Average 2.72.90.920.259.1
Table 2. Comparison of observed and simulated nitrate concentrations across China (units: μg·m−3).
Site *Longitude (°E)Latitude (°N)Sampling PeriodSourceAnnualSpringSummerAutumnWinterRef.
Shangdianzi117.1240.65April/July/October 2009 and January 2010Obs12.216.512.411.28.8[56]
Sim11.211.618.411.24.7
Beijing116.4040.00As aboveObs20.520.422.821.517.1[56]
Sim15.313.826.116.26.5
Tianjin117.3039.10As aboveObs18.818.821.120.115.5[56]
Sim14.414.718.617.39.2
Shijiazhuang114.5038.03As aboveObs30.426.524.946.025.3[56]
Sim17.115.725.219.610.8
Chengde117.9340.97As aboveObs5.811.04.62.65.2[56]
Sim9.010.313.59.24.1
Nanjing118.7232.21October 2013–November 2014Obs18.917.811.715.332.9[57]
Sim13.014.17.715.816.9
Wuhan114.3530.5August 2012–July 2013Obs14.614.52.013.029.0[58]
Sim12.013.24.015.120.4
Guangzhou113.3523.12April/July/October 2009 and January 2010Obs7.89.92.06.413.0[59]
Sim10.710.32.610.019.9
Xi’an108.8834.23December 2007–November 2008Obs11.312.44.412.116.2[60]
Sim8.18.44.911.011.4
Average Obs15.616.411.816.518.1
Sim12.312.513.413.911.5
* PM2.5 was measured in all sites except Xi’an where PM1 was collected.
Table 3. Domain averages of annual and seasonal mean surface nitrate concentration, column nitrate concentration, and direct radiative forcing (DRF) due to nitrate at the top of the atmosphere (TOA) and at the surface under all-sky and clear-sky conditions for East Asia and east China.
Domain *AnnualSpringSummerAutumnWinter
Surface nitrate concentration (μg·m−3)
East Asia2.92.91.63.24.2
East China8.58.54.510.012.9
Column nitrate concentration (mg·m−2)
East Asia8.09.06.39.38.3
East China18.620.712.922.721.1
DRF due to nitrate at TOA (all-sky) (W·m−2)
East Asia−1.7−1.8−1.6−1.9−1.7
East China−3.7−3.6−3.1−4.1−4.1
DRF due to nitrate at TOA (clear-sky) (W·m−2)
East Asia−3.8−4.3−3.2−4.0−4.0
East China−9.0−10.3−6.2−9.8−10.5
DRF due to nitrate at the surface (all-sky) (W·m−2)
East Asia−1.7−1.8−1.6−1.8−1.7
East China−3.7−3.7−3.2−4.2−4.3
DRF due to nitrate at the surface (clear-sky) (W·m−2)
East Asia−3.9−4.5−3.3−4.1−4.0
East China−9.4−11.0−6.5−10.3−10.6
* East Asia: the whole domain; East China: 20°N–42°N and 100°E–123°E.

