Article

Semi-Physical Estimates of National-Scale PM10 Concentrations in China Using a Satellite-Based Geographically Weighted Regression Model

1
State Key Laboratory of Information Engineering in Surveying, Mapping and Remote Sensing, Wuhan University, Wuhan 430079, China
2
Collaborative Innovation Center for Geospatial Technology, Wuhan 430079, China
3
College Information Science and Engineering, Wuchang Shouyi University, Wuhan 430064, China
*
Author to whom correspondence should be addressed.
Atmosphere 2016, 7(7), 88; https://doi.org/10.3390/atmos7070088
Submission received: 17 May 2016 / Revised: 21 June 2016 / Accepted: 22 June 2016 / Published: 27 June 2016

Abstract

:
The estimation of ambient particulate matter with diameter less than 10 µm (PM10) at high spatial resolution is currently quite limited in China. In order to make the distribution of PM10 more accessible to relevant departments and scientific research institutions, a semi-physical geographically weighted regression (GWR) model was established in this study to estimate nationwide mass concentrations of PM10 using easily available MODIS AOD and NCEP Reanalysis meteorological parameters. The results demonstrated that applying physics-based corrections could remarkably improve the quality of the dataset for better model performance with the adjusted R2 between PM10 and AOD increasing from 0.08 to 0.43, and the fitted results explained approximately 81% of the variability in the corresponding PM10 mass concentrations. Annual average PM10 concentrations estimated by the semi-physical GWR model indicated that many residential regions suffer from severe particle pollution. Moreover, the deviation in estimation, which primarily results from the frequent changes in elevation, the spatially heterogeneous distribution of monitoring sites, and the limitations of AOD retrieval algorithm, was acceptable. Therefore, the semi-physical GWR model provides us with an effective and efficient method to estimate PM10 at large scale. The results could offer reasonable estimations of health impacts and provide guidance on emission control strategies in China.

1. Introduction

Numerous studies have shown that airborne particulate matter from both natural sources and anthropogenic emissions are associated with environmental degradation, climate change, and adverse human health effects [1,2,3]. With the rapid development led by the economic boom, China currently experiences severe PM10 (particles with aerodynamic diameter less than 10 µm) pollution, which arouses widespread public concern [4,5]. Although the estimation of air quality from stationary ground monitoring sites are supposed to be accurate, the consistency of their quality often declines with increasing spatial distance [6]. Consequently, the accurate and spatially resolved assessment of PM10 exposure is significant in effectively estimating air quality and conducting environmental epidemiologic studies [7].
As satellite remote sensing has been generally employed to make up for the limitation in spatial coverage of ground measurements, a potentially effective method has been put forward to predict PM10 concentrations using satellite-derived aerosol optical depth (AOD) [8,9,10,11,12]. Satellite-derived AOD, which measures light extinction in one atmospheric column, is directly related to the quantity of particles in this column and can be converted into mass concentration of particulate matter using empirical methods [9,10]. Up until now, previous studies developed quantitative relationships between satellite-derived AOD and ground-measured PM for different parts of the world, using empirical models, such as linear regression [13,14,15] and several types of non-linear regression [13]. In the past few years, related parameters, such as meteorological factors and geographical data, were used in establishing more advanced models for improving the accuracy of PM estimation, such as the alternating conditional expectation model (ACE) [16], generalized additive model [17], mixed effects model [18,19], and artificial neural network model (ANN) [13,20]. As the correlation between AOD and PM is presumed to change along with spatial context [6], the geographically weighted regression model (GWR) based on a regional regression technique was adopted to constrain the spatial nonstationarity and variability in large-scale regressions [21,22]. Furthermore, relative humidity and vertical distribution of aerosol extinction coefficients have been taken into consideration when estimating ground-level PM10 using satellite-derived AOD from the perspective of physics, which significantly improve the correlation between PM10 and AOD [23]. The combination of physical correction and the GWR model significantly increases the accuracy of fine particle concentration estimation compared to two conventional statistical models [24]. Nevertheless, no national-scale study on GWR modeling of PM10 and satellite-derived AOD using physical revision have been reported, and whether the physical correction by vertical distribution and relative humidity effectively embed in the GWR model at the national-scale remains to be examined.
In this study, we first adopted a physics-based correction method on dealing with nationwide AOD and PM10 for validating the effectiveness of physical correction at a large-scale. Reanalysis meteorological parameters were then introduced into the semi-physical GWR model to estimate national-scale spatial distribution of PM10. In order to quantitatively evaluate the performance of the semi-physical GWR model, the original GWR model was established under similar conditions for comparing the fitted PM10 with ground measurements. Moreover, the seasonal modeling by semi-physical GWR model was conducted to reveal the seasonal variation in accuracy of model performance. Finally, the nationwide spatial distribution of the satellite-retrieved PM10 using the semi-physical GWR model was demonstrated to evaluate pollution level and existed limitations.

2. Materials and Methods

2.1. Data Collection and Reprocessing

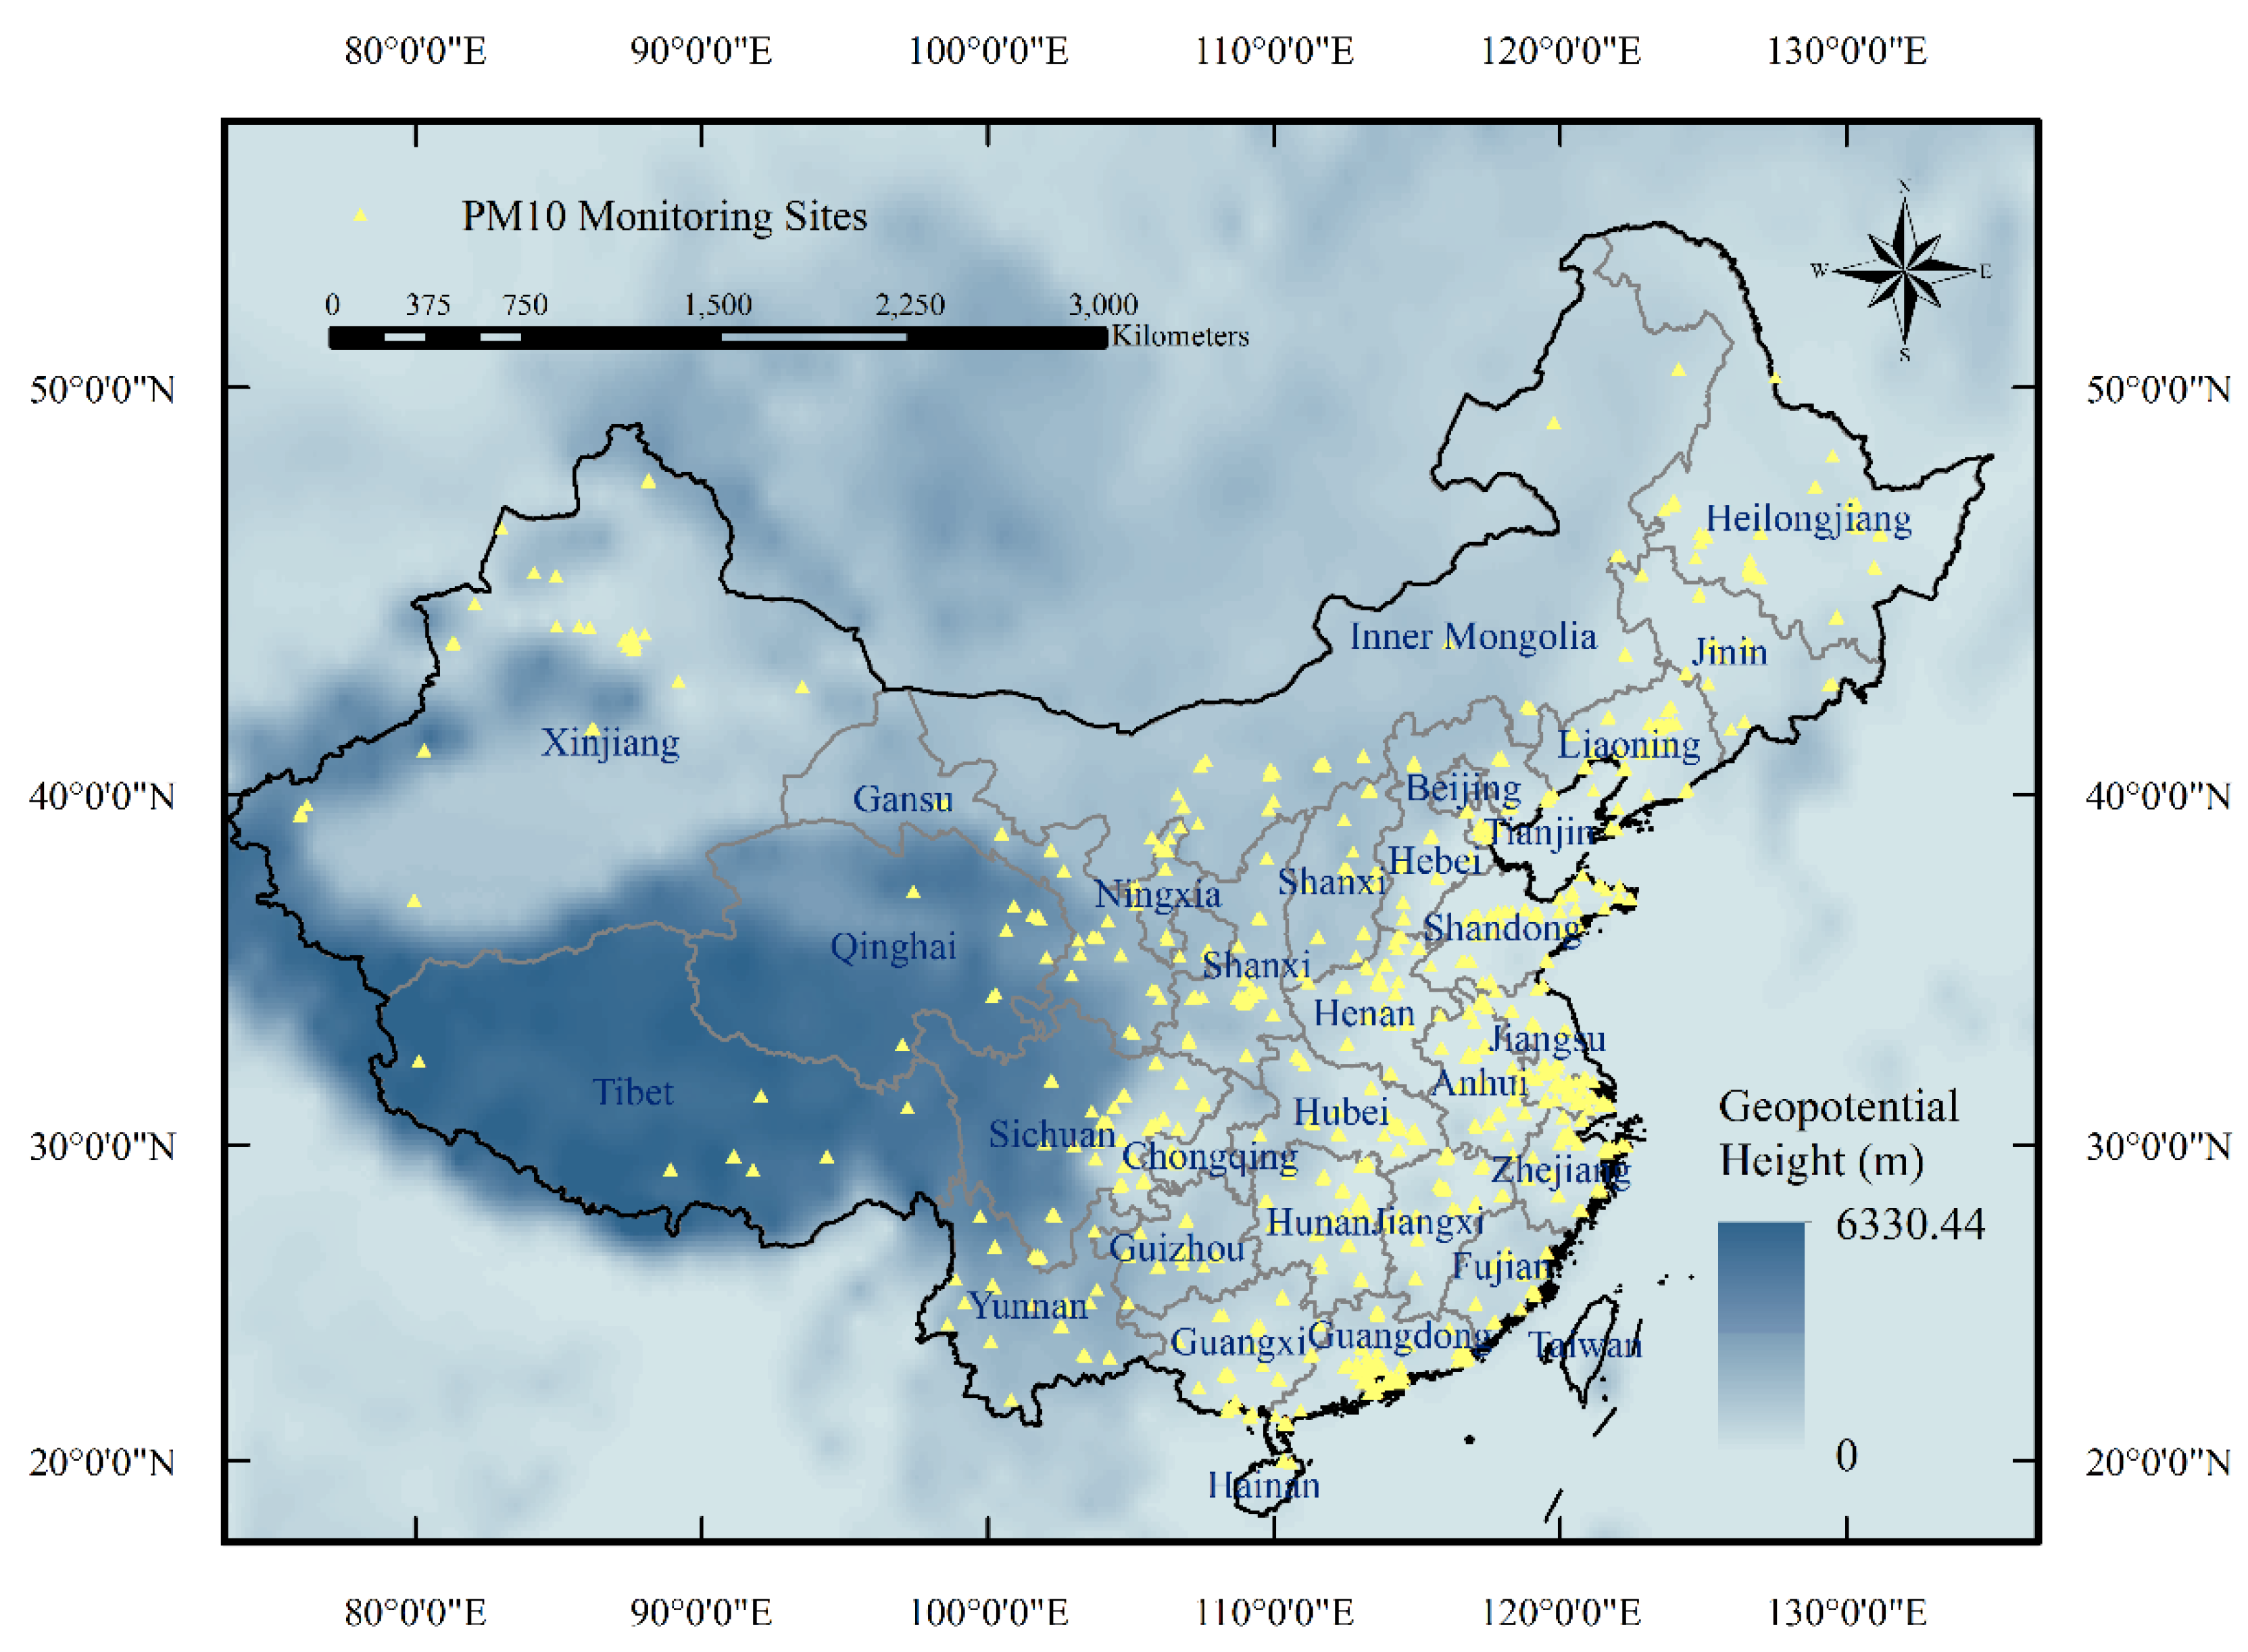
2.1.1. Ground-Level Hourly PM10 Measurements

Since 2013, a nationwide air quality monitoring network covering major cities in all provinces of China has been providing hourly PM10 concentration data. As shown in Figure 1, the Chinese Ministry of Environmental Protection (MEP) set up more than 1300 ground monitoring sites to cover residential areas. Their data, measured using the beta-attenuation method or the tapered element oscillating microbalance method (TEOM), are available on the China Environmental Monitoring Center (CEMC) website [25,26].

2.1.2. Satellite-Retrieved AOD

Although many satellite sensors can provide AOD, the Moderate resolution Imaging Spectroradiometer (MODIS) has been proven to retrieve one of the most quality assured aerosol products [27,28]. The MODIS Collection 6 (C6) AOD products with 3 km spatial resolution at nadir were released last year, and have been proven to generally achieve the required accuracy validated by observations of sun photometers from the Aerosol Robotic Network (AERONET) in China [29,30,31]. In this study, the AOD products, with 3 km spatial resolutions, of both MODIS Terra and MODIS Aqua were downloaded from the NASA LAADS website [32] for the nationwide region (longitude range (73°40′E–135°2.5′E), latitude range (3°52′N–53°33′N)).

2.1.3. Meteorological Parameters

Meteorological data, including surface temperature, surface pressure, u-component and v-component of wind above ground, surface relative humidity (RH_Surface), and Planetary Boundary Layer Height (PBLH), were obtained from the National Centers for Environmental Prediction (NCEP) reanalysis, which is from the Climate Forecast System (CFS) model. The NCEP data set, which is available at its website [33], provides 6-hourly land surface, oceanic, and atmospheric analyzed forecasts and products with a spatial resolution of 1.0°. Precipitation data in this study was collected from averaged monthly precipitation grid dataset with 0.5° spatial resolution. This grid dataset, which is spatially interpolated by Thin Plate Spline (TPS) based on 2472 ground meteorological stations in China, was released by the National Meteorological Information Center [34].

2.1.4. Data Integration

Since Terra MODIS and Aqua MODIS cross the equator at approximately 10:30 a.m. and 1:30 p.m. local time, respectively, this study used their average as the mean AOD value. Accordingly, daily PM10 values were processed by averaging PM10 observations measured from 10:00 a.m. to 2:00 p.m. local time. In addition, resampling based on the Kriging method was employed in dealing with the reanalysis meteorological parameters to ensure the consistency in space, because the three data sources have different spatial resolution. An AOD value was selected from the nearest 3 × 3 pixels search window, and meteorological parameters were picked from the nearest pixel in the grid, corresponding to the latitude and longitude coordinates of every ground air-quality monitoring station.

2.2. Methodology

2.2.1. Physics-Based Correction

Since the PM10 is measured by the ground air-quality monitoring stations, it is the ambient mass concentration of particulate matter that has been collected. Instead of measuring the optical parameters relating to ambient atmosphere, the satellite-retrieved AOD characterize the optical depth of the entire atmospheric column, which apparently change the incidence relation between satellite-retrieved AOD and ground-level PM10. Therefore, a vertical correction equation has been adopted to revise the original satellite-retrieved AOD for better correlation with PM10 [10]:
Revised AOD = AOD PBLH
The TEOM method, which measures dry PM10 after the particles have been heated up to 50 °C, has been applied in national air-quality monitoring stations, which obviously neglects the effect of evaporation. The revised PM10 can be obtained using a correction equation for relative humidity (RH) as follows [35]:
Revised PM 10 = PM 10 × ( 1 RH 100 ) 1

2.2.2. Model Structure and Validation

As the correlation between AOD and PM10 is presumed to change along with spatial context, this study established a GWR model that practically distinguishes spatial nonstationarity and variation at a regional-scale, so as to estimate ground-level PM10 at the national-scale. The GWR model can calculate estimated coefficients of a continuous surface by weighing the contribution of dispersed parameters at each local observation, and can generate a local goodness of fit (R2) to evaluate the fitting accuracy for each local observation. In addition, an adaptive bandwidth was adopted to deal with the uneven distribution of ground monitoring sites. The structure of the GWR model equation is expressed as follows:
R e v i s e d _ P M 10 , i = β 0 , i + β 1 , i R e v i s e d _ A O D i + β 2 , i P r e c i + β 3 , i S T i + β 4 , i P S i + β 5 , i W S i
where R e v i s e d _ P M 10 , i (μg/m3) is the seasonal average ground-level mass concentration of PM10 corrected by seasonal average RH_Surface at a location i ; β 0 , i represents the intercept at a location i ; β 1 , i β 5 , i denotes location-specific slopes; R e v i s e d _ A O D i (no unit) is the average value from MODIS AOD products corrected by average PBLH (km) at a location i ; precipitation ( P r e c i , mm), temperature surface ( S T i , K), atmospheric pressure ( P S i , Pa), and wind speed surface ( W S i , m/s) are meteorological parameters at location i . There are two reasons why seasonal averaged datasets have been chosen. First, since the six-hour averaged meteorological parameters such as precipitation, temperature, and PBLH, does have hysteresis effects instead of simultaneous effects on the variance of the mass concentrations of PM, the modeling will be less precise when it utilizes hourly datasets or daily datasets; Secondly, as the meteorological parameters which was collected from the NCEP are officially announced to be combined by forecast data and observational data, their accuracy is distinctly below those collected by ground-level meteorological stations. Therefore, averaged datasets have been adopted to smooth the bias of meteorological parameters for better model performance.
Moreover, to examine the effectiveness of a physics-based correction in the GWR model at the national-scale, a conventional GWR model was employed to establish a comparison experiment under similar conditions. This GWR model that has been proven to achieve better estimation of ground-level particle mass concentration, and its structure can be expressed as follows:
P M 10 , i = β 0 , i + β 1 , i A O D i + β 2 , i P r e c i + β 3 , i S T i + β 4 , i P S i + β 5 , i W S i + β 6 , i P B L H i + β 7 , i R H i
where P M 10 , i (μg/m3) and A O D i (no unit) are the seasonal average values without correction at a location i ; and P B L H i and R H i are meteorological parameters at location i .
To validate the performance of the model, the estimated mass concentrations of PM10 were fitted against the measured values. A 10-fold cross validation method [36] was employed to completely examine over-fitting of the dataset. This study divided the dataset into 10 subsets and the model was fitted using nine subsets, with one subset left for prediction in each round of the cross validation. This process was repeated 10 times until every subset was validated. Furthermore, Pearson coefficient, correlation coefficient, slope and intercept of the fitted equation were also calculated to evaluate the quality of estimation.

3. Results and Discussion

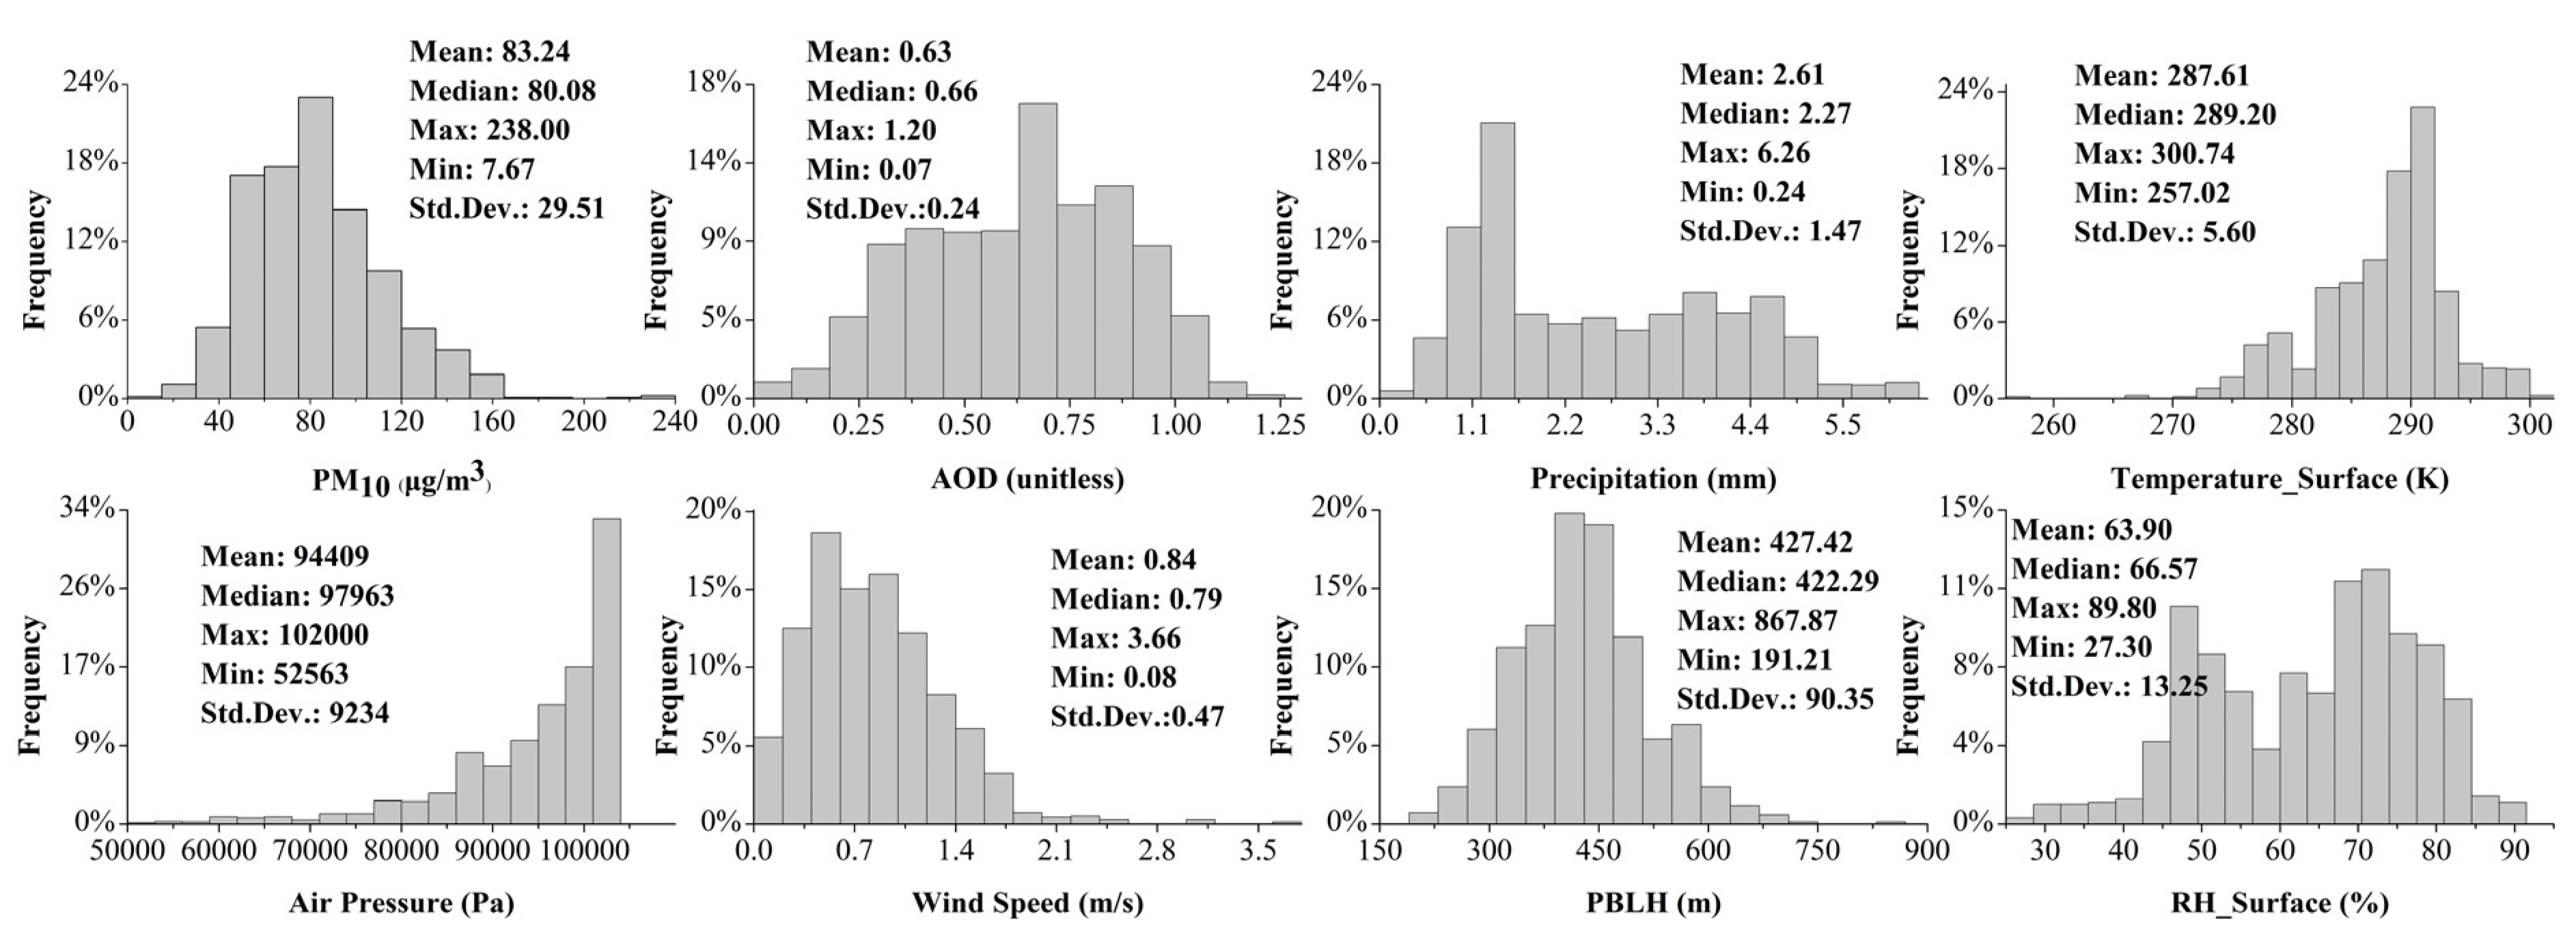
3.1. Descriptive Statistics

The histograms and descriptive statistics of all variables in the model dataset are demonstrated in Figure 2. Overall, the ground-level PM10 mass concentrations range from 7.67 to 238 µg/m3, and have an annual average value of 83.24 µg/m3 with a standard deviation (Std. Dev.) of 29.51. The annual mean AOD in 2015 was 0.63 with a standard deviation of 0.24. Different from other meteorological variables, which were approximately unimodal or log-normally distributed, the annual average precipitation and surface RH showed a bimodal distribution across entire China, revealing a slight trend of polarization.

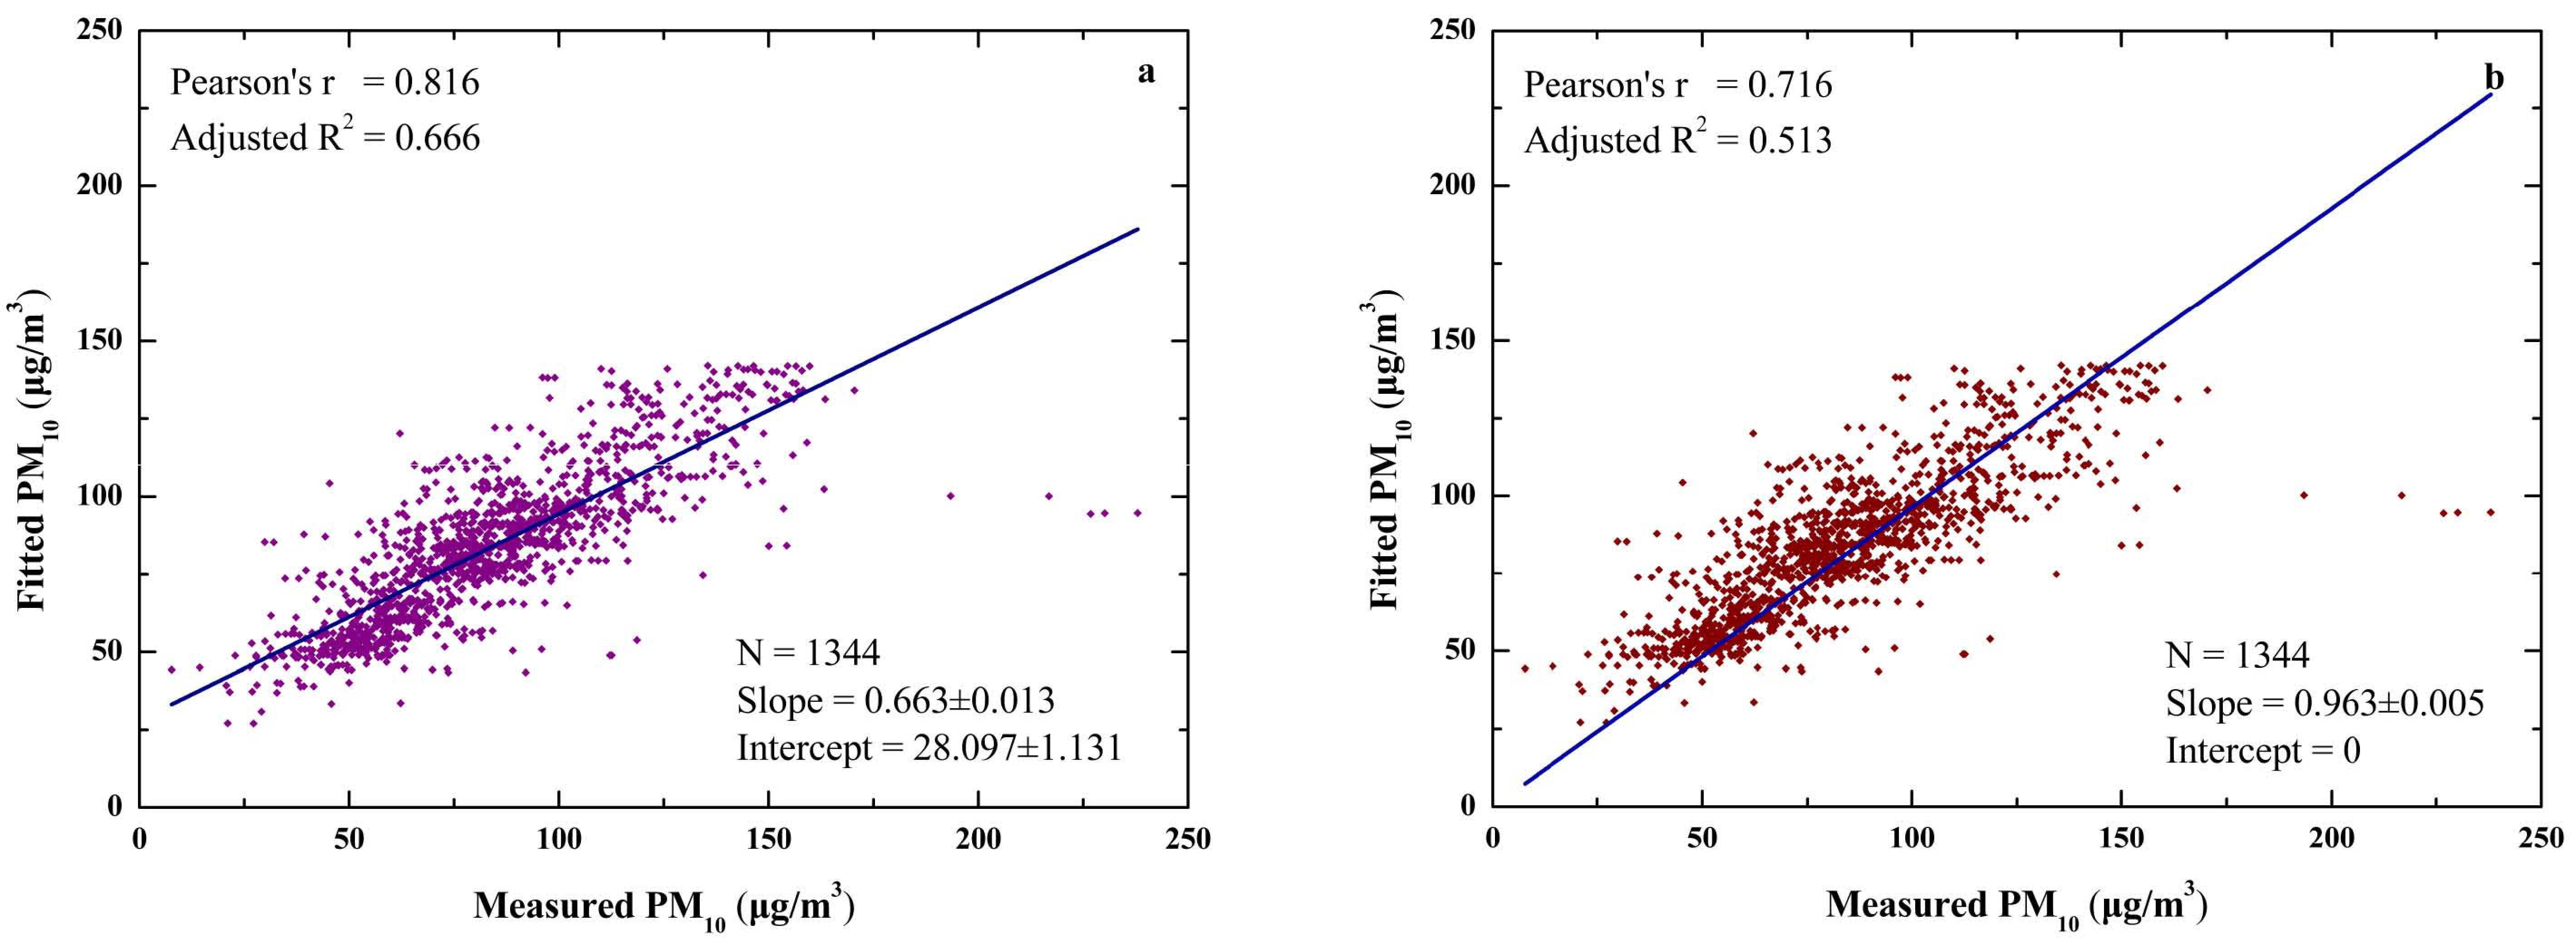
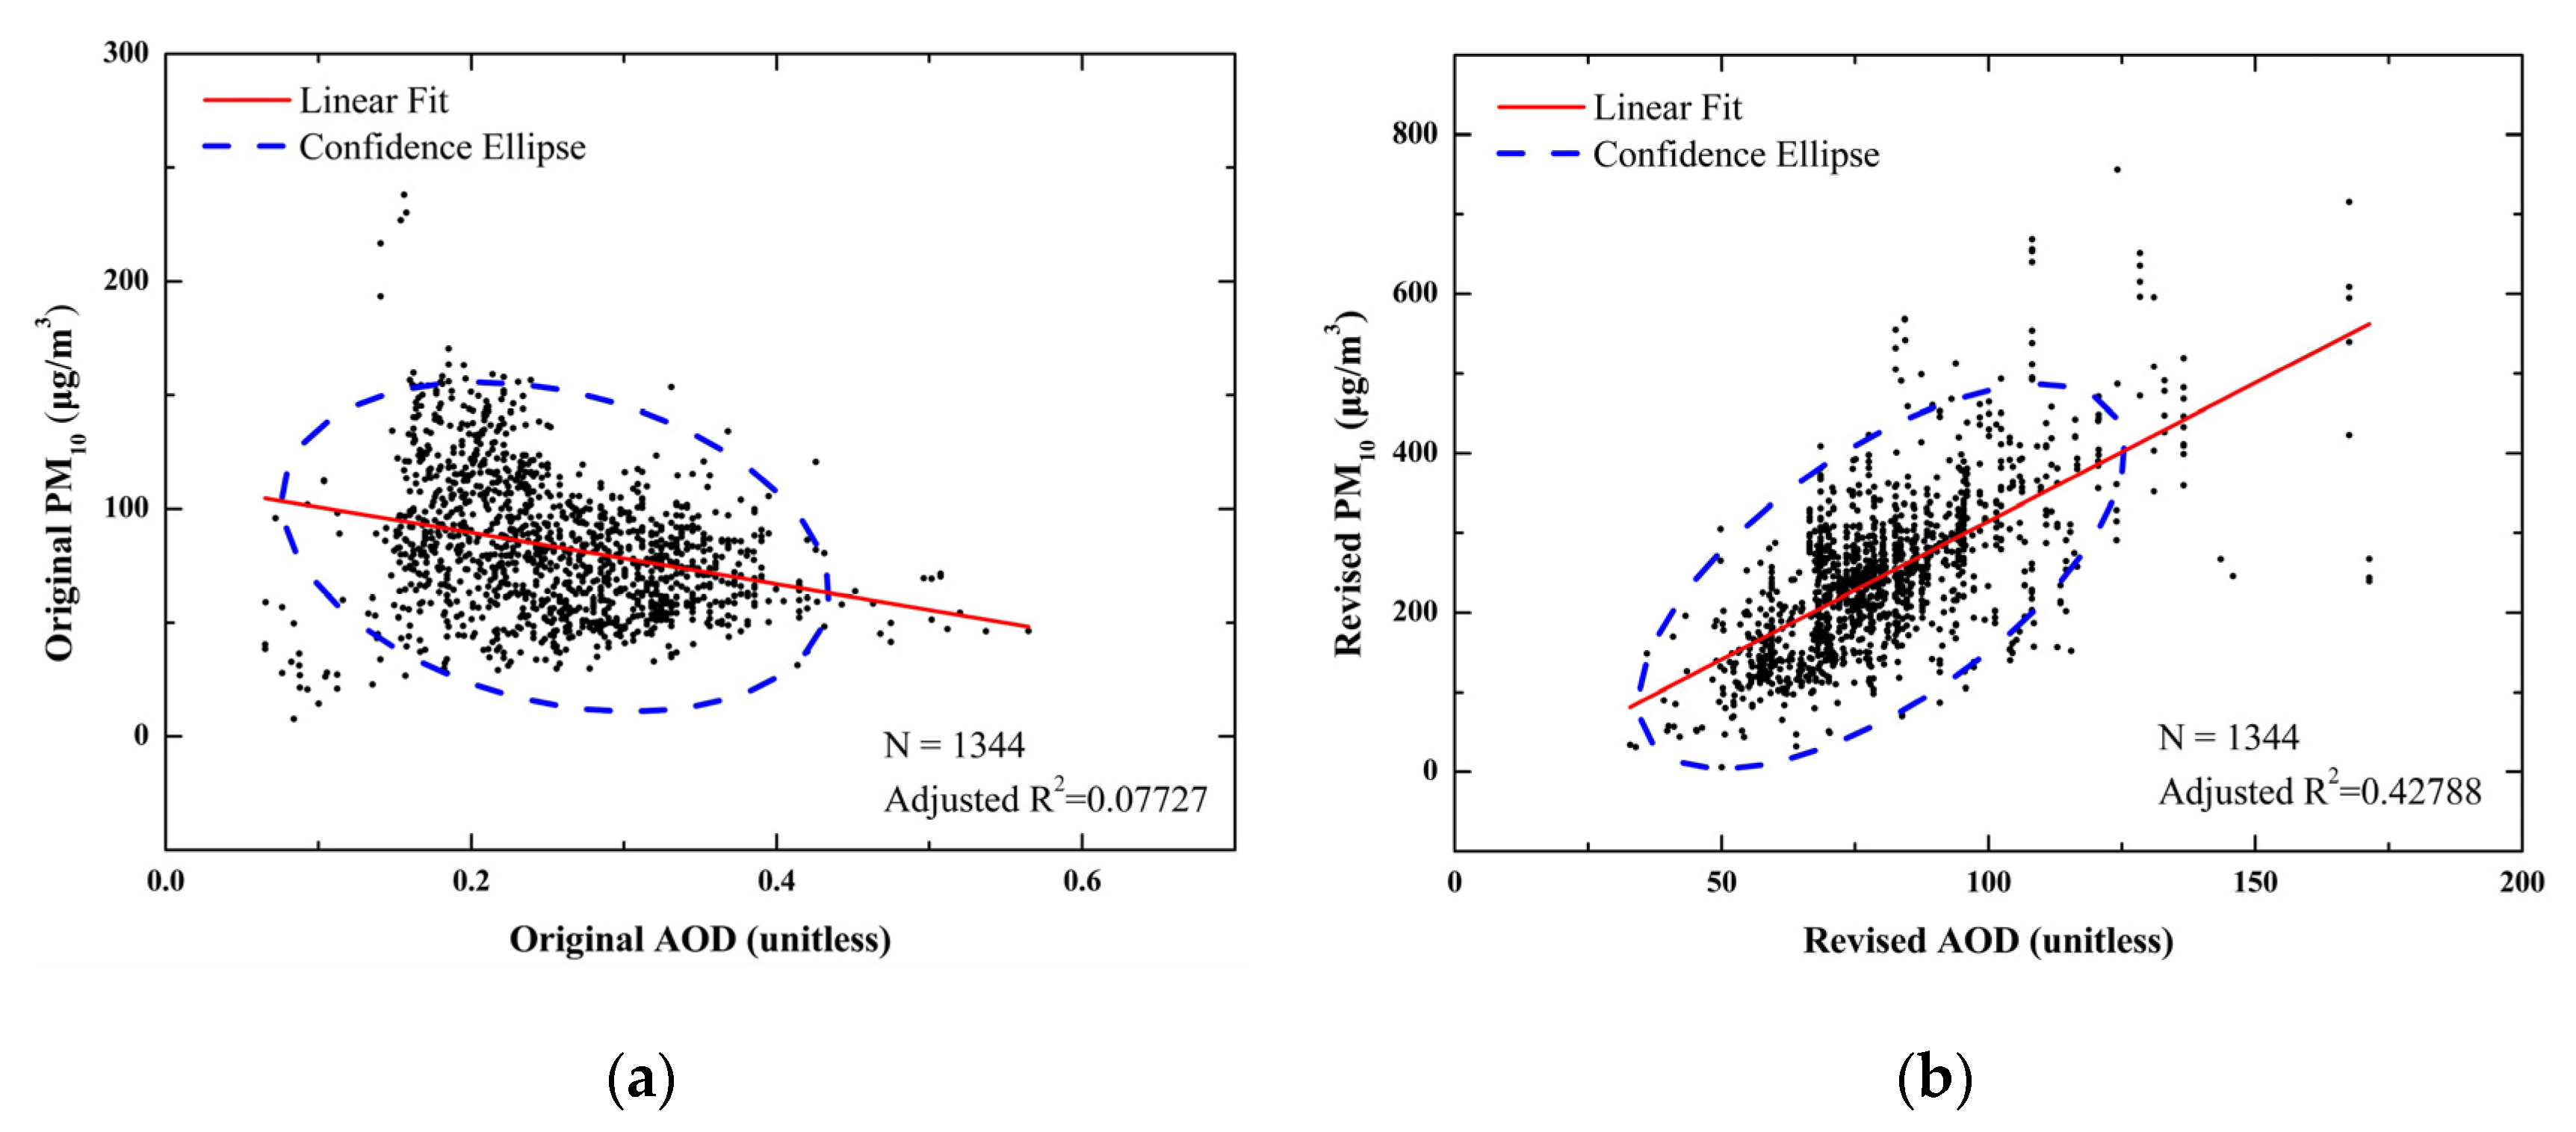
3.2. Physics-Based Revision and Validation

A general linear regression between original PM10 and original AOD is illustrated in Figure 3a, in contrast to the regression between revised PM10 by RH and revised AOD by PBLH shown in Figure 3b. There was an indeterminate correlation between original PM10 and original AOD with the determination coefficient (R2) of regression less than 0.1, where the slope of the linear-fit and the major axis of confidence ellipse were both negative. However, the revised AOD was potentially beneficial for estimating PM10, with the adjusted R2 increasing to 0.428 and presenting a positive correlation, indicating that the surface RH correction on PM10 and vertical correction on AOD could distinctly improve the quality of the dataset for better model performance. It also should be noted that the points beyond 2σ occurring outside of the confidence ellipse were mostly points with higher values, which proves that in particular the correction by RH or PBLH probably introduced greater deviation. Nevertheless, the relatively low determination coefficients of the regression models, with AOD acting as an only predictor variable, indicates that the AOD–PM10 relationship could also be influenced by other factors, such as meteorological parameters and spatial nonstationarity and variability.

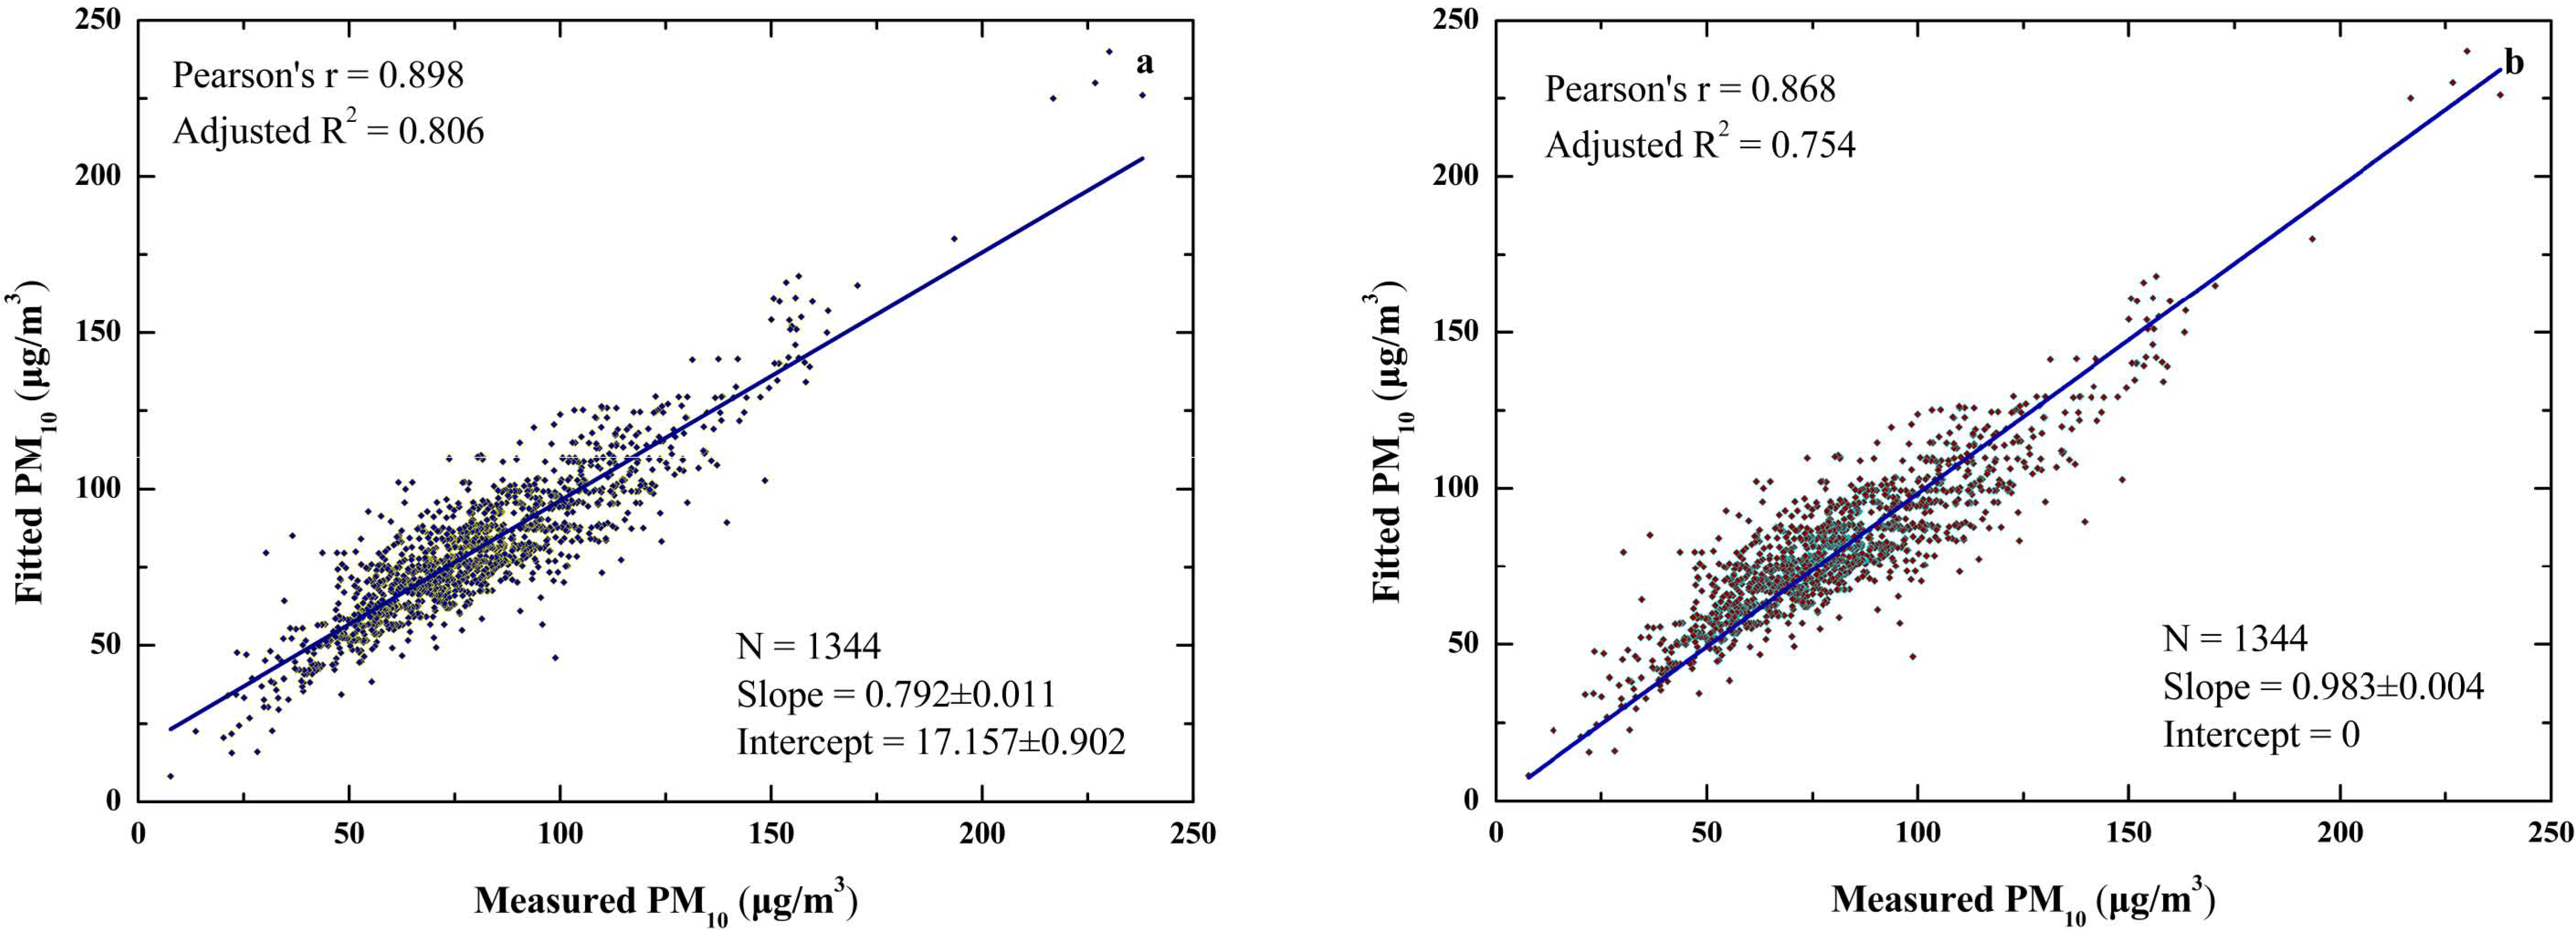
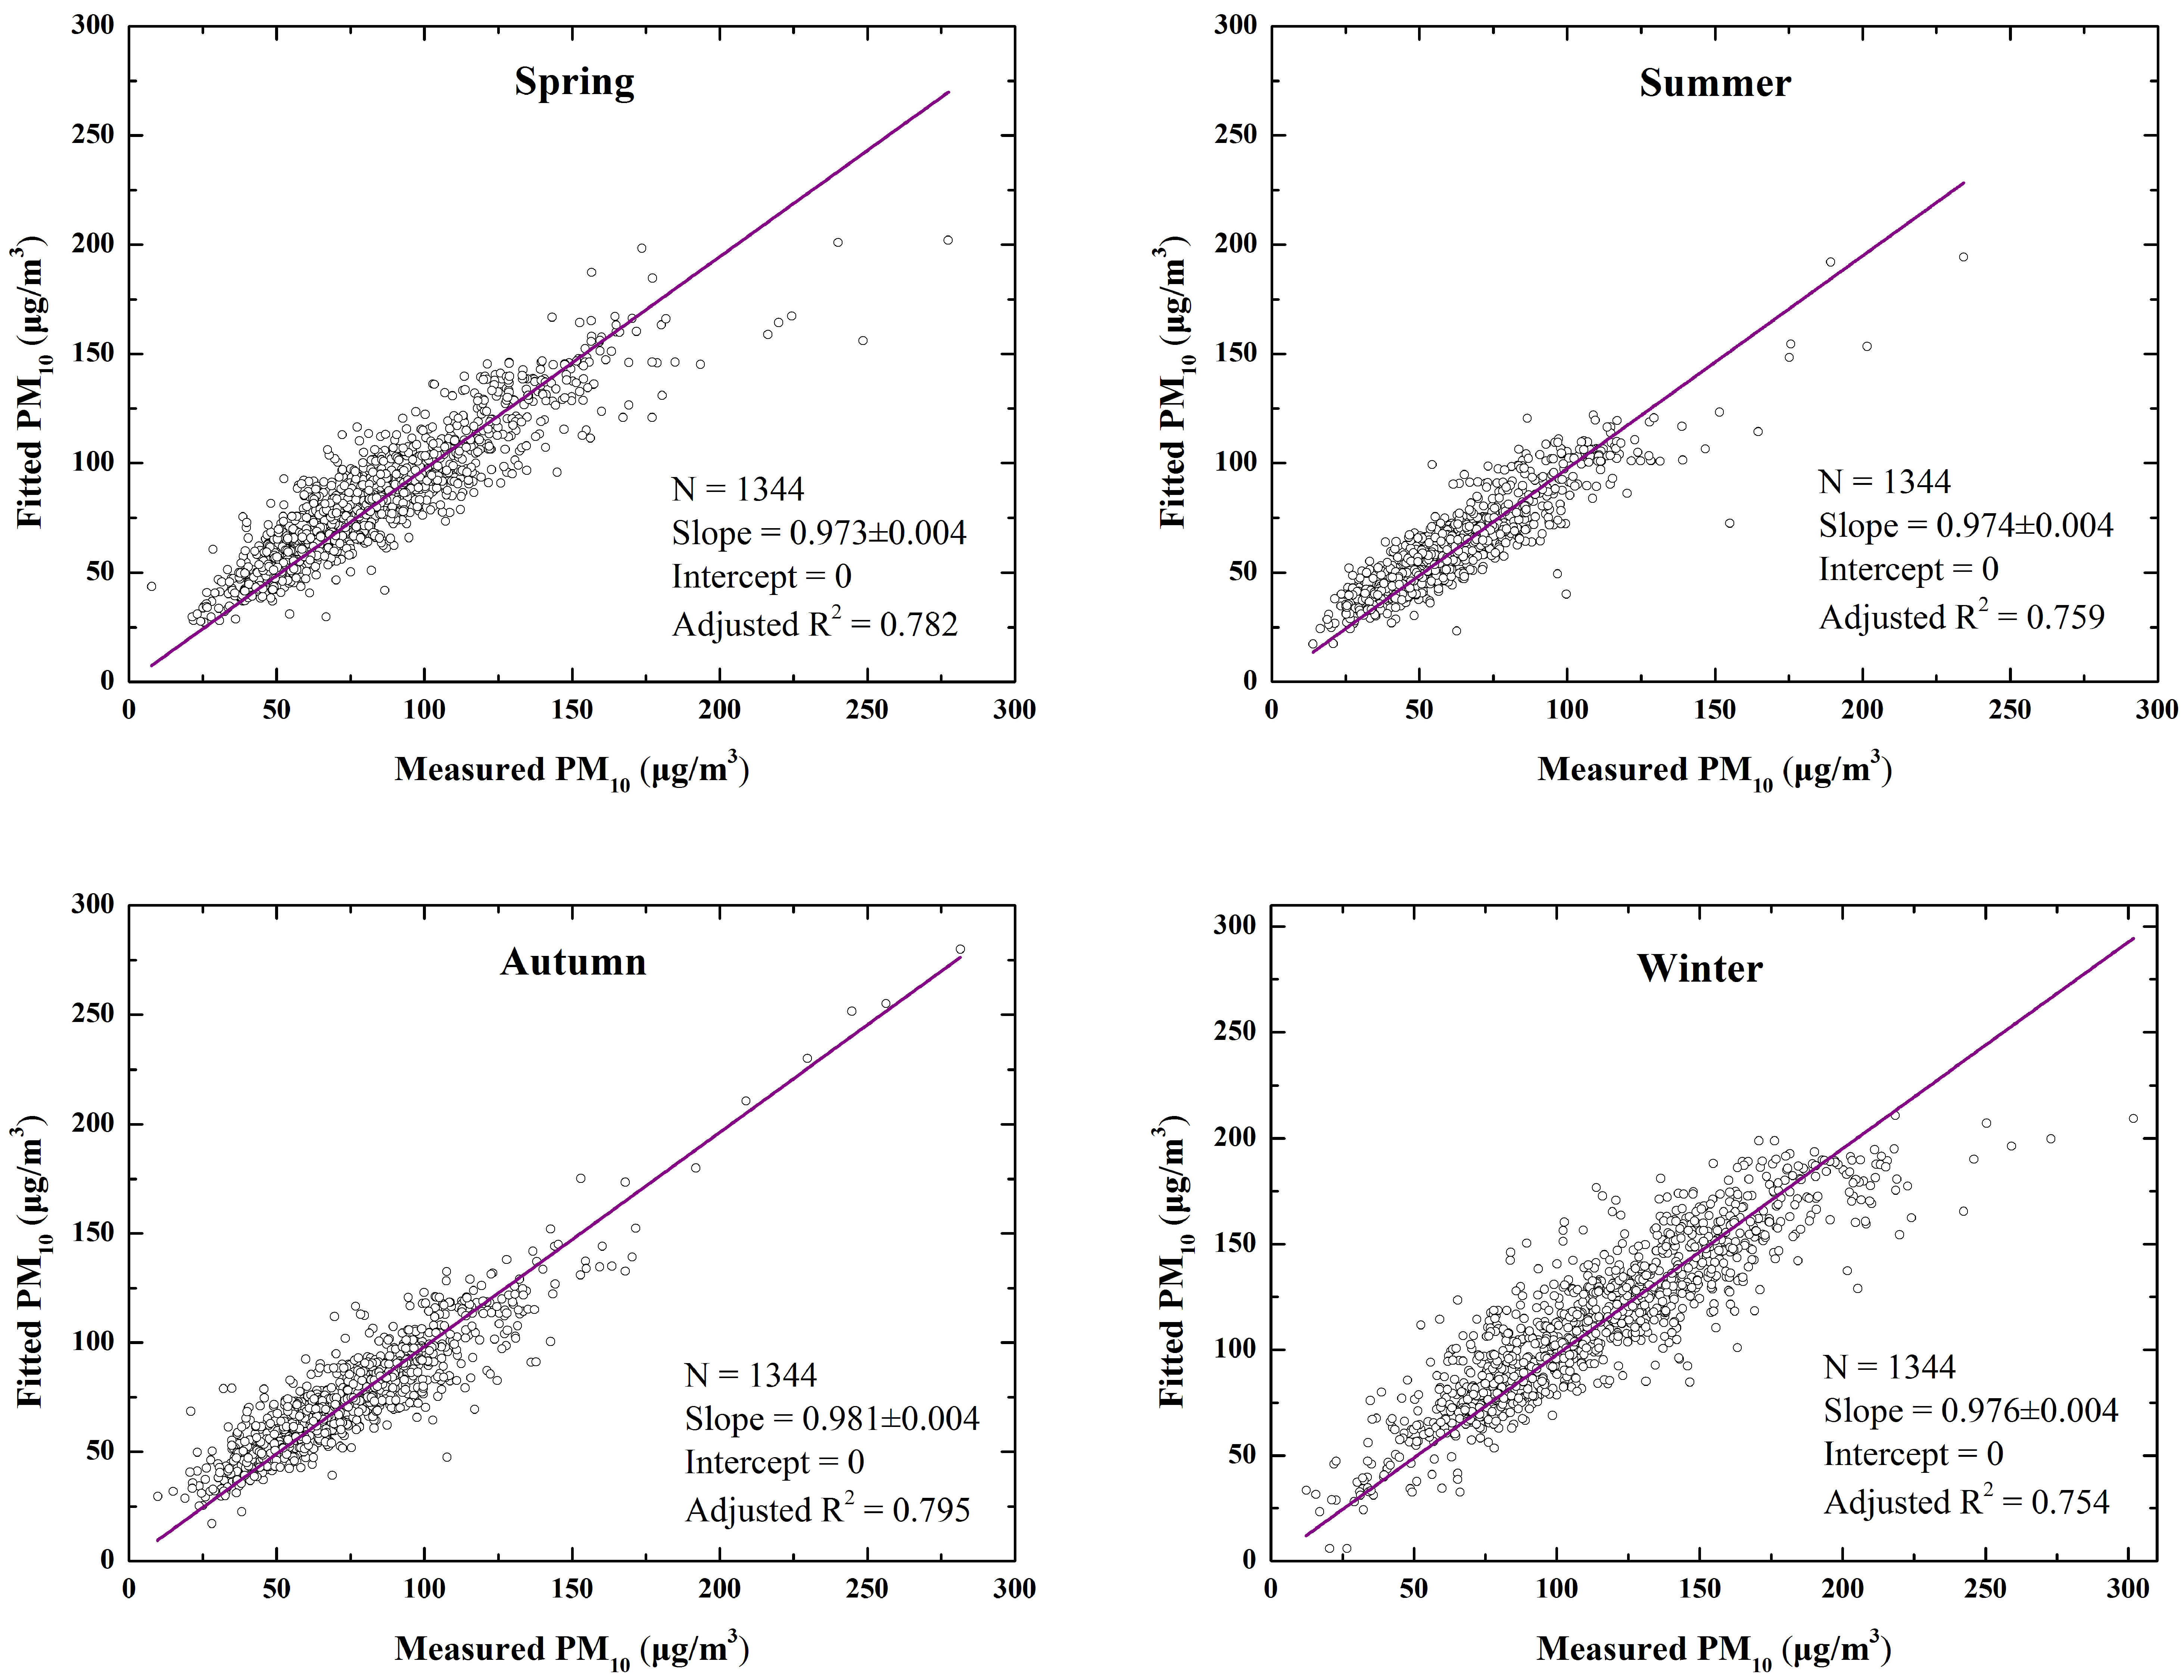
3.3. Model Result Validation and Comparison

As described above, there were 1344 matched data groups available for GWR model fitting. Figure 4 shows the scatter plots of the 10-fold cross validation for the GWR model established according to Equation (4). The overall R2 of the regression in Figure 4a between the fitted and measured PM10 mass concentration was 0.67, with Pearson’s coefficient of 0.82. In addition, the slope and the intercept of fitted line is 0.66 with 0.01 standard error and 28.10 with 1.13 standard error, respectively. When the intercept was set to zero in Figure 4b, the adjusted R2 decreased to 0.51, but the fitted slope increased to 0.96 with standard error declining to 0.005. Ideally, all of the model points should settle on the fitted line with the slope equaling one and intercept equaling zero. Therefore, it can be concluded that most of the results in the original GWR model were adjacent to the true line, except for a small number of dispersed points with higher values of measured PM10. These points of higher value might be geographically surrounded by points of general value, which forces the GWR model to underestimate their weight and accuracy.
Similar results are demonstrated in Figure 5, which shows the scatter plots of 10-fold cross validation for the physics-based GWR model established according to Equation (3). This physics-based GWR model corrected PM10 using surface RH and column AOD using PBLH instead of directly considering these two meteorological parameters as independent variables in the original GWR model. The overall R2 of regression in Figure 5a between the fitted and measured PM10 mass concentration is 0.81, with a Pearson’s coefficient of 0.90, which is significantly higher than other methods. In addition, the slope and intercept of the fitted line is 0.79 with 0.01 standard error and 17.16 with 0.90 standard error, respectively. These results prove that the physics-based GWR model performed better than the conventional GWR model at the national-scale.
The fitted results in this study were able to explain 80.6% of the variability in the corresponding PM10 mass concentrations, which offered improvement to a certain extent on model accuracy from approximately 0.7 to 0.8 compared to previous studies using the GWR model under similar parameter conditions [25,37]. Apart from the improvement on result accuracy, there still exist other ways to further improve the modeling performance. For instance, the meteorological parameters in this study were reanalysis data, which possesses characteristics of coarse spatial resolution and relatively inferior accuracy. The accuracy of model would increase if ground level meteorological station datasets had been adopted. Nevertheless, reanalysis products are available to the public so that relevant departments or scientific research institutions could conveniently, and without restriction, employ these data in estimating nationwide PM10 using this physics-based GWR model.
To further reveal the seasonal variation in accuracy of regression model performance, the data have been divided into four subsets corresponding to four seasons defined by astronomy and climate method conjunctively. Namely, spring includes the months of March, April, and May; summer refers to June, July, and August; autumn consists of September, October, and November; winter includes December, January, and February. As shown in Figure 6, when the intercept was manually set to zero as plot points should settle on the fitted line with intercept equaling zero, the AOD-derived PM10 still obtained great correlations with measured values, with their adjusted R2 ranging from 0.75 to 0.80. The performances of GWR model in summer and winter were slightly weaker than performances in spring and autumn, however the mass concentrations of PM10 possessed difference to a certain extent throughout four seasons. In other words, the seasonal variation of PM10 mass concentrations did not have great impact on the GWR model, indicating the robustness of model performance. Thus, the different performance of GWR model could be resulted by meteorological conditions, and relatively extreme meteorological parameters such as temperature, precipitation and relative humidity, which usually appear in summer and winter, would introduce slight errors into modeling.

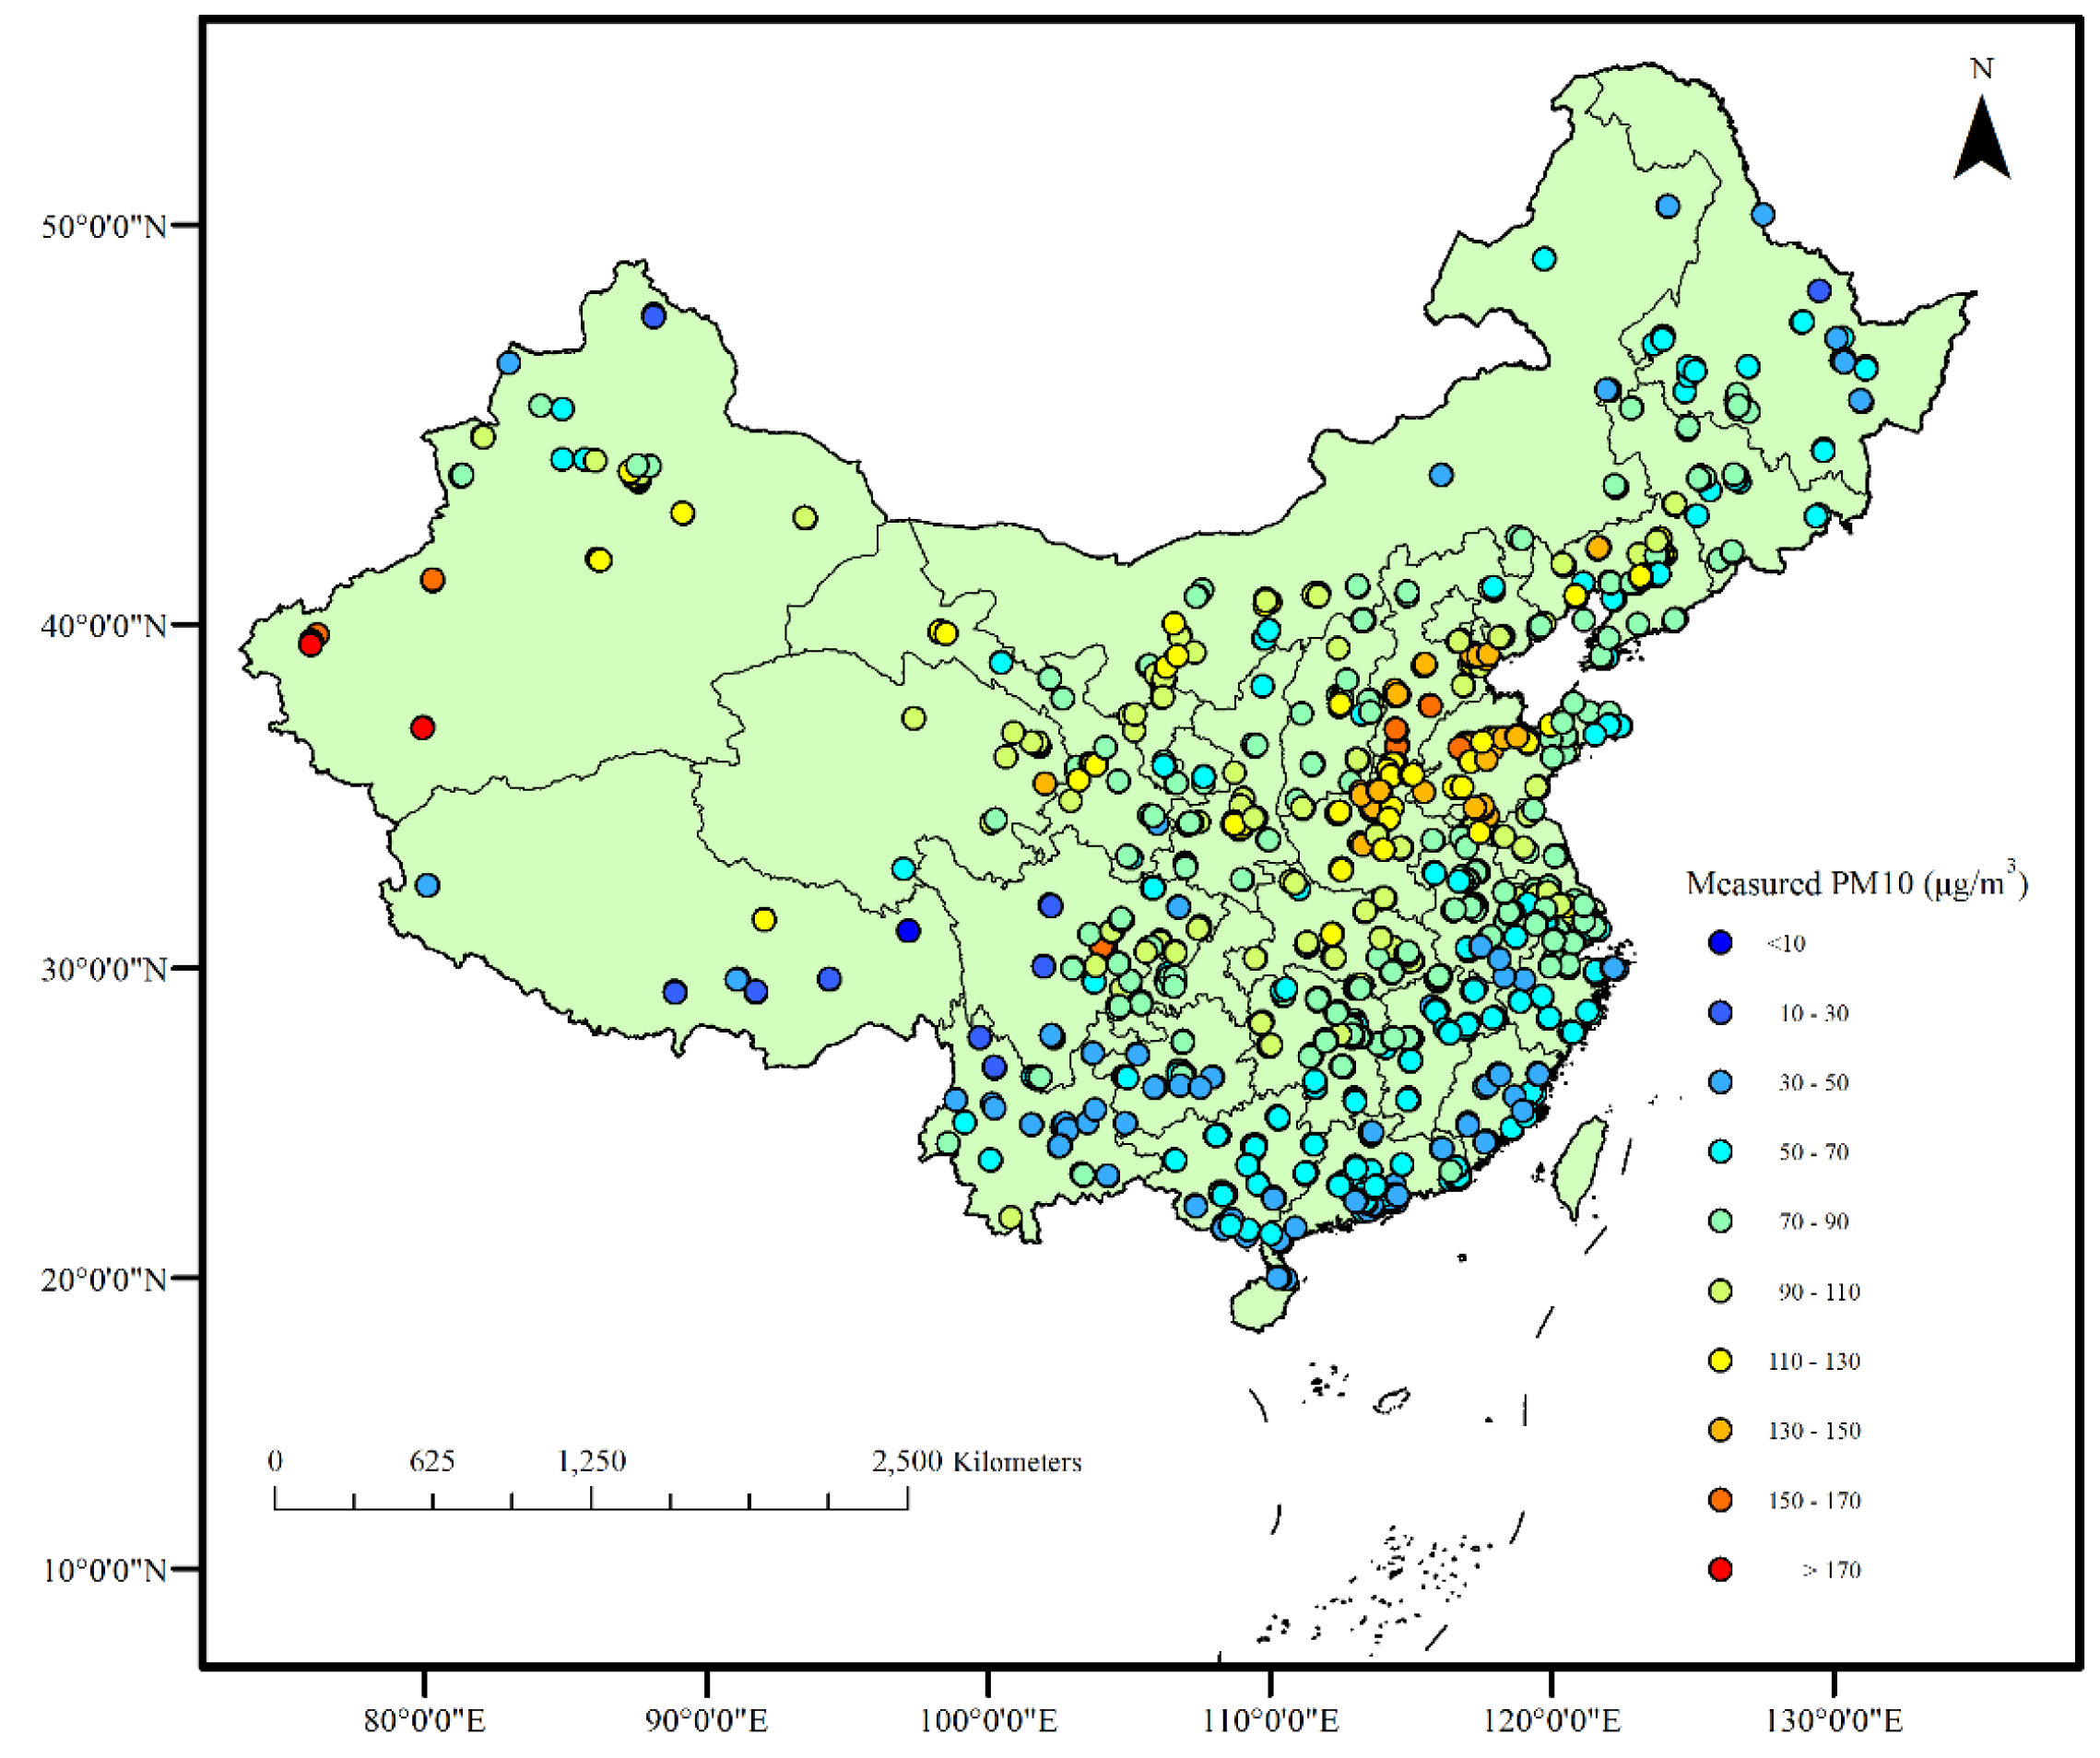
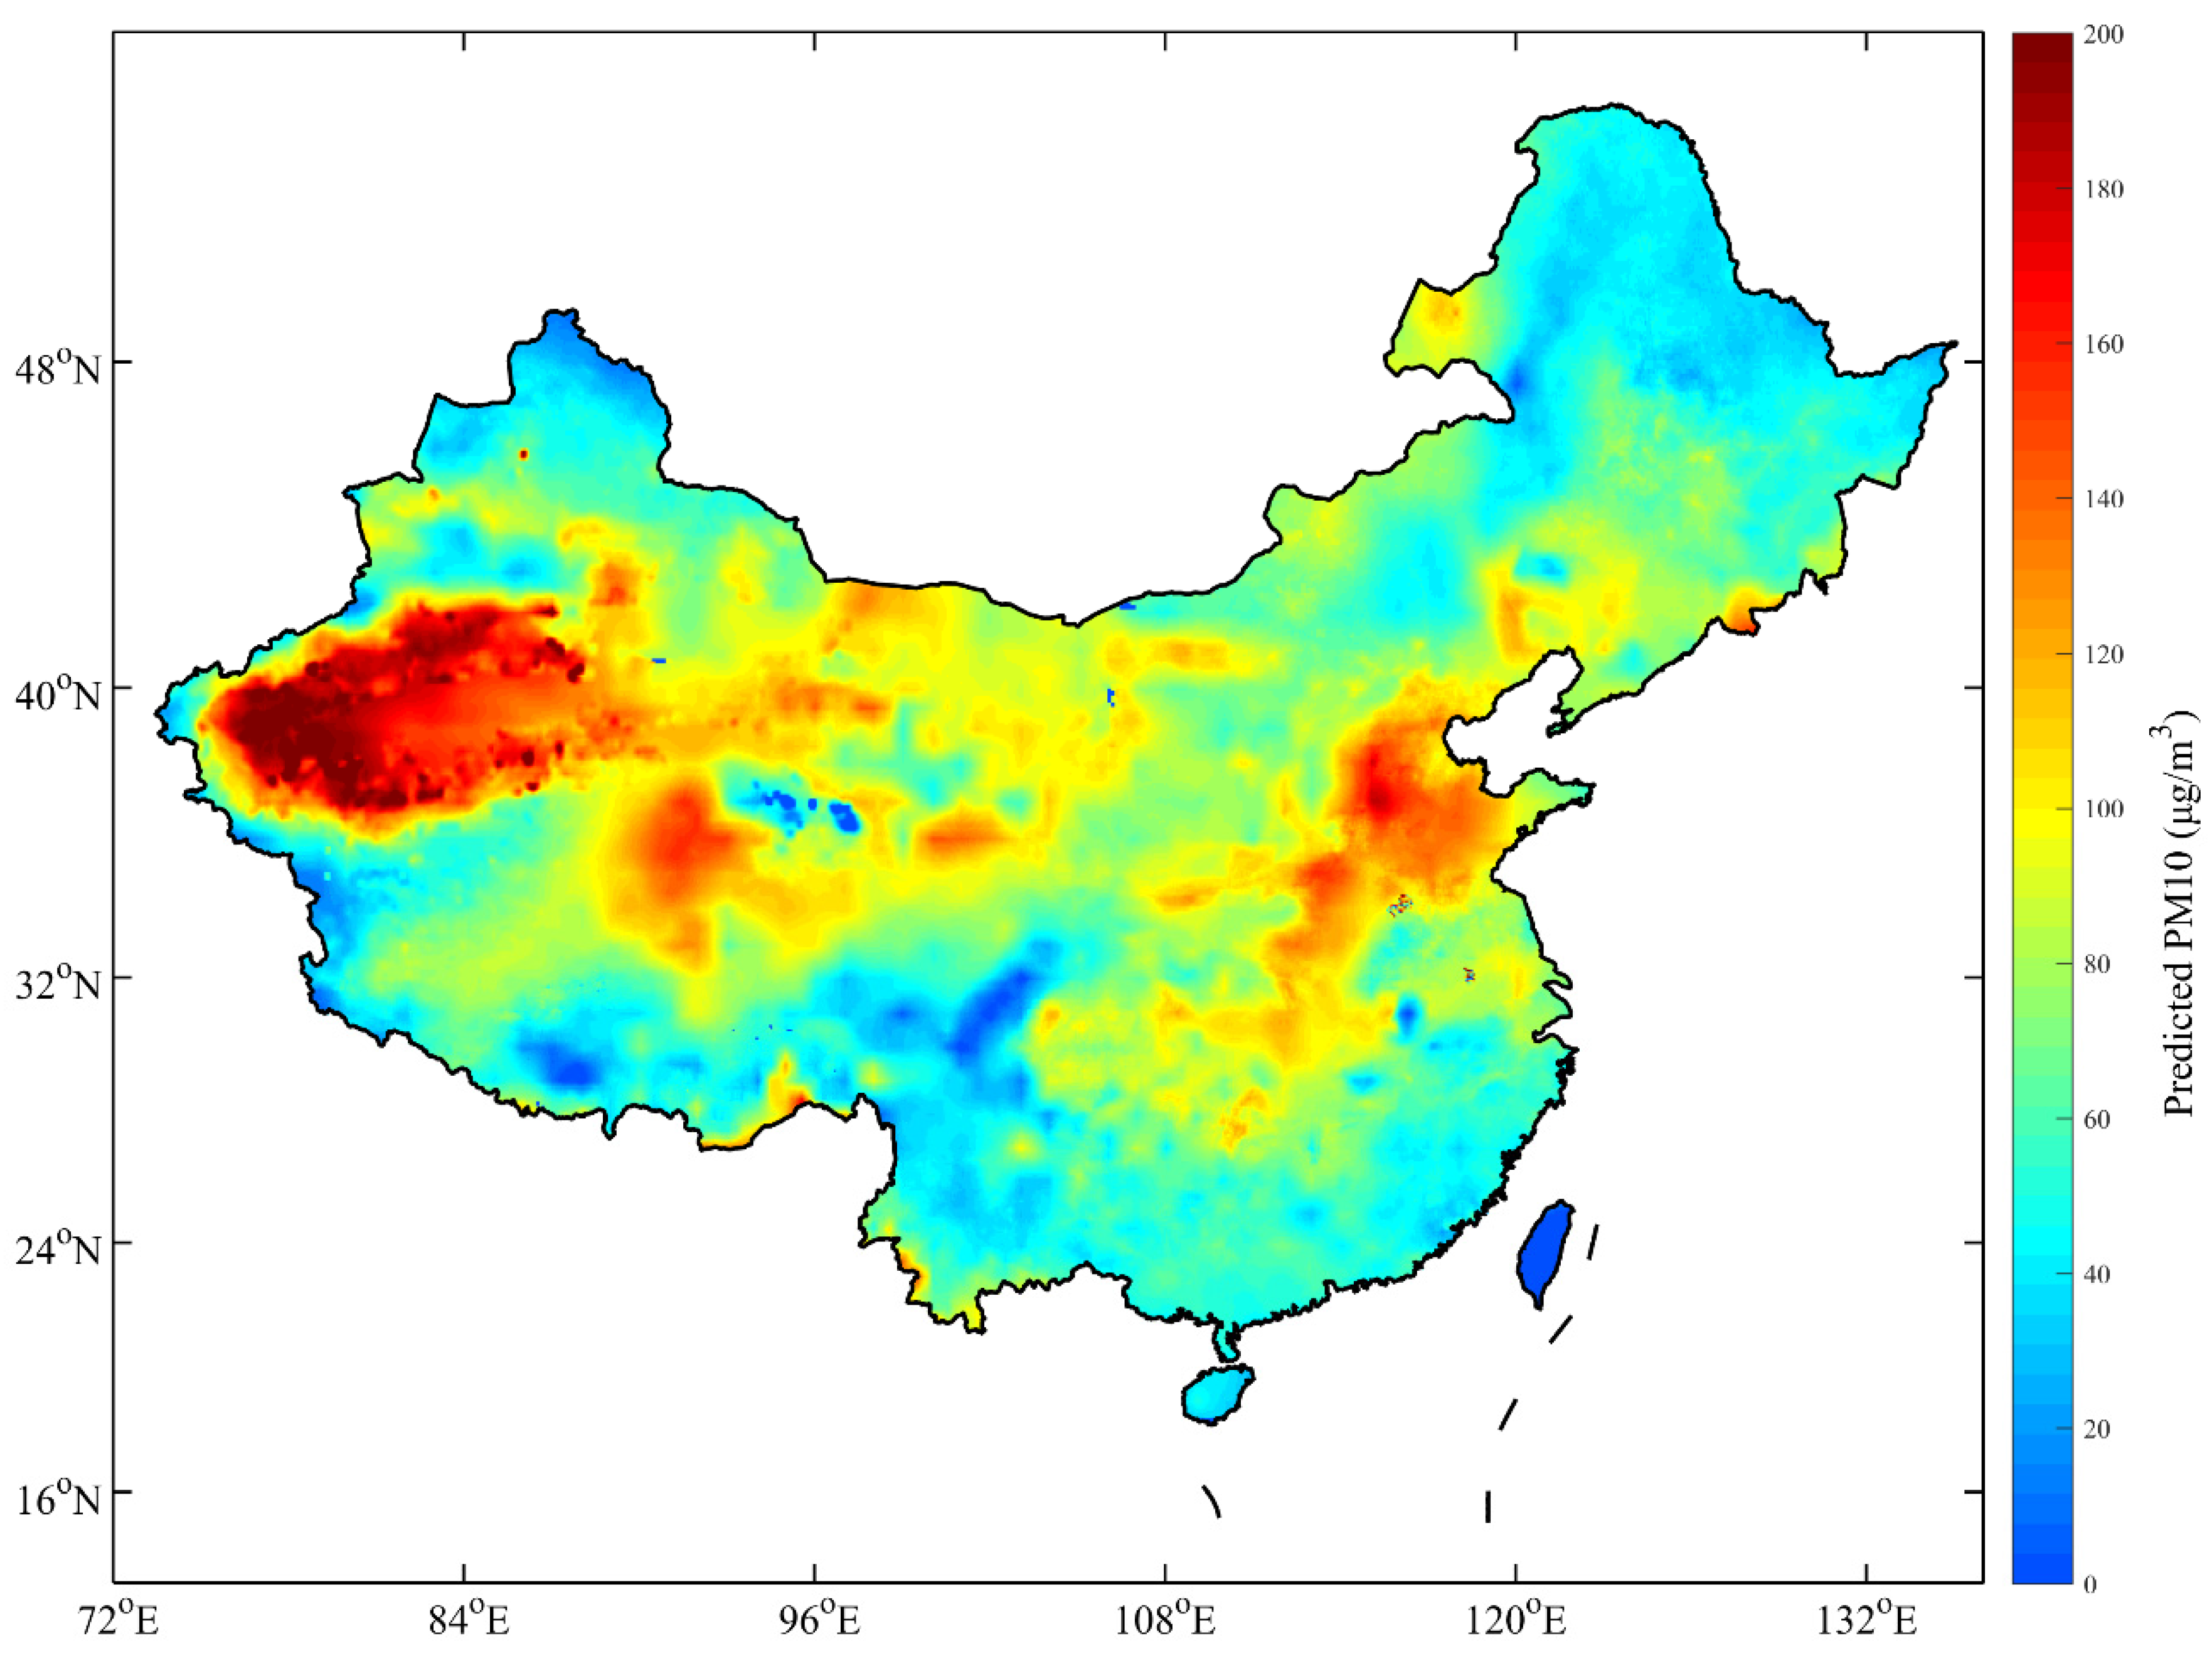
3.4. Annual Estimation of PM10 Mass Concentrations

The ground measured annual average PM10 mass concentrations in 2015 under the same coordinate frame are shown in Figure 7. As a comparison, the AOD-derived annual average PM10 in China are illustrated in Figure 8, which were predicted from MODIS AOD products and meteorological reanalysis data with spatial resolution of 0.03 degree by the physics-based GWR model.
The annual average ground-level mass concentrations of PM10 from 1 January to 31 December 2015, which is demonstrated in Figure 7, displays a heterogeneous spatial distribution among dispersed regions, while the annual average fitted PM10 from MODIS AOD products exhibits a more continuous coverage spanning the whole China. The highest values of PM10 appeared in Xinjiang Autonomous Region, followed by the Beijing-Tianjin Metropolitan Region (including Beijing, Tianjin, and Hebei) and Central China (including Henan, Hubei, and Hunan). Since the Tarim Basin is mainly covered by the Taklimakan Desert, where dust aerosol is primarily formed from primal generation and entrained effect across eastern Asia [38], the southern part of Xinjiang Autonomous Region is a heavily polluted area with annual average PM10 over 200 µg/m3. The annual average PM10 mass concentrations are generally higher than 160 µg/m3 in the Beijing-Tianjin Region, while the annual average PM10 mass concentrations in Central China are generally greater than 140 µg/m3. These regions with high levels of urbanization and industry, combined with the intense human activity by large populations in these areas, can be clearly identified from the prediction PM10 map. The cleanest regions are in Hainan, Tibet, Yunnan and Heilongjiang, where the annual average PM10 loadings are generally lower than 50 µg/m3.

4. Discussion

As stated above, the semi-physical GWR model has achieved relatively satisfied accuracy in results. However, the accessible averaged datasets of this experiment also have their limitations, which directly eliminate the intrinsic physicochemical interaction mechanism. For instance, the hysteresis effects of precipitation may influence the mass concentrations of atmospheric particles in the next few days rather than that day, and wind could not only blow away or dilute atmospheric particles but also bring in exogenous pollutants. Therefore, based on the limitations of datasets, this study consider that adopting the averaged meteorological parameters in regression represents one specific climate condition at the according region which is similar with the idea of geographically weighted regression model.
In general, the semi-physical GWR model proved to perform effectively when estimating spatial distribution of PM10 mass concentrations in China. Nevertheless, it should not be ignored that the AOD-derived PM10 concentrations still exist some phenomena of deviated-estimation in several regions. For instance, a figuratively marginal effect was detected on the fringe of PM10 prediction map, especially in southwestern China (Figure 8). Besides, the AOD-derived PM10 was over-fitted in Xinjiang, Qinghai, and Sichuan, with the estimated concentrations of PM10 in the central Xinjiang Province up to 250 μg/m3, while the western part of Sichuan Province and northwest part of Qinghai Province both gained estimated concentrations down to 10 µg/m3. There are several possible reasons to explain deviations in model estimation. First, the frequent changes of elevation in a relatively small region might seem irresolvable in adaptive bandwidth searching of the GWR model, which would introduce errors in estimation, because different elevation would possess distinct climatic conditions apparently affecting model’s independent variables such as atmospheric pressure, temperature, and PBLH. Second, the spatially heterogeneous distribution of PM10 monitoring sites, which are concentrated in urban regions, but are quite sparse in rural areas, such as Qinghai and western Sichuan, may lead to a certain unbalance in the GWR model. However, this potential estimation error would be alleviated by the expansion of the environmental monitoring network in China [39]. Finally, although the MODIS AOD products have been proved to equipped satisfactory quality over China, their retrieval algorithm, which ideally adopts the near-infrared at 2.1 µm over dark surface, could lead to PM10 estimation deviations in some regions such as Taklimakan Deserts, since the accuracy of AOD retrievals change along with the variation of surface reflectance in different regions [40]. Moreover, since the sampling errors resulted from satellites proved to influence the long-term averaged PM10 derived from the satellite-derived AOD [41], the satellite-coverage may be restrained by its sampling limitation according to retrieval algorithm, especially reflecting on aerosol loadings, clouds, and surface reflectance conditions.

5. Conclusions

A semi-physical GWR model was applied to estimate nationwide mass concentration of PM10 using MODIS AOD with 3 km spatial resolution and NCEP Reanalysis meteorological parameters. The results from the physics-based revision indicated that the surface RH correction on PM10 and vertical correction on AOD could remarkably improve the quality of dataset for better model performance, where the adjusted R2 increased from 0.08 to 0.43. Moreover, the semi-physical GWR model could explain approximately 81% of the variability in the corresponding PM10 mass concentrations, and the comparison between the semi-physical GWR model and conventional GWR model showed that estimation accuracy can be improved under similar parameter conditions. The accuracy could further improve if meteorological data from ground meteorological stations had been adopted. In addition, the semi-physical GWR model was applied respectively in four seasons to reveal the seasonal variation in accuracy of model performance. Furthermore, the spatial distribution of annual average PM10 mass concentrations for the semi-physical GWR model indicated that the marginal effect on the fringe of southwestern China and the over-fitting phenomenon arose in modeling in Xinjiang, Qinghai, and Sichuan. This could be primarily influenced by the frequent changes of elevation in a small region, the spatially heterogeneous distribution of PM10 monitoring sites, and satellite sampling limitation according to AOD retrieval algorithm.
In summary, the semi-physical GWR model discussed in this study provides an effective and efficient method to estimate ground-level PM10 at national-scale using readily available satellite-derived AOD products and NCEP reanalysis meteorological data. In order to achieve even better results, further research on the modeling mechanism and model uncertainties are currently in progress. The results from mapping national-scale PM10 mass concentrations could offer reasonable estimations of health impacts, and provide valuable guidance on emission control strategies and policy making in China.

Acknowledgments

This study was financially supported by the National Natural Science Foundation of China (No. 41101334, No. 41127901), China Postdoctoral Science Foundation (No. 2015M572198), and the Natural Science Foundation of Hubei (No. 2015CFA002). We express our sincere gratitude to all members of the Lidar group in LIESMARS, Wuhan University, China.

Author Contributions

The study was carried out in collaboration between all authors. Tianhao Zhang designed the research topic and conducted the experiment. Wei Gong wrote the paper. Zhongmin Zhu, Kun Sun, Yusi Huang and Yuxi Ji examined the experimental data and checked the experimental results. All authors agreed to submission of the manuscript.

Conflicts of Interest

The authors declare no conflict of interest.

References

  1. Kaufman, Y.J.; Tanré, D.; Boucher, O. A satellite view of aerosols in the climate system. Nature 2002, 419, 215–223. [Google Scholar] [CrossRef] [PubMed]
  2. Brunekreef, B.; Forsberg, B. Epidemiological evidence of effects of coarse airborne particles on health. Eur. Respir. J. 2005, 26, 309–318. [Google Scholar] [CrossRef] [PubMed]
  3. Peters, A.; Dockery, D.W.; Muller, J.E.; Mittleman, M.A. Increased particulate air pollution and the triggering of myocardial infarction. Circulation 2001, 103, 2810–2815. [Google Scholar] [CrossRef] [PubMed]
  4. Chan, C.K.; Yao, X. Air pollution in mega cities in China. Atmos. Environ. 2008, 42, 1–42. [Google Scholar] [CrossRef]
  5. Gong, W.; Zhang, T.; Zhu, Z.; Ma, Y.; Ma, X.; Wang, W. Characteristics of PM1.0, PM2.5, and PM10, and their relation to black carbon in Wuhan, central China. Atmosphere 2015, 6, 1377–1387. [Google Scholar] [CrossRef]
  6. Hu, X.; Waller, L.A.; Al-Hamdan, M.Z.; Crosson, W.L.; Estes, M.G.; Estes, S.M.; Quattrochi, D.A.; Sarnat, J.A.; Liu, Y. Estimating ground-level PM2.5 concentrations in the Southeastern US using geographically weighted regression. Environ. Res. 2013, 121, 1–10. [Google Scholar] [CrossRef] [PubMed]
  7. Hu, X.; Waller, L.A.; Lyapustin, A.; Wang, Y.; Al-Hamdan, M.Z.; Crosson, W.L.; Estes, M.G.; Estes, S.M.; Quattrochi, D.A.; Puttaswamy, S.J. Estimating ground-level PM2.5 concentrations in the Southeastern United States using maiac AOD retrievals and a two-stage model. Remote Sens. Environ. 2014, 140, 220–232. [Google Scholar] [CrossRef]
  8. Li, L.; Yang, J.; Wang, Y. Retrieval of high-resolution atmospheric particulate matter concentrations from satellite-based aerosol optical thickness over the Pearl River Delta Area, China. Remote Sens. 2015, 7, 7914–7937. [Google Scholar] [CrossRef]
  9. Chu, D.A.; Kaufman, Y.; Zibordi, G.; Chern, J.; Mao, J.; Li, C.; Holben, B. Global monitoring of air pollution over land from the earth observing system-terra moderate resolution imaging spectroradiometer (MODIS). J. Geophys. Res. Atmos. 2003, 108. [Google Scholar] [CrossRef]
  10. Koelemeijer, R.; Homan, C.; Matthijsen, J. Comparison of spatial and temporal variations of aerosol optical thickness and particulate matter over Europe. Atmos. Environ. 2006, 40, 5304–5315. [Google Scholar] [CrossRef]
  11. Engel-Cox, J.A.; Hoff, R.M.; Haymet, A. Recommendations on the use of satellite remote-sensing data for urban air quality. J. Air Waste Manag. Assoc. 2004, 54, 1360–1371. [Google Scholar] [CrossRef] [PubMed]
  12. Gupta, P.; Christopher, S.A.; Wang, J.; Gehrig, R.; Lee, Y.; Kumar, N. Satellite remote sensing of particulate matter and air quality assessment over global cities. Atmos. Environ. 2006, 40, 5880–5892. [Google Scholar] [CrossRef]
  13. Gupta, P.; Christopher, S.A. Particulate matter air quality assessment using integrated surface, satellite, and meteorological products: Multiple regression approach. J. Geophys. Res. Atmos. 2009, 114, 1159–1171. [Google Scholar] [CrossRef]
  14. Liu, Y.; Sarnat, J.A.; Kilaru, V.; Jacob, D.J.; Koutrakis, P. Estimating ground-level PM2.5 in the Eastern United States using satellite remote sensing. Environ. Sci. Technol. 2005, 39, 3269–3278. [Google Scholar] [CrossRef] [PubMed]
  15. Wallace, J.; Kanaroglou, P. An investigation of air pollution in southern Ontario, Canada, with MODIS and MISR aerosol data. In Proceedings of the 2007 IEEE International Geoscience and Remote Sensing Symposium, Barcelona, Spain, 23–28 July 2007.
  16. Benas, N.; Beloconi, A.; Chrysoulakis, N. Estimation of urban PM10 concentration, based on MODIS and MERIS/AATSR synergistic observations. Atmos. Environ. 2013, 79, 448–454. [Google Scholar] [CrossRef]
  17. Paciorek, C.J.; Liu, Y.; Moreno-Macias, H.; Kondragunta, S. Spatiotemporal associations between goes aerosol optical depth retrievals and ground-level PM2.5. Environ. Sci. Technol. 2008, 42, 5800–5806. [Google Scholar] [CrossRef] [PubMed]
  18. Lee, H.; Liu, Y.; Coull, B.; Schwartz, J.; Koutrakis, P. A novel calibration approach of MODIS AOD data to predict PM2.5 concentrations. Atmos. Chem. Phys. Discuss. 2011, 11, 9769–9795. [Google Scholar] [CrossRef]
  19. Yap, X.; Hashim, M. A robust calibration approach for PM10 prediction from MODIS aerosol optical depth. Atmos. Chem. Phys. Discuss. 2012, 12, 31483–31505. [Google Scholar] [CrossRef]
  20. Wu, Y.; Guo, J.; Zhang, X.; Tian, X.; Zhang, J.; Wang, Y.; Duan, J.; Li, X. Synergy of satellite and ground based observations in estimation of particulate matter in Eastern China. Sci. Total Environ. 2012, 433, 20–30. [Google Scholar] [CrossRef] [PubMed]
  21. Stewart Fotheringham, A.; Charlton, M.; Brunsdon, C. The geography of parameter space: An investigation of spatial non-stationarity. Int. J. Geogr. Inform. Syst. 1996, 10, 605–627. [Google Scholar] [CrossRef]
  22. Zhao, N.; Yang, Y.; Zhou, X. Application of geographically weighted regression in estimating the effect of climate and site conditions on vegetation distribution in haihe catchment, China. Plant Ecol. 2010, 209, 349–359. [Google Scholar] [CrossRef]
  23. Wang, Z.; Chen, L.; Tao, J.; Zhang, Y.; Su, L. Satellite-based estimation of regional particulate matter (PM) in Beijing using Vertical-and-RH correcting method. Remote Sens. Environ. 2010, 114, 50–63. [Google Scholar] [CrossRef]
  24. Song, W.; Jia, H.; Huang, J.; Zhang, Y. A satellite-based geographically weighted regression model for regional PM2.5 estimation over the Pearl River Delta region in China. Remote Sens. Environ. 2014, 154, 1–7. [Google Scholar] [CrossRef]
  25. China Environmental Monitoring Center. Available online: http://113.108.142.147:20035/emcpublish/ (accessed on 23 June 2016).
  26. Ma, Z.; Hu, X.; Huang, L.; Bi, J.; Liu, Y. Estimating ground-level PM2.5 in China using satellite remote sensing. Environ. Sci. Technol. 2014, 48, 7436–7444. [Google Scholar] [CrossRef] [PubMed]
  27. Chu, D.; Kaufman, Y.; Ichoku, C.; Remer, L.; Tanré, D.; Holben, B. Validation of MODIS aerosol optical depth retrieval over land. Geophys. Res. Lett. 2002, 29. [Google Scholar] [CrossRef]
  28. Engel-Cox, J.A.; Holloman, C.H.; Coutant, B.W.; Hoff, R.M. Qualitative and quantitative evaluation of MODIS satellite sensor data for regional and urban scale air quality. Atmos. Environ. 2004, 38, 2495–2509. [Google Scholar] [CrossRef]
  29. Ma, Z.; Hu, X.; Sayer, A.M.; Levy, R.; Zhang, Q.; Xue, Y.; Tong, S.; Bi, J.; Huang, L.; Liu, Y. Satellite-based spatiotemporal trends in PM2.5 concentrations: China, 2004–2013. Environ. Health Perspect. 2015. [Google Scholar] [CrossRef] [PubMed]
  30. You, W.; Zang, Z.; Zhang, L.; Li, Y.; Pan, X.; Wang, W. National-scale estimates of ground-level PM2.5 concentration in China using geographically weighted regression based on 3 km resolution MODIS AOD. Remote Sens. 2016, 8. [Google Scholar] [CrossRef]
  31. Ma, Y.; Li, Z.; Li, Z.; Xie, Y.; Fu, Q.; Li, D.; Zhang, Y.; Xu, H.; Li, K. Validation of MODIS aerosol optical depth retrieval over mountains in central China based on a sun-sky radiometer site of SONET. Remote Sens. 2016, 8. [Google Scholar] [CrossRef]
  32. NASA LAADS MODIS. Available online: http://ladsweb.nascom.nasa.gov/ (accessed on 23 June 2016).
  33. CFS NCEP reanalysis meteorological datasource. Available online: http://cfs.ncep.noaa.gov/ (accessed on 23 June 2016).
  34. National Meteorological Information Center of China. Available online: http://data.cma.cn/ (accessed on 23 June 2016).
  35. Tian, J.; Chen, D. A semi-empirical model for predicting hourly ground-level fine particulate matter (PM2.5) concentration in southern Ontario from satellite remote sensing and ground-based meteorological measurements. Remote Sens. Environ. 2010, 114, 221–229. [Google Scholar] [CrossRef]
  36. Rodriguez, J.D.; Perez, A.; Lozano, J.A. Sensitivity analysis of k-fold cross validation in prediction error estimation. IEEE Trans. Pattern Anal. Mach. Intell. 2010, 32, 569–575. [Google Scholar] [CrossRef] [PubMed]
  37. Bai, Y.; Wu, L.; Qin, K.; Zhang, Y.; Shen, Y.; Zhou, Y. A geographically and temporally weighted regression model for ground-level PM2.5 estimation from satellite-derived 500 m resolution AOD. Remote Sens. 2016, 8. [Google Scholar] [CrossRef]
  38. Huang, J.; Minnis, P.; Chen, B.; Huang, Z.; Liu, Z.; Zhao, Q.; Yi, Y.; Ayers, J.K. Long-range transport and vertical structure of Asian dust from Calipso and surface measurements during PACDEX. J. Geophys. Res. Atmos. 2008, 113, 2036–2044. [Google Scholar] [CrossRef]
  39. Yuan, Y.; Liu, S.; Castro, R.; Pan, X. PM2.5 monitoring and mitigation in the cities of China. Environ. Sci. Technol. 2012, 46, 3627–3628. [Google Scholar] [CrossRef] [PubMed]
  40. Zhang, H.; Hoff, R.M.; Engel-Cox, J.A. The relation between moderate resolution imaging spectroradiometer (MODIS) aerosol optical depth and PM2.5 over the United States: A geographical comparison by us environmental protection agency regions. J. Air Waste Manag. Assoc. 2009, 59, 1358–1369. [Google Scholar] [CrossRef] [PubMed]
  41. Xie, Y.; Wang, Y.; Zhang, K.; Dong, W.; Lv, B.; Bai, Y. Daily estimation of ground-level PM2.5 concentrations over Beijing using 3 km resolution MODIS AOD. Environ. Sci. Technol. 2015, 49, 12280–12288. [Google Scholar] [CrossRef] [PubMed]
Figure 1. Spatial distribution of the 1344 PM10 monitoring sites (solid yellow triangles) used for sample collection in this study, which displays little coverage on plateau and desert areas.
Atmosphere 07 00088 g001
Figure 2. Histograms and descriptive statistics of the variables in the whole model fitting data set.
Atmosphere 07 00088 g002
Figure 3. Scatter plot of original PM10 against original AOD (a); and revised PM10 against revised AOD (b) with linear regression and confidence ellipse of 95%.
Atmosphere 07 00088 g003
Figure 4. Scatter plot of cross validation for the original GWR model, using conventional linear regression (a); and linear regression with intercept fixed at zero (b).
Atmosphere 07 00088 g004
Figure 5. Scatter plot of cross validation for the physics-based GWR model, with conventional linear regression (a); and linear regression with intercept fixed at zero (b).
Atmosphere 07 00088 g005
Figure 6. Comparisons of seasonal mean AOD-derived PM10 and ground-measured PM10 mass concentrations.
Atmosphere 07 00088 g006
Figure 7. Annual average ground measured PM10 mass concentrations depicted using color-classified symbols (See legend at right).
Atmosphere 07 00088 g007
Figure 8. Spatial distribution of annual average PM10 mass concentrations for the GWR model.
Atmosphere 07 00088 g008

