Article

Indirect Prediction of Welding Fume Diffusion inside a Room Using Computational Fluid Dynamics

1
Department of Eco-Friendly Offshore Plant FEED Engineering, Changwon National University, Changwon 641-773, Korea
2
Department of Environmental Engineering, Changwon National University, Changwon 641-773, Korea
3
Department of Occupational & Environmental Safety & Health, University of Wisconsin-Whitewater, 809 W. Starin Road, Whitewater, WI 53190, USA
*
Author to whom correspondence should be addressed.
Atmosphere 2016, 7(6), 74; https://doi.org/10.3390/atmos7060074
Submission received: 13 April 2016 / Revised: 17 May 2016 / Accepted: 20 May 2016 / Published: 25 May 2016

Abstract

:
Welding is an important and widely used process in the manufacturing and maintenance of various works involving metals and alloys. While welding has broad applications, the welding fume generated during the process has impacts on workers’ health, which needs to be addressed. One of the major steps that can be undertaken to take care of this issue is the use of ventilation, which requires knowledge of characteristics and dispersion of the welding fume in the workers’ breathing zone. It is difficult to assess welding fume dispersion from manual measurement due to numerous welding processes and sufficient data requirement. Numerical prediction of welding fume is dubious due to several errors. This paper considers the use of numerically predicted CO2 concentrations to indirectly predict welding fume distribution in workshops. This is based on the assumption that if the particles are sufficiently small size, they follow the diffusion pattern of gases. Experiments are carried out in a room with an opening and a welding fume generation system for measurement of CO2 and fume diffusion. The results show high possibility of predicting welding fume concentration based on Computational Fluid Dynamics (CFD) simulated CO2 concentration with a correlation coefficient of 0.74.

Graphical Abstract

1. Introduction

Welding technology is a necessary process in the construction and maintenance of industries, large structures, vehicles, ships, offshore structures, and a number of practices involving metal works [1,2]. Nowadays, some of the welding is operated with the help of machines and robots but most is still carried on manually for precision and quality of work. However, the disadvantage of manual welding is that the fumes produced during the process have a great impact on workers’ health [1]. These fumes consist of powders of different solid substances like Cu, Ni, Zn, etc. with sizes ranging from 1 to 7 μm. Along with the fumes, different gases such as CO2, CO, NOx, SOx, O3, etc., and numerous organic pollutants are also produced during the welding process [3]. The gases are formed and emitted due to the presence of extremely high temperature, ultraviolet radiation arising from the arc, and reactions of hot base metal with atmospheric O2 and N2. However, appearance of CO2 is an exception to those factors because it is generally used as a shielding gas in many welding processes [4]. Shielding gas is used in welding to protect the weld pool from oxidization in ambient air and to reduce fume emission [5]. Some of the examples of welding techniques using shielding gas are gas metal arc welding, electro-gas welding, laser beam welding, plasma arc cutting, etc. Among these techniques, gas metal arc welding is the most common and widely employed technique for joining metal and a vast range of alloys [6], and it uses Ar, He, O2, and CO2 as major shielding gases. Ar and He, being inert gases, do not cause major health and environmental risks, and generally produce good-quality welding, but are approximately ten times more expensive then CO2. For welding of steel structures, either 100% CO2 or combination of CO2 and these inert gases can be used. The additional advantage of using CO2 with other pure gases during welding of metals and alloys is to improve arc stability, minimize undercut, reduce porosity, and improve the appearance of the weld [2].
This kind of gas shielded welding is frequently performed in enclosed compartments and rooms such as in shipbuilding industries where the welder has exposure to a high concentration of fumes [7]. Gomes et al. did assessments of airborne ultrafine particles generated from tungsten inert gas, metal active gas, and friction stir welding, and found that all these processes emitted significant concentrations of ultrafine particles which were deposited in the lungs of exposed workers [8,9]. Inhalation of these fumes and gases have a great effect on lung function and causes acute as well as chronic diseases like lung cancer, infection, metal fume fever, etc. Hence, it is very essential to protect workers from welding fume exposure [10,11]. Reduction of welding fumes from workers zone is generally achieved by three processes: reduction at the source by changes in process and conditions, use of ventilation and exhausts, and use of a device for personal protection [1]. After reduction at the source, there is still a significant amount of fumes released which should be removed by employing a ventilation method. Welding fume generally consists of ultra-fine and fine particles ranging from a diameter of less than approximately 0.1 to 3 μm [12], which are difficult to remove by natural ventilation because these particles are easily influenced by the complex airflow pattern of the room [13]. The most widely-used ventilation method for control of these contaminants is local exhaust ventilation because it is more effective compared to general ventilation and dilution ventilation [14]. The design of local exhaust ventilation system to efficiently capture most of the fugitive fumes requires knowledge of concentration pattern of the dust near the contaminant source and transport of fumes from their source of origin to exhaust. Transport and concentration of fume is affected by factors like exhaust openings, ambient air currents, momentum of contaminant source, mobility of worker, etc. [15]. It is a difficult task to manually investigate transport pattern and concentration variation through experiments because sufficient numbers of measurements for more than 80 different welding and associated processes are difficult to achieve [16].
Instead of carrying out experiments, numerical methods can be used to predict the concentration of the fume particles, depending on provided conditions and related factors. Based on numerical methods, research has been done for prediction of particle concentration using Computational Fluid Dynamics (CFD) but the simulated results frequently have some divergence from the experimental results. The errors are due to limitations on the predictive methods, which do not take some factors such as particle size distribution and particle rebounding process into consideration [17]. Unlike modeling of particulate matter, CFD has been used in many previous studies with good performance to predict CO2 concentration profile and dispersion in a single room using natural as well as mechanical ventilation [18,19]. Lambert et al. compared the measured and CFD simulated values of CO2 decay in a controlled environment and found that the percent error between computational and experimental data was as low as 5.2% and concluded CFD as an effective tool to study ventilation behaviors [20].
The purpose of this study is to simulate the diffusion of CO2 and find some analogy to support utility of indirect prediction of welding fume concentration. This conjecture is based on the theory that if the particles are in range of sub micrometer level, their motion properties follow the diffusion rules of gases i.e., Brownian diffusion for movement in the air [21,22]. The initial part of the study is conducting measurement of welding fume particle size to find out if the majority of particles belong to sub micrometer range, which is followed by further experiments. The present work is directed towards the comparison of welding fume distribution measured inside the room and CO2 distribution simulated using CFD. If a satisfactory correlation between these two components is achieved, it provides an opportunity to formulate a basis for further studies related to this aspect.

2. Methodology

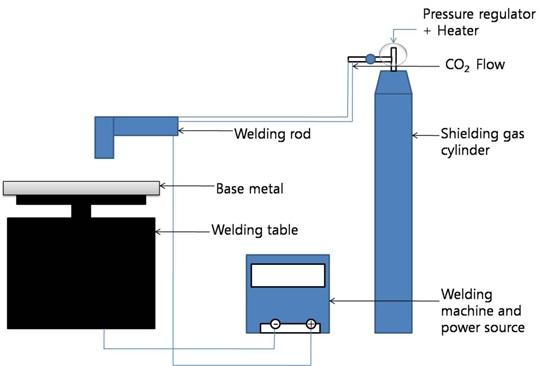
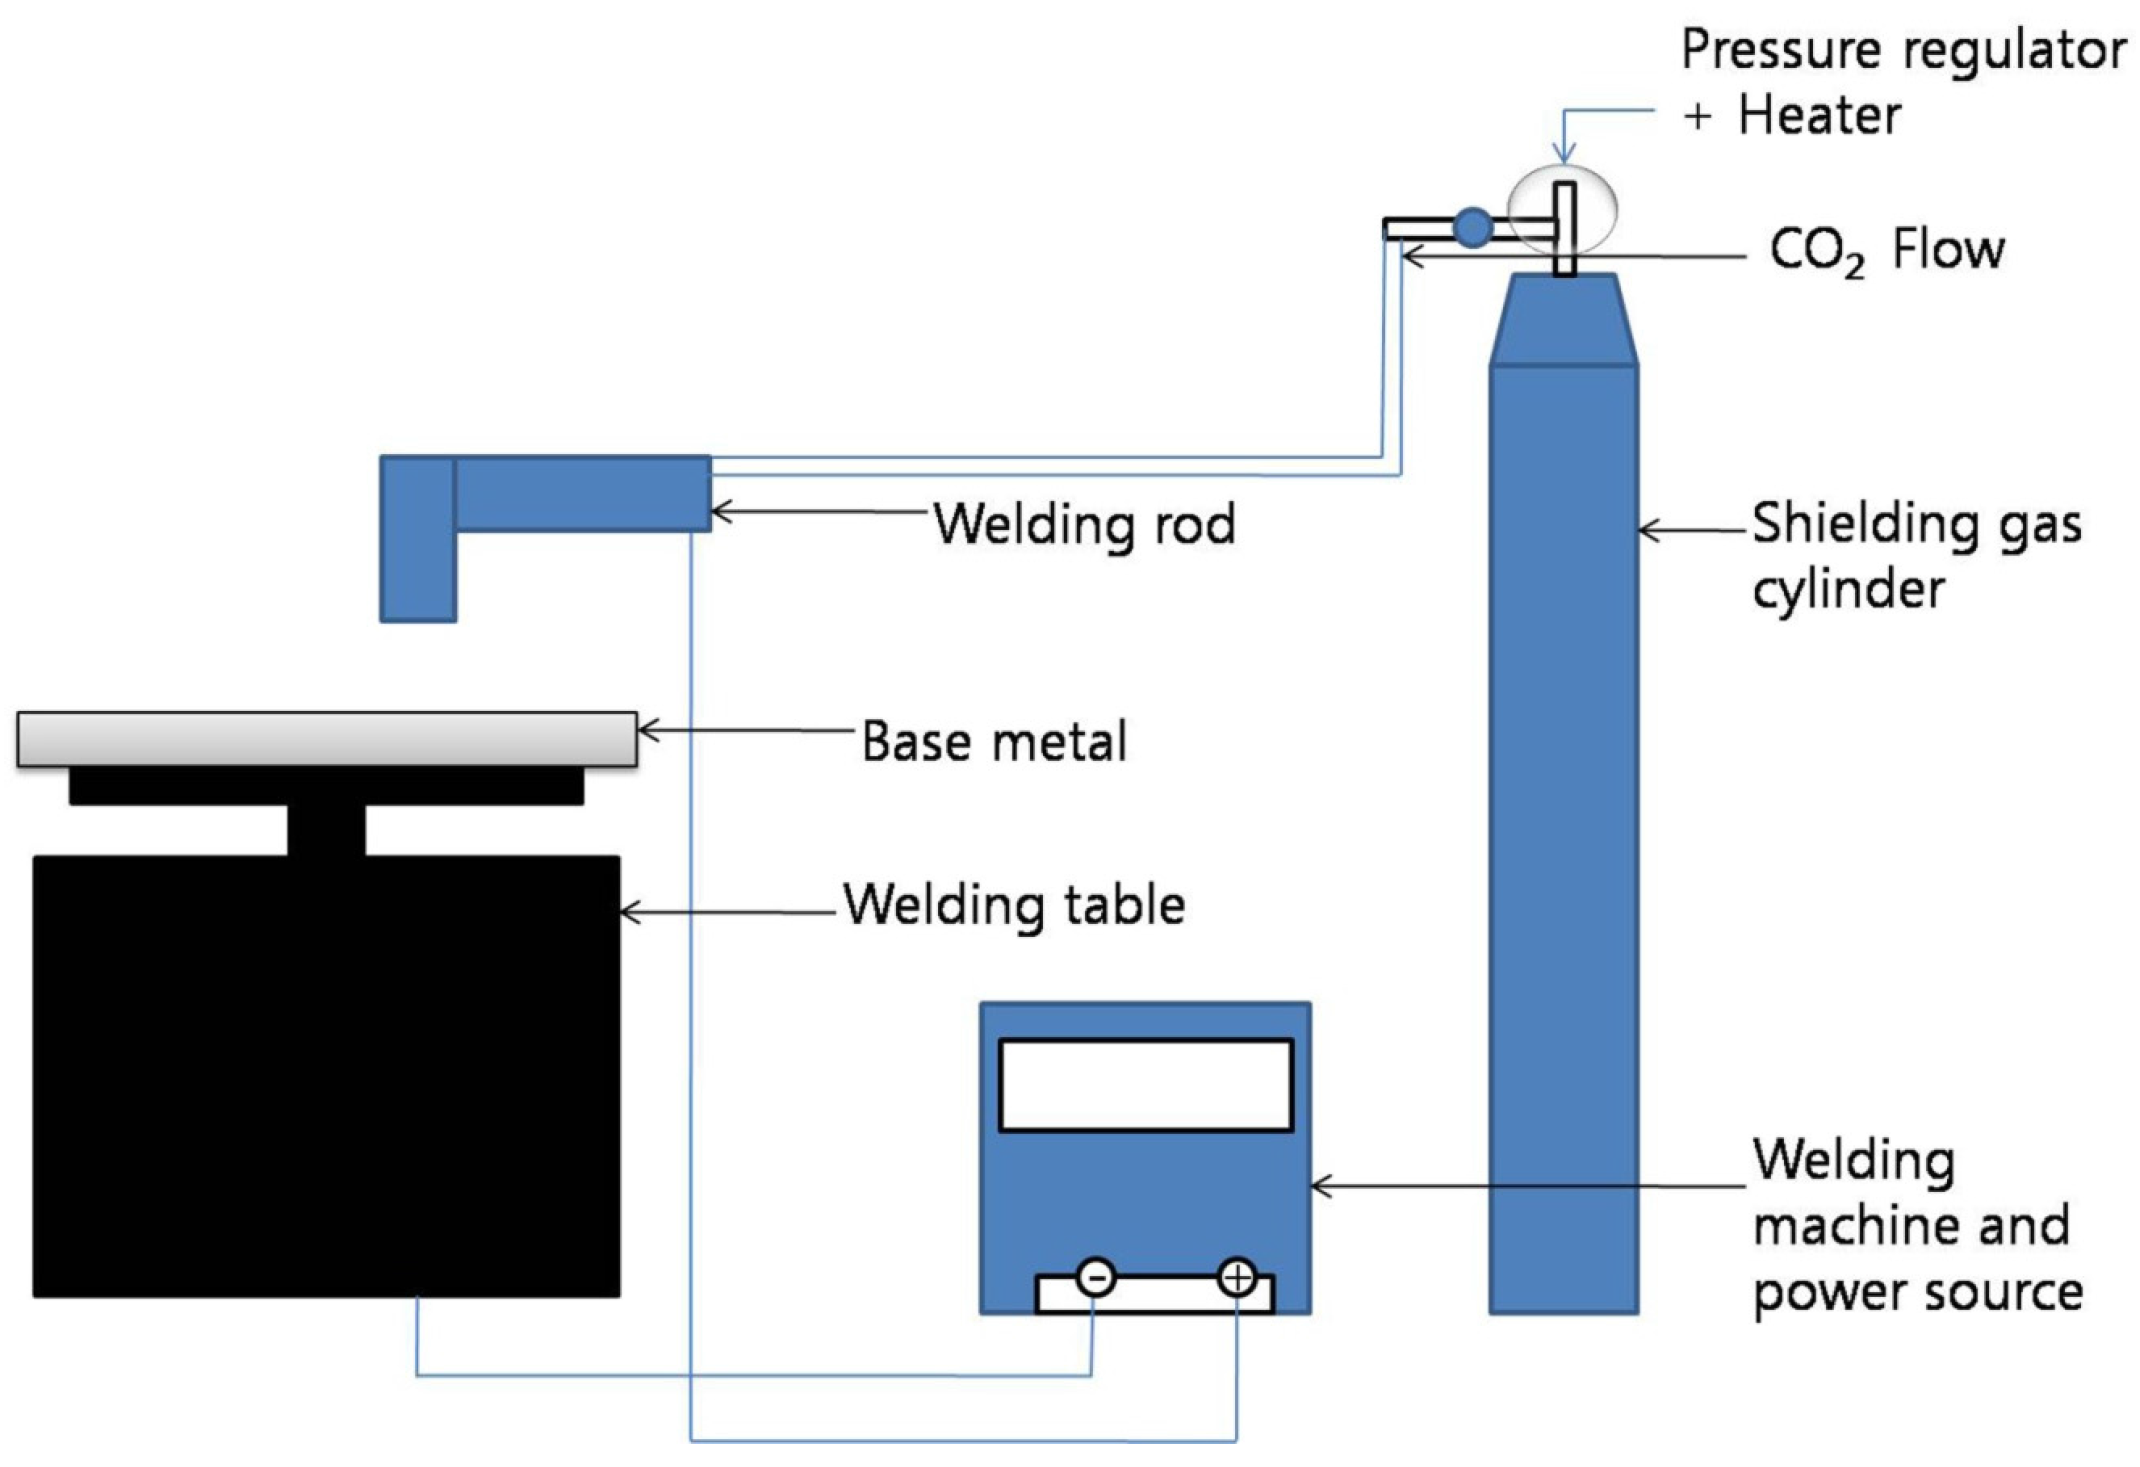
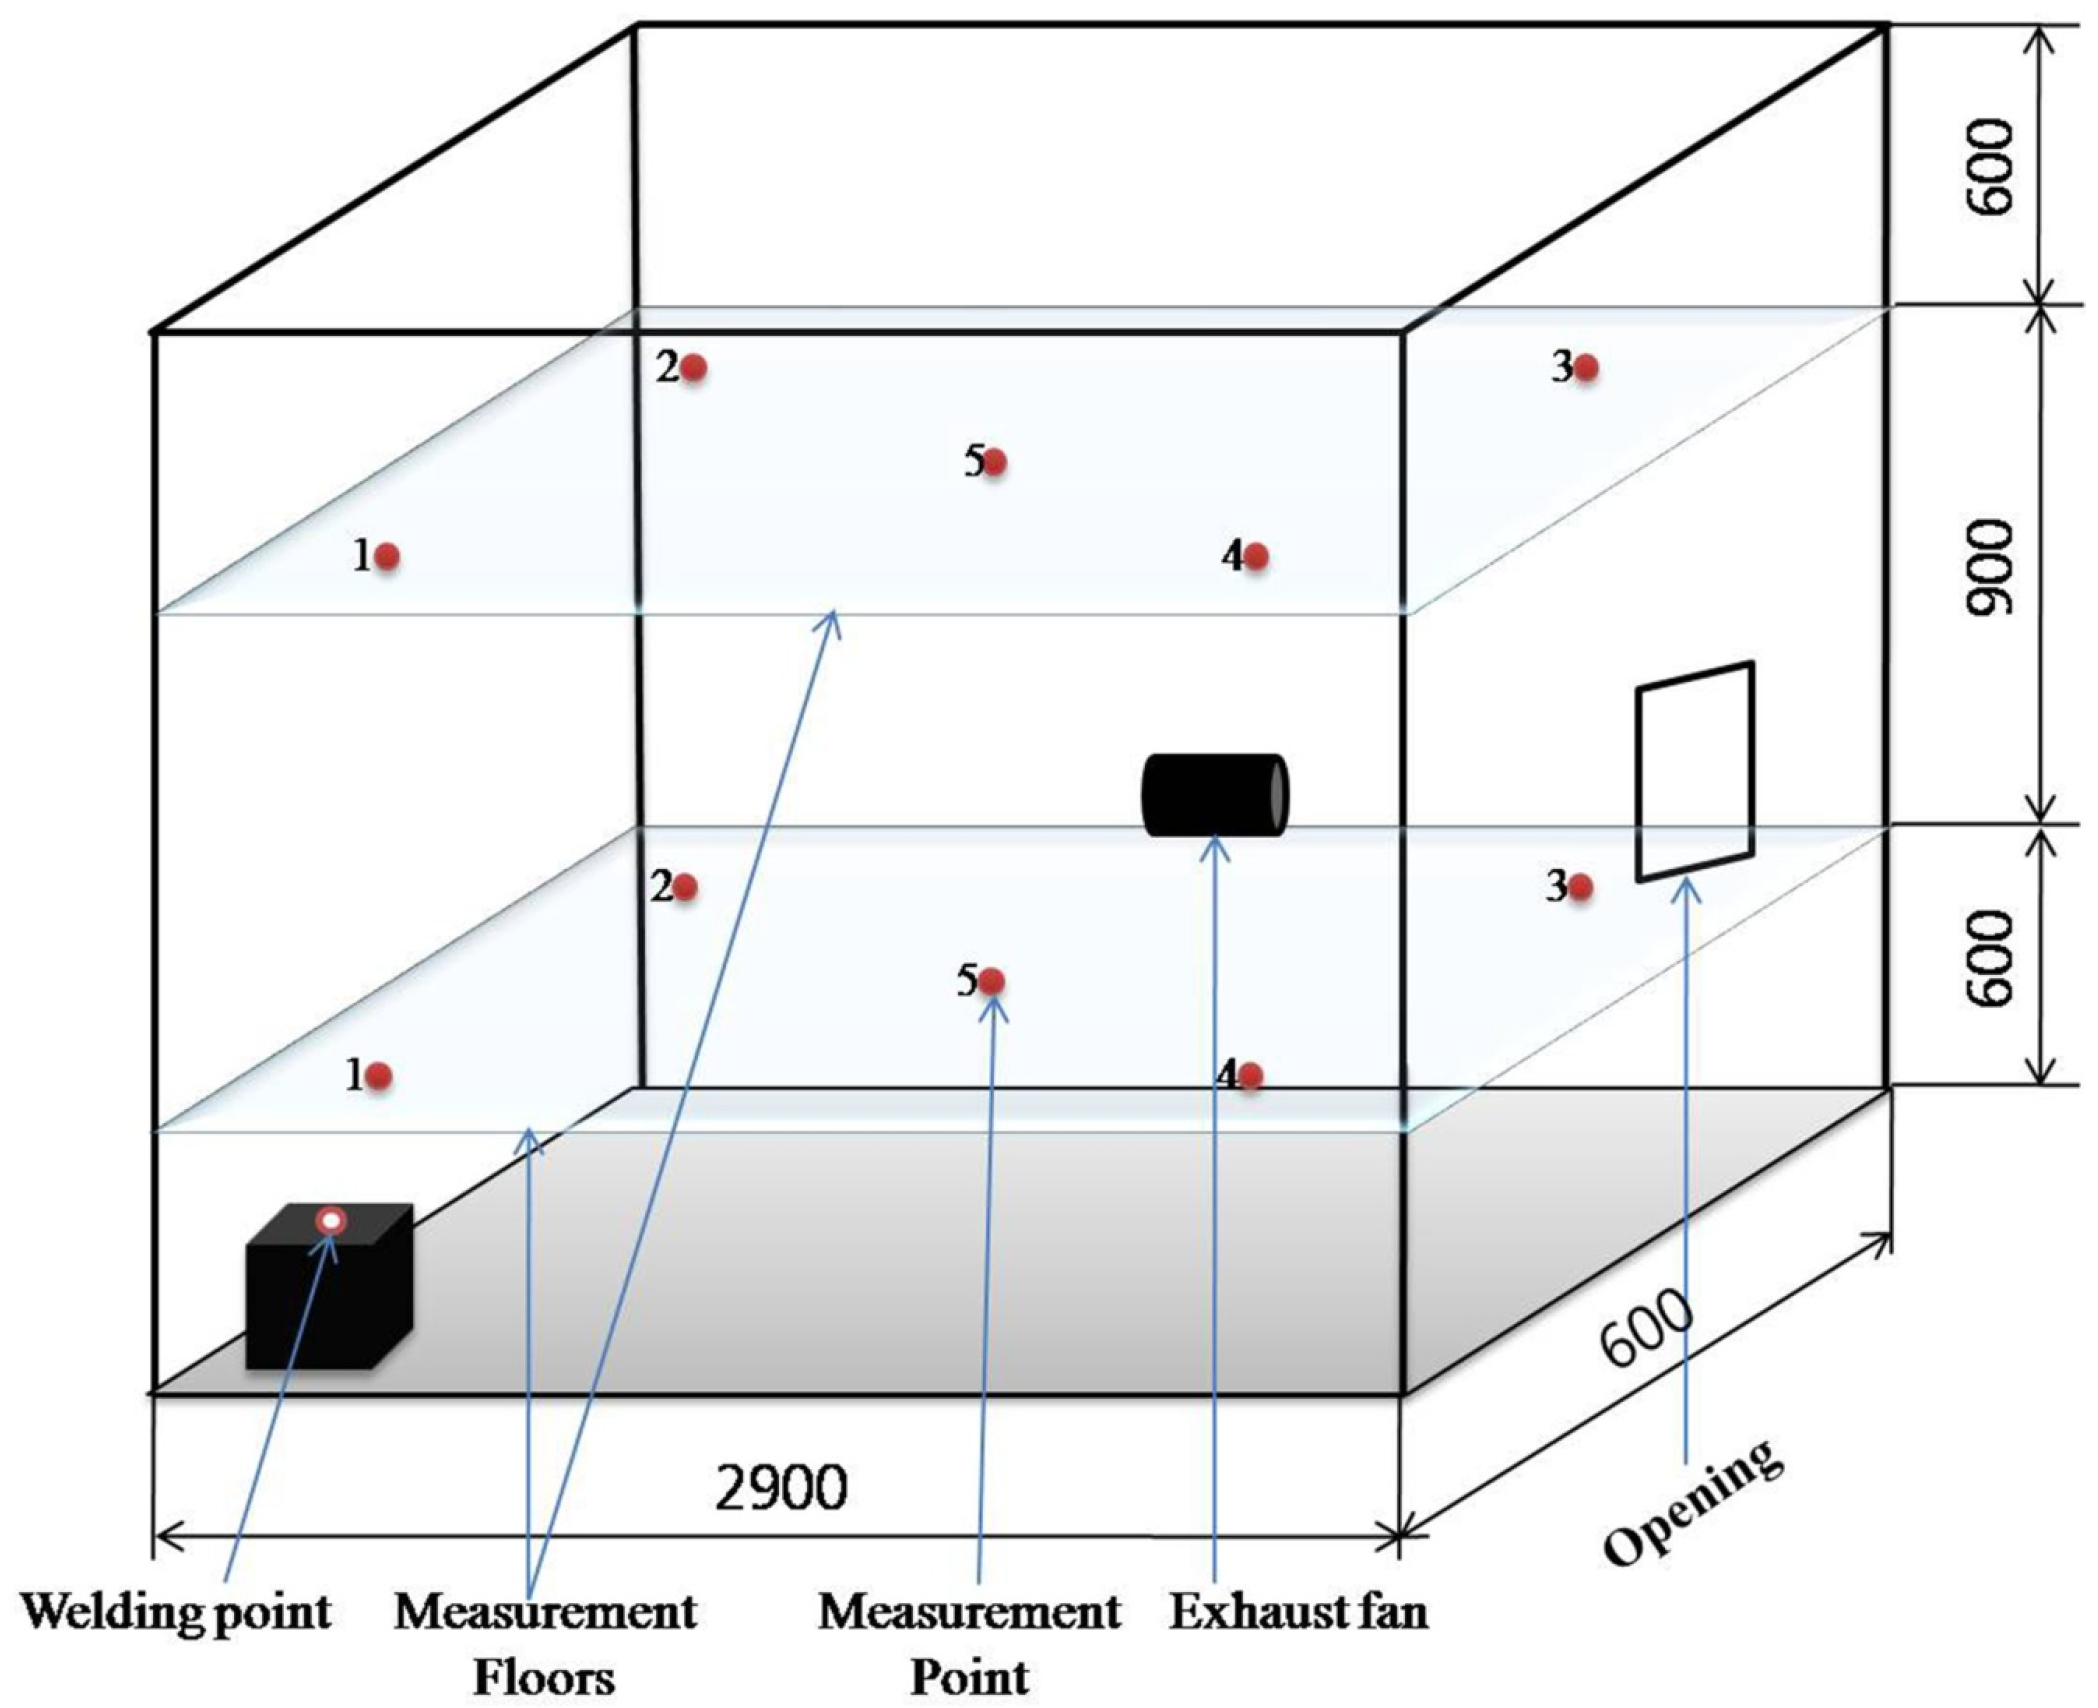
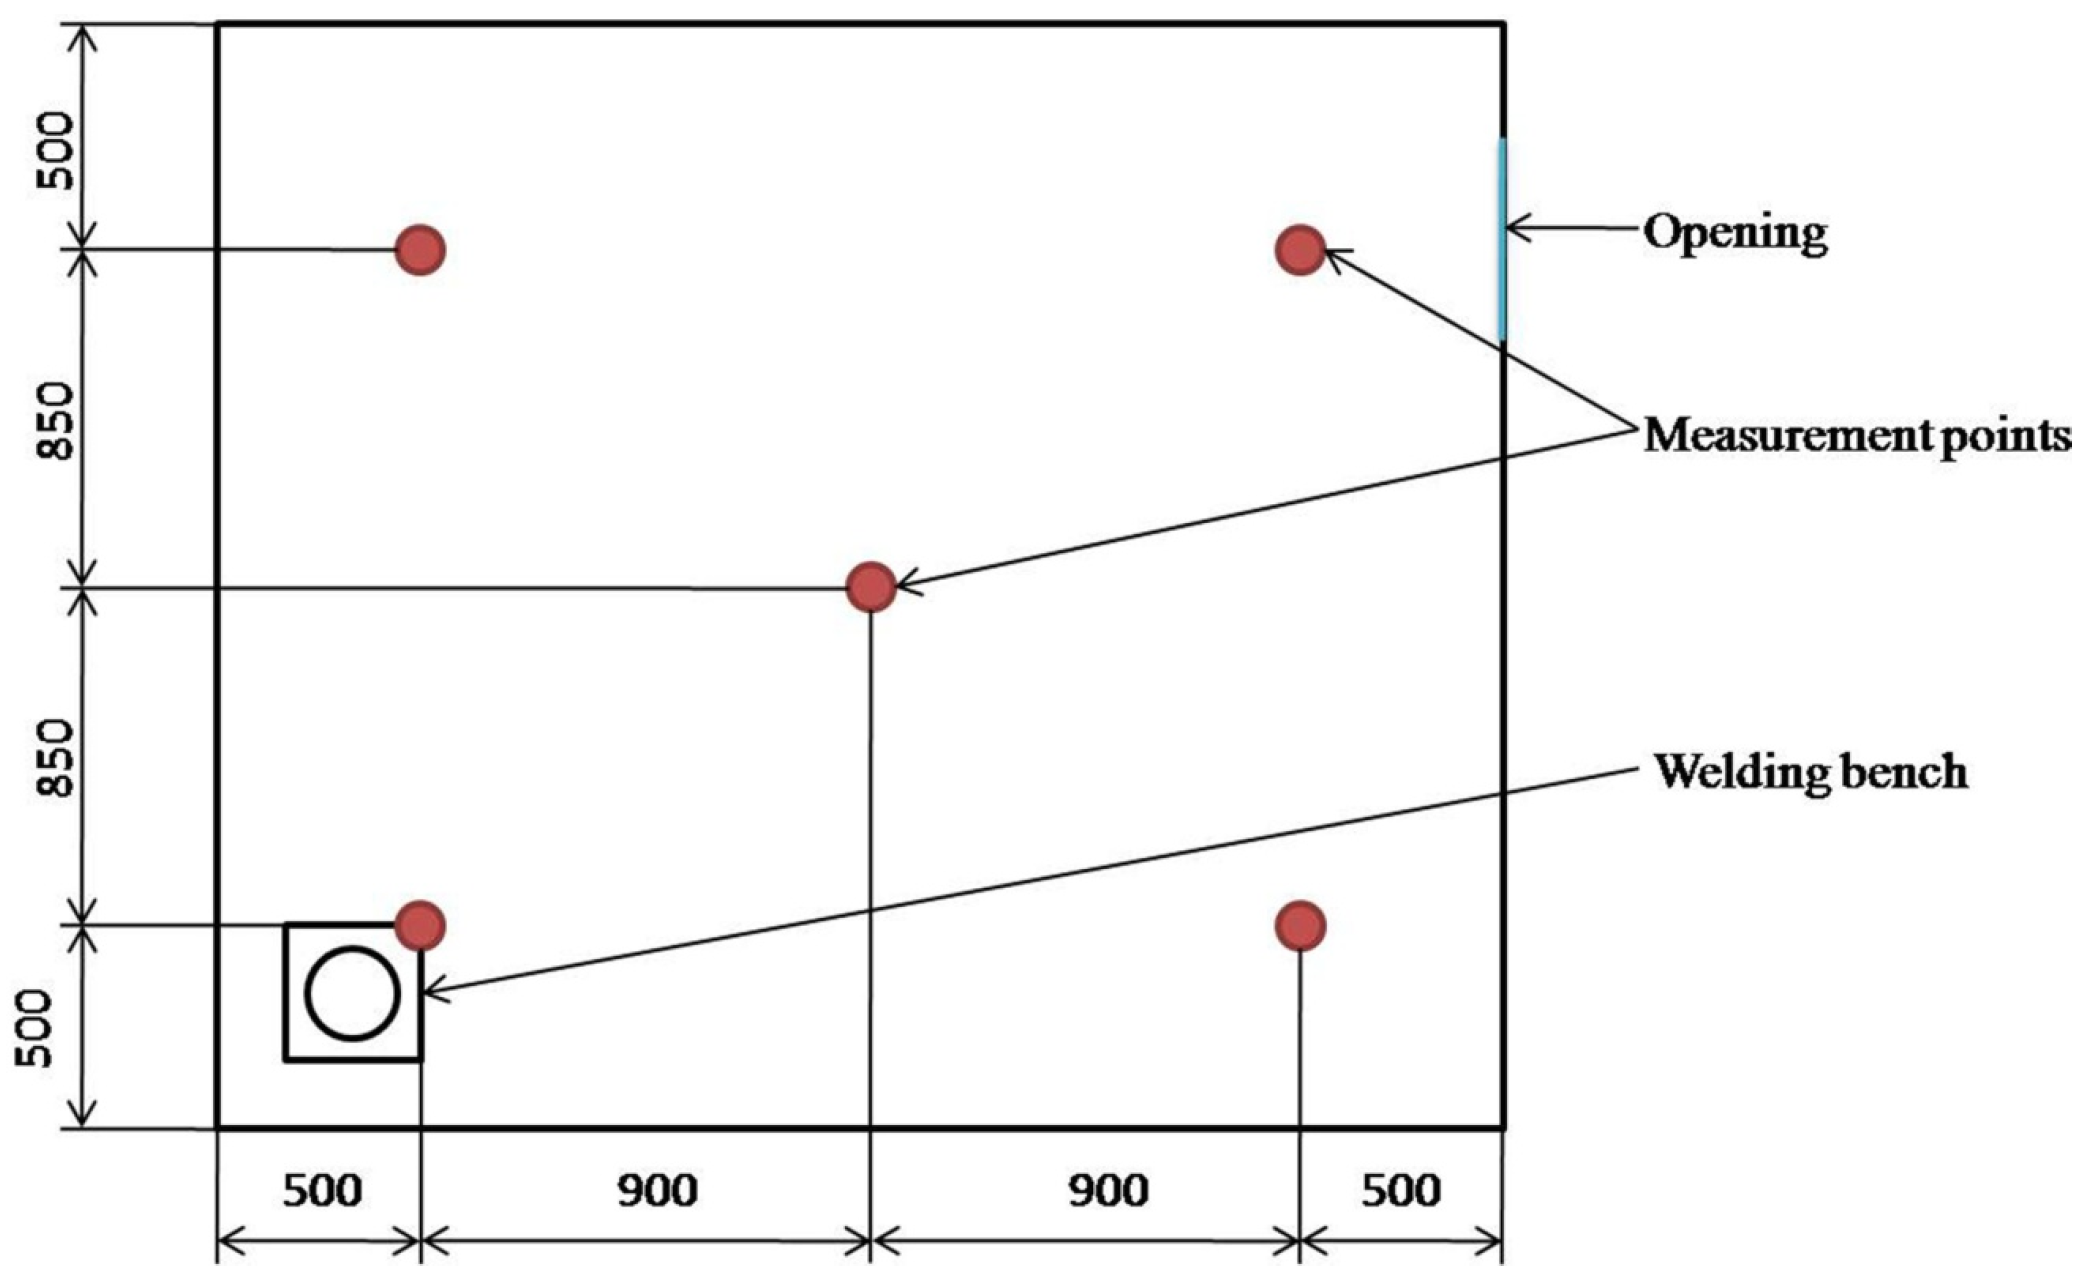
2.1. Experimental Setup

The physical model is a room (L × W × H = 2900 mm × 2800 mm × 2200 mm) with a single opening (W × H = 600 mm × 800 mm) as shown in Figure 1. The welding apparatus is set up at the corner of the room, and it consists of a HIC 500c welder, welding table, base metal (L × B × H = 400 mm × 400 mm × 18 mm), KS D0062 welding torch, and CO2 gas cylinder. The welding system is automated, and the welding conditions are set as follows: (1) arc voltage = 38V; (2) welding speed = 0.6 m/min; (3) wire diameter = 1.2 mm; (4) wire speed = 70 mm/s; (5) welding current = 350 A; and (6) shield gas flow = 30 L/min. The configuration of the welding process is shown in Figure 1. Figure 2 displays five points, each at the height of 600 mm (lower part) and 1600 mm (upper part), to imitate the stature of a welder working in sitting and standing positions, respectively. The placement of the measurement points is shown in Figure 3 where four points are in the corners and one point is in the center of the room. These points are selected to measure size and number of welding fume particles, welding fume concentration and CO2 concentration. An exhaust fan (Model: MJVF-40, MJ AIRTECH CO., Ltd. Seoul, Korea) with maximum flow rate of 40 m3/min is used to ventilate the room.

2.2. Field Measurement
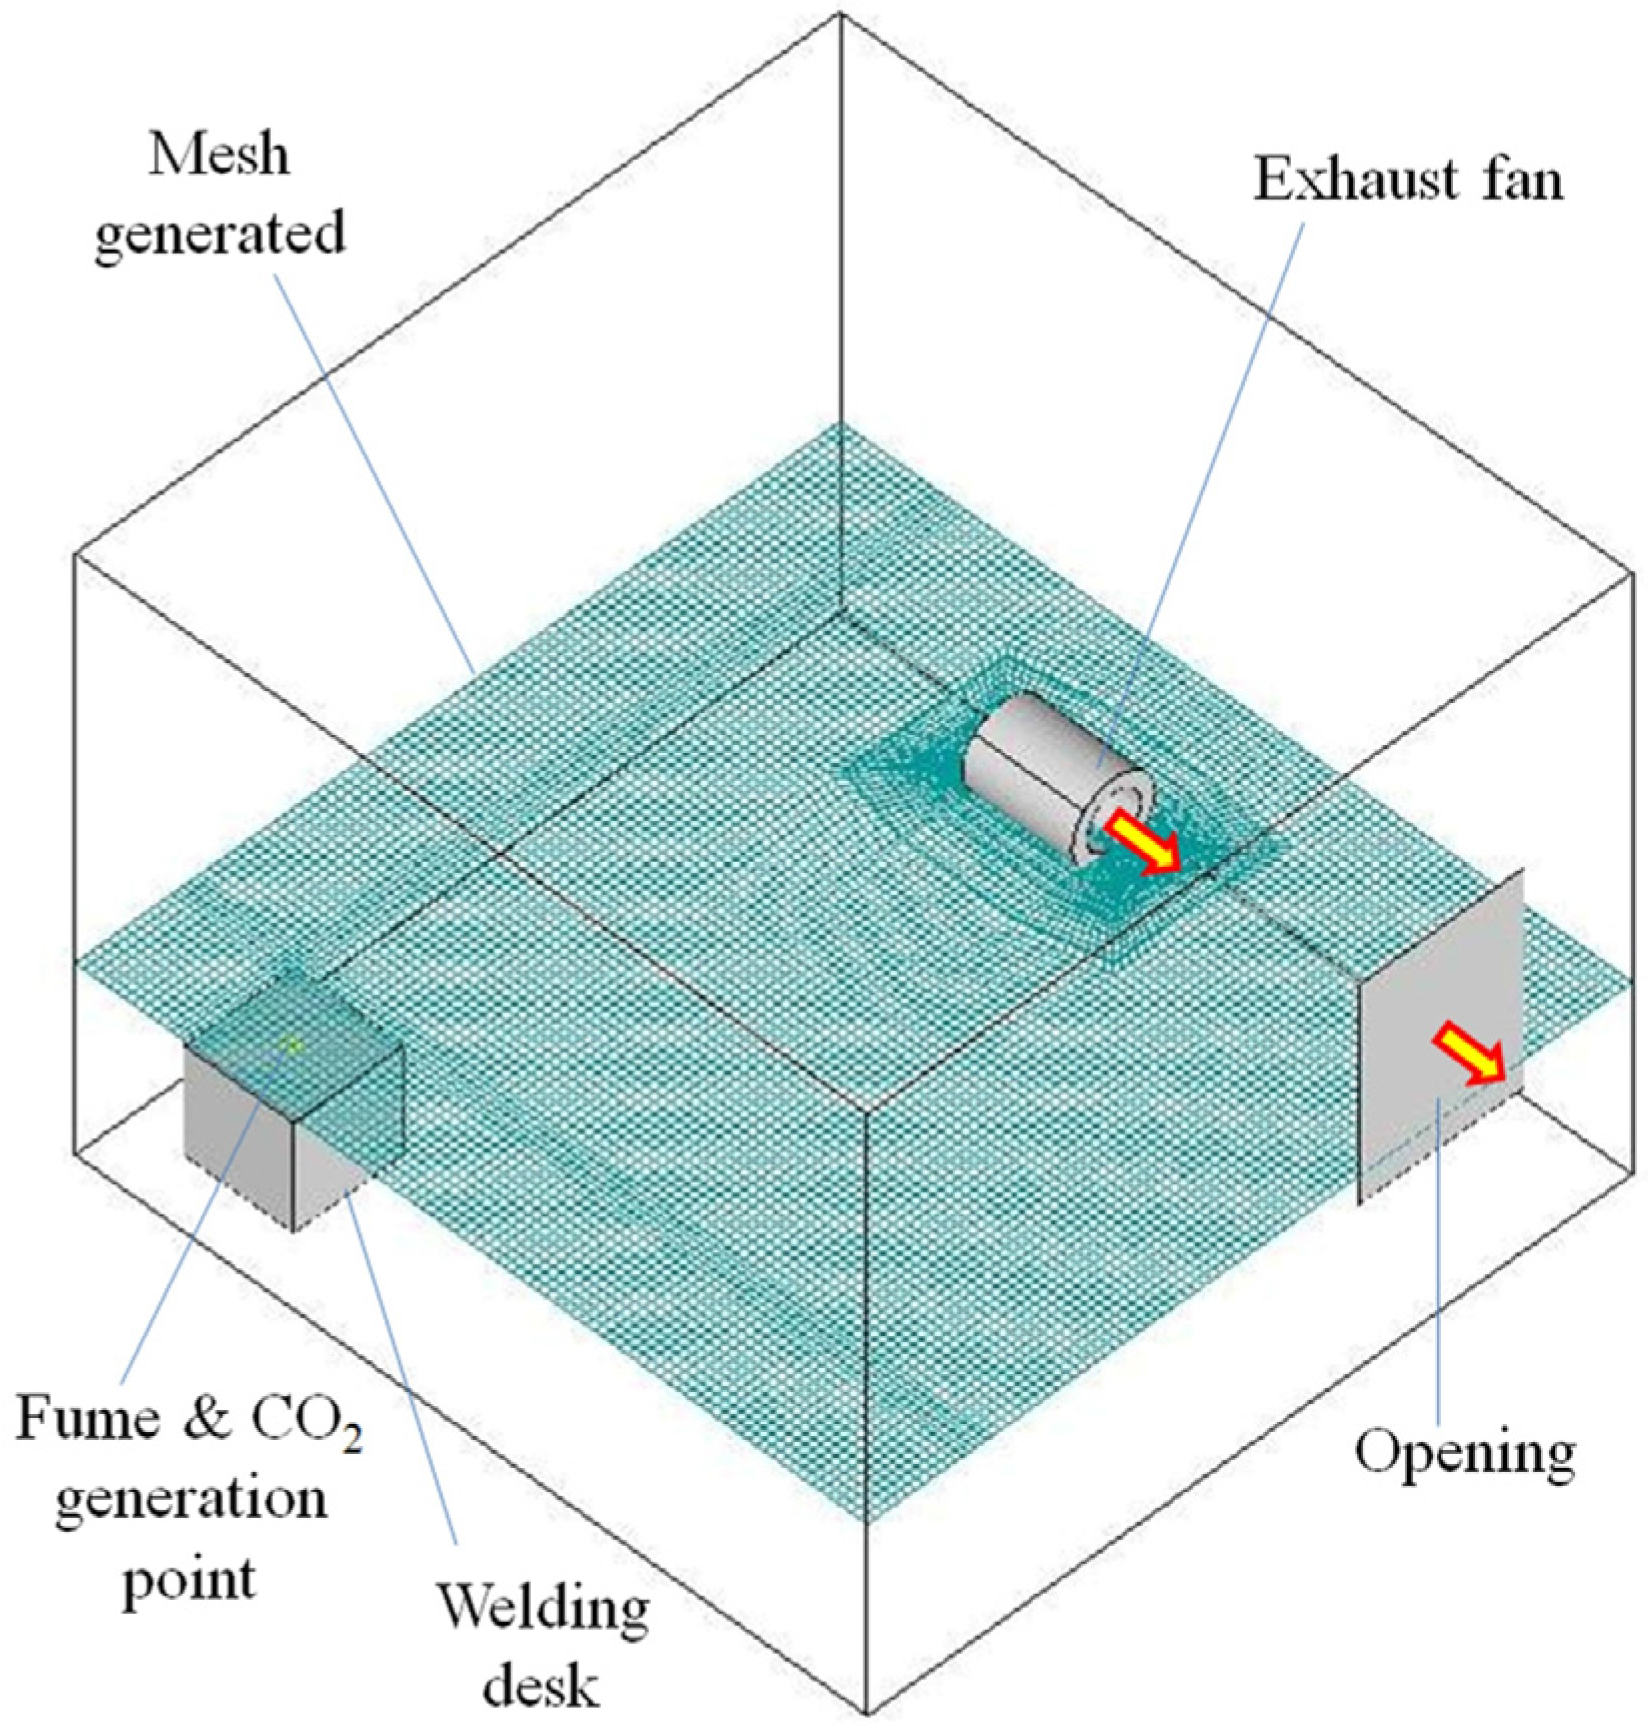
Experiments are carried out to measure the number and size of welding fume, concentration of welding fume and concentration of CO2 inside the room. Initially, the number and size of welding fume particles is measured using MET ONE 237B Portable Air Particle Counter (Hach Company, Loveland, CO, USA). The base metal is welded using an automated welding apparatus with continuous generation of fumes, and all the measurements are done 10 min after the commencement of the apparatus. The particle counter is operated for 5 min at a flow rate of 2 Liters per minute and six size channels, i.e., 0.3, 0.5, 0.7, 1, 2, and 5 µm are used to measure the number of particles of each size per 10 L of air sample. Before running the welding instrument and subsequent measurements, the particle counter is used to measure initial particle count in each size range inside the room. This background measurement of particle count is deducted from the total count of welding fume particles in each size range, and the results are reported. CO2 is measured at the ten measurement points using GrayWolf portable DirectSense IAQ meter (GrayWolf Sensing Solutions, Shelton, CT, USA) with CO2 measuring accuracy of ±3% rdg or ±50 ppm, which displays the measured values in ppm in the monitor. Real-time monitoring of CO2 is conducted 10 minutes after kickoff of the welding apparatus at all 10 measurement points. Gravimetric method is used to measure the weight of welding fume particles at all measurement points, and the measured weight is converted into concentration at each point. The welding fume concentration measuring system is operated at a flow of 2 L/min for an hour and consists of a Personal Air Sampler (Model 224-PCXR4, SKC Inc., Eighty Four, PA, USA), Polyvinyl Chloride filter paper (pore size = 5 µm, diameter = 37 mm: SKC Inc., Eighty Four, PA, USA), and a precision analytical balance (Sartorius R 160 D, Elk Grove, IL, USA). Three separate measurements are conducted for both welding fume concentration and CO2 concentration, and the average of these measurements is used for comparison with simulated concentration CO2.

2.3. CFD Simulation

Commercially available CFD software ANSYS Airpak 3.0.16 (Fluent Inc., Lebanon, NH, USA) is used in this study to predict the CO2 concentration distribution in the room. Airpak is one of the most acceptable softwares to simulate indoor air quality which incorporates the powerful solver FLUENT [23]. Airpak uses FLUENT to solve turbulent flow equations based on finite volume method. Equations of conservation of energy, mass and momentum of incompressible air are solved by FLUENT to find the solution of the model. The two-equation K-ε turbulence model is used to solve turbulent flow conditions. There is a presence of mixed convection in the room due to the occurrence of both natural and forced convection. Natural convection is caused by buoyancy forces due to density differences in different parts of the room. The density difference is mainly caused by high temperature gas supplied into the building (i.e., CO2 temperature = 600 °C, CO2 flow = 0.03 m3/min, CO2 flow diameter = 0.2 cm, and CO2 velocity = 0.33 m/s at welding point). Density gradient is not only caused by temperature gradient, but other factors are also associated with it. But for this study, density gradient due to temperature differences from heat sources is only taken into consideration as the effects caused by natural convection are far lower than the effects caused by forced convection. Forced convection occurs due to a ventilation system, i.e., an exhaust fan with airflow of 20 m3/min. A fine mesh of hexa-unstructured geometry is used to discretize the domain. A grid independency test is performed using one coarse and two finer meshes. The fine mesh finally generated consists of 1.1 million cells. The 3-D model developed in Airpak with the same geometries and features as the physical setup is shown in Figure 4.

3. Results and Discussion

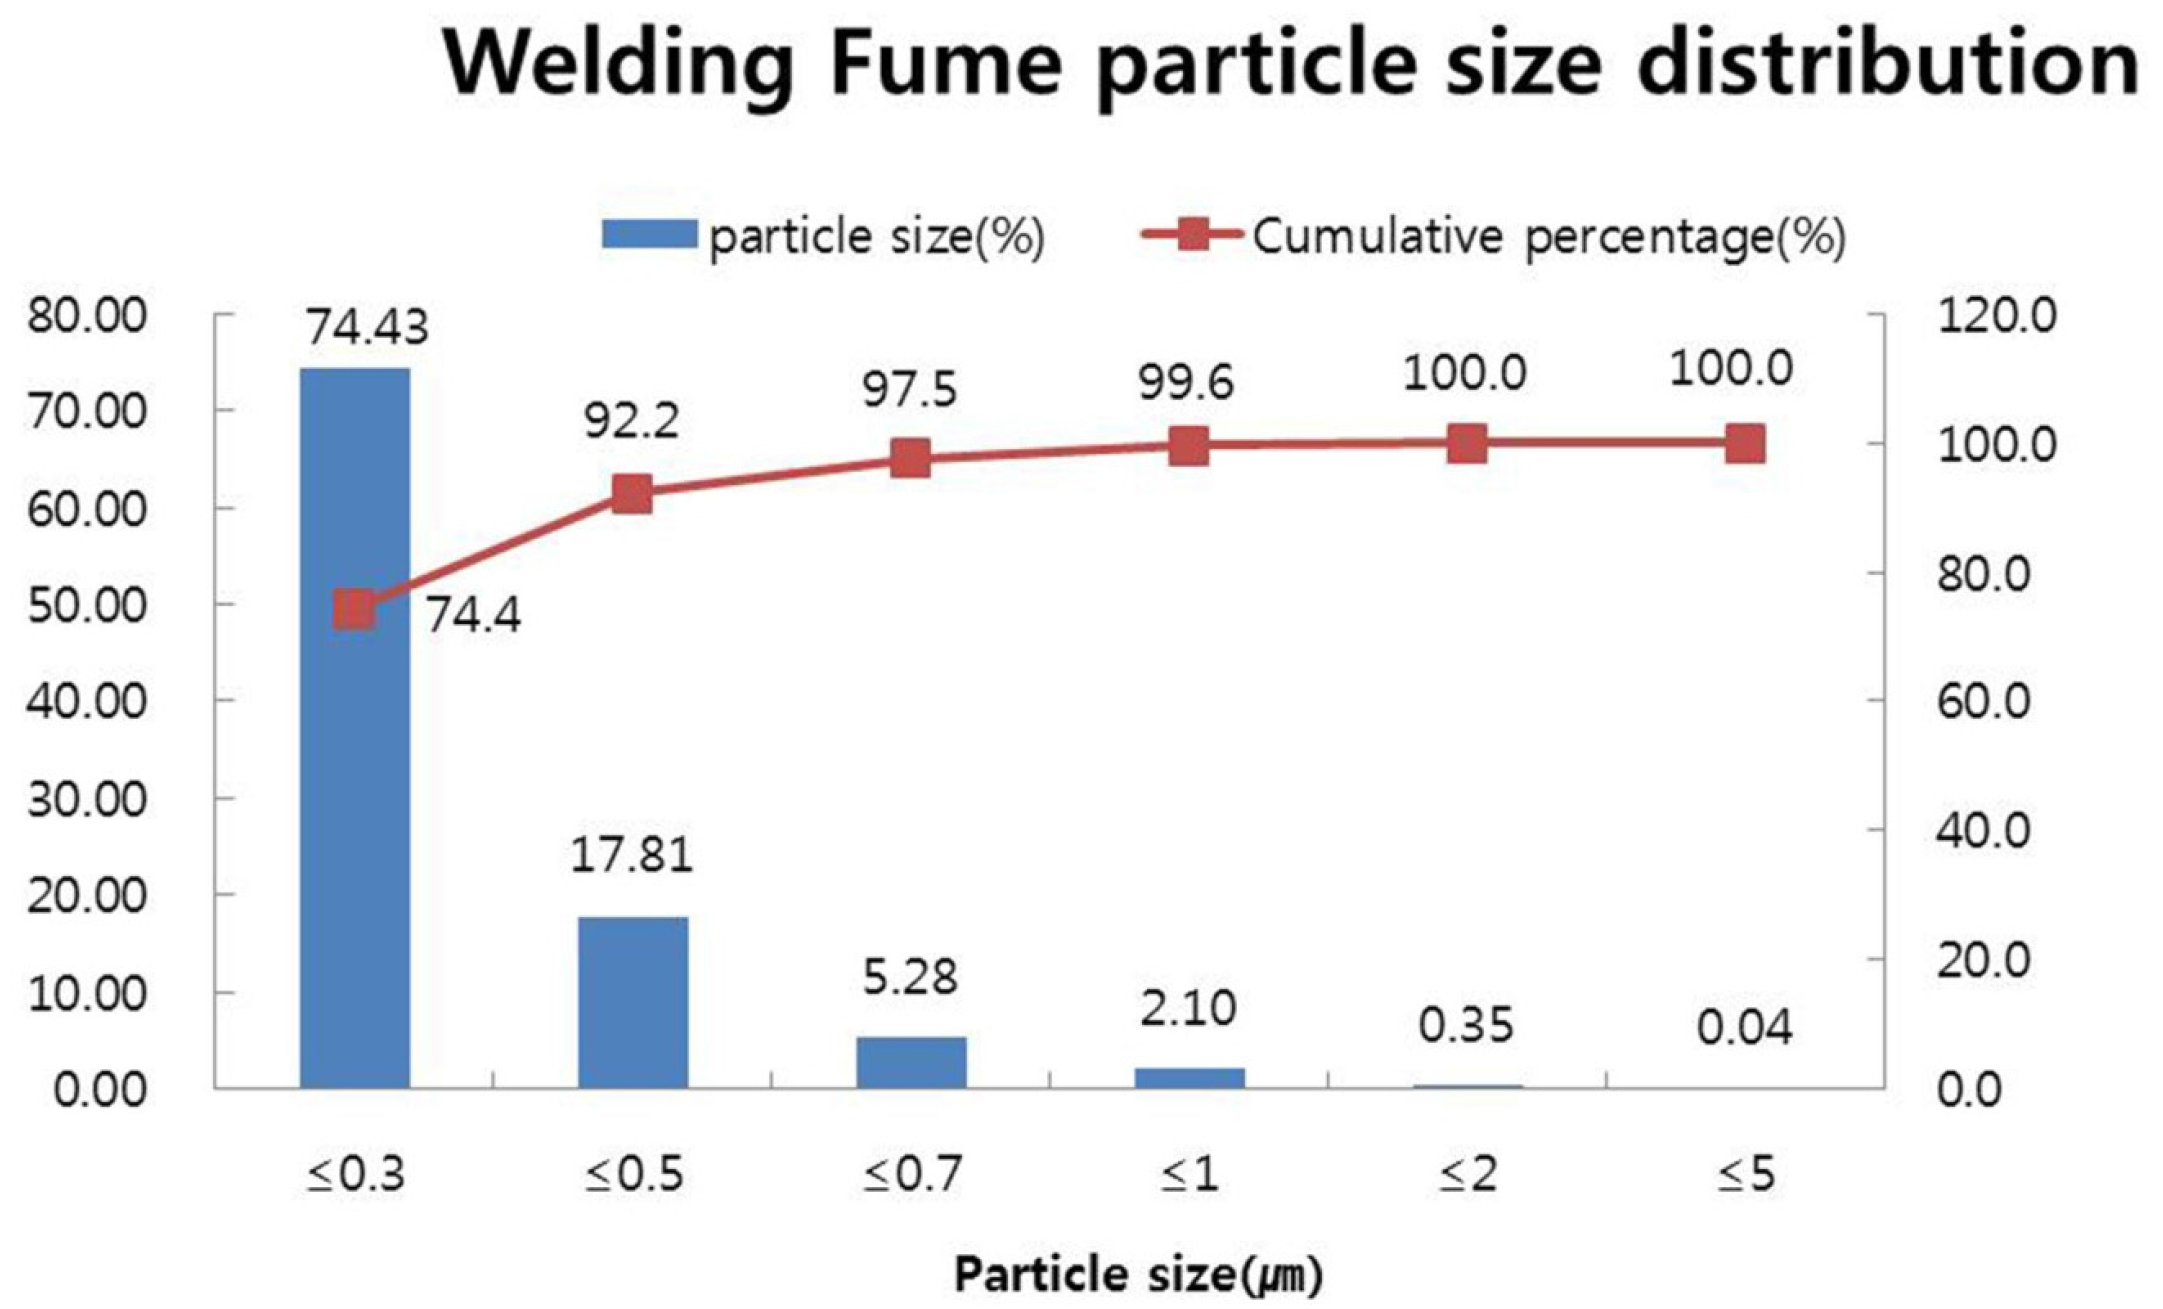
3.1. Welding Fume Particle Size Distribution

Figure 5 shows the variation in welding fume particle size in the room. The respective particle count at the upper (1600 mm height) and lower (600 mm height) sections of the experimental room is shown in Table S1. The count presented in Table S1 is the result of deducting background measurement from the total measurement in each size range. From Figure 5, it is evident that most of the particles’ sizes are less than 0.5 µm and about 99.6% of the particles have a size less than 1 µm (sub micrometer), which is the size that acts as gases during diffusion. Therefore, this reveals a possibility that welding fume particles and CO2 used as shielding gas emitted at the same point source in this study might have similar spread over the room. To explain this theory, a comparison is made between the concentrations of both welding fume and CO2 at the same points.

3.2. Measured and Simulated Concentration of Welding Fume and CO2

The results of measured concentration of welding fume, measured CO2, and simulated CO2 at ten measurement points inside the room are shown in Figure 6, Figure 7 and Figure 8, respectively. Although the concentration units for welding fume and CO2 are different, the similarity of pattern among three graphs is certainly evident. Further reasoning of these results is done using regression analysis to find correlation that exists between the species.

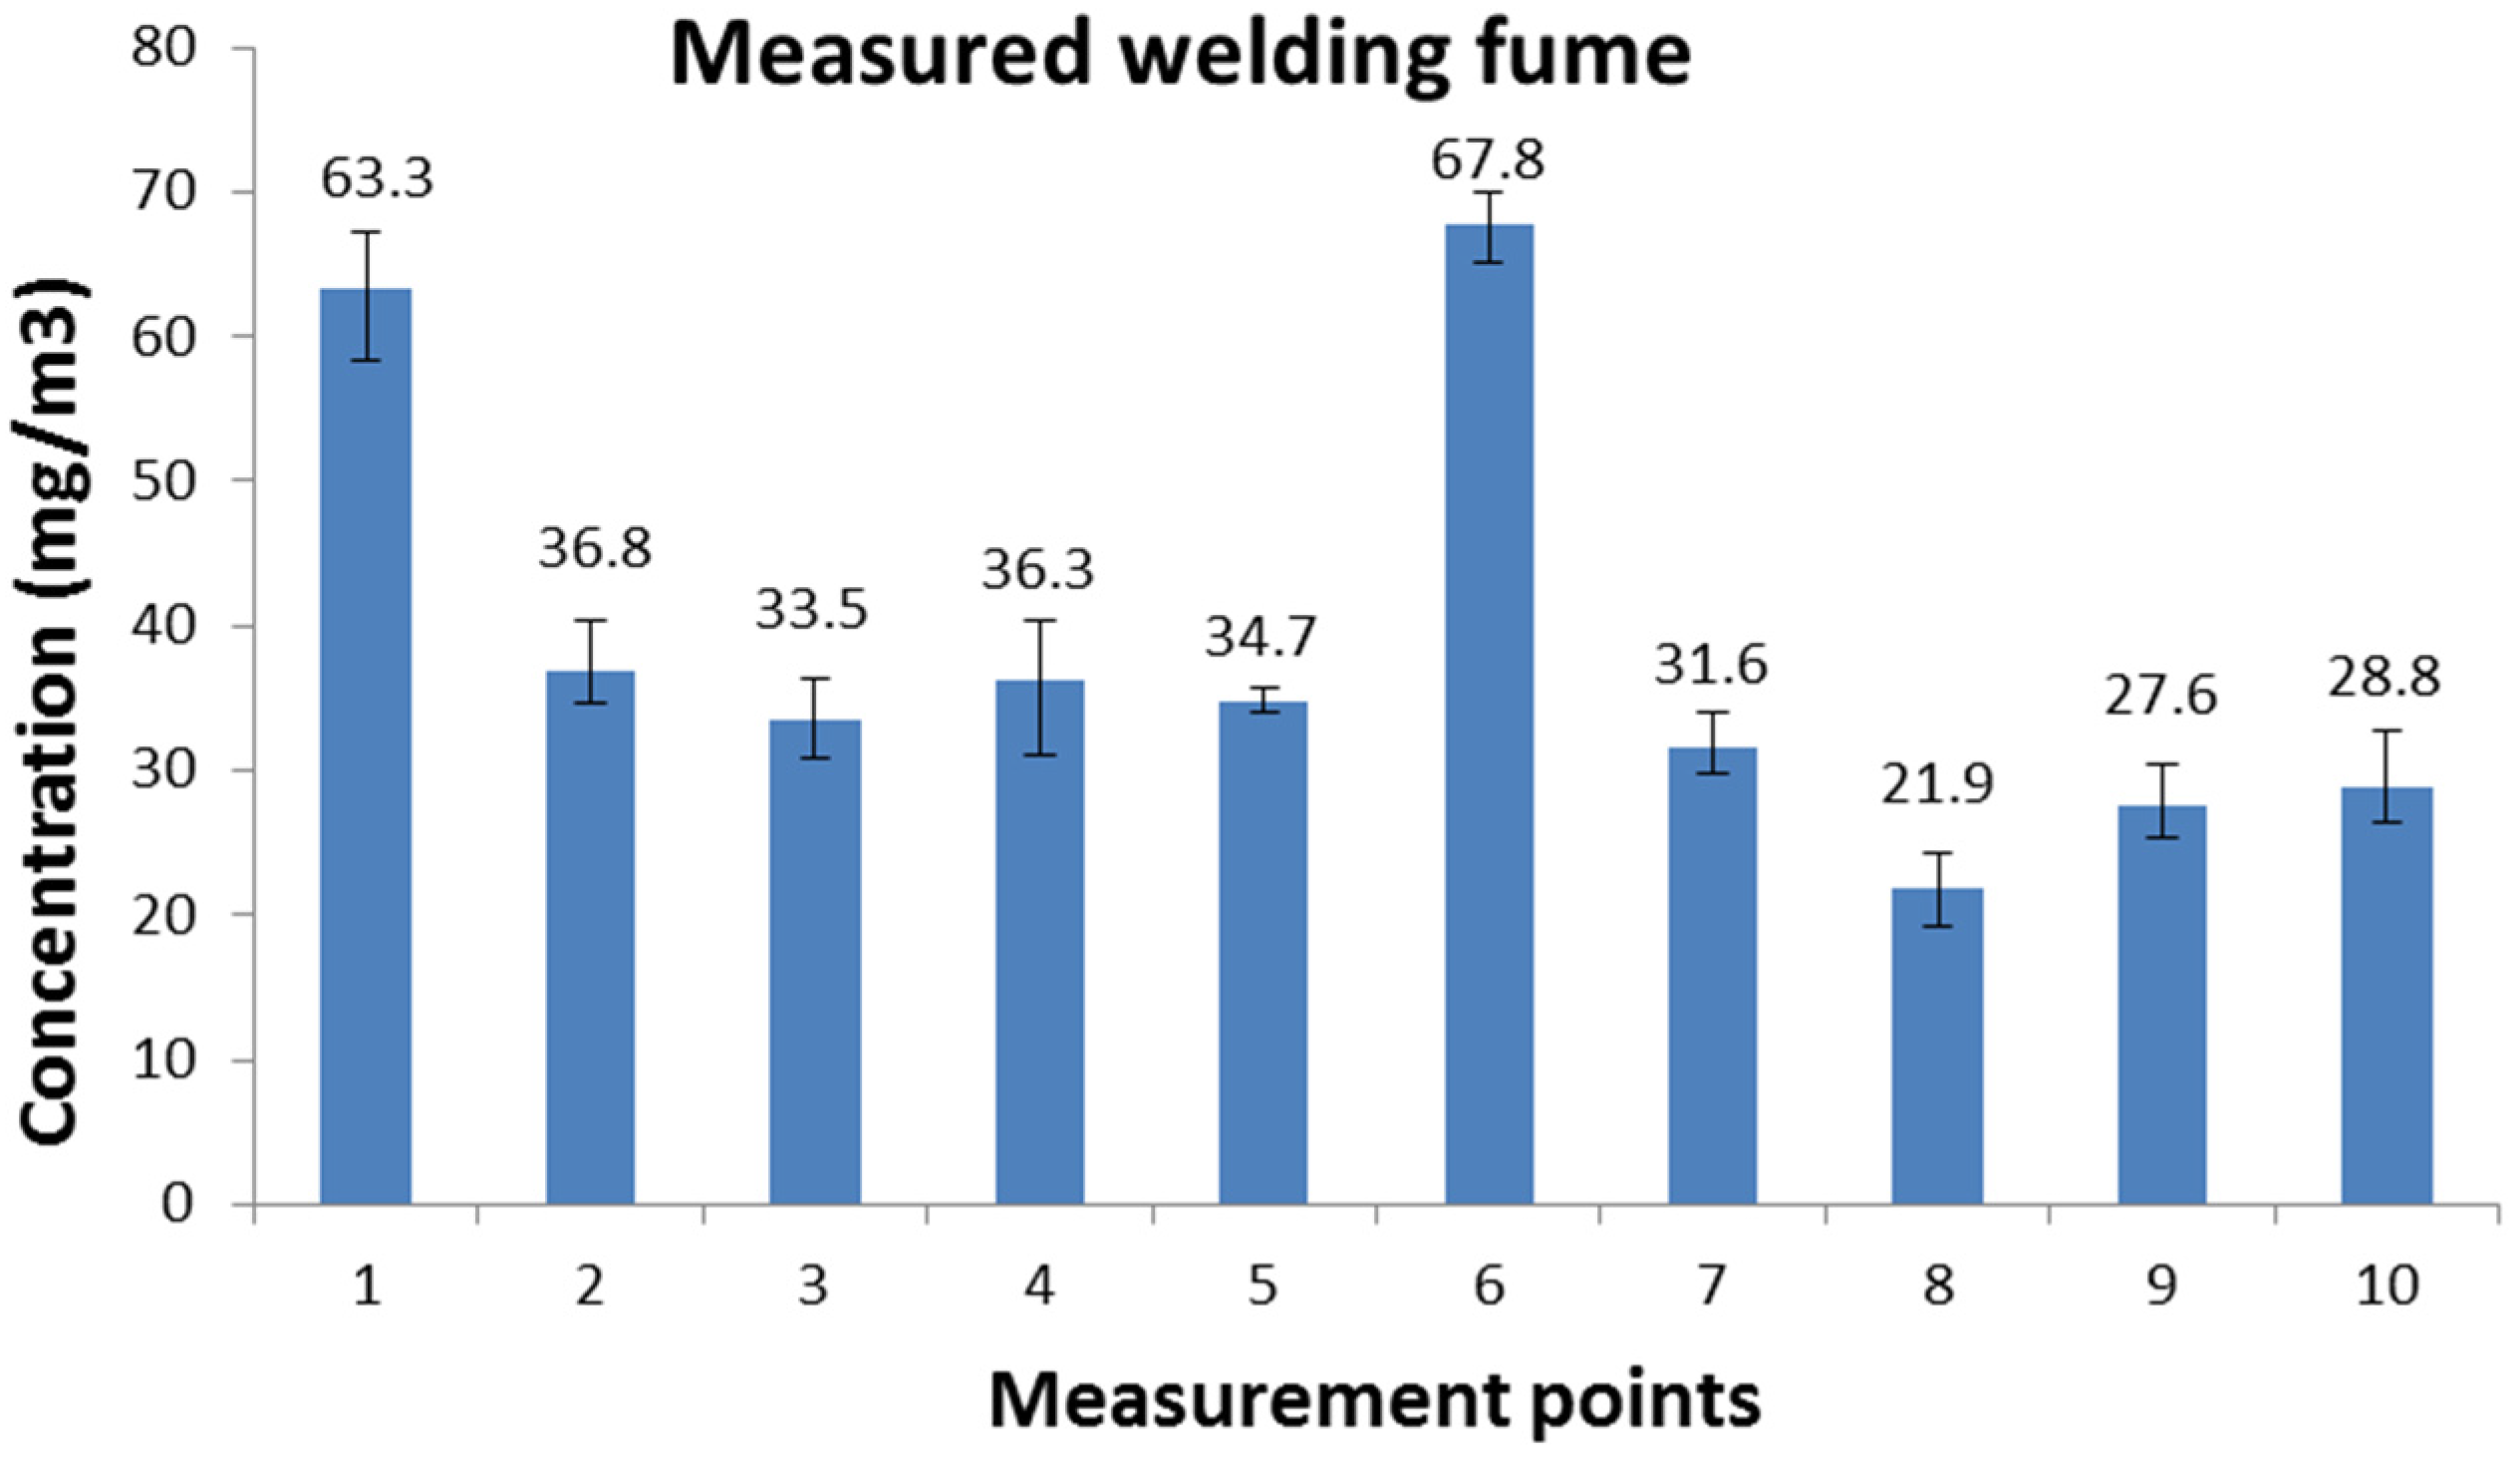
3.2.1. Measured Welding Fume vs. Measured CO2 Concentrations

The R2 (coefficient of determination) value of 0.96 between measured CO2 and measured welding fume concentrations as shown in the regression plot as shown in Figure 9 explains that the concentration of welding fume particles and CO2 spread in the room atmosphere is very similar. In other words, this shows that both the species have similar patterns of distribution in the room. As the correlation is higher, the error during prediction is lower, which contributes to better prediction accuracy.

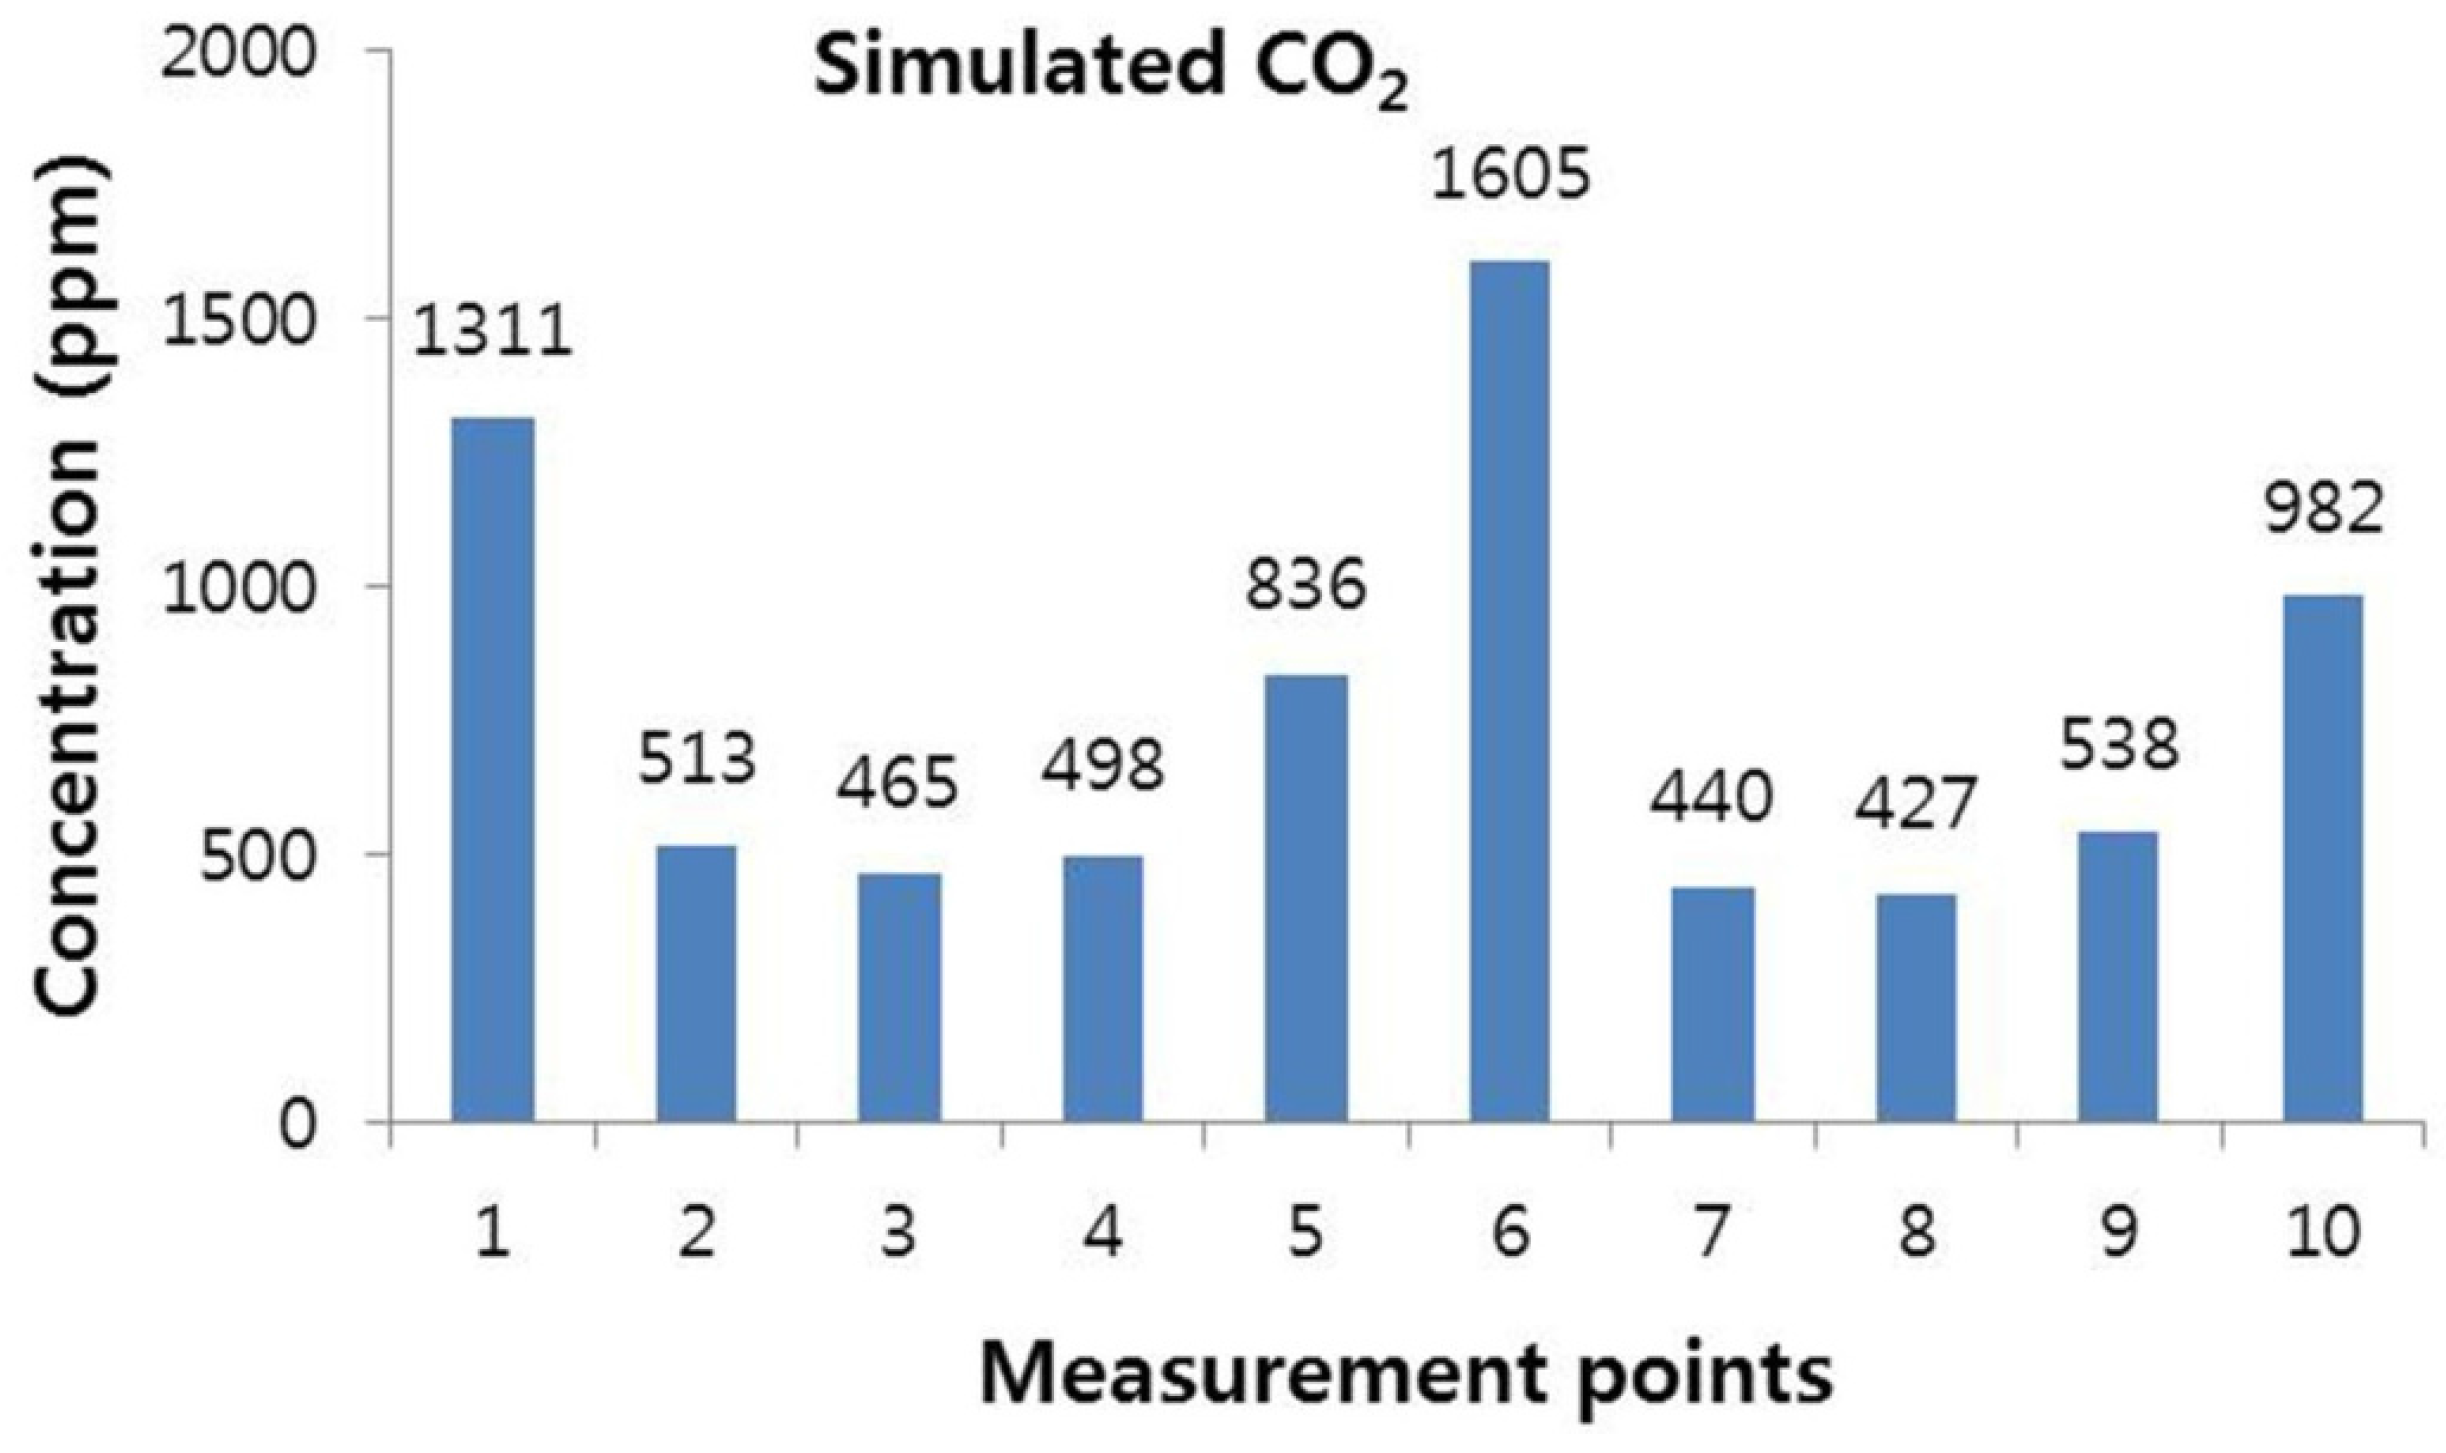
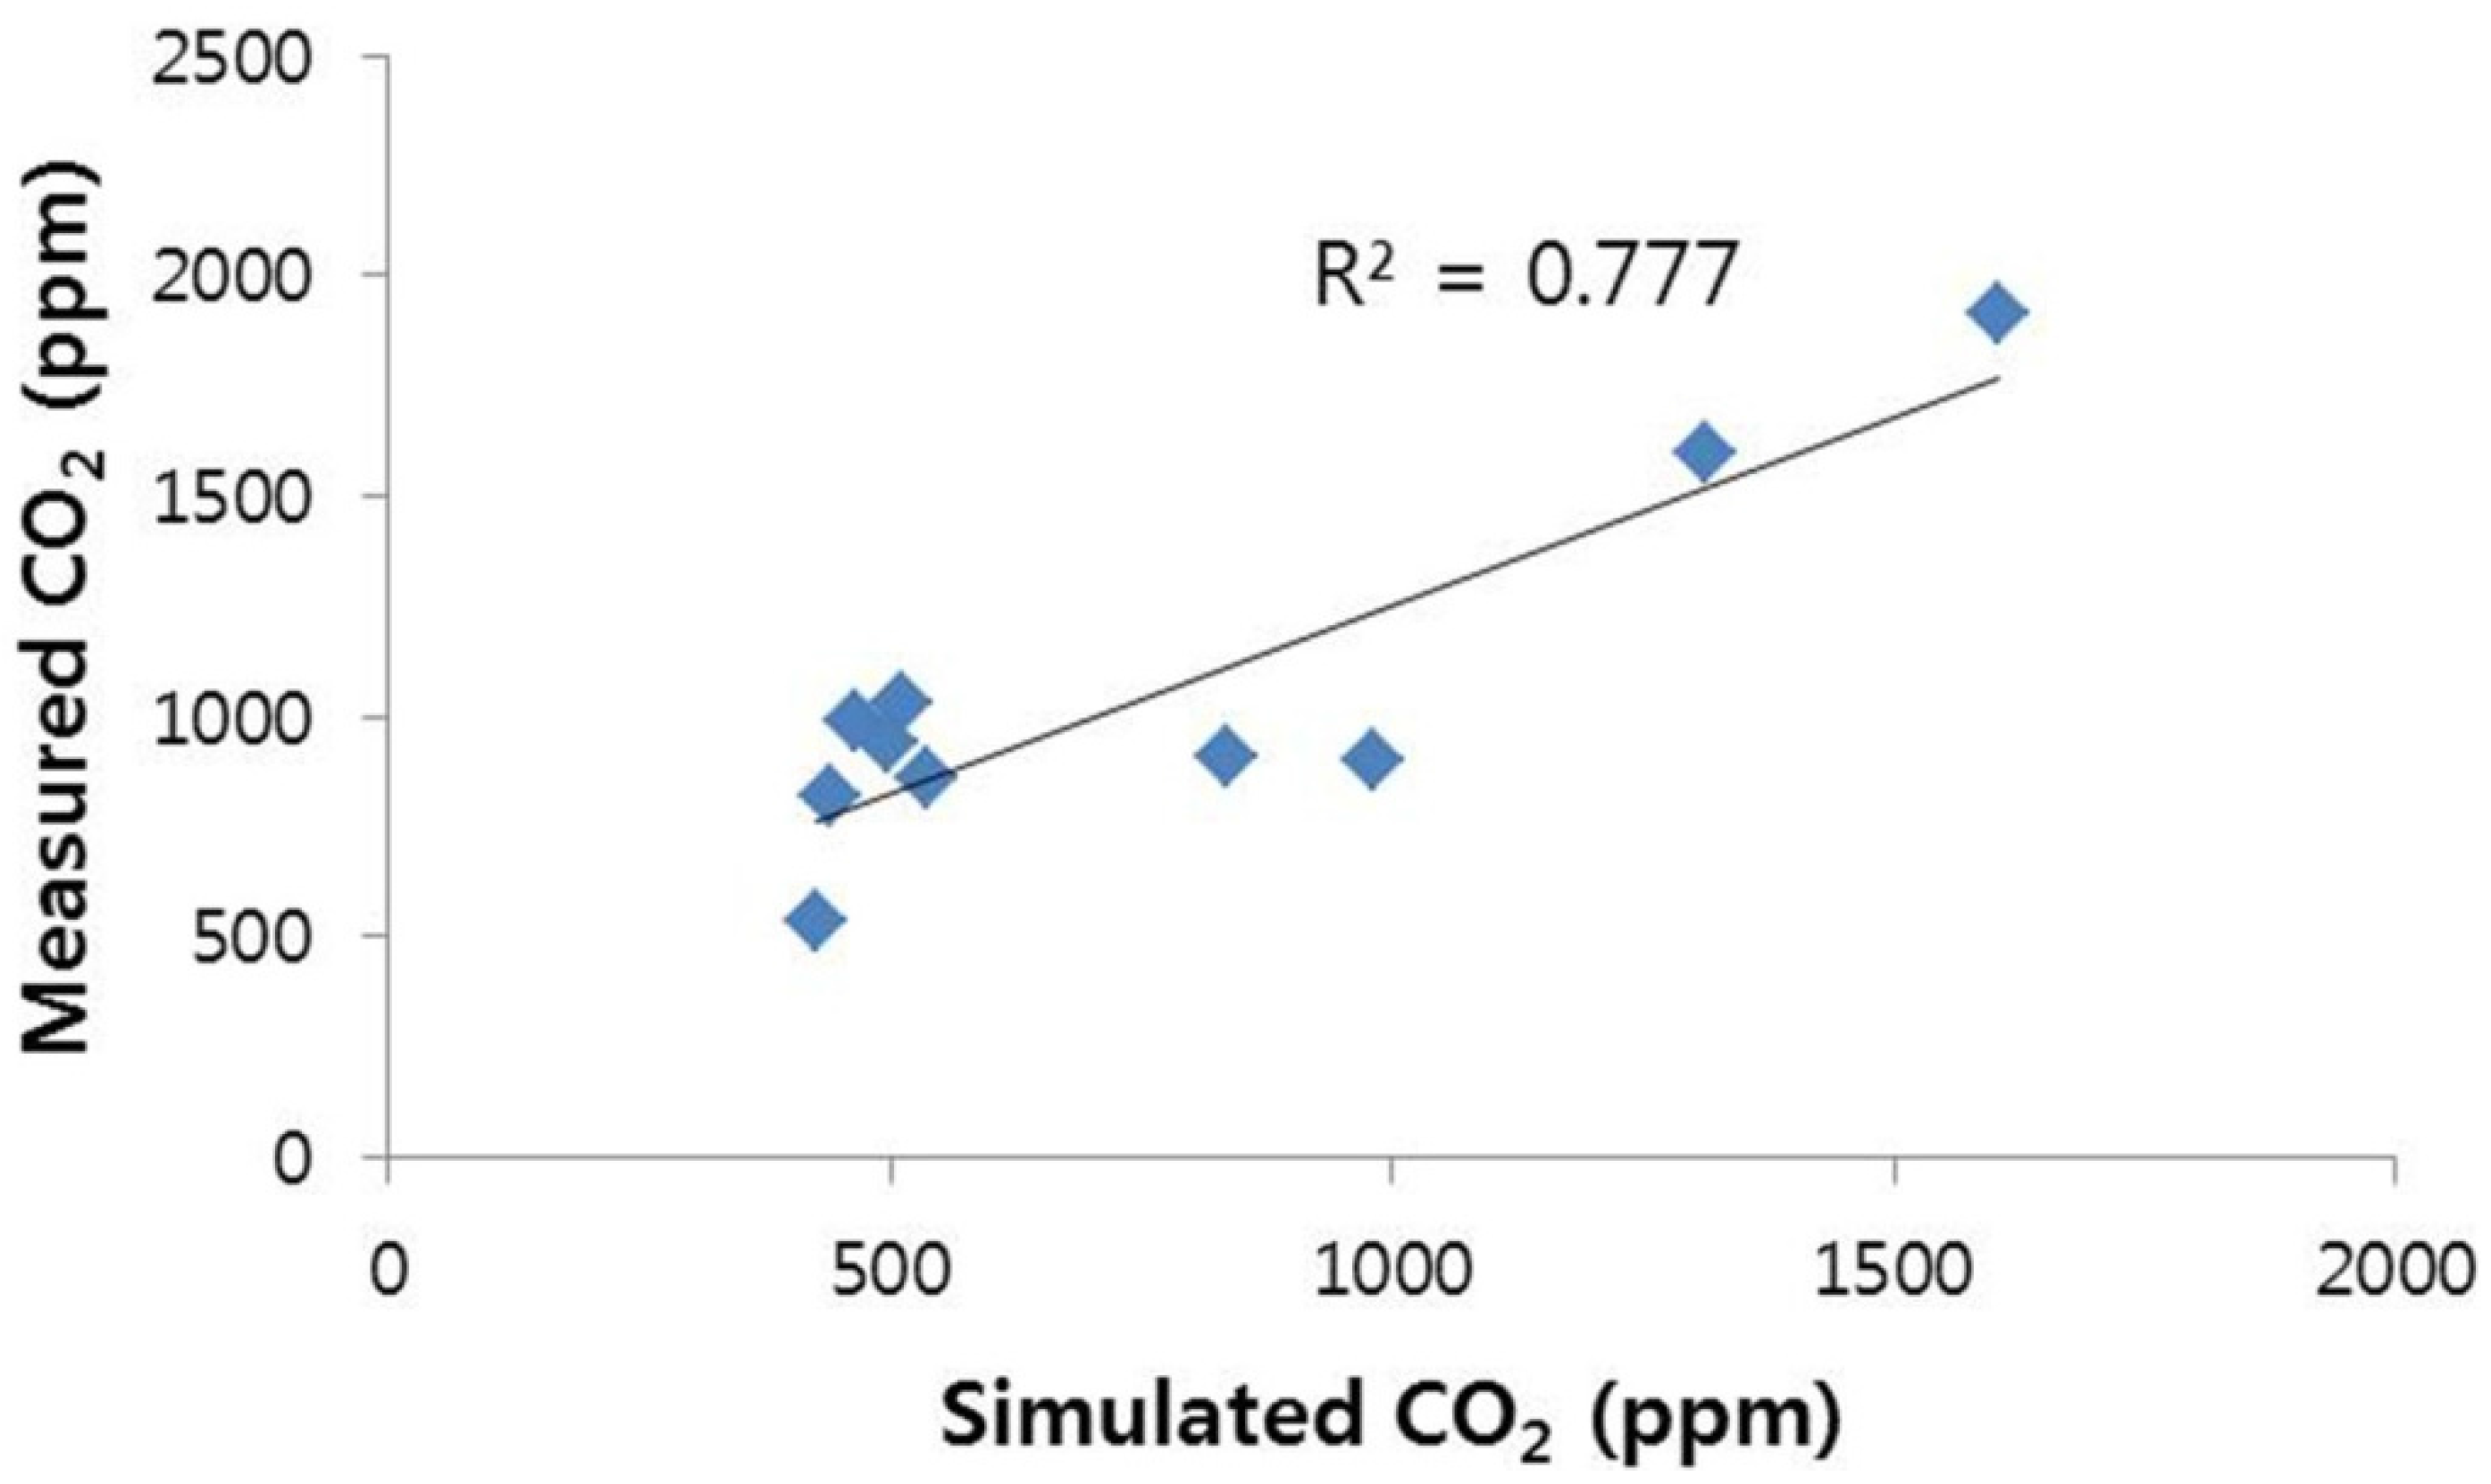
3.2.2. Measured CO2 vs. Simulated CO2 Concentrations

Figure 10 is the regression plot of measured and simulated CO2 with a R2 value of 0.78. This is a relatively high coefficient value, which supports that the prediction of CO2 concentration through computer simulation is finely accurate. Hence, in an arc welding workshop, which uses CO2 as a shielding gas, it is possible to predict the concentration distribution of CO2 with the help of computer simulation.

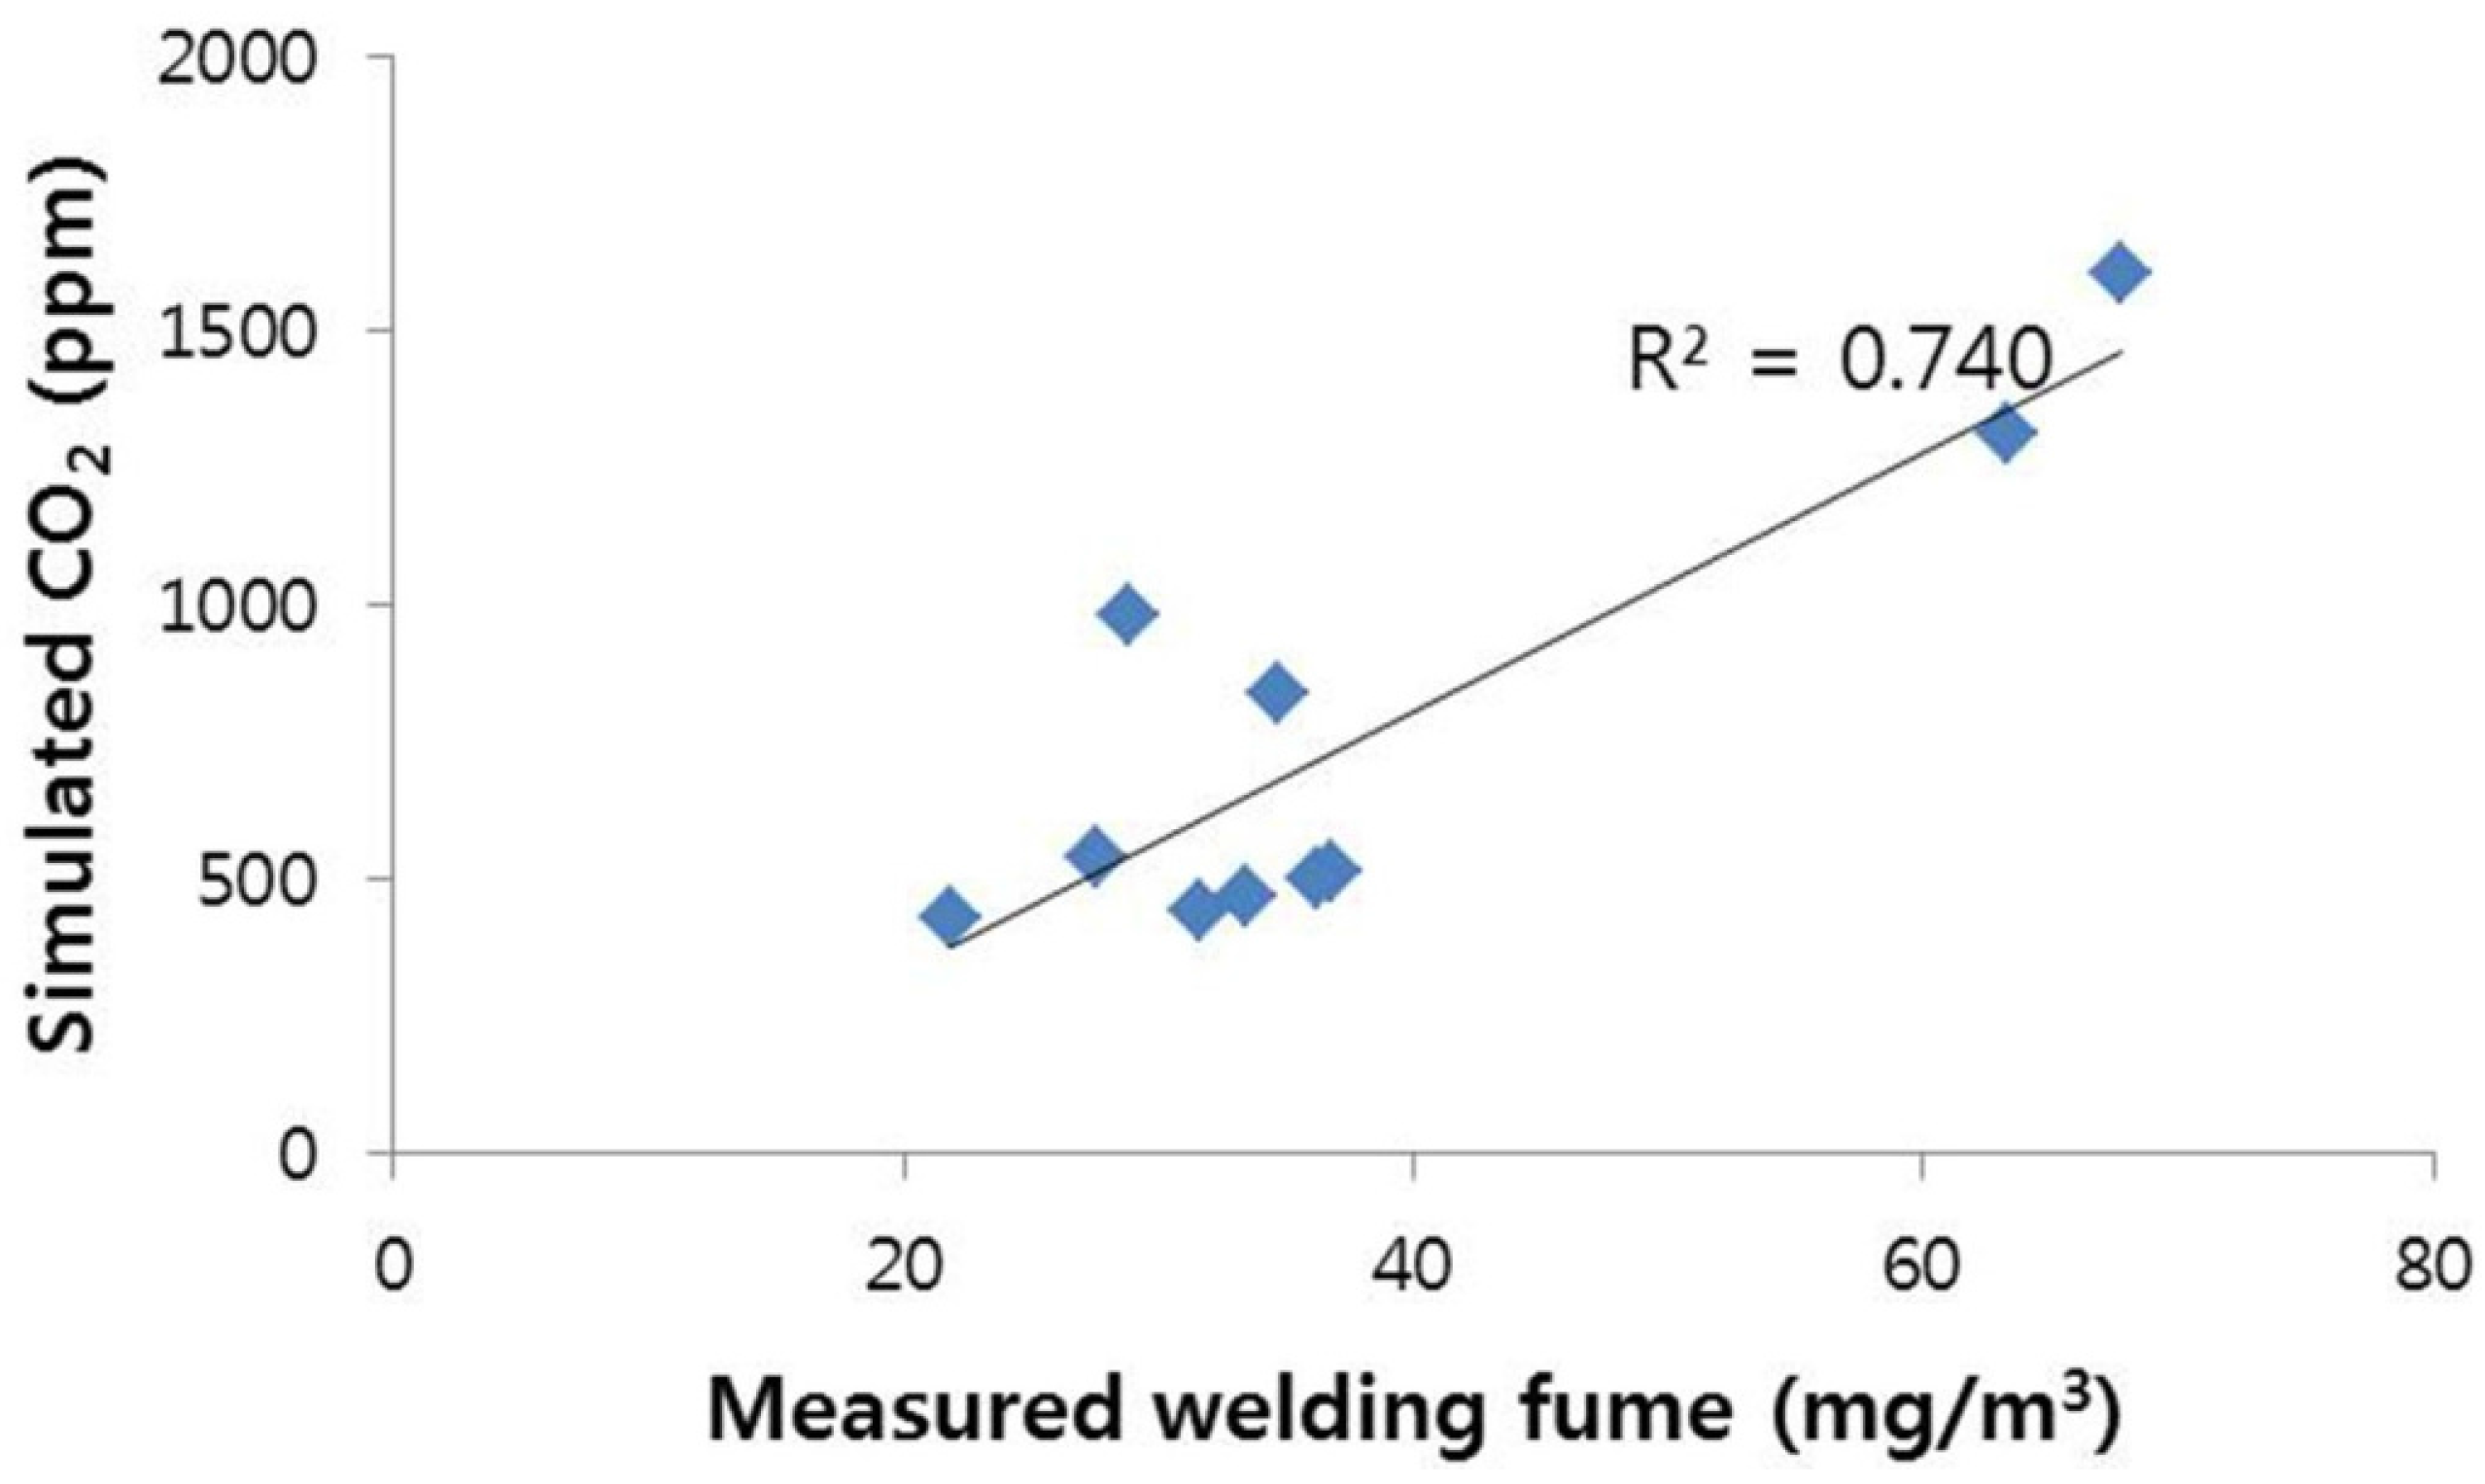
3.3.3. Measured Welding Fume vs. Simulated CO2 Concentrations

The comparison of measured welding fume and simulated CO2 concentrations portrays a R2 value of 0.74 as shown in Figure 11. In other words it can be implied that change in concentration of measured welding fume could be predicted through simulated CO2 with accuracy of around 74%. This is also a relatively high value of coefficient of determination, and it supports that there is a possibility of achieving a meaningful prediction of welding fume concentration indirectly through CO2 simulated results.

4. Conclusions

This paper presents a possibility of an alternative method for prediction of welding fume concentration inside a closed room with forced ventilation, i.e., by use of simulated CO2 concentration. The research was conducted by measuring CO2 and welding fume concentration, and comparing it with predicted CO2 concentration. The extent of their relationship was evaluated using regression analysis. The squared correlation coefficient (R2) of the experimental CO2 and welding fume concentration is very high (R2 = 0.96), which means the behaviors of welding fume and the CO2 used as shielding gas are very similarly spread in the atmosphere. Comparison of the relationship between predicted CO2 with measured CO2 and welding fume concentration shows R2 values of 0.77 and 0.74 respectively, which are also relatively high values and back a meaningful prediction. Based on the results, it can be established that the numerical simulations are sufficiently useful to indirectly calculate appropriate welding fume emissions in the case that proper measurement technique and instrument is unavailable for direct measurement. It is possible to explain this compatibility. The diffusion of fume particles and other gases is comparable as measurement of particle size showed that more than 99.5% of fume particle size is below 1 μm and that they tend to follow the diffusion pattern of gases. As this study was not aimed in developing a model for prediction of welding fume, but to determine the possibility of indirect prediction based on diffusion characteristics, future research should be directed towards unearthing the relationship of these two species by changing model parameters and verifying it by using adequate numbers of measurements. Further experiment and simulation can also be applied with complex building setup to illustrate the significance of this method in more realistic conditions.

Supplementary Materials

The following is available online at https://www.mdpi.com/2073-4433/7/6/74/s1. Table S1: Number and diameter of welding fume particles.

Acknowledgments

This research was financially supported by Changwon National University, South Korea in 2014–2015. The authors also wish to thank the editor and anonymous reviewers for valuable suggestions.

Author Contributions

Sujit Dahal was involved in literature review experimental works, conduction of CFD simulation, analysis of the results, and writing the manuscript. Kwangseog Ahn contributed to the concept and methodology of the research and assisted in reviewing and editing the manuscript. Taehyeung Kim designed the concept and methodology of the research, supervised the experimental works and analysis of results and assisted in reviewing and editing the manuscript. All authors have read and approved the final manuscript.

Conflicts of Interest

The authors declare no conflict of interest.

References

  1. Escala, S.; Nooij, M.; Quintino, L. Economically welding in a healthy way. In Proceedings of the First South-East European Welding Congress, Timisoara, Romania, May 2006; pp. 244–251.
  2. Hashmi, S.; Batalha, G.; van Tyne, C.; Yilbas, B. Comprehensive Materials Processing; Elsevier: Oxford, UK, 2014; pp. 3–71. [Google Scholar]
  3. Amza, G.; Dobrotă, D.; Groza Dragomir, M.; Paise, S.; Apostolescu, Z. Research on environmental impact assessment of flame oxyacetylene welding processes. Metalurgija 2013, 52, 457–460. [Google Scholar]
  4. Fume and Gases. Available online: http://www.webcitation.org/6gjMEC5zn (accessed on 13 April 2016).
  5. Suban, M.; Tušek, J. Dependence of melting rate in MIG/MAG welding on the type of shielding gas used. J. Mater. Proc. Technol. 2001, 119, 185–192. [Google Scholar] [CrossRef]
  6. Kielhorn, W.H.; Adonyi, Y.; Holdren, R.L.; Horrocks, R.C.; Nissley, N.E. Survey of Joining, Cutting, and Allied Processes; AWS Welding Handbook: New York, NY, USA, 2001; p. 50. [Google Scholar]
  7. Shibata, N.; Tanaka, M.; Ojima, J.; Iwasaki, T. Numerical simulations to determine the most appropriate welding and ventilation conditions in small enclosed workspace. Ind. Health 2000, 38, 356–365. [Google Scholar] [CrossRef] [PubMed]
  8. Gomes, J.F.; Albuquerque, P.C.; Miranda, R.M.; Santos, T.G.; Vieira, M.T. Comparison of deposited surface area of airborne ultrafine particles generated from two welding processes. Inhal. Toxicol. 2012, 24, 774–781. [Google Scholar] [CrossRef] [PubMed]
  9. Gomes, J.F.P.; Albuquerque, P.C.S.; Miranda, R.M.M.; Vieira, M.T.F. Determination of airborne nanoparticles from welding operations. J. Toxicol. Environ. Health 2012, 75, 747–755. [Google Scholar] [CrossRef] [PubMed]
  10. Antonini, J.; Lewis, A.; Roberts, J.; Whaley, D. Pulmonary effects of welding fumes: Review of worker and experimental animal studies. Am. J. Ind. Med. 2003, 43, 350–360. [Google Scholar] [CrossRef] [PubMed]
  11. Popović, O.; Prokić-Cvetković, R.; Burzić, M.; Lukić, U.; Beljić, B. Fume and gas emission during arc welding: Hazards and recommendation. Renew. Sustain. Energy Rev. 2014, 37, 509–516. [Google Scholar] [CrossRef]
  12. Oprya, M.; Kiro, S.; Worobiec, A.; Horemans, B.; Darchuk, L.; Novakovic, V.; Ennan, A.; van Grieken, R. Size distribution and chemical properties of welding fumes of inhalable particles. J. Aerosol Sci. 2012, 45, 50–57. [Google Scholar] [CrossRef]
  13. Chang, T.; Kao, H.; Hsieh, Y. Numerical study of the effect of ventilation pattern on coarse, fine, and very fine particulate matter removal in partitioned indoor environment. J. Air Waste Manag. Assoc. 2007, 57, 179–189. [Google Scholar] [CrossRef] [PubMed]
  14. The National Institute for Occupational Safety and Health (NIOSH). Welding, Fumes and Gases; Australian Government Publishing Service: Canberra, Australia, 1990; p. 32. [Google Scholar]
  15. Kulmala, I. Advanced Design of Local Ventilation Systems; Technical Research Centre of Finland: Espoo, The Netherlands, 1997; p. 80. [Google Scholar]
  16. The National Institute for Occupational Safety and Health (NIOSH). Criteria for a Recommended Standard: Welding, Brazing, and Thermal Cutting. Available online: http://www.cdc.gov/niosh/docs/88-110/pdfs/88-110.pdf (assessed on 23 May 2016).
  17. Lu, W.; Howarth, A.; Adam, N.; Riffat, S. Modelling and measurement of airflow and aerosol particle distribution in a ventilated two-zone chamber. Build. Environ. 1996, 31, 417–423. [Google Scholar] [CrossRef]
  18. Karthikeyan, C.; Samuel, A. CO2-dispersion studies in an operation theatre under transient conditions. Energy Build. 2008, 40, 231–239. [Google Scholar] [CrossRef]
  19. Kavgic, M.; Mumovic, D.; Stevanovic, Z.; Young, A. Analysis of thermal comfort and indoor air quality in a mechanically ventilated theatre. Energy Build. 2008, 40, 1334–1343. [Google Scholar] [CrossRef]
  20. Lambert, A.R.; Lin, C.L.; Mardorf, E.; O’shaughnessy, P. CFD simulation of contaminant decay for high Reynolds flow in a controlled environment. Ann. Occup. Hyg. 2010, 54, 88–99. [Google Scholar] [CrossRef] [PubMed]
  21. Handy, R.G.; Jackson, M.; Rodriguez, M.; Goodman, D.; Robinson, G.; Lafreniera, M. The characterization of particles generated and removed during a bone drilling process with surface coated tools. In Proceedings of the 5th International Surface Engineering Conference, Washington State Convention Center, Seattle, WA, USA, 15–17 May 2006; Jackson, M.J., Ed.; ASM International Materials Park: Novelty, OH, USA, 2006; pp. 47–52. [Google Scholar]
  22. Mei, C.C. 2.7 Aerosols and Coagulation-MIT. Available online: http://www.webcitation.org/archive.php (accessed on 13 April 2016).
  23. Yang, L.; Ye, M.; He, B. CFD simulation research on residential indoor air quality. Sci. Total Environ. 2014, 472, 1137–1144. [Google Scholar] [CrossRef] [PubMed]
Figure 1. Schematic diagram of welding apparatus setup.
Atmosphere 07 00074 g001
Figure 2. Schematic diagram of experimental setup and measurement points.
Atmosphere 07 00074 g002
Figure 3. Top view of the model with measurement points.
Atmosphere 07 00074 g003
Figure 4. Model and mesh generation in Airpak.
Atmosphere 07 00074 g004
Figure 5. Size distribution of welding fume particles (%).
Atmosphere 07 00074 g005
Figure 6. Concentration of measured welding fume at ten measurement points.
Atmosphere 07 00074 g006
Figure 7. Concentration of measured CO2 at ten measurement points.
Atmosphere 07 00074 g007
Figure 8. Concentration of simulated CO2 at ten measurement points.
Atmosphere 07 00074 g008
Figure 9. Correlation of measured welding fume and measured CO2.
Atmosphere 07 00074 g009
Figure 10. Correlation of simulated CO2 and measured CO2.
Atmosphere 07 00074 g010
Figure 11. Correlation of simulated CO2 and measured welding fume.
Atmosphere 07 00074 g011

