1. Introduction
The Madden-Julian Oscillation (MJO) [
1,
2] is the most dominant mode of the intra-seasonal variations of the tropical atmosphere [
3,
4]. A pronounced convective signal of MJO appears in the Indian Ocean and propagates eastward through the Maritime Continent and the Pacific, and the upper-level circulation of the MJO is traced to circumnavigate the globe. During its development and propagation, MJO has significant impacts on weather and climate at local-scales, basin-scales, and global-scales. One of the major impacts of MJO on local- and basin-scale weather appears in the generations of tropical cyclones (TCs). Previous studies showed that tropical cyclone genesis (TCG) over the Indian Ocean and the western North Pacific is positively affected by the active phases of MJO [
5,
6,
7]. Direct influences of MJOs on TCG were clearly demonstrated during their eastward propagation [
6].
On the other hand, it is considered that the MJO activity may also have an influence on the formation of seasonal-mean environmental conditions for TCG, which would affect the inter-annual variation of TCG. By focusing on the seasonal-mean environmental characteristics for TCG due to MJO, Tsuboi and Takemi (hereafter referred to as TT14) [
8] investigated the environmental conditions for TCG that are affected by the activity of MJO by focusing on seasonal composites between October and December. It was found that in years with high MJO activity, both relative humidity at a low-to-middle level and vertical velocity at a middle level contribute to the formation of seasonal-mean environmental conditions for TCG.
Based on the statistical analyses conducted by TT14, the present study investigates possible environmental factors that affect TCG over the Indian Ocean on a seasonal basis during the period from October to December in 2011 with the use of an empirical index. During this period, a field experiment was conducted over the tropical Indian Ocean under the Cooperative Indian Ocean Experiment on Intraseasonal Variability in the Year 2011 (CINDY2011) and Dynamics of the MJO (DYNAMO) [
9,
10]. Three MJO events were observed during this time period. Therefore, it is expected that the environmental conditions from October to December 2011 are strongly influenced by the activity of MJO. We examine the seasonal-mean environmental properties in terms of an empirical index and compare the characteristics during the CINDY2011/DYNAMO period with those identified from the climatological analyses on long-term reanalysis data.
Previous studies have shown that El Niño/La Niña and Southern Oscillation (ENSO) significantly controls the inter-annual variability of TCG in the Pacific [
11,
12] and in the Indian Ocean [
13,
14,
15,
16,
17,
18]. Furthermore, the Indian Ocean Dipole (IOD) mode [
19] is one of the pronounced phenomena in the tropical coupled atmosphere–ocean system in the Indian Ocean, and is considered to influence the TC activity in the Indian Ocean and in the southern Pacific [
16,
20,
21]. Depending on the phases of ENSO and IOD, the sea surface temperature (SST) over the Indian Ocean varies, which may affect TCG. Therefore, in order to infer possible influences of ENSO and IOD on TCG, we will discuss a possible relationship of the SST distribution with TCG in the Indian Ocean. Furthermore, we will also discuss the effects of the warming of the Indian Ocean.
2. Data and Analysis Procedure
We focus on the environmental conditions for the period between October and December (OND) in 2011, corresponding to the CINDY2011/DYNAMO period. This seasonal period is the same with the statistical analyses from the 33-year data from 1979 to 2011, which were conducted by TT14. In the present analyses, we compare the environmental characteristics of TCG averaged during OND in 2011 with those identified by the 33-year mean fields.
The information on the locations and tracks of TCs is obtained from the best-track dataset of the United States Navy’s Joint Typhoon Warning Center (JTWC). Data used for the analysis of the environmental atmosphere are the Japanese 25-year Reanalysis (JRA-25) and Japan Meteorological Agency (JMA) Climate Data Assimilation System (JCDAS) dataset [
22] produced by JMA and the Central Research Institute of Electric Power Industry. The temporal and horizontal resolutions of this dataset, which is available from 1979, are 6 h and 1.25 degree, respectively. The JRA-25 dataset has been widely used in investigating the environmental characteristics for the generation of TCs [
8,
23,
24,
25,
26]. There is also a study [
27] which compared the representations of the environmental conditions for TCs in various reanalysis datasets and found that there are no pronounced differences among the datasets. Therefore, the JRA-25 dataset is considered to be useful in the present analyses.
In TT14, the data period of 33 years was divided into MJO active years and MJO non-active years, based on the real-time multivariate MJO (RMM) index [
28]. In TT14, the activity of MJO in each year was assessed by a number of days in which the amplitude in the phases 2, 3, 4, and 5 of the RMM phase space during 1 October and 31 December was larger or smaller than 1.0. The active (non-active) year was then defined as a year in which the number of active days is larger (smaller) than a half of the standard deviation from the 33-year mean. Thus, the active MJO years in TT14 meant that the MJO signal by the RMM index is stronger specifically over the Indian Ocean-Maritime Continent during OND. In the present study, we also refer to the term “MJO active” as the high RMM index, specifically in the Indian Ocean–Maritime Continent region during OND. With these procedures, 11 years each were determined as active and non-active. See details in TT14.
Table 1 shows the classification of the 33 years into the MJO active and the MJO non-active years as well as years of no definition for MJO activity (which is not categorized either as active or non-active). The year 2011 was determined to be an active year. Therefore, in the present study, the environmental characteristics in 2011 were compared with those averaged for the 11 active years. The commonality and dissimilarity of the characteristics in 2011 with the climatological analysis in TT14 will be discussed here. As pointed out in a previous study [
29], the RMM index can be influenced by both lower- and higher-frequency variability. In the present study, however, as indicated by TT14, we consider that the diagnosis with the RMM index is useful in order to highlight the atmospheric conditions during the CINDY2011/DYNAMO period from the climatological features of the MJO active years.
Because the influences due to MJO activity are assessed on a yearly basis, the inter-annual variability of the tropical atmosphere and ocean should also be taken into account. Since ENSO is the major inter-annual variability of the tropical atmospheric and oceanic system, the 33 year period is also classified by the phase of ENSO. For this purpose, we use the Oceanic Niño Index (ONI) diagnosed by National Oceanic and Atmospheric Administration (NOAA)’s Climate Prediction Center (CPC). ONI is determined by the anomaly of SST over the tropical central Pacific (
i.e., 5
S–5
N and 170
W–120
W) from the 30-year means updated every five years.
Table 1 summarizes the ENSO phase, including the neutral phase of ENSO, for each year from 1979 to 2011. It is found that the year 2011 is characterized by both La Niña and MJO active year. In addition, the years from 1979 to 2011 are classified into the phases (positive or negative) of IOD [
16,
30]. This IOD classification is also indicated in
Table 1. It is noted that positive (negative) IOD years are seen only in the MJO active (non-active/no definition) years. Because IOD affects the SST distribution in the Indian Ocean, the relationship between SST and TCG and thereby possible influences of IOD on TCG are discussed.
The environmental conditions for TCG are investigated with the use of a genesis potential index (GPI) [
31], which has an additional factor related to vertical motion and is regarded as a modified version of Emanuel and Nolan’s GPI [
29]. The GPI of Murakami
et al. is given by
where
η is the absolute vorticity (s
−1) at the 850-hPa level,
RH is the relative humidity (%) at the 700-hPa level,
Vpot is the maximum potential intensity (MPI; m·s
−1) [
33],
Vs is the magnitude of the vertical wind shear (m·s
−1) between the levels of 850 and 200 hPa (
i.e., the scalar quantity of the difference from the wind vector at 200 hPa to that at 850 hPa), and
ω is the vertical wind speed (Pa·s
−1) at the 500-hPa level. It was demonstrated in TT14 that seasonal mean GPI fields averaged for the 33-year period represent the spatial distribution of TCG well.
3. Results
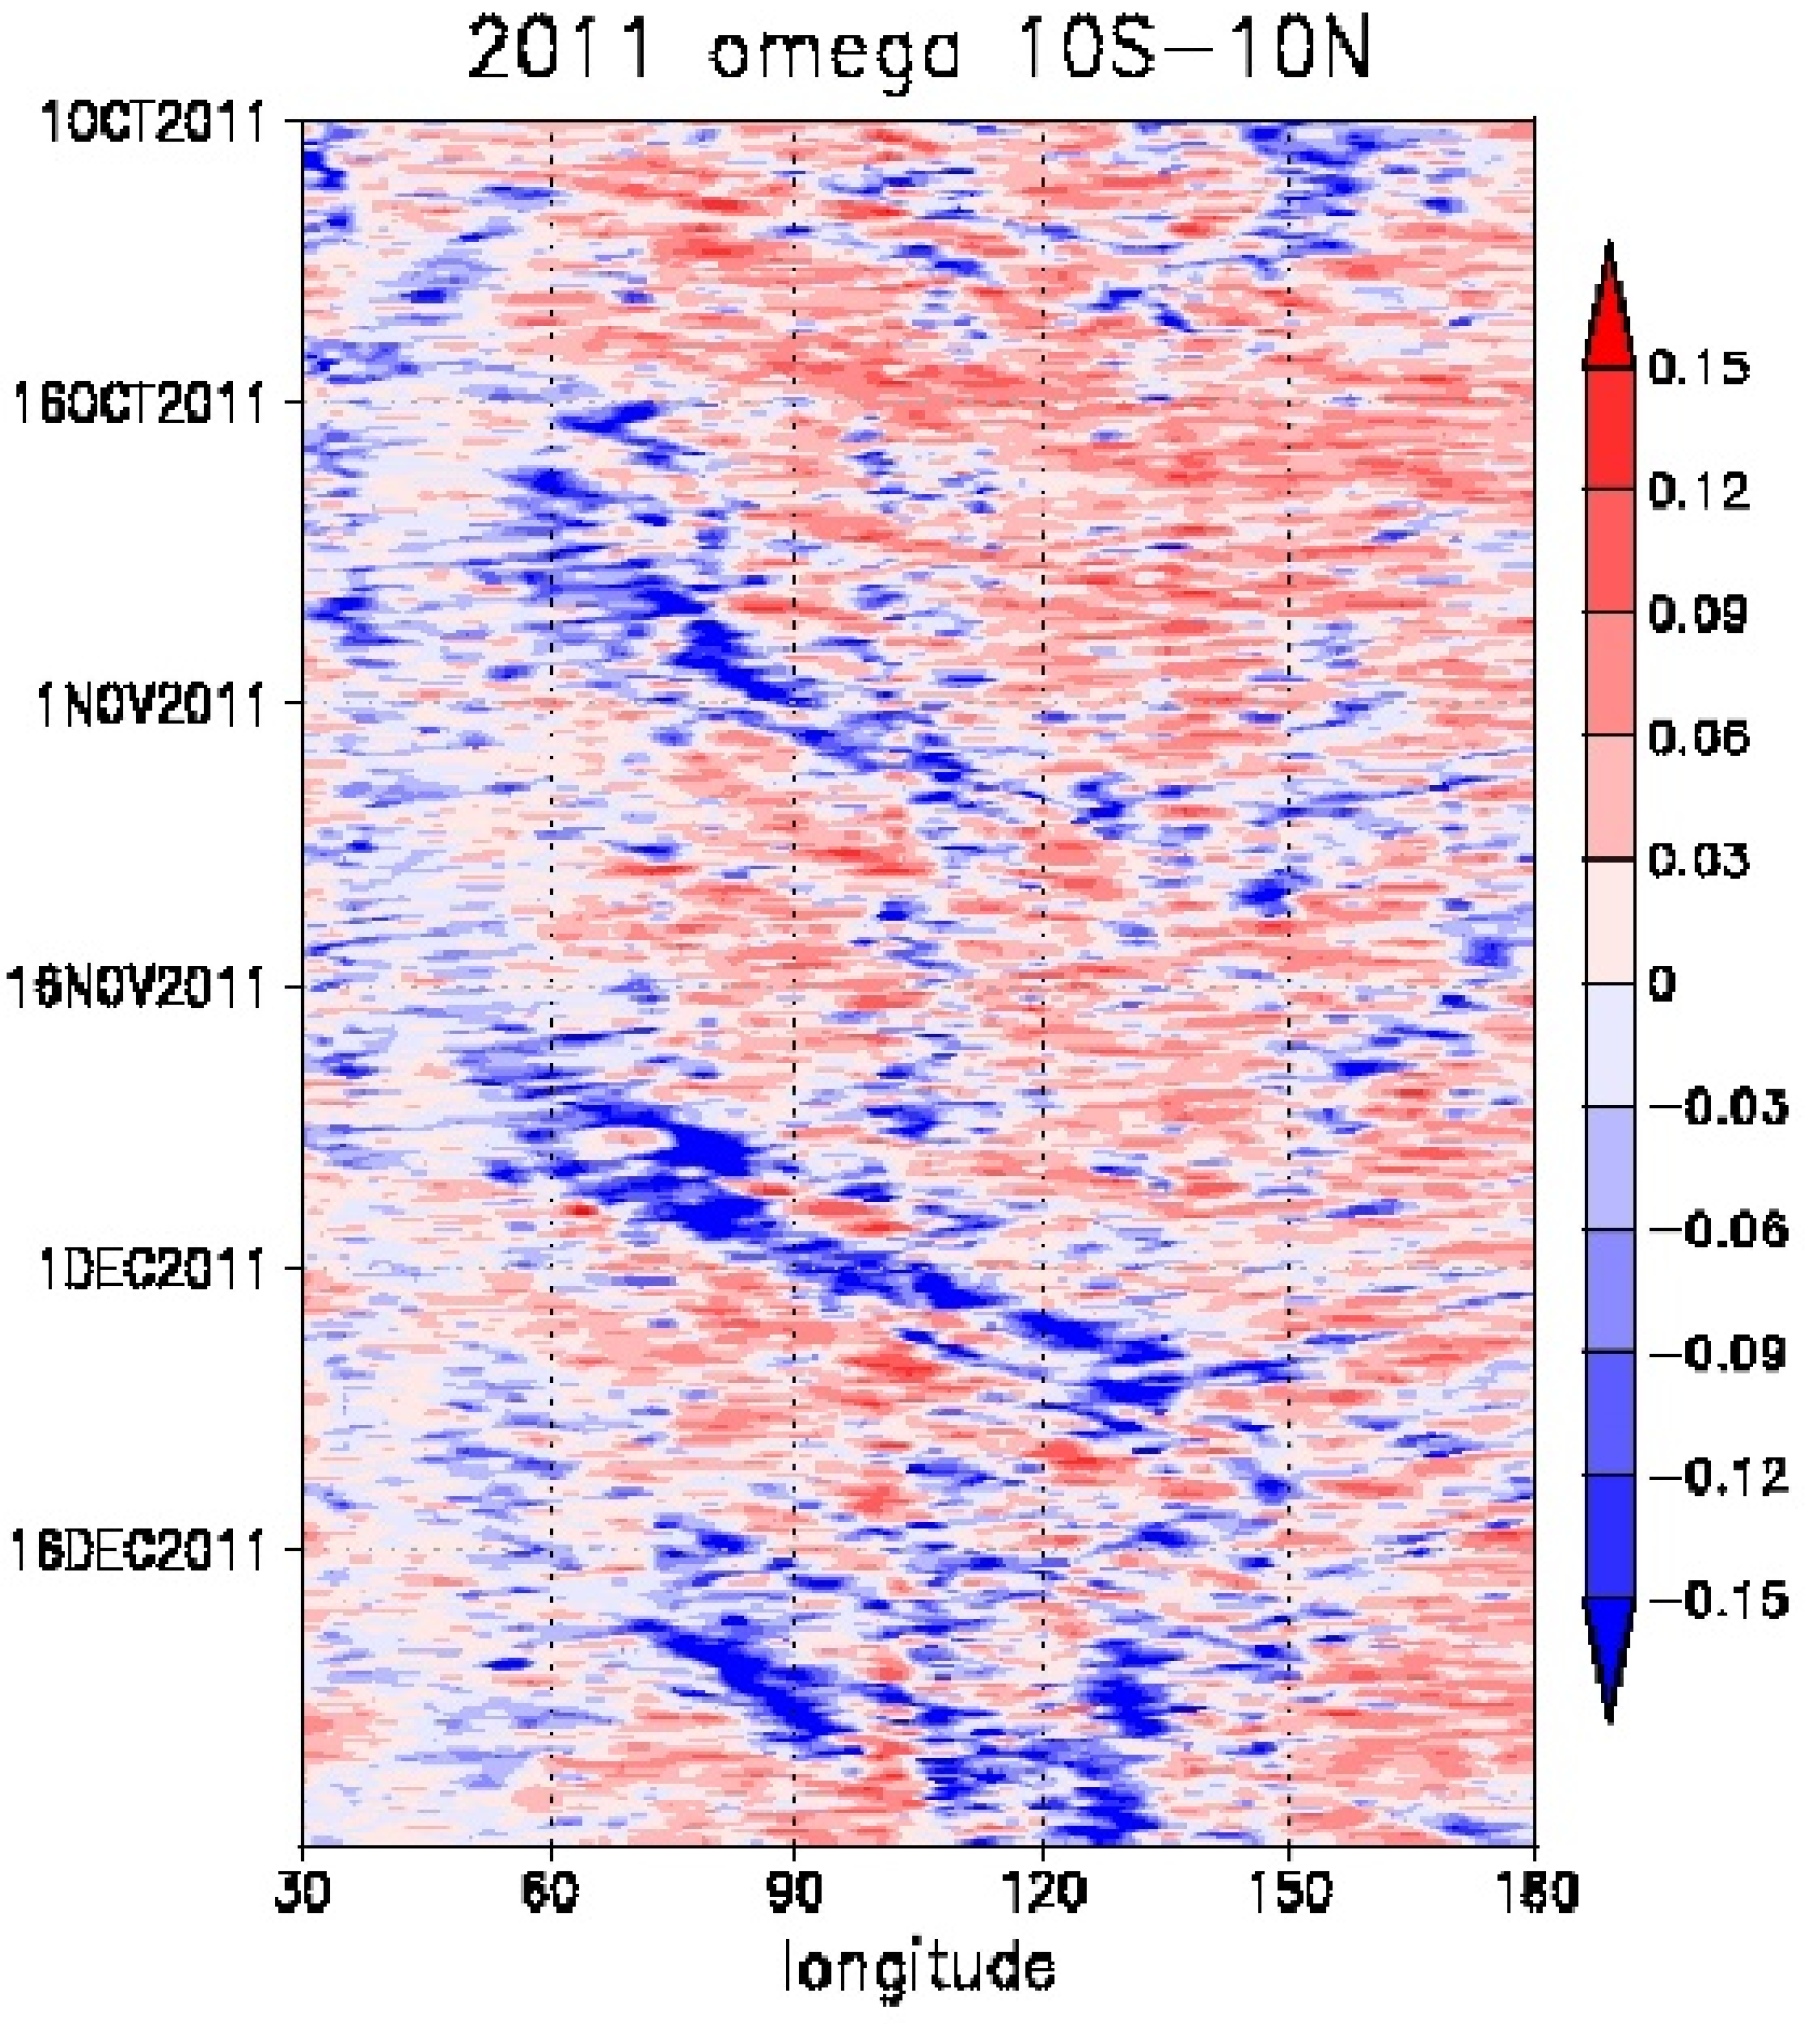
The representation of the MJO events observed during the CINDY2011/DYNAMO period in the JRA-25 dataset is demonstrated in
Figure 1. Eastward propagating signals of upward motion are seen from around the 60
E longitude passing over the Indian Ocean toward the Maritime Continent region in late October, late November, and in the middle of December, which corresponds to the observed MJO signals [
29,
34]. Thus, the JRA-25 reanalysis seems to capture the MJO events in 2011 well.
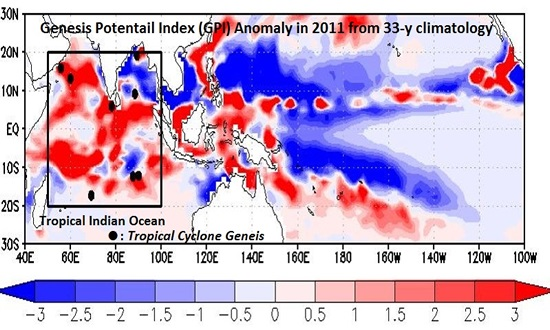
Figure 2a shows the spatial distribution of GPI during the CINDY2011/DYNAMO period in terms of the anomalies from the 33-year averages. Here the region indicated by a box (50–100
E, 20
S–20
N) is referred to as the tropical Indian Ocean, which is the analysis region. Positive anomalies prevail over the tropical Indian Ocean region, except for the negative area seen in the Bay of Bengal. The locations of TCG closely correspond to the areas of positive GPI anomaly. Because the year 2011 is characterized by both MJO active and La Niña (
Table 1),
Figure 2b,c exhibits the GPI anomaly fields composited for the MJO active years and for the La Niña years, respectively, in comparison with the GPI anomaly in 2011. The spatial pattern over the tropical Indian Ocean in 2011 is very similar to the feature in the MJO active years, although the magnitude of the anomalies in 2011 is more pronounced than that composited for the MJO active years. Consistent with this feature, the number of TCG during OND in 2011 is eight (
Figure 2a), which is larger than six TCG averaged in the MJO active years. In contrast, the GPI anomaly pattern over the tropical Indian Ocean in 2011 is totally different from that composited for the La Niña years: the signs of the GPI anomalies in the 2011 case and in the La Niña years are overall opposite with each other. The correlation coefficient of the spatial patterns of the GPI anomalies in the tropical Indian Ocean between the 2011 case and the MJO active years is 0.39, while that between the 2011 case and the La Niña years is −0.03.
It should be noted that the spatial distributions of the GPI anomalies in the tropical Pacific appear to be similar with each other between 2011 and the La Niña years (
Figure 2a,c): positive areas are seen around the Maritime Continent, and farther east to these areas, a negative pattern prevails over most of the western half of the tropical Pacific. On the other hand, the similarity of the GPI anomaly pattern in the Pacific between 2011 and the MJO active years seems to be small. Thus, the GPI anomaly patterns in the Pacific indicate different features from those seen in the Indian Ocean.
The contributions from each factor in Equation (1) to the total GPI anomaly are examined with the procedure of Camargo
et al. [
6,
36] in order to diagnose the degrees of each environmental property in Equation (1) in characterizing the GPI anomaly of 2011. The procedure to compute those contributions is the same as that used in TT14 [
8].
Figure 3 demonstrates the contributions of the factors in Equation (1) to the total GPI anomaly of 2011. Dominant positive anomalies over the tropical Indian Ocean are seen in the fields of relative humidity, vorticity, MPI, and vertical velocity. Higher correlation coefficients of the spatial patterns over the tropical Indian Ocean between the total GPI anomaly (
Figure 2a) and each contribution (
Figure 3) are found for vertical velocity (correlation coefficient of 0.71), relative humidity (0.54), and vorticity (0.54). On the other hand, the correlation coefficients with vertical shear and MPI are 0.12 and 0.16, respectively. Thus, from a viewpoint of the spatial coherence between the GPI anomaly and each GPI factor, the GPI anomalies over the tropical Indian Ocean in 2011 (
Figure 2a) seem to be highly correlated with the spatial distribution of vertical motion, relative humidity, and absolute vorticity.
Meanwhile, the contribution of MPI to the total GPI anomaly is mostly positive throughout the tropical Indian Ocean. The mean GPI anomaly averaged over the tropical Indian Ocean in 2011 was 1.12, which is significantly larger than the MJO active-year mean of 0.28 found in TT14 [
8]. The contribution from MPI to the basin-mean GPI anomaly is the largest as a basin-wide sense. Since MPI is determined by SST and temperature at the tropopause level [
33], the positive MPI contribution may be due to an influence from SST. Actually, anomalous SST distributions were observed in the CINDY2011/DYNAMO period [
29,
35].
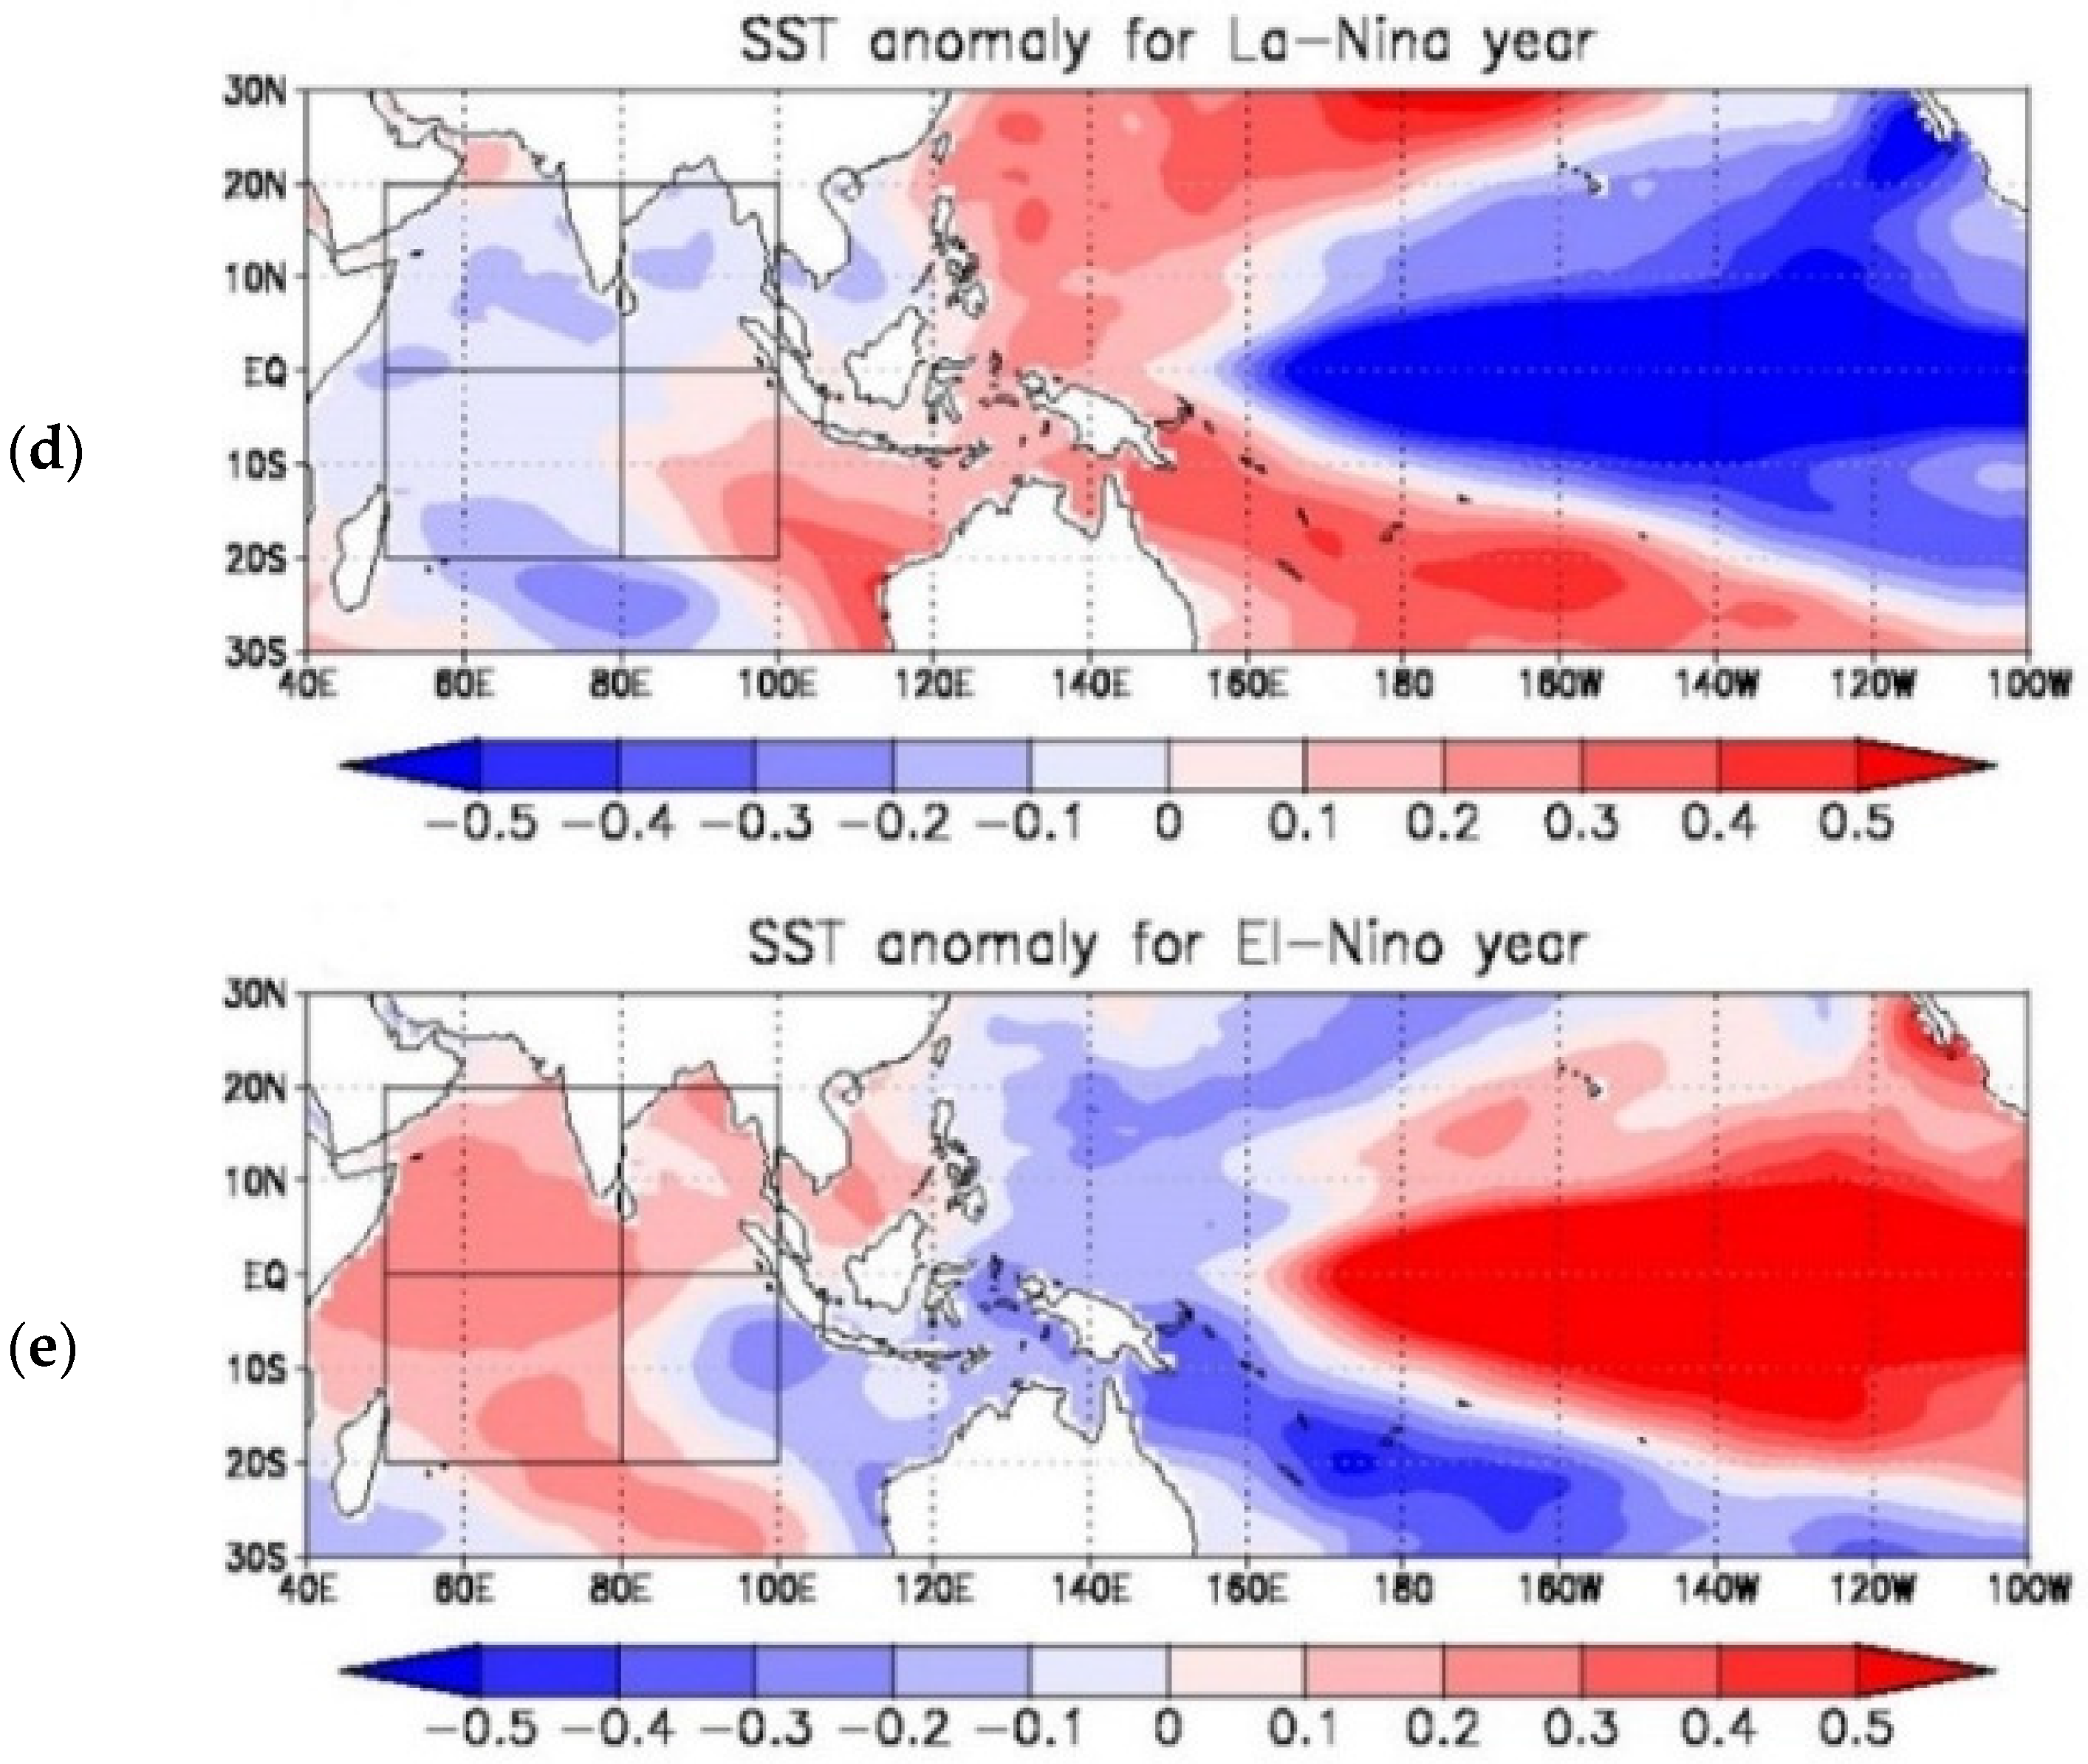
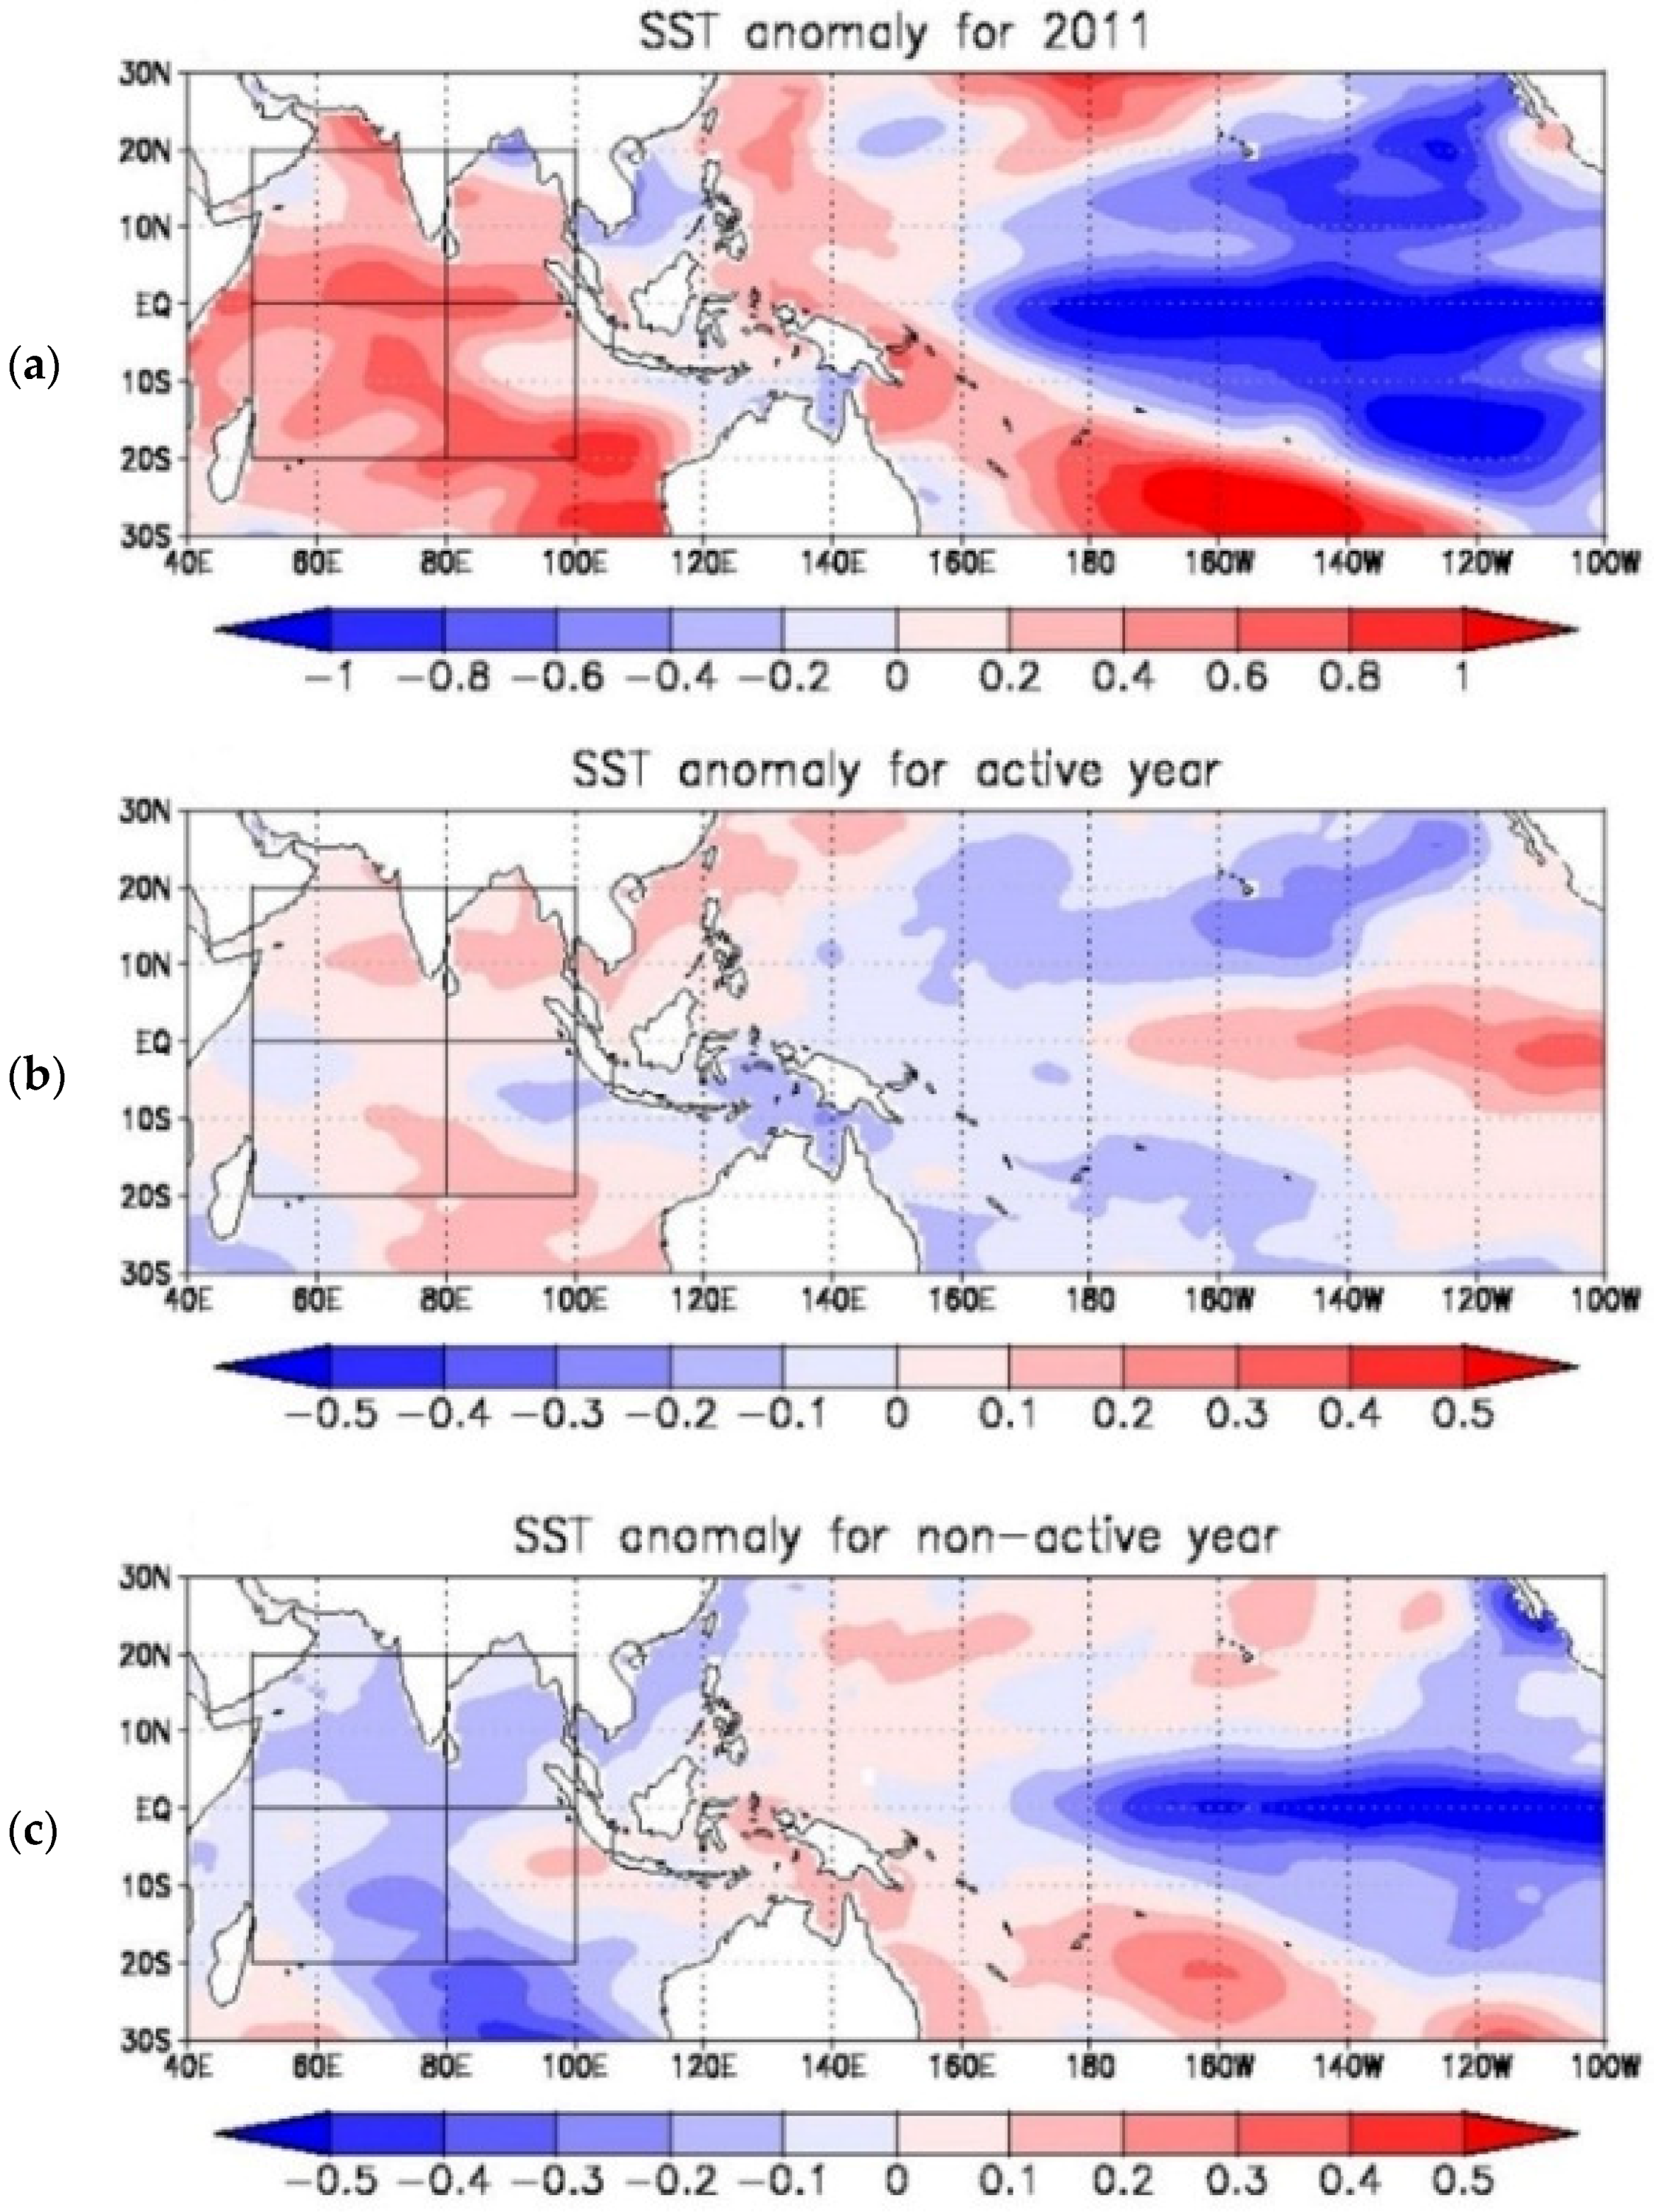
Figure 4 demonstrates the SST anomaly fields from the 33-year means in the Indian Ocean as well as in the Pacific, averaged during OND in 2011 as well as composited in the MJO active/non-active years and in the La Niña/El Niño years. The SST anomaly in 2011 seems to be positive over the Indian Ocean, and its magnitude is generally much larger than that in the other years. Thus, it is considered that the SST anomaly in 2011 has an influence on the spatial characteristics of MPI in 2011, which might affect basin-scale TCG. However, in terms of the spatial similarity of each contribution with the GPI anomaly,
Figure 3 suggests that the positive GPI anomalies over the tropical Indian Ocean in 2011 are due to the effects from vertical motion, relative humidity, and absolute vorticity.
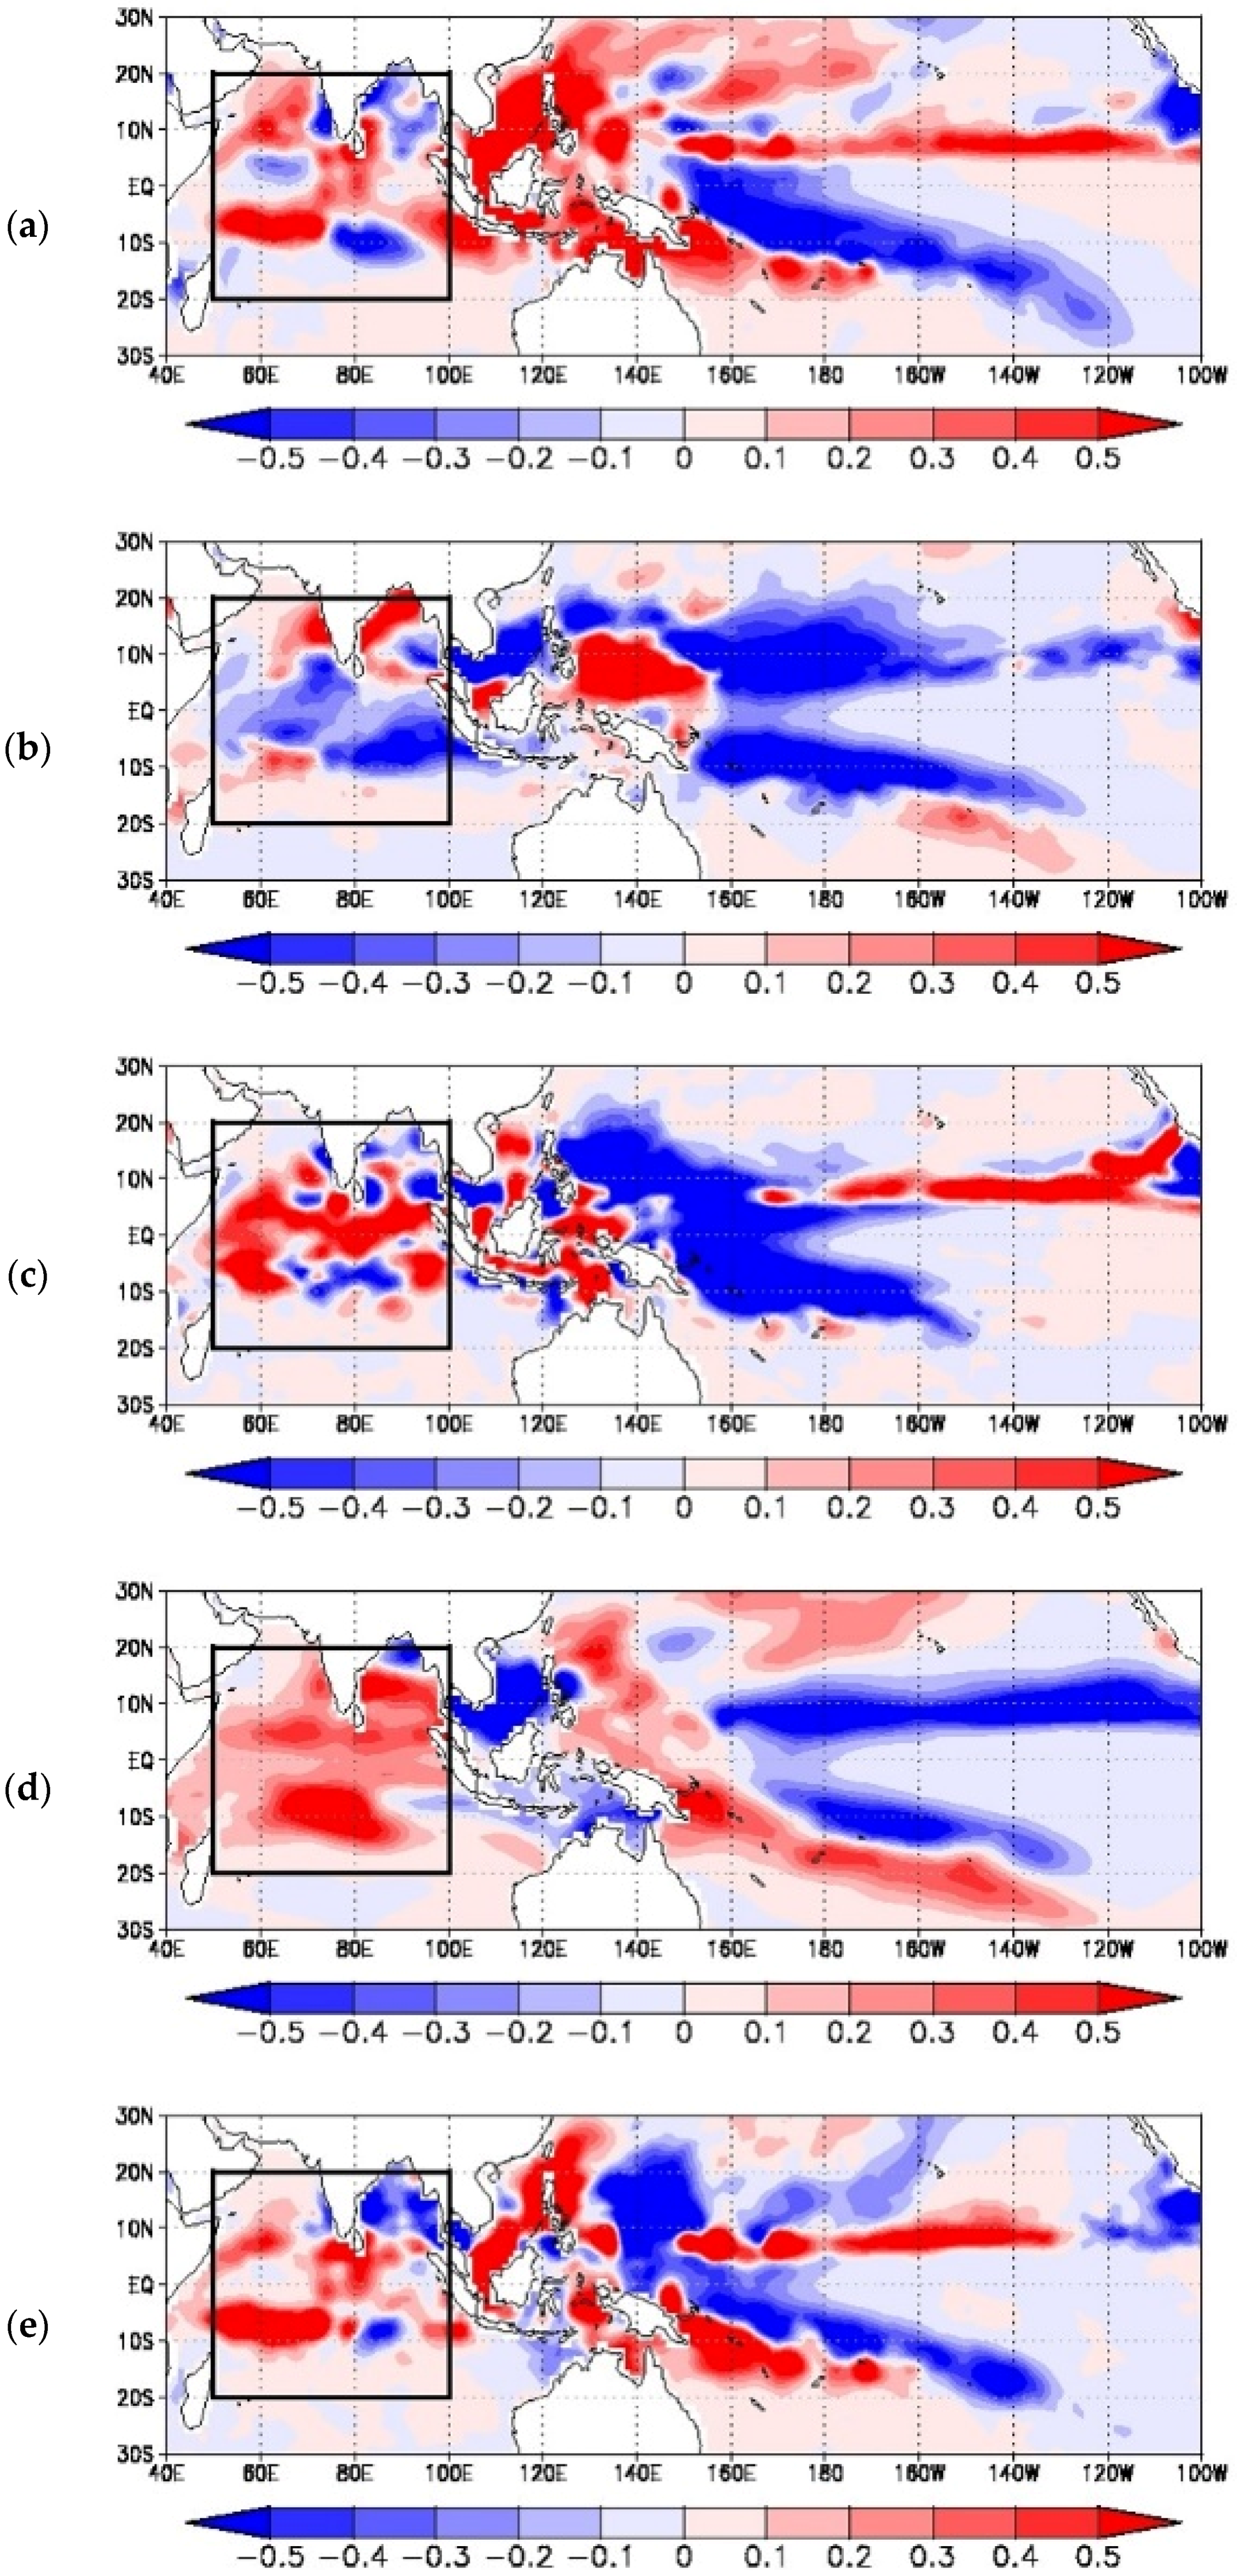
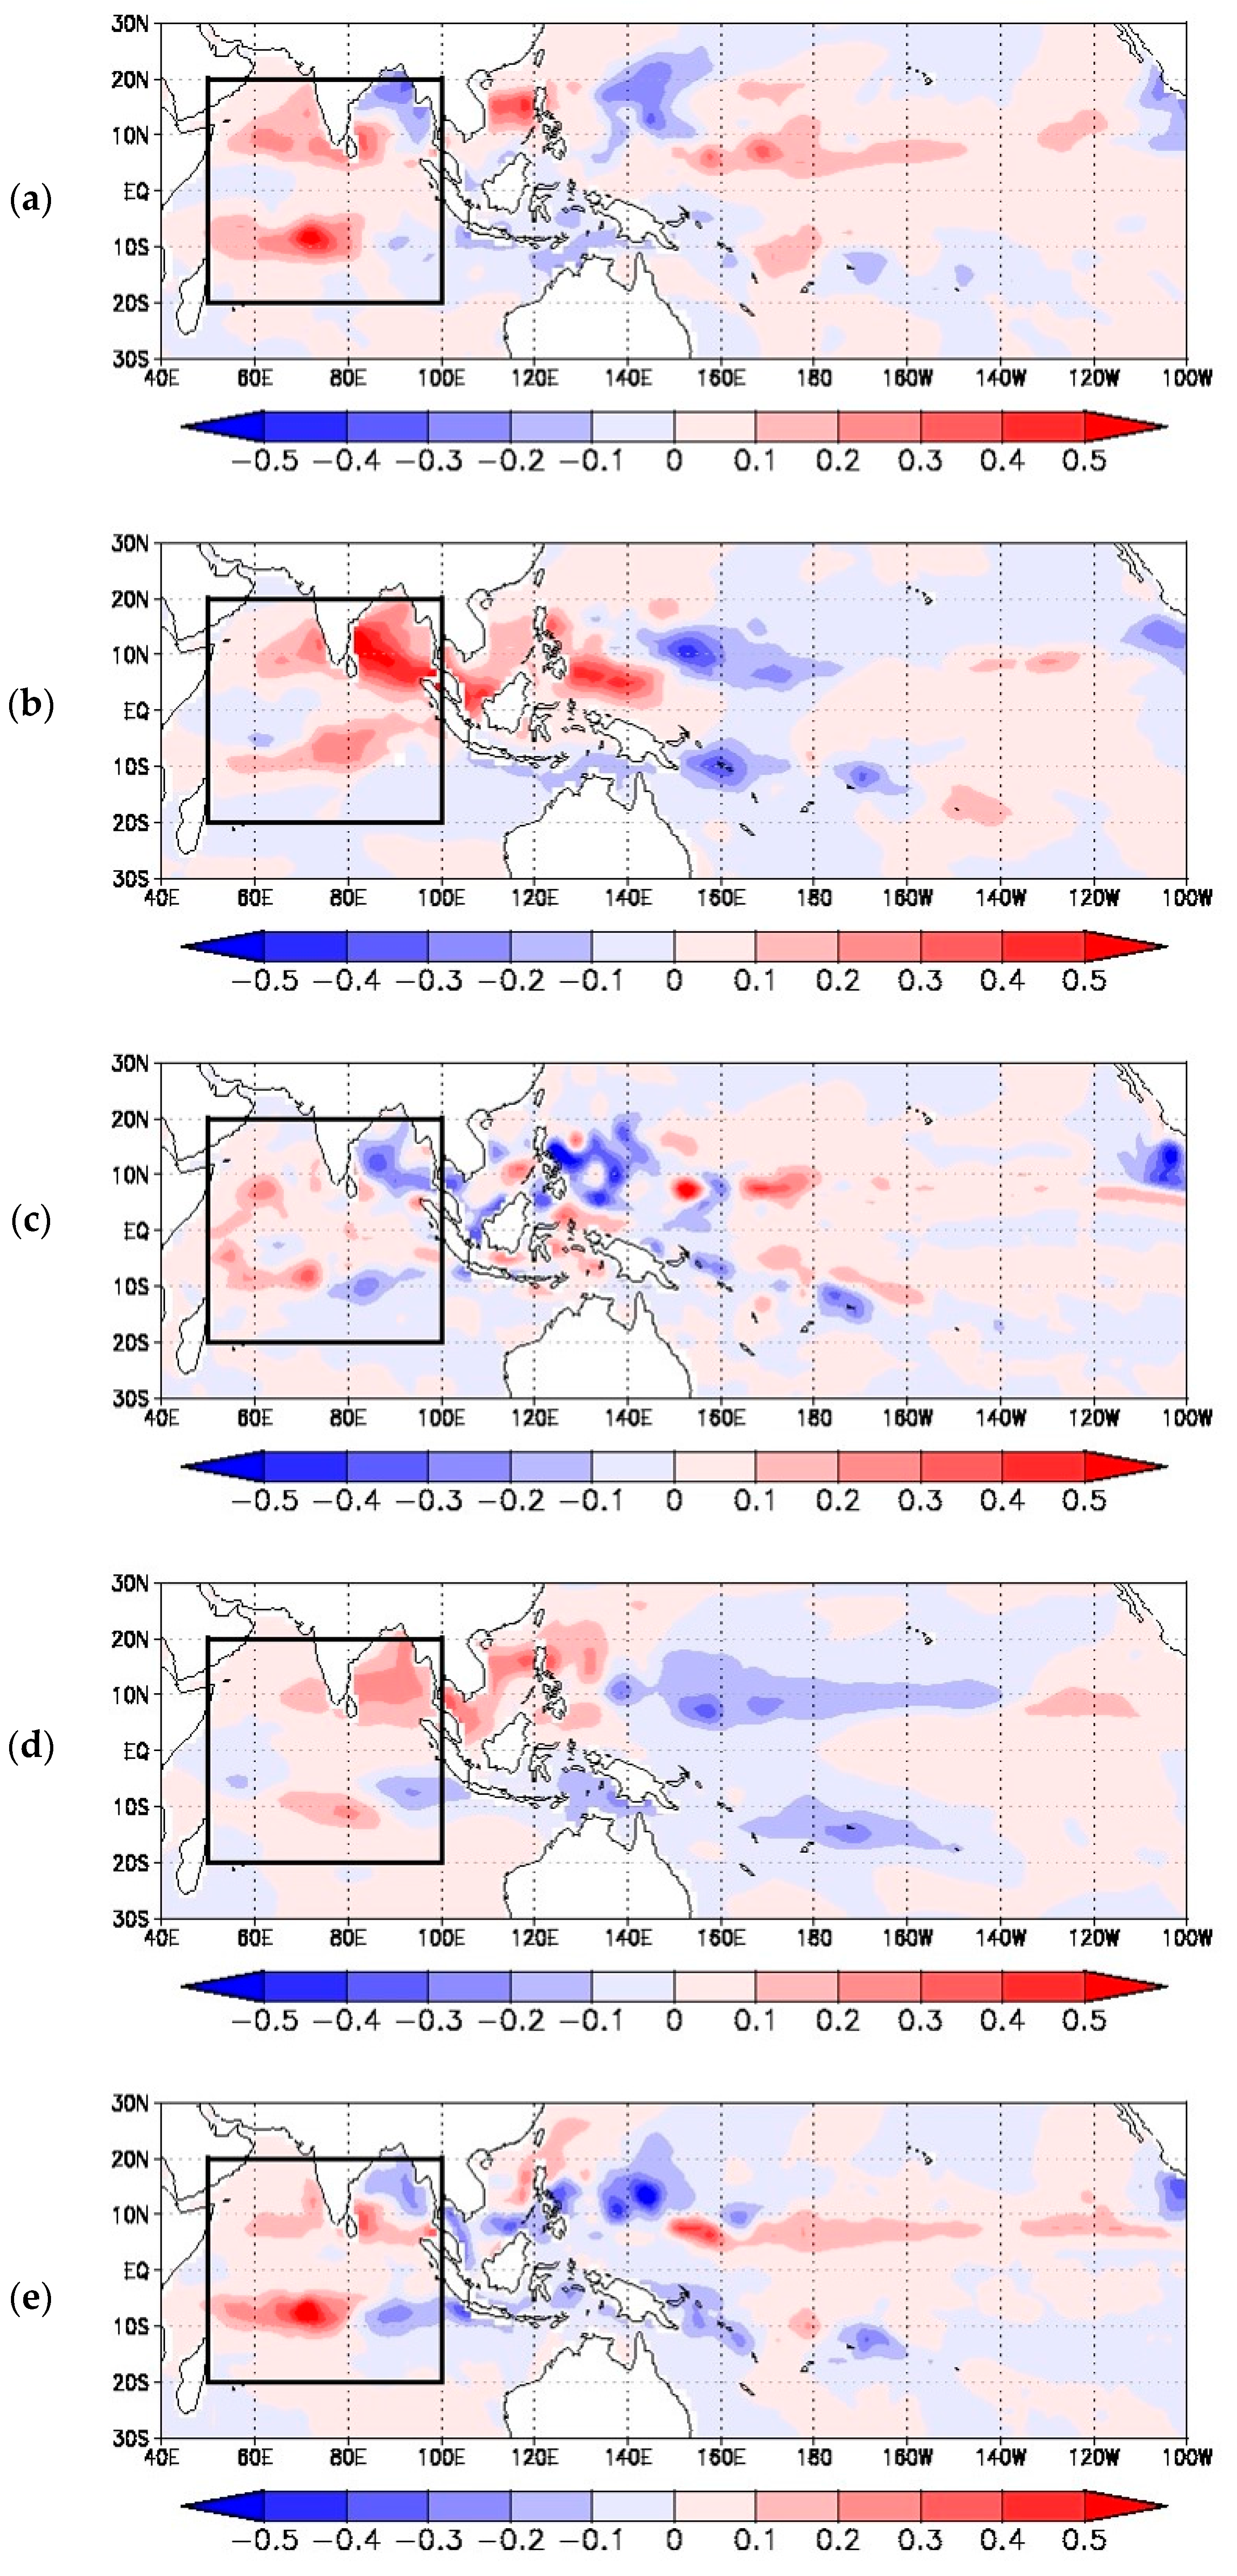
The contributions from each factor in Equation (1) in the 2011 case are compared with those in the MJO active years.
Figure 5 demonstrates the spatial distributions of the contribution from each factor to the total GPI anomaly in the MJO active years. From
Figure 3 and
Figure 5, it is seen that the spatial patterns of the contribution from each factor (except for the shear factor) over the tropical Indian Ocean in 2011 and the MJO active years are similar to each other, although the magnitudes of the contributions are largely reduced in the MJO active years.
From the statistics presented in TT14, it was shown that relative humidity and vertical velocity most significantly contribute to the GPI anomalies in the MJO active years. The magnitudes of the anomalies for each component, including relative humidity and vertical velocity, in 2011 are overall more enhanced than those of the mean anomalies averaged for the MJO active years (
Figure 3 and
Figure 5). In contrast, the vertical vorticity plays a role in contributing to the GPI anomalies in 2011, while it has the least effect on the GPI anomalies averaged in the MJO active years. The vertical vorticity factor may be influenced by the significant MJO signal during October and November in 2011 [
29].
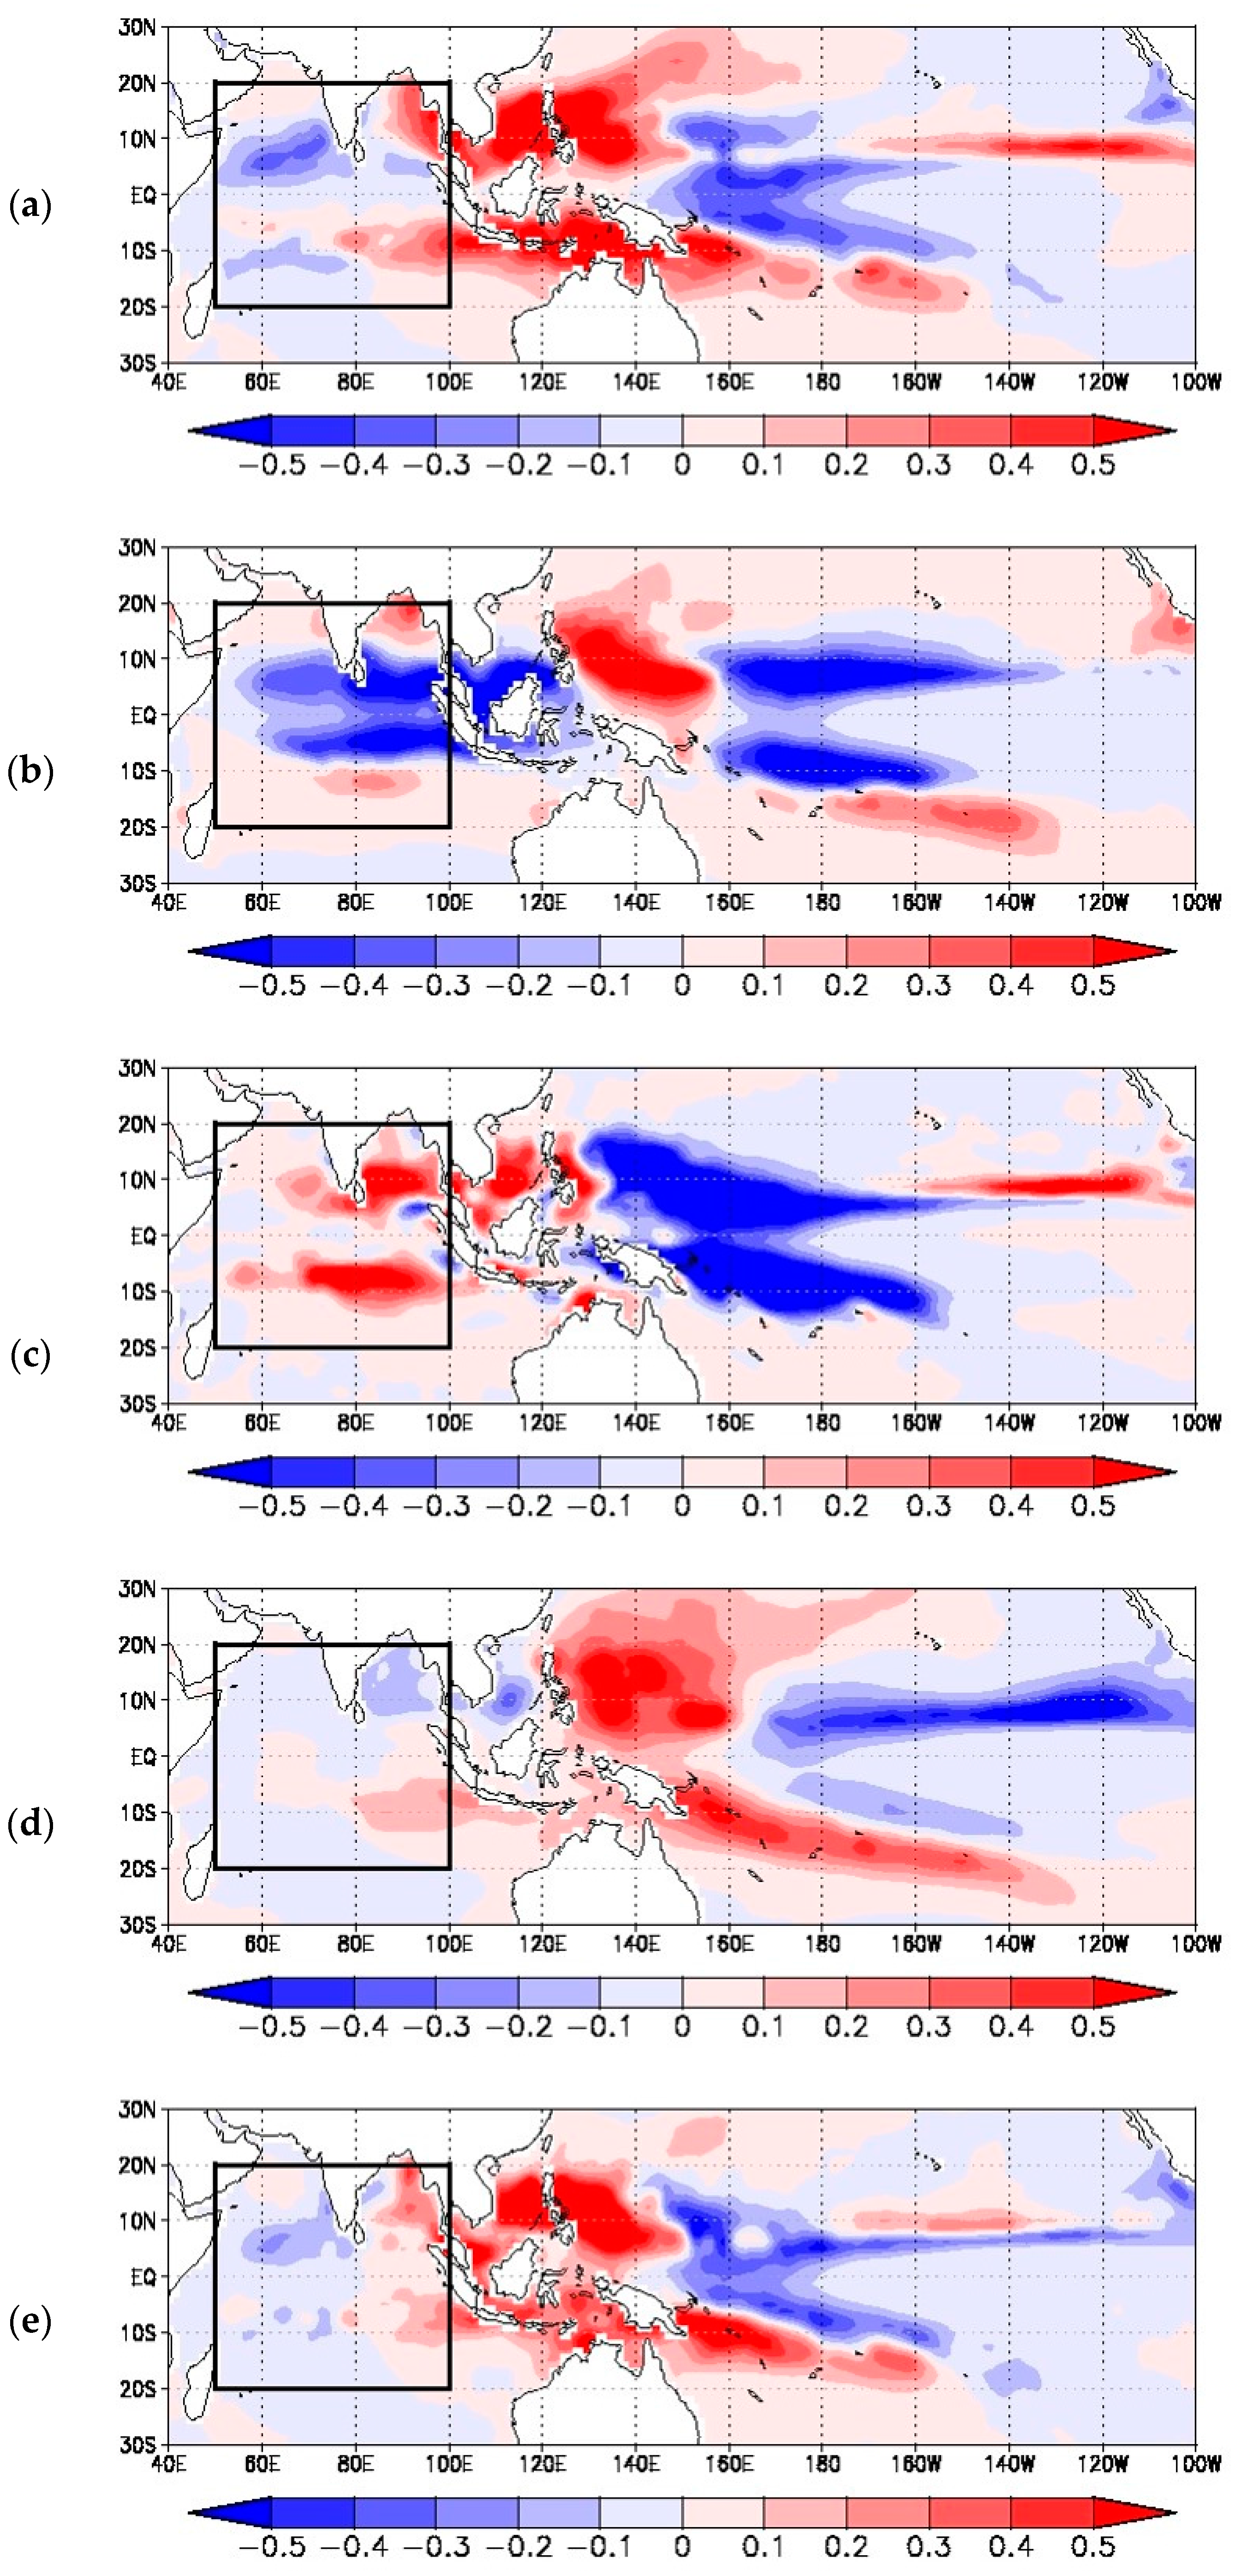
The contributions from each factor in Equation (1) in the 2011 case are further compared with those in the La Niña years. As in
Figure 5,
Figure 6 shows the spatial distributions of the contribution from each factor to the total GPI anomaly averaged for the La Niña years. The comparison between
Figure 3 and
Figure 6 indicates that the spatial patterns between 2011 and the La Niña years are quite different: the distributions of positive and negative signs appear to be completely opposite. Interestingly, the distributions of the shear factor in 2011 and the La Niña years are seen to be similar: negative area is located near the equator, while positive areas are found to the north and the south of this equatorial area.
The similarity of the shear factor between the 2011 case and the La Niña years is considered to be a reflection of the pronounced east–west overturning circulation, not only in the Pacific, but also in the Indian Ocean. Such an enhanced overturning circulation provides a stronger shear condition, which negatively impacts GPI. The shear factor was shown to be one of the major contributors that negatively influence the GPI anomaly during a La Niña phase [
36]. The present analysis for the CINDY2011/DYNAMO period suggests that the shear factor is influenced more by the negative impact from the east–west circulation induced by the La Niña phase than by the positive impact through the active MJO events.
From the comparisons among
Figure 3,
Figure 5, and
Figure 6, the general characteristics of the spatial patterns over the tropical Indian Ocean in the 2011 case seem to have much in common with those in the MJO active years.
Table 2 summarizes the correlations of the spatial patterns in the tropical Indian Ocean between 2011 and the MJO active years and between 2011 and the La Niña years for each factor contributing to the total GPI anomaly. The characteristics seen in
Figure 3,
Figure 5, and
Figure 6 are clearly identified in the correlation coefficients. Higher correlations are seen for relative humidity, absolute vorticity, MPI, and vertical velocity between 2011 and the MJO active years. Meanwhile, the shear factor in 2011 has more similarity with that in the La Niña years.
On the other hand, the spatial patterns of the contributing factors over the Pacific in 2011 seem to be very similar to those in the La Niña years. This feature is quite reasonable, since 2011 is a La Niña year (
Table 1). In other words, the patterns over the Pacific in 2011 are regulated more strongly by ENSO than by the activity of MJO.
4. Discussion
In the present analysis, we focused on the atmospheric conditions for TCG in terms of an empirical index (i.e., GPI) by comparing the conditions during the CINDY2011/DYNAMO period with those averaged over the MJO active years and also over the La Niña years. The environmental features over the Indian Ocean in 2011 were shown to be affected more by the MJO activity than by the La Niña phase. Influences of ENSO are further discussed here.
In order to discuss the relationship between the atmospheric state over the Indian Ocean and the ENSO event, we examine the correlations of the inter-annual variation of the seasonal-mean GPI anomalies, the number of the days of active MJO during OND, and the seasonal-mean ONI. As in TT14, because of the regional difference of the GPI distribution in the Indian Ocean, the analysis region is divided into four sub-regions, that is, the northwestern Indian Ocean (NWI; 50–80E, 0–20N), the northeastern Indian Ocean (NEI; 80–100E, 0–20N), the southwestern Indian Ocean (SWI; 50–80E, 20S–0), and the southeastern Indian Ocean (SEI; 80–100E, 20S–0). The quantities are evaluated over each four divided region within the Indian Ocean during the 33 year period.
Table 3 summarizes the correlation coefficients of the GPI variation with the MJO variation and with the ONI variation. The MJO variation is significantly correlated with the GPI variation over the NWI and the SWI. On the other hand, over the NEI and the SEI region, there is no significant correlation between the GPI variation and the MJO variation. For the ONI variation, a significant negative correlation with the GPI variation is found in the SEI region. From these correlations of the GPI variation with MJO and ONI, it is suggested that the impact of ENSO would be stronger than MJO, specifically in the SEI region.
It is interesting to note from
Table 3 that the SEI region seems to be affected more by ENSO than by MJO. This point is further examined by the variations of GPI and ONI for the MJO active years.
Table 4 compares the GPI anomaly and ONI for the MJO active years over the SEI region. It is seen that the GPI anomalies become smaller than −0.5 in 1982, 1987, and 1994, and that these years correspond to El Niño years. On the other hand, the positive GPI anomalies greater than 0.5 in 2002 and 2011 are not necessarily related to the opposite phase of ENSO (
i.e., a La Niña event), but rather related to the increased activity of MJO. Although it is difficult to definitely determine the response of GPI to ENSO and MJO from a limited number of samples, it is suggested that the effects of ENSO will appear in the SEI region more significantly during the El Niño phase. In the El Niño period, the convective activity is shifted to the central Pacific, and hence the atmospheric condition over the Maritime Continent becomes drier than usual. From the analysis described in section 3, it was shown that middle-level relative humidity has a strong impact on GPI. Therefore, a drier condition in the El Niño period significantly decreases the value of GPI not only in the western Pacific but also in the southeastern part of the Indian Ocean.
In the NEI region, the correlation between the GPI variation and the MJO/ENSO variation is very low. The complicated distribution over the NEI region is considered to be due to the geographical character of the Bay of Bengal, which is located to the south of the Asian continent, which would critically affect regional-scale weather and climate. There are studies that investigated the impacts of ENSO and/or IOD on the activities of TCs in the Bay of Bengal [
16,
20]. Such studies will reveal the regional characteristics of TC activity in the north Indian Ocean, including the Bay of Bengal.
Although it is difficult to completely separate the impacts of MJO and ENSO, at least over the western Indian Ocean the GPI anomalies are caused mainly by MJO, while the impact of ENSO can be greater than that of MJO over the southeastern Indian Ocean, which is adjacent to the Maritime Continent.
It is interesting to note again from
Table 1 that the years with a positive or a negative phase of IOD are clearly separated into the MJO active or the other years. There are four positive-phase IOD years among the 11 MJO active years, and three negative-phase IOD years among the other 22 years. The study, which investigated the influences of IOD on the TC activity over the north Indian Ocean [
20], showed that the frequency of TC occurrence over the north Indian Ocean is lower during the positive phases of IOD. This is because during the positive IOD phases, SST anomalies over the north Indian Ocean are warmer in the western part and colder in the eastern part, inducing anticyclonic circulation at lower levels and thus resulting in the reduction of TCG over the region. On the other hand, the study focusing on the TCG in the Bay of Bengal [
16] indicated that the TC frequency becomes higher during positive (negative) IOD phases in the southern (northern) Bay of Bengal. In this way, the TC activity in the Bay of Bengal demonstrates a contrasting feature depending on the location within the bay. From these studies, it is considered that the influences of IOD on TCG have a complicated nature.
The year 2011 is categorized as having a positive phase of IOD (
Table 1). This positive phase peaked in October, and quickly ended after October [
29]. However, positive SST anomalies in the Indian Ocean continued until December, when the phase of IOD became almost neutral [
29]. The continued positive SST anomalies during OND in 2011 can also be seen in
Figure 4a. Therefore, from a perspective of the averages during OND, the influences of IOD, because of its rapid weakening from October to December in 2011, may be obscured, while SST has an influence on the atmospheric condition through changing stability, which emerges as positive anomalies of MPI over the Indian Ocean (
Figure 3d).
The present analysis indicated that the number of TCG during OND in 2011 is higher than usual while this period is characterized with a positive IOD phase. This result seems to be inconsistent with the previous investigation that showed that the TCG frequency over the north Indian Ocean is lower during the positive phases of IOD [
20]. The seemingly contradicting results may depend on the specific time period of analysis interest. The present study focuses on the time period of OND in order to extract the effects of MJO on TCG. In other words, the time frame employed in our analysis is considered to diminish the effects of IOD. Considering the complicated nature of the IOD influences on TCG [
16,
20], the roles of IOD on TCG over the tropical Indian Ocean as a whole requires further analysis.
The other issue to be discussed here is the effects of the warming of the Indian Ocean. From the historical temperature data above 1000 m in the Indian Ocean after 1960, it was shown that SST increases across the Indian Ocean [
37]. It was found that the strongest warming occurs in the subtropical region at around 40°S–50°S, extending down to the 800-m depth, while the warming in the tropics is limited to the depth above the thermocline [
37]. From the review on Indian Ocean decadal variability [
38], the ocean heat content above the 700-m depth increases during the past five decades throughout in the Indian Ocean, with dominant contribution from the increase in the south Indian Ocean. It was also demonstrated that the observed trend of SST from 1950 to 2010 is about 0.1–0.2 °C per 10 years in the tropical Indian Ocean. Based on this estimate, the magnitude of the SST increase in the present analysis region from 1979 to 2011 is expected to be about 0.3–0.6 °C. In contrast to the observed increase in SST, the trend in the atmospheric circulation has uncertainties [
38], which makes it difficult to estimate the impact of the long-term trend on the present analysis.
Furthermore, the accuracy of the reanalysis data used here may not be adequate to elucidate the long-term trend of the atmospheric conditions. There are some uncertainties in describing the long-term trend of SST and atmospheric conditions with the JRA-25 reanalysis data, partly because of the accuracy of satellite data assimilated in the reanalysis [
22]. We consider that the use of the reanalysis data for showing climate trends requires caution, because the long-term trend embedded in the reanalysis data may include both actual climate signal and analysis accuracy. In spite of such possible deficiencies of the reanalysis data,
Figure 2a and
Figure 3 clearly show the enhanced anomalies of GPI and the contributing factors, compared to those averaged for the MJO active years (
Figure 2b and
Figure 5). Therefore, it is considered that the environmental conditions in 2011 have a pronounced feature for TCG, despite anticipated long-term trend in the atmospheric conditions.
5. Conclusions
The seasonal environmental characteristics for TCG in the Indian Ocean during October and December 2011, which corresponds to the period of the CINDY2011/DYNAMO field campaign, were diagnosed in terms of GPI, and were compared with those found in the MJO active years [
8] and in the La Niña phase. A 33-year reanalysis dataset, JRA-25, was used. The environment of 2011 is characterized by both an MJO active year and a La Niña year.
It was found that the spatial pattern of the GPI anomaly over the tropical Indian Ocean in 2011 from the 33-year climatological average is very similar to the feature in the MJO active years. The magnitude of the GPI anomaly in 2011 is more pronounced than that in the MJO active years. However, the GPI spatial pattern in 2011 is totally different from that in the La Niña years, although the GPI patterns in the Pacific seem to be similar between 2011 and the La Niña years.
The analyses on the contributions from each factor of GPI to the total GPI anomaly over the tropical Indian Ocean indicated that all the factors in GPI have influences on the positive anomalies of GPI over the tropical Indian Ocean in 2011. It was indicated that relative humidity, absolute vorticity, and vertical velocity contribute to generate positive GPI anomaly in 2011. The comparison of such contributions in 2011 with the MJO active years and La Niña years showed that the factors of relative humidity, absolute vorticity, MPI, and vertical velocity are more regulated by the MJO activity than the ENSO phase. Among the contributing factors in the GPI formulation, the contribution only from the shear factor in the 2011 case demonstrates a spatial feature very similar to the La Niña years. Therefore, it is suggested that ENSO influences appear only through the shear effect over the Indian Ocean in 2011, although they primarily appear in the environmental conditions over the Pacific.
Through the analysis with the tropical Indian Ocean divided into four sub-regions, it was suggested that the western Indian Ocean GPI anomalies are caused mainly by MJO, while the impact of ENSO can be greater than that of MJO over the southeastern Indian Ocean, which is near to the Maritime Continent. In other words, in the Indian Ocean domain, the amplitude of GPI is not necessarily larger in La Niña years than in the MJO active years.
Under the influences of active MJO events during the CINDY2011/DYNAMO period, the seasonal-mean environmental conditions for TCG over the Indian Ocean are determined more strongly by MJO than by ENSO, through modifications of relative humidity, absolute vorticity, and vertical velocity that are favorable for TCG. The seasonal environmental characteristics during the CINDY2011/DYNAMO period seem to be quite typical of the MJO active years. In such a case, the influences of ENSO would not appear in determining the environmental conditions for TCG over the Indian Ocean.
The present approach that examines the seasonal-mean environmental characteristics with an empirical index is useful in revealing the environmental conditions favorable for TCG as a seasonal basis. By comparing the present results with the study of TT14, we were able to clearly distinguish the seasonal environmental properties in 2011 from those in other MJO active years and El Niño/La Niña years.
The importance of relative humidity in regulating the development of tropical convection was also identified in numerical experiments of cumulus convection over the tropical ocean [
39,
40]. The present study demonstrated that the humidity control has also been identified for tropical cyclones over the Indian Ocean.


