
Rain, Rain, Go Away, Come Again Another Day. Weather Preferences of Summer Tourists in Mountain Environments


Abstract
:1. Introduction
2. Methods
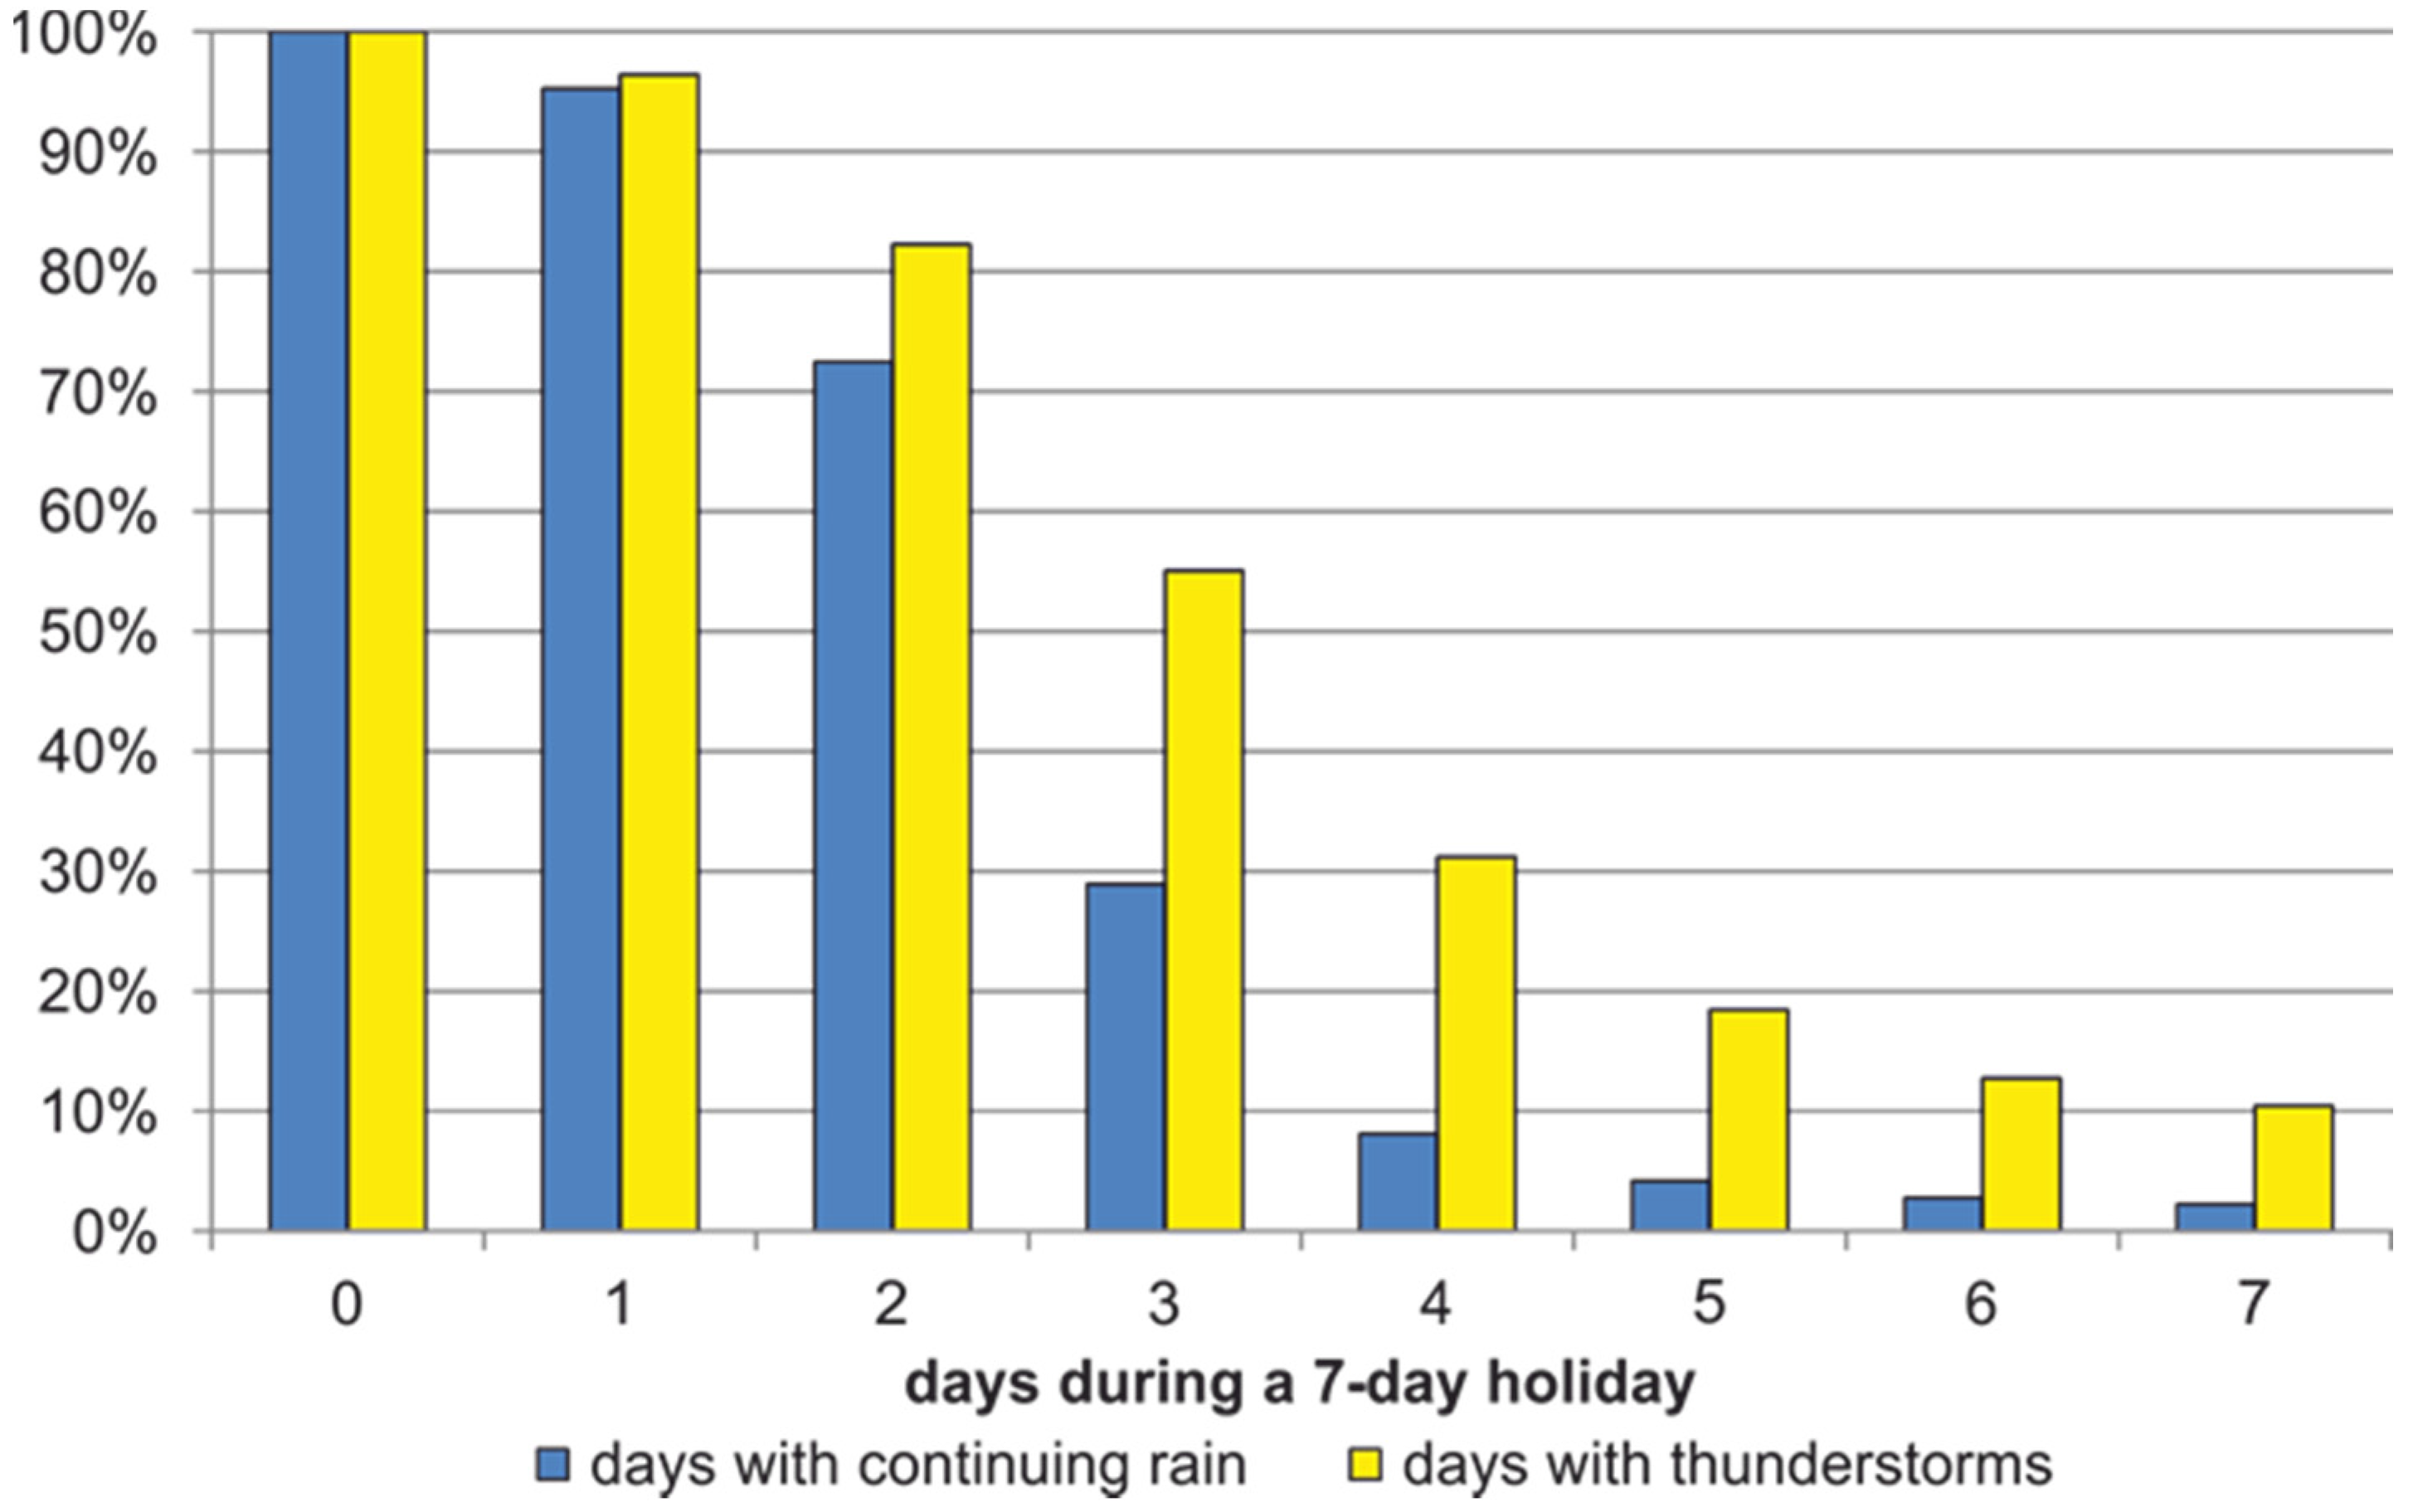
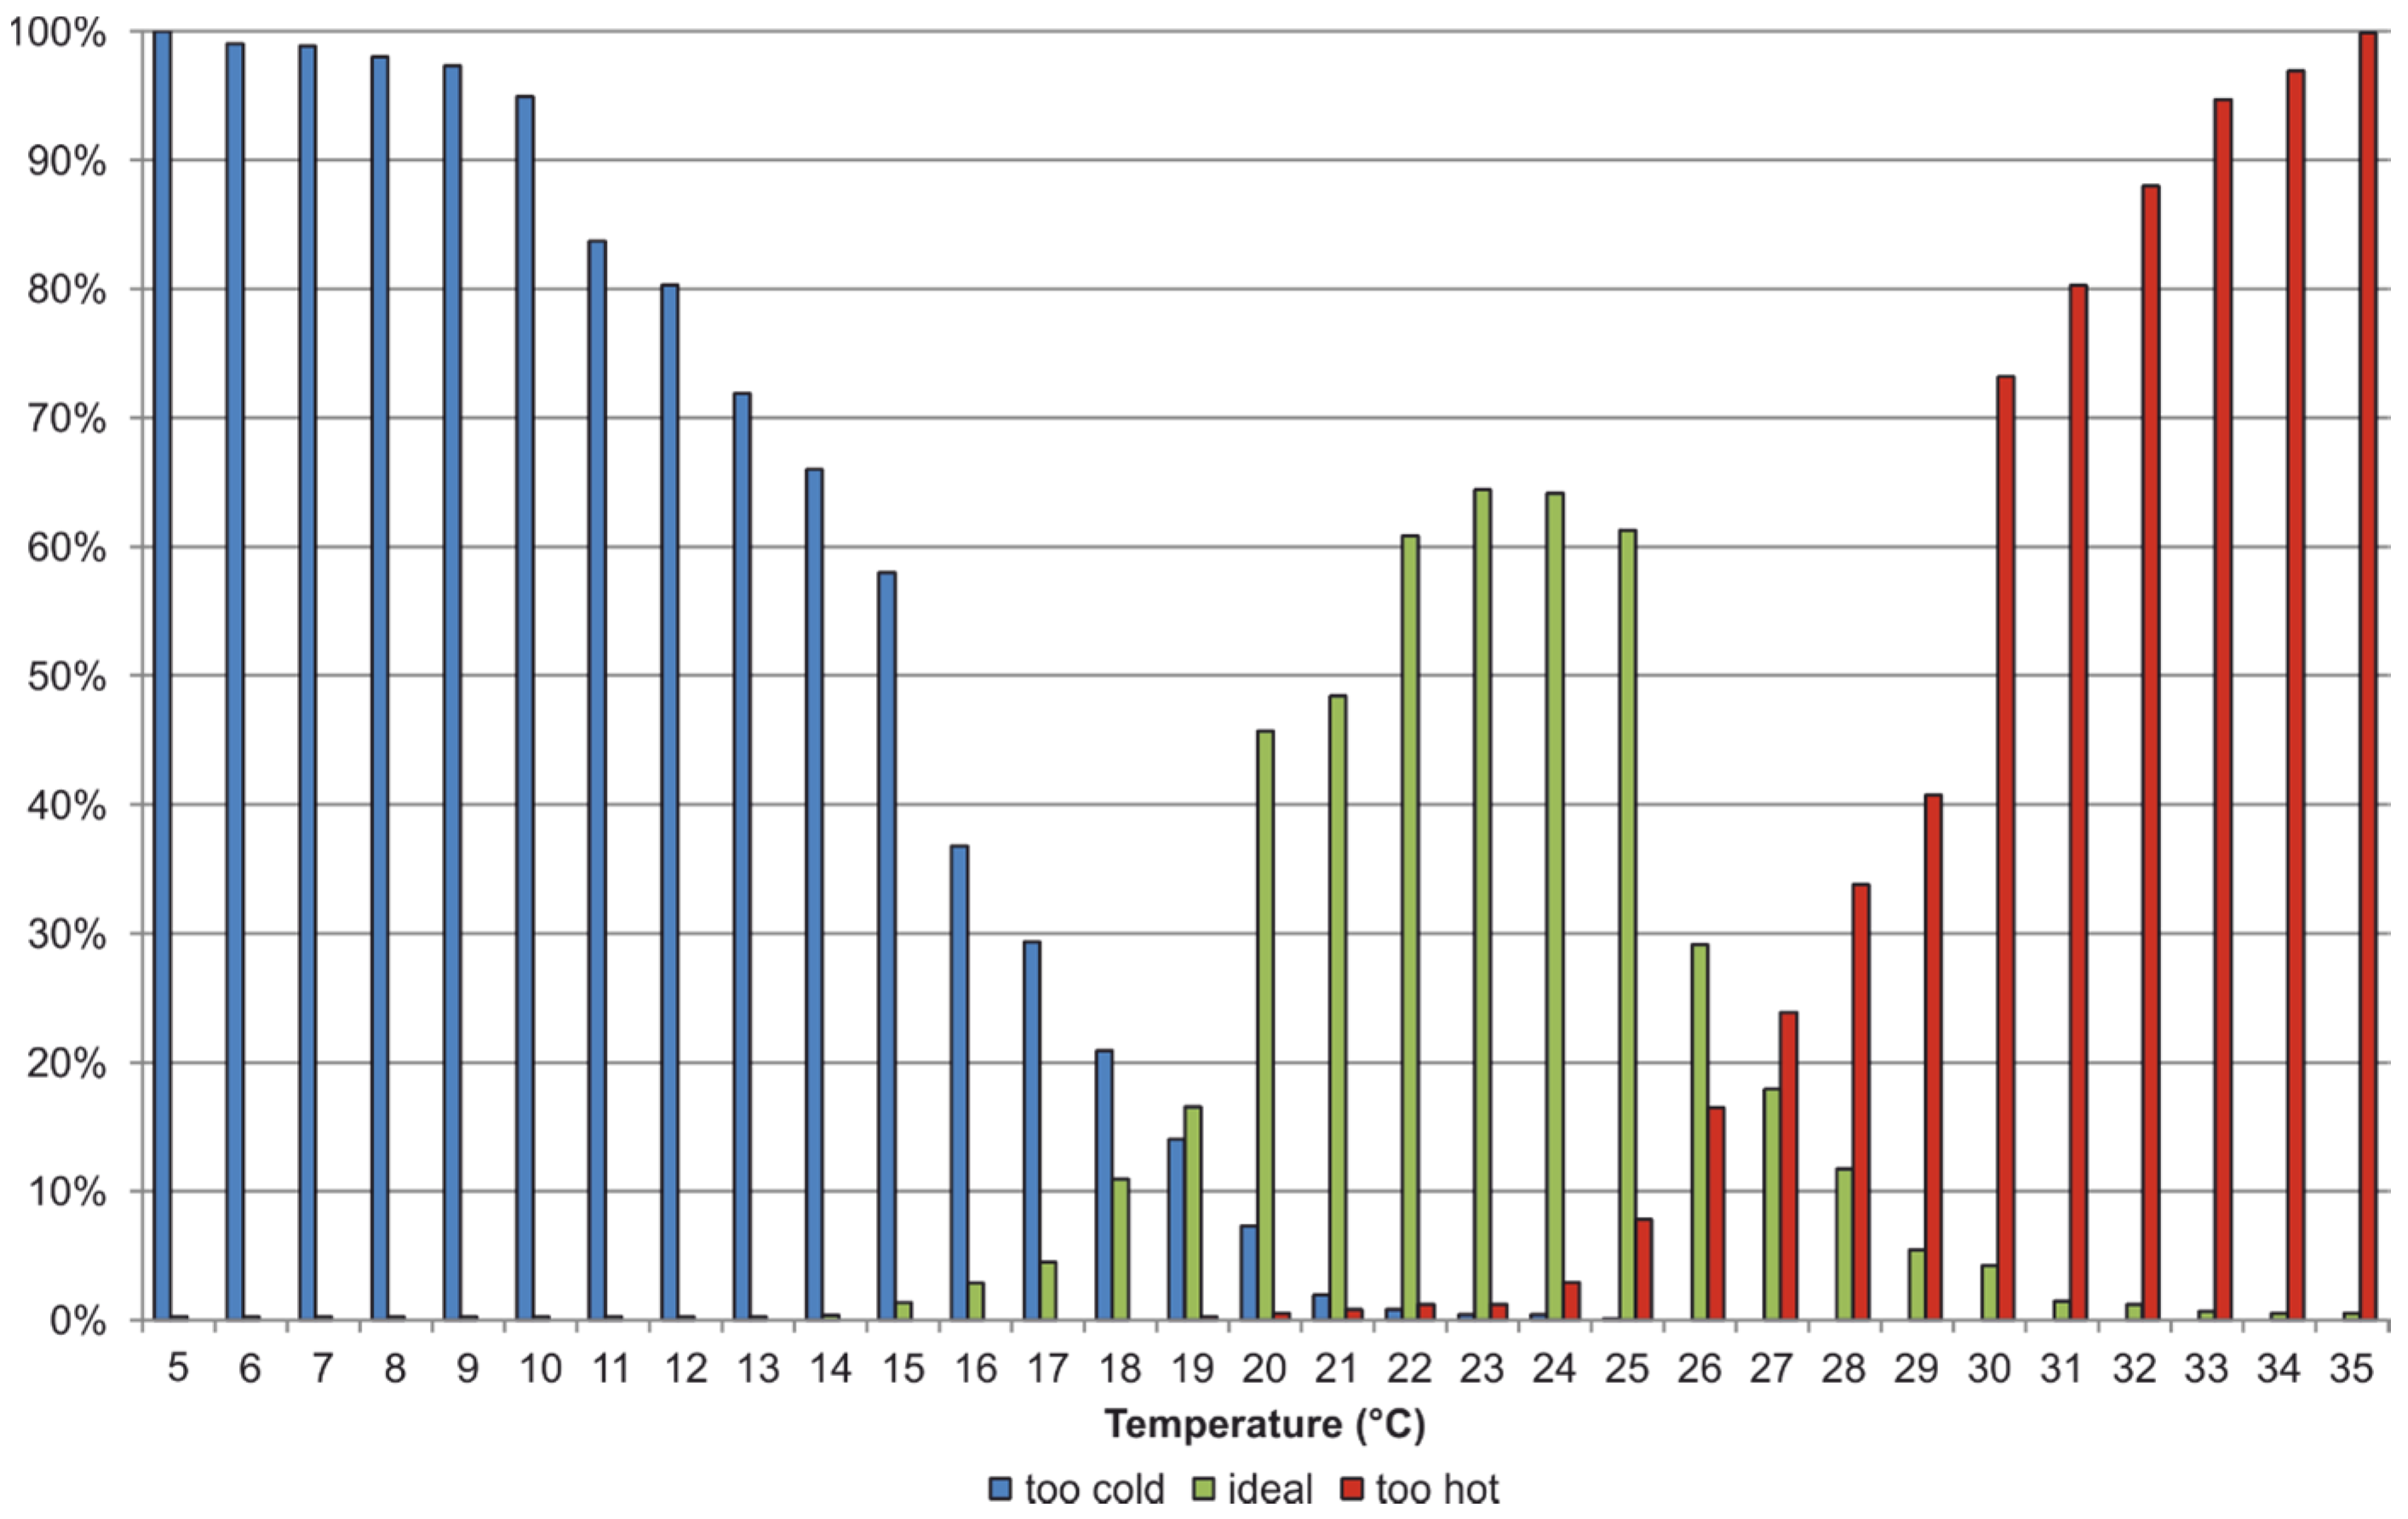
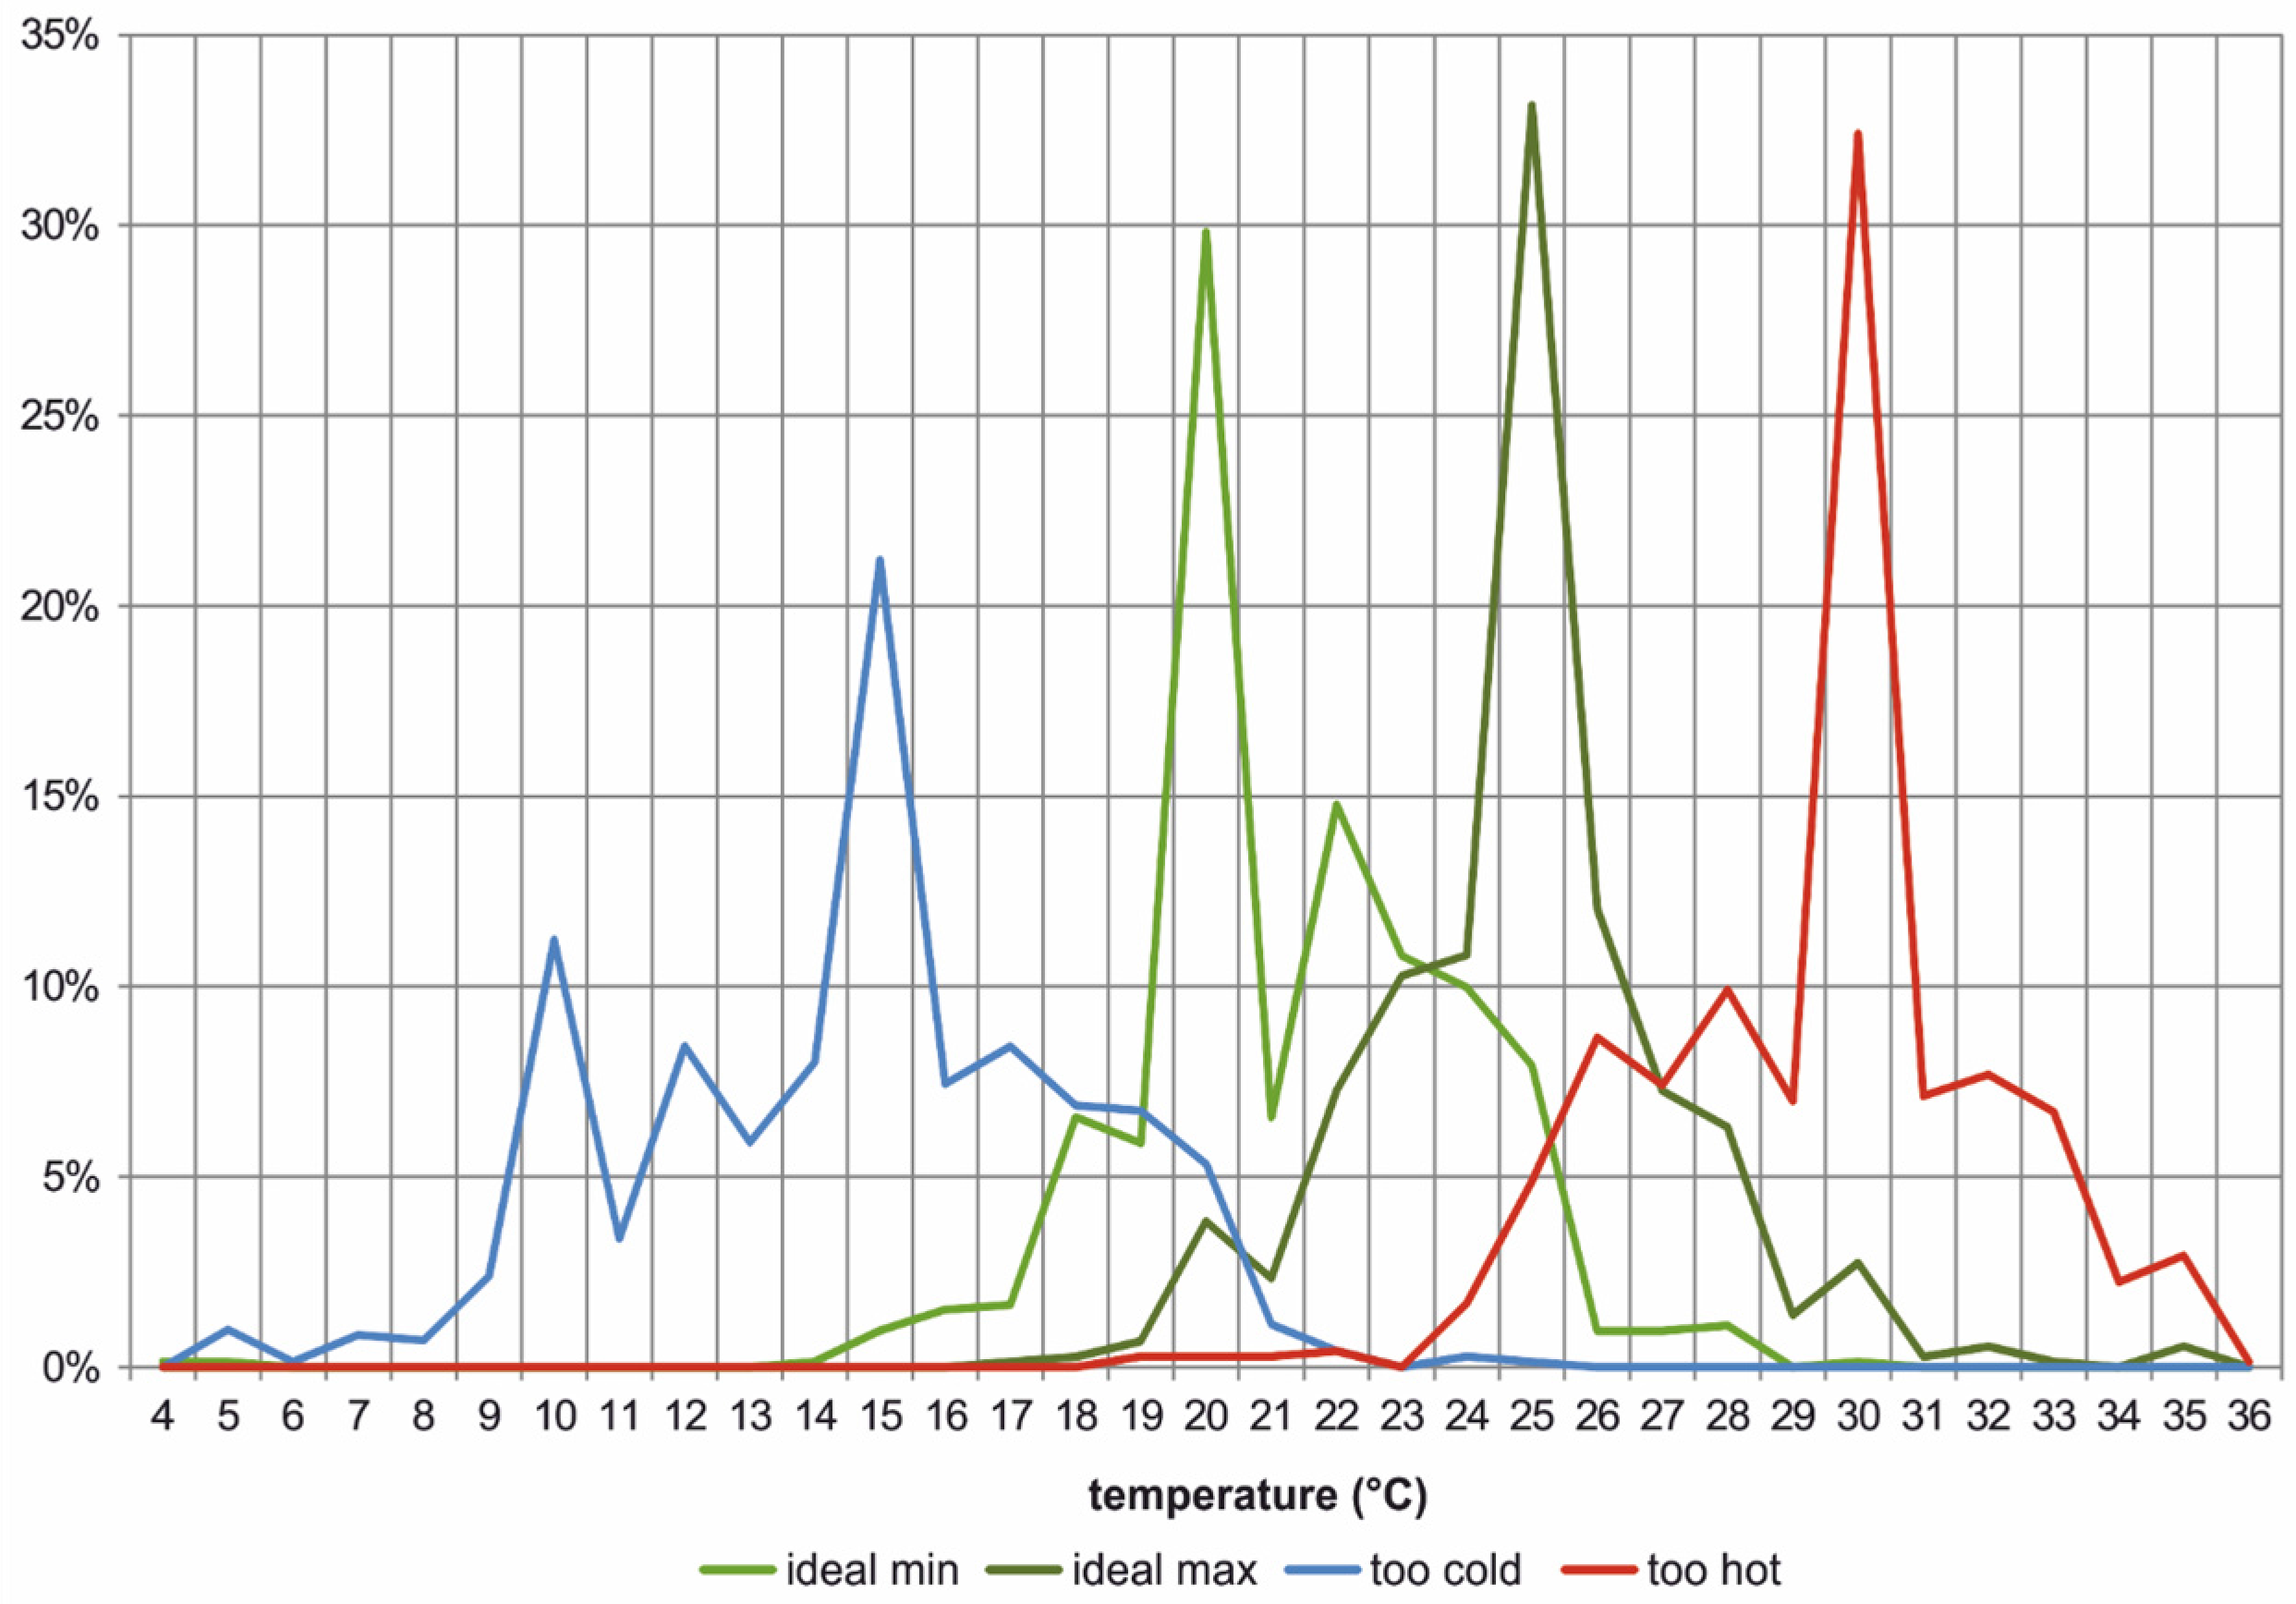
3. Results
4. Discussion
5. Conclusions
Acknowledgments
Author Contributions
Conflicts of Interest
Appendix

| Visitation | Age | Activities | Family Status | ||||||||||
|---|---|---|---|---|---|---|---|---|---|---|---|---|---|
| First-Time Visitor | Repeat Visitor | p-value | Younger Age Cohort (<65) | Older Age Cohort (65+) | p-value | Sports Activities | Non-Sports Activities | p-value | Without Children | With Children | p-value | ||
| Rating of weather variables (1 = not important; 5 = important) | no strong winds | 3.22 | 3.12 | 0.277 | 3.17 | 3.13 | 0.593 | 3.13 | 3.22 | 0.214 | 3.23 | 3.38 | 0.212 |
| little rain | 4.38 | 4.29 | 0.165 | 4.33 | 4.31 | 0.967 | 4.34 | 4.32 | 0.989 | 4.29 | 4.39 | 0.381 | |
| sunshine | 4.27 | 4.12 | 0.013 * | 4.18 | 4.25 | 0.354 | 4.14 | 4.27 | 0.027 * | 4.16 | 4.34 | 0.167 | |
| pleasant temperatures | 4.16 | 4.16 | 0.769 | 4.07 | 4.39 | 0.000 *** | 4.13 | 4.19 | 0.322 | 4.03 | 4.19 | 0.129 | |
| range of ideal temperature (°C) | lower threshold | 21.25 | 21.36 | 0.646 | 21.36 | 21.09 | 0.141 | 21.1 | 21.57 | 0.039 * | 21.05 | 21.92 | 0.002 *** |
| upper threshold | 24.87 | 24.88 | 0.634 | 25.05 | 24.39 | 0.003 ** | 24.76 | 25.03 | 0.509 | 24.82 | 25.69 | 0.006 *** | |
| unacceptable temperatures (°C) | too hot | 29.55 | 29.17 | 0.029 * | 29.55 | 28.85 | 0.001 *** | 29.47 | 29.24 | 0.457 | 29.52 | 30.27 | 0.024 ** |
| too cold | 14.78 | 14.41 | 0.112 | 14.75 | 14.3 | 0.087 | 14.35 | 14.92 | 0.013 * | 14.54 | 15.61 | 0.012 ** | |
| Acceptable number of rain days | continuous rain | 2.04 | 2.25 | 0.049 * | 2.13 | 2.19 | 0.913 | 2.1 | 2.18 | 0.324 | 1.97 | 2.15 | 0.043 * |
| thunderstorms | 2.92 | 3.22 | 0.046 * | 3.18 | 2.75 | 0.001 *** | 3.2 | 2.9 | 0.04 * | 2.88 | 3.23 | 0.171 | |
References
- Scott, D.; Hall, C.M.; Gössling, S. Tourism and Climate Change. Impacts, Adaptation & Mitigation; London and New York Routledge: London, UK, 2012. [Google Scholar]
- Gössling, S.; Abegg, B.; Steiger, R. “It was raining all the time!”: Ex post tourist weather perceptions. Atmosphere 2016, 7. [Google Scholar] [CrossRef]
- Amelung, B.; Viner, D. Mediterranean tourism: Exploring the future with the tourism climatic index. J. Sustain. Tour. 2006, 14, 349–366. [Google Scholar] [CrossRef]
- Amelung, B.; Nicholls, S. Implications of climate change for tourism in Australia. Tour. Manag. 2014, 41, 228–244. [Google Scholar] [CrossRef]
- Scott, D.; McBoyle, G.; Schwartzentruber, M. Climate change and the distribution of climatic resources for tourism in North America. Clim. Res. 2004, 27, 105–117. [Google Scholar] [CrossRef]
- Moreno, A.; Amelung, B. Climate Change and Tourist Comfort on Europe’s Beaches in Summer: A Reassessment. Coast. Manag. 2009, 37, 550–568. [Google Scholar] [CrossRef]
- Perch-Nielsen, S. The vulnerability of beach tourism to climate change—An index approach. Clim. Chang. 2010, 100, 579–606. [Google Scholar] [CrossRef]
- Mieczkowski, Z. The tourism climatic index: A method of evaluating world climates for tourism. Can. Geogr. 1985, 29, 220–233. [Google Scholar] [CrossRef]
- De Freitas, C.R.; Scott, D.; McBoyle, G. A second generation climate index for tourism (CIT): Specification and verification. Int. J. Biometeorol. 2008, 52, 399–407. [Google Scholar] [CrossRef] [PubMed]
- Scott, D.; Rutty, M.; Amelung, B. An Inter-Comparison of the Holiday Climate Index (HCI) and the Tourism Climate Index (TCI) in Europe 2016. Atmosphere 2016, submitted. [Google Scholar]
- Hamilton, J.M.; Maddison, D.J.; Tol, R.S.J. Effects of climate change on international tourism. Clim. Res. 2005, 29, 245–254. [Google Scholar] [CrossRef]
- Falk, M. A dynamic panel data analysis of snow depth and winter tourism. Tour. Manag. 2010, 31, 912–924. [Google Scholar] [CrossRef]
- Falk, M. Impact of weather conditions on tourism demand in the peak summer season over the last 50 years. Tour. Manag. Perspect. 2014, 9, 24–35. [Google Scholar] [CrossRef]
- Hamilton, J.M.; Tol, R.S.J. The impact of climate change on tourism in Germany, the UK and Ireland: A simulation study. Reg. Environ. Chang. 2007, 7, 161–172. [Google Scholar] [CrossRef] [Green Version]
- Töglhofer, C.; Eigner, F.; Prettenthaler, F. Climatic and economic impacts on tourism demand in Austrian ski areas. Clim. Res. 2011, 46, 1–14. [Google Scholar] [CrossRef]
- Köberl, J.; Prettenthaler, F.; Bird, D.N. Modelling climate change impacts on tourism demand: A comparative study from Sardinia (Italy) and Cap Bon (Tunisia). Sci. Total Environ. 2015, 1039–1053. [Google Scholar] [CrossRef] [PubMed]
- Scott, D.; Jones, B.; Konopek, J. Implications of climate and environmental change for nature-based tourism in the Canadian rocky mountains: A case study of Waterton Lakes National Park. Tour. Manag. 2007, 28, 570–579. [Google Scholar] [CrossRef]
- Scott, D.; Jones, B. The impact of climate change on golf participation in the Greater Toronto Area (GTA): A case study. J. Leis. Res. 2006, 38, 363–380. [Google Scholar]
- Falk, M. The demand for winter sports: Empirical evidence for the largest French ski-lift operator. Tour. Econ. 2015, 21, 561–580. [Google Scholar] [CrossRef]
- Shih, C.; Nicholls, S.; Holecek, D.F. Impact of weather on downhill ski lift ticket sales. J. Travel Res. 2009, 47, 359–372. [Google Scholar] [CrossRef]
- De Freitas, C.R. Weather and place-based human behavior: Recreational preferences and sensitivity. Int. J. Biometeorol. 2015, 59, 55–63. [Google Scholar] [CrossRef] [PubMed]
- De Freitas, C.R. Tourism climatology: Evaluating environmental information for decision making and business planning in the recreation and tourism sector. Int. J. Biometeorol. 2003, 48, 45–54. [Google Scholar] [CrossRef] [PubMed]
- Behringer, J.; Bürki, R.; Fuhrer, J. Participatory integrated assessment of adaptation to climate change in Alpine tourism and mountain agriculture. Integrat. Assess. 2000, 1, 331–338. [Google Scholar] [CrossRef]
- Dawson, J.; Scott, D.; Havitz, M. Skier demand and behavioural adaptation to climate change in the US Northeast. Leis./Loisir 2013, 37, 127–143. [Google Scholar] [CrossRef]
- Unbehaun, W.; Pröbstl, U.; Haider, W. Trends in winter sport tourism: Challenges for the future. Tour. Rev. 2008, 63, 36–47. [Google Scholar] [CrossRef]
- Rutty, M.; Scott, D.; Johnson, P.; Jover, E.; Pons, M.; Steiger, R. Behavioural adaptation of skiers to climatic variability and change in Ontario, Canada. J. Outdoor Recreat. Tour. 2015, 11, 13–21. [Google Scholar] [CrossRef]
- Rutty, M.; Scott, D.; Johnson, P.; Jover, E.; Pons, M.; Steiger, R. The geography of skier adaptation to adverse conditions in the Ontario ski market. Can. Geogr. 2015, 391–403. [Google Scholar] [CrossRef]
- Pröbstl-Haider, U.; Haider, W.; Wirth, V.; Beardmore, B. Will climate change increase the attractiveness of summer destinations in the European Alps? A survey of German tourists. J. Outdoor Recreat. Tour. 2015, 11, 44–57. [Google Scholar] [CrossRef]
- Rutty, M.; Scott, D. Will the Mediterranean Become “Too Hot” for Tourism? A Reassessment. Tour. Plan. Dev. 2010, 7, 267–281. [Google Scholar] [CrossRef]
- Gomez-Martin, B. Climate potential and tourist demand in Catalonia (Spain) during the summer season. Clim. Res. 2006, 32, 75–87. [Google Scholar] [CrossRef]
- De Freitas, C.R. Recreation climate assessment. Int. J. Climatol. 1990, 10, 89–103. [Google Scholar] [CrossRef]
- Mansfeld, Y.; Freundlich, A.; Kutiel, H. The relationship between weather conditions and tourists’ perception of comfort: The case of the winter sun resort of Eilat. Available online: http://www.urbanclimate.net/matzarakis/papers/Book_Nato.pdf (accessed on 28 April 2016).
- Moreno, A. Mediterranean tourism and climate change: A survey-based study. Tour. Hosp. Plan. Dev. 2010, 7, 253–265. [Google Scholar] [CrossRef]
- Wirth, K. Auswirkungen des Klimawandels auf den Tourismus im Mittelmeerraum: Prognosen anhand einer Umfrage in München. Master Thesis, Ludwig Maximilian Universität, München, Germany, 2010. [Google Scholar]
- Dubois, G.; Ceron, J.P.; van de Walle, I.; Picard, R. TEC, CREDOC. Climat, Météorologie et Fréquentation Touristique: Comportements et Stratégies des Touristes; Ministère de l’Écologie, de l’Énergie, du Développement durable et de la Mer: Paris, France, 2009. [Google Scholar]
- Scott, D.; Gössling, S.; de Freitas, C.R. Preferred climates for tourism: Case studies from Canada, New Zealand and Sweden. Clim. Res. 2008, 38, 61–73. [Google Scholar] [CrossRef]
- Hewer, M.J.; Scott, D.; Gough, W.A. Tourism climatology for camping: A case study of two Ontario parks (Canada). Theor. Appl. Climatol. 2015, 121, 401–411. [Google Scholar] [CrossRef]
- Denstadli, J.M.; Jacobsen, J.K.S.; Lohmann, M. Tourist perceptions of summer weather in Scandinavia. Ann. Tour. Res. 2011, 38, 920–940. [Google Scholar] [CrossRef]
- Rutty, M.; Scott, D. Differential climate preferences of international beach tourists. Clim. Res. 2013, 57, 259–269. [Google Scholar] [CrossRef]
- Rutty, M.; Scott, D. Comparison of climate preferences for domestic and international beach holidays: A case study of Canadian travelers. Atmosphere 2016, 7, 30. [Google Scholar] [CrossRef]
- Tegernseer Tal Tourismus. Der Tegernsee. In Die Urlaubsdestination in Oberbayern. Daten und Zahlen zum Tourismus am Tegernsee 2013; Tegernseer Tal Tourismus: Tegernsee, Germany, 2014. [Google Scholar]
- Kovats, R.S.; Kristie, L.E. Heatwaves and public health in Europe. Eur. J. Publ. Health 2006, 16, 592–599. [Google Scholar] [CrossRef] [PubMed]
- Scott, D.; Lemieux, C. Weather and Climate Information for Tourism. Procedia. Environ. Sci. 2010, 1, 146–183. [Google Scholar] [CrossRef]
- Serquet, G.; Rebetez, M. Relationship between tourism demand in the Swiss Alps and hot summer air temperatures associated with climate change. Clim. Chang. 2011, 108, 291–300. [Google Scholar] [CrossRef]


| Specification | This Survey |
|---|---|
| Type of survey | In-situ survey (questionnaires) with German speaking tourists (=a stay of at least 1 night) |
| Place | Touristic points of interest in ten municipalities in the district of “Miesbach” (Bavarian Alps, Southern Germany) |
| Time of survey | 25–29 August 2014 |
| Duration of survey | Approximately 10 min |
| Valid questionnaires | n = 733 |
| Data scale used for weather preferences | Ordinal (5-point Likert scale) and metric |
| Factors | Chosen as | Sum | ||
|---|---|---|---|---|
| Main Reason | Second Most Important Reason | Third Most Important Reason | ||
| Attractive landscape | 65.4% | 18.9% | 6.0% | 90.3% |
| Good accessibility | 10.8% | 16.0% | 13.3% | 40.1% |
| Culture | 4.7% | 17.8% | 16.3% | 38.8% |
| Variety of leisure activities | 5.2% | 13.1% | 14.5% | 32.8% |
| Pleasant climate | 4.0% | 16.6% | 8.0% | 28.6% |
| Price | 0.9% | 3.4% | 5.1% | 9.4% |
| Other | 9.0% | 5.6% | 8.3% | 22.9% |
| Weather Aspect | Mean Value (5-Likert Scale) | Standard Deviation |
|---|---|---|
| Little rain | 4.33 | 0.948 |
| Sunshine | 4.20 | 0.954 |
| Pleasant temperatures | 4.16 | 0.964 |
| No strong winds | 3.17 | 1.237 |
| Scott et al. (2008) [36] | Dubois et al. (2009) [35] | This Study | |
|---|---|---|---|
| Ranking of weather parameters | (1) rain (2) temperature (3) sunshine (4) wind | (1) rain (2) temperature (3) sunshine (4) wind | (1) rain (2) sunshine (3) temperature (4) wind |
| Ideal sky conditions | 25% cloud cover | not asked | Slightly cloudy |
| Ideal temperature | 20.5 °C | not asked | 21–25 °C |
| Temperature thresholds (too cold/too hot) | not asked | 9 °C a/30 °C | 15 °C/30 °C |
| Number of acceptable days with rain (mean) | not asked | not asked | 2.1 days (cont. rain) 3.1 days (thunderstorm showers) |
| Sample | Ex-situ, convenience sample (students), n = 831 | Ex-situ, Internet-User, n = 230 (mountain tourists) | In-situ, overnight guests, n = 733 |
© 2016 by the authors; licensee MDPI, Basel, Switzerland. This article is an open access article distributed under the terms and conditions of the Creative Commons Attribution (CC-BY) license (http://creativecommons.org/licenses/by/4.0/).
Share and Cite
Steiger, R.; Abegg, B.; Jänicke, L. Rain, Rain, Go Away, Come Again Another Day. Weather Preferences of Summer Tourists in Mountain Environments. Atmosphere 2016, 7, 63. https://doi.org/10.3390/atmos7050063
Steiger R, Abegg B, Jänicke L. Rain, Rain, Go Away, Come Again Another Day. Weather Preferences of Summer Tourists in Mountain Environments. Atmosphere. 2016; 7(5):63. https://doi.org/10.3390/atmos7050063
Chicago/Turabian StyleSteiger, Robert, Bruno Abegg, and Leandra Jänicke. 2016. "Rain, Rain, Go Away, Come Again Another Day. Weather Preferences of Summer Tourists in Mountain Environments" Atmosphere 7, no. 5: 63. https://doi.org/10.3390/atmos7050063