Article

Factors Controlling the Variation of Aerosol Surface Area Concentrations Measured by a Diffusion Charger in Fukuoka, Japan

1
Faculty of Science and Technology, Keio University, 3-14-1 Hiyoshi, Kohoku-ku, Yokohama 223-8522, Japan
2
Atmospheric Environment Research Group, National Institute of Advanced Industrial Science and Technology, Tsukuba, Ibaraki 305-8569, Japan
3
Center for Regional Environmental Research, National Institute for Environmental Studies, Tsukuba, Ibaraki 305-8506, Japan
4
Tokyo Dylec Corp., Shinjuku, Tokyo 160-0014, Japan
5
Faculty of Science, Fukuoka University, Fukuoka 814-0180, Japan
*
Author to whom correspondence should be addressed.
Atmosphere 2016, 7(3), 33; https://doi.org/10.3390/atmos7030033
Submission received: 29 January 2016 / Revised: 9 February 2016 / Accepted: 17 February 2016 / Published: 26 February 2016
(This article belongs to the Special Issue Air Pollution in the Asia-Pacific Region)

Abstract

:
The surface area of ambient aerosols can be considered as an index of toxicity because an increased surface area may be able to act as a catalyst for specific reactions between particles and cells, as well as a carrier for co-pollutants, such as gases and chemicals. The aerosol surface area concentration was measured together with black carbon (BC) and other chemical species such as organic compounds, sulfate, and nitrate in Fukuoka, Japan, and the effect of the chemical composition of aerosols on their surface area was investigated. Aerosol surface area concentration was highly correlated with BC concentration for the entire period. Day-of-week variation and diurnal variation also showed the strong correlation between aerosol surface area and BC. This implies that even though BC accounts for relatively small percentage (in this study, 3.5%) of PM2.5 mass, it should receive considerable attention when aerosol surface area is considered as an index of adverse health effects caused by exposure of the human body to aerosols. Sulfate aerosol does not usually affect aerosol surface area in Fukuoka, but it may occasionally have a significant effect when the airmass contains an excess amount of relatively smaller particles of sulfate derived from volcanic SO2.

1. Introduction

A large number of studies are currently being conducted, or are planned for the future, that are directed toward understanding the effects of exposure to atmospheric aerosols on human health. This is based on the worldwide acknowledgement that these aerosols are potentially hazardous to humans [1,2,3]. In particular, ultrafine particles with diameters below 100 nm (nanoparticles) are considered to have a much stronger toxicity than larger particles [4,5,6]. Experimental studies in rats have shown that equivalent mass doses of ultrafine particles are more potent than large particles of similar chemical composition in causing pulmonary inflammation and lung tumors [6,7]. Numerous researchers conducting particle exposure experiments on rats or mice have proposed that surface area is a more appropriate indicator than mass for evaluating pulmonary inflammatory responses caused by exposure to manufactured nanomaterials, such as TiO2, fullerenes, and carbon nanotubes [8,9,10]. The surface area of ambient aerosols can also be considered as an index of toxicity because an increased surface area may be able to act as a catalyst for specific reactions between particles and cells, as well as a carrier for co-pollutants, such as gases and chemicals [11,12].
The most common method used for measuring the specific surface area of particles (given surface area values per unit mass), particularly in the field of material science, is the Brunauer–Emmett–Teller (BET) method [13]. The relationship between the specific surface area of manufactured nanomaterials and toxicity caused by exposure to these materials has been discussed on the basis of specific surface area values measured using the BET method [8,9,10]. However, it is difficult to experimentally measure the actual surface area of atmospheric aerosol particles due to limitation of aerosol sample amount that can be collected by ordinary sampling methods [14,15,16].
Other surface area measurement methods that have a much higher time resolution than the BET method are needed for practical and continuous measurement of ambient aerosol surface area. Recently, a nanoparticle surface area monitor (NSAM) was developed for continuous particle surface area concentration measurement, using the diffusion charging method [16,17,18,19,20]. The concept of NSAM is that the particle surface area is proportional to the charge of particles that are forced to be charged by certain types of chargers [19]. The NSAM has a mixing chamber where particles are mixed with positive ions emitted by a corona discharge. Positively charged particles are collected by a conductive filter, then the current is measured using an electrometer connected to a sensitive amplifier. Excess ions are removed by an ion trap before they reach the conductive filter. The actual NSAM output is the lung-deposited surface area (LDSA) concentration of particles. The NSAM can be reliably used to supply information on the LDSA of ultrafine particles, especially for the size range of nanoparticles between 20 nm and 400 nm [21,22].
The NSAM has also been applied to measure the ambient aerosol surface area concentration, which can be converted from the LDSA [16,23,24,25]. According to these previous studies, aerosol surface area concentration was closely correlated with the concentrations of black carbon (BC) and BC-like particulate forms of polycyclic aromatic hydrocarbons (pPAHs). These findings are considered to be realistic because BC (or BC-like) particles are usually submicron agglomerates consisting of primary soot particles with diameters in the range of tens of nanometers [23,26]. However, how chemical species other than BC contribute to the variation in ambient aerosol surface area concentration is still open for further discussion. In this study, the aerosol surface area concentration was measured together with BC and other chemical species such as organic compounds, sulfate, and nitrate, and the effect of the chemical composition of aerosols on their surface area was investigated.

2. Experiments

2.1. Monitoring Period and Site

Monitoring for this study spanned the period from 11 March to 29 April 2015. The monitoring site was the fourth floor of a building of the Fukuoka Institute for Atmospheric Environment and Health (33.55°N, 130.36°E) at Fukuoka University, Japan [27,28]. Fukuoka University is in a residential area, located at a distance of 5 km from the downtown area, and the site is several hundred meters away from a city highway. Fukuoka city has a population of approximately 1.5 million and is one of the largest cities in northern Kyushu, Japan, which faces the Asian continent. Aerosols in Fukuoka are transported from the Asian continent, as well as local area; therefore, this site is suitable to find the differences in the aerosol surface area as well as their chemical compositions along with aerosol sources. Previous studies have shown that variation in PM2.5 concentration around this site was significantly affected by long-range transport of aerosols from the Asian continent [27,29].

2.2. Aerosol Surface Area

A nanoparticle surface area monitor (NSAM, Model 3550, TSI Inc., MN, USA) was used to measure surface area concentration using the diffusion charging method. The flow rate of the NSAM was 2.5 L/min, and time resolution was set to 10 min in this study. The NSAM had a cyclone with a 50% cut-off of 1 μm at the inlet; thus, the surface area concentration of PM1.0 is actually measured by the NSAM. Aerosol surface area was converted from the LDSA (the actual NSAM reading). The procedure of the conversion from LDSA to aerosol surface area has been described elsewhere [16], and is briefly summarized in the following. The NSAM calibration constant is determined by passing the monodispersed aerosol simultaneously through the scanning mobility particle sizer (SMPS) and the NSAM. Specifically, the total surface area of the 80-nm NaCl particles determined by the SMPS is multiplied by the lung deposition efficiency of 80-nm particles determined by the lung deposition curve for a reference worker reported by the ICRP [30]. In this study, we measured the tracheobronchial deposited surface area values using the NSAM, and then converted them into aerosol surface area by dividing by the ICRP deposition efficiency of 80-nm particles.

2.3. Aerosol Chemical Composition, Number and Mass Concentration, and Sulfur Dioxide Concentration

An aethalometer (AE-16U, Magee Scientific Corp., CA, USA) was used for measuring the BC mass concentration in PM2.5 [29]. A Sharp-Cut Cyclone SCC1.829 (BGI Inc., NJ, USA) was used as PM2.5 inlet. The BC concentration is estimated on the basis of the absorption rate of incident light caused by BC. Generally, the BC concentration measured using an aethalometer will show reasonable agreement with elemental carbon measured using the thermal-optical method [31,32]. The wavelength of the incident light used in the aethalometer was 880 nm. The flow rate of the aethalometer was 5.0 L/min, and the time resolution was set to 15 min in this study.
The chemical composition of the aerosols (PM1.0) was measured and analyzed using a quadrupole-type aerosol mass spectrometer (Q-AMS, Aerodyne Research, Inc., MA, USA) [28]. A detailed description of the Q-AMS can be found elsewhere [33,34,35,36,37,38,39]. A brief introduction is as follows. Ambient aerosol particles are introduced through an aerodynamic lens to form a particle beam that eventually reaches the vaporizer where the temperature is set to 873 K (600 °C). Non-refractory species of aerosols are vaporized at the vaporizer. The vaporized molecules are ionized by electron impact ionization at 70 eV, and then the ions are analyzed by the quadrupole mass spectrometer. The sulfate, nitrate, ammonium, and chloride content are calculated from the fragment signals of the mass spectra. Organic compounds (organics) are calculated by subtracting the known inorganic and gaseous species (e.g., sulfate, nitrate, nitrogen, oxygen, and argon) from the total mass. The particle mass was calibrated using ammonium nitrate (NH4NO3) particles [33]. The ionization efficiency (IE), and the relative ionization efficiency (RIE), were determined for NH4NO3 particles with a diameter of 350 nm using standard procedures [33,34,35,36,37,38,39]. The IE used here was 4.77 × 10⁻⁷, and the RIE for NH4+ was 6.7. The collection efficiency (CE) for all the measured species was 0.5, which is a standard value for the AMS [38]. The size distributions for each chemical component (chemically-resolved size-distribution) were measured by Q-AMS using the flight time of the particle. The conversion factor from flight time of the particle to the vacuum aerodynamic diameter was calibrated using the known size of polystyrene latex and NH4NO3 particles [33,34,35,36,38]. The AMS data were analyzed using the standard AMS analysis software [38,40]. The flow rate of sampling line was 3 L/min, and time resolution was set to 10 min in this study.
The number concentrations and size distributions of aerosol particles were monitored using an optical particle counter (OPC, TD100; Sigma Tech., Yokohama, Japan) with measurable size ranges of optical equivalent diameter >0.3, >0.5, >1.0, >2.0, >3.0, and >5.0 µm. The OPC was installed on the rooftop of the same building that the other instruments were installed, and operated in ambient conditions without using a heating drier. Size discriminator of the OPC was calibrated using polystyrene latex spheres with a refractive index of 1.59–0i. The OPC data were corrected for coincidence loss. The flow rate of the OPC was 1.0 L/min, and the time resolution was set to 1 min in this study.
PM2.5 mass and sulfur dioxide concentration data were obtained from websites operated by local governmental offices [41,42].
Time resolutions varied among these instruments or obtained data. The 1-h average values were used for further analyses in this study. All times were expressed in the local time (JST, UTC + 9 h).

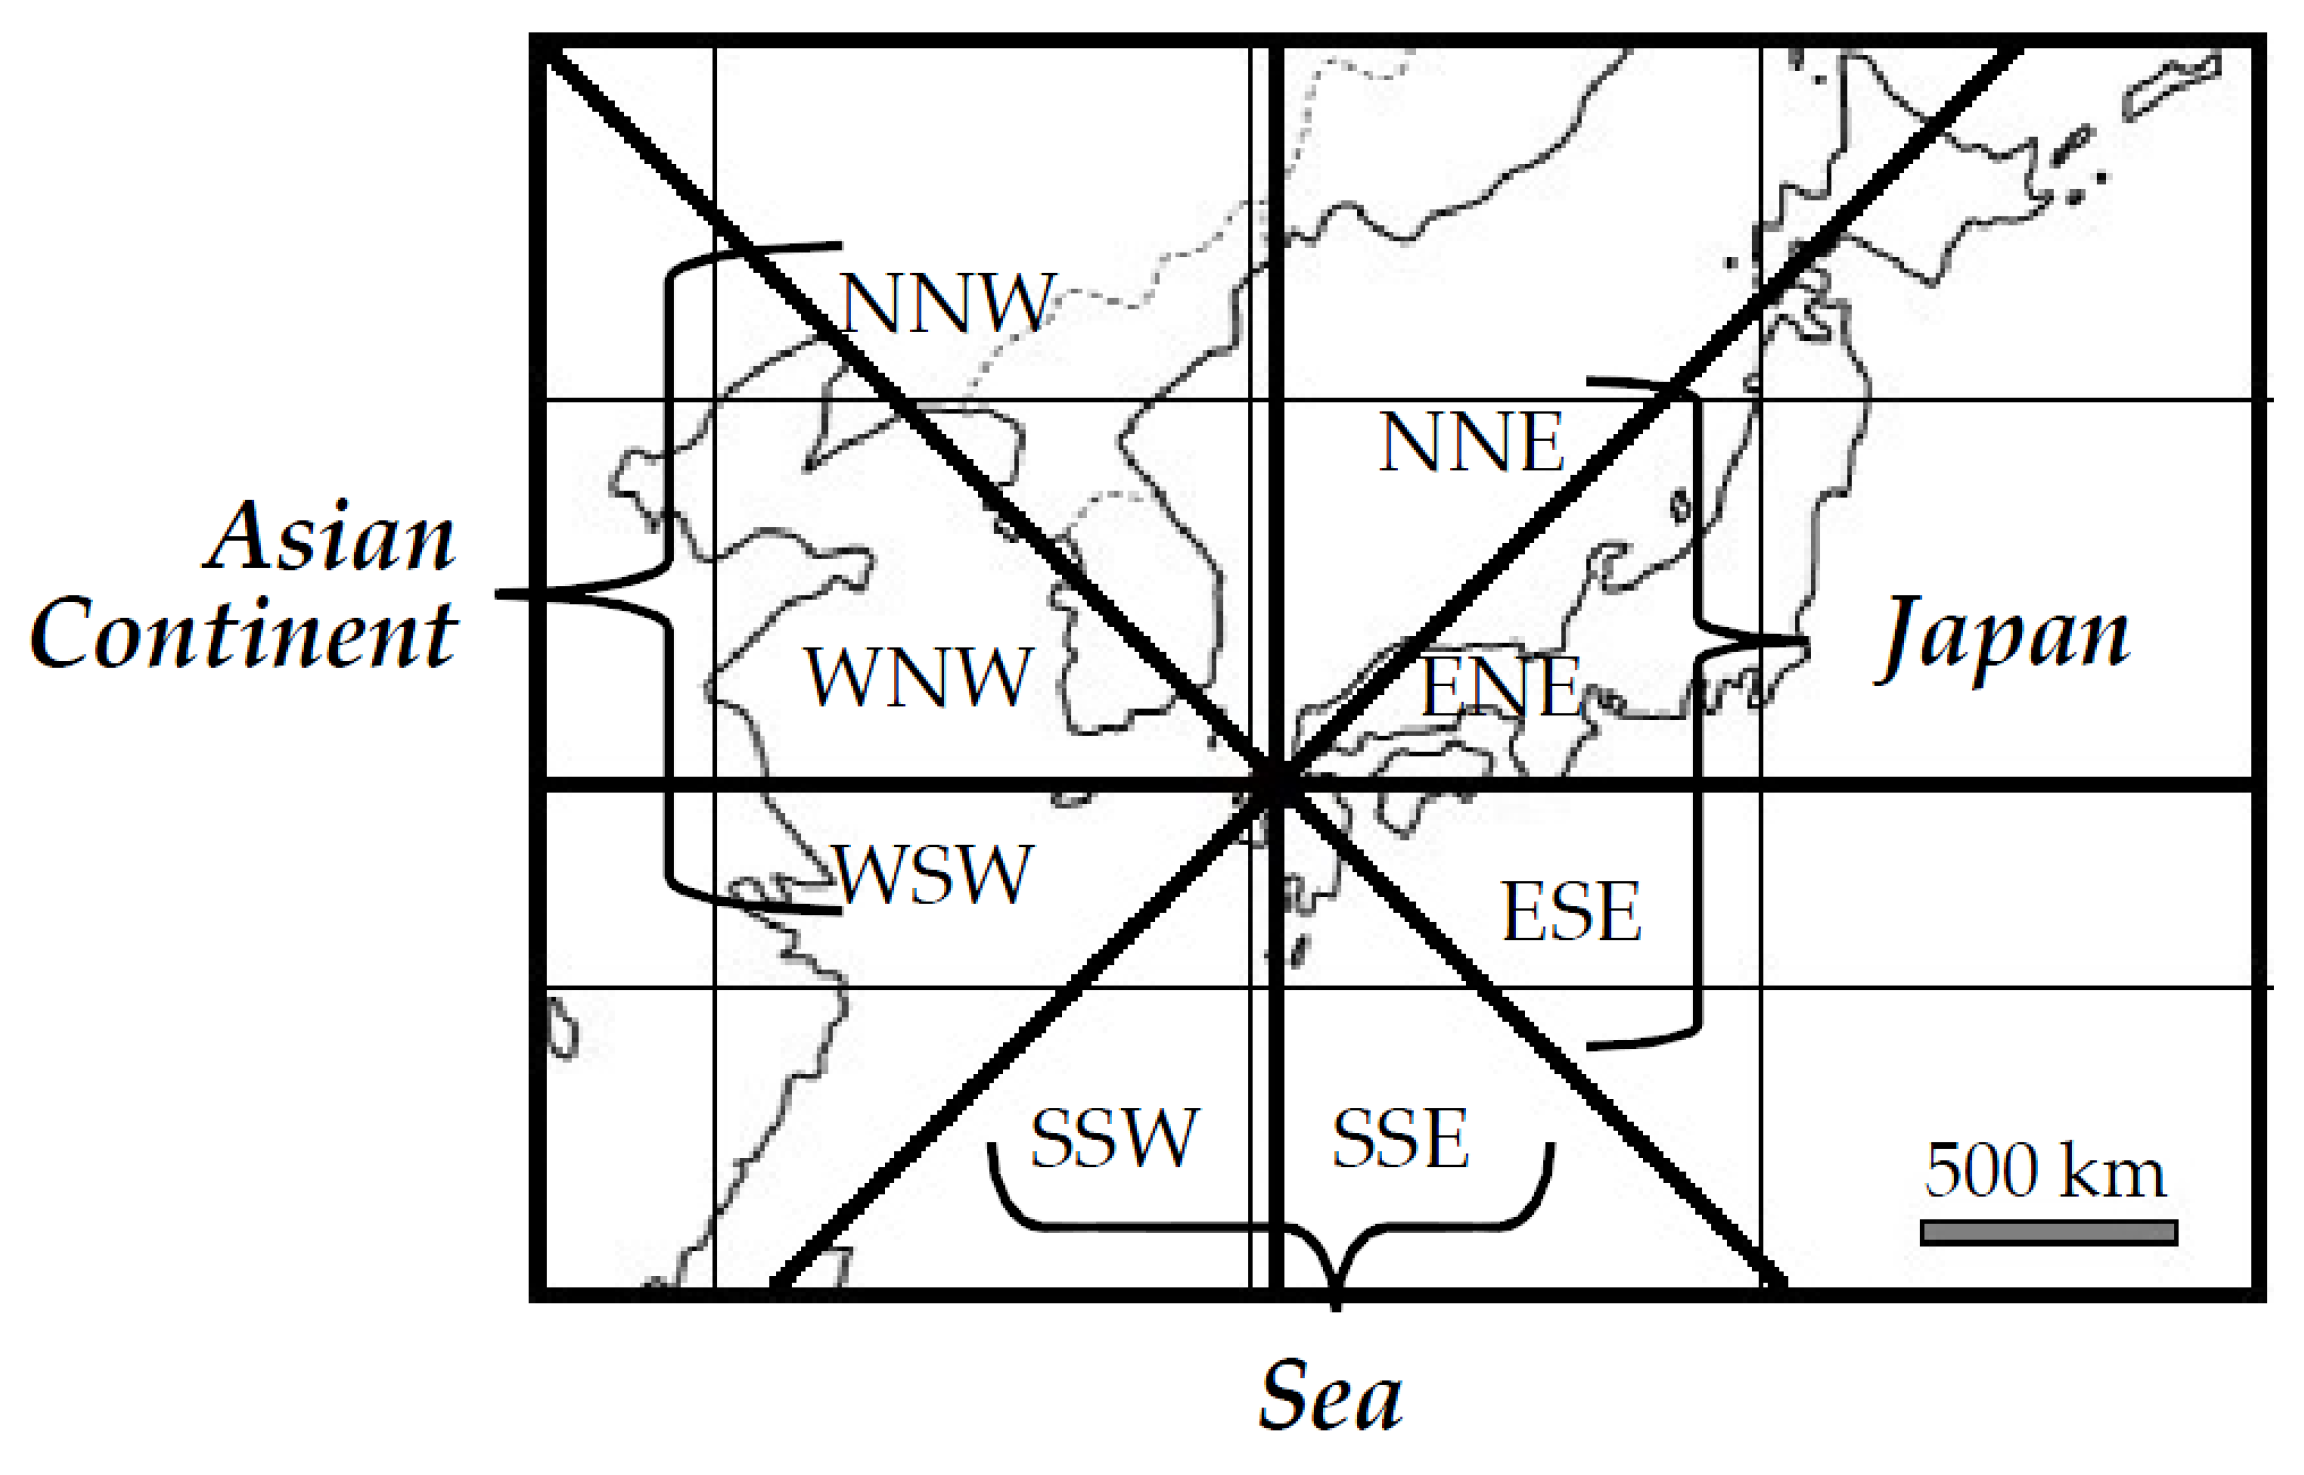
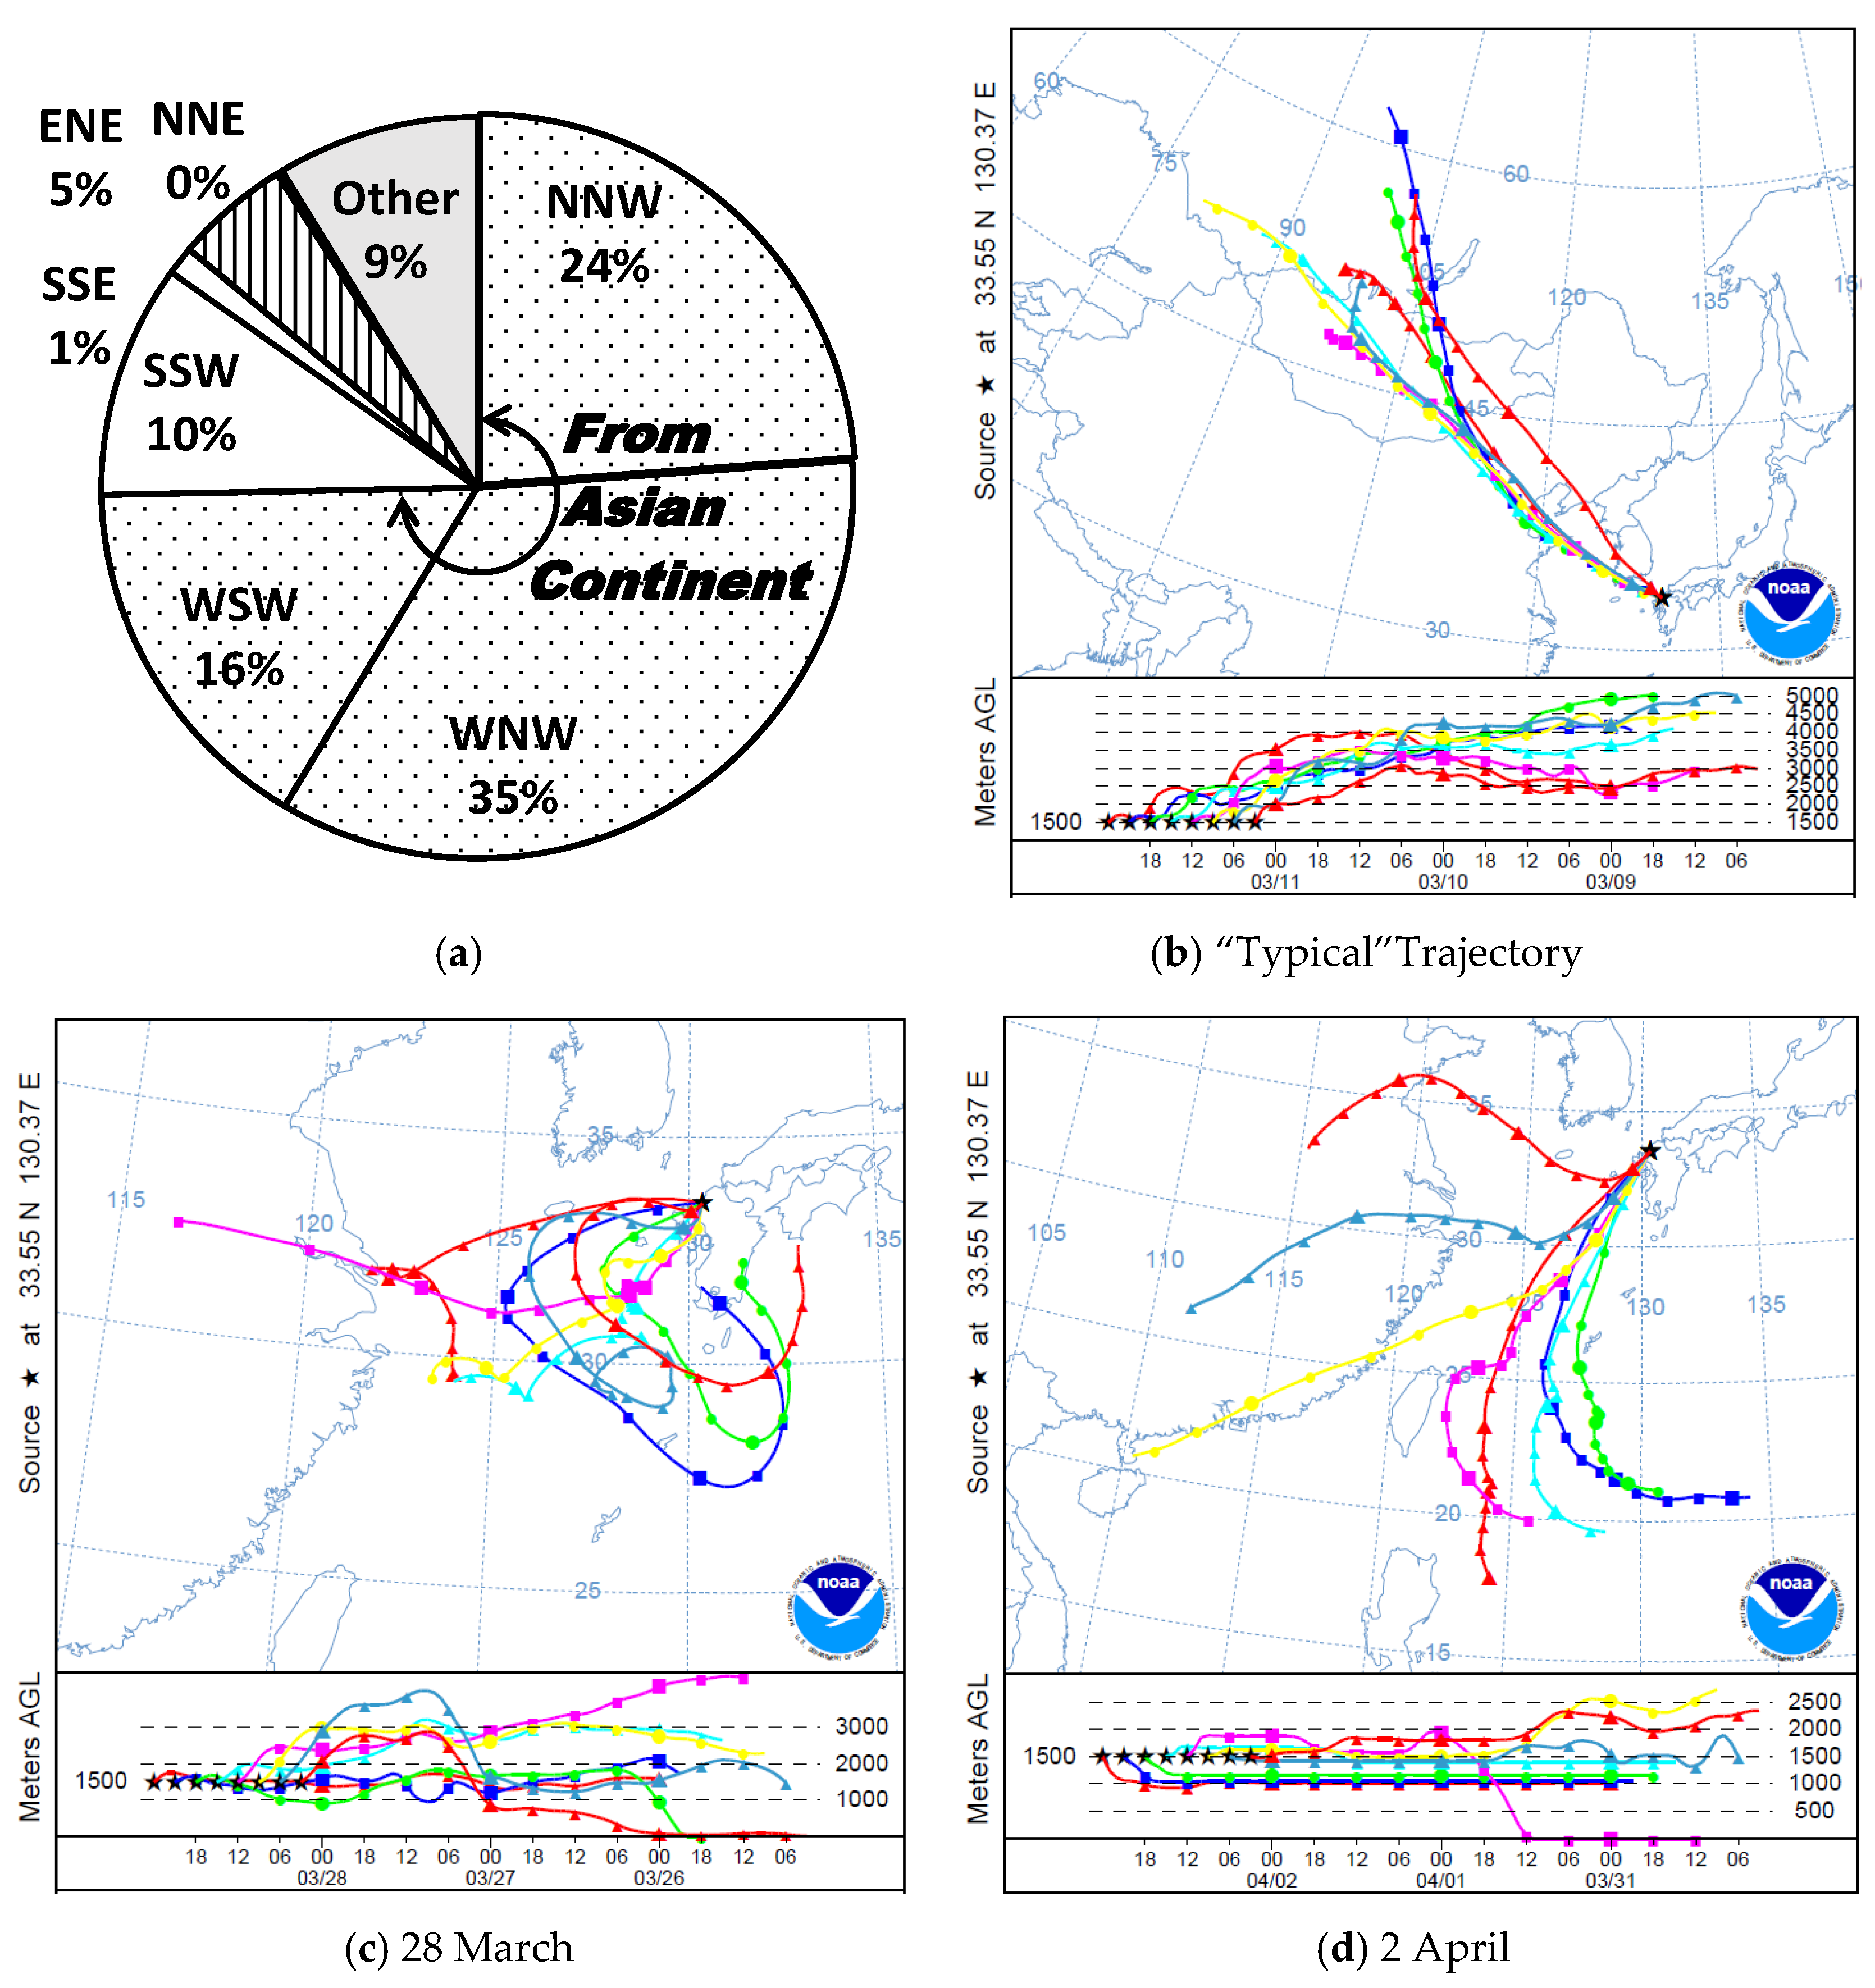
2.4. Airmass Backward Trajectory Analysis

Airmass backward trajectories were calculated for each day during the measurement campaign using the NOAA HYSPLIT model [43,44]. The trajectories were calculated based on the following conditions: start latitude and longitude: 33.55°N, 130.36°E; start altitude: 1500 m above sea level; calculation time: 72 h (three days). The trajectories were allocated to a 45° sector if the trajectory positions for every six hours were within the sector at least 50% of the time (36 h) and if the trajectory positions were within the other sectors less than 33% of the time (24 h). We considered the north-northeast (NNE), ENE, and ESE sectors as “Japan”, SSE and SSW sectors as “Sea”, and the remaining (WSW, WNW and NNW) sectors as “Asian Continent” (Figure 1).

3. Results and Discussion

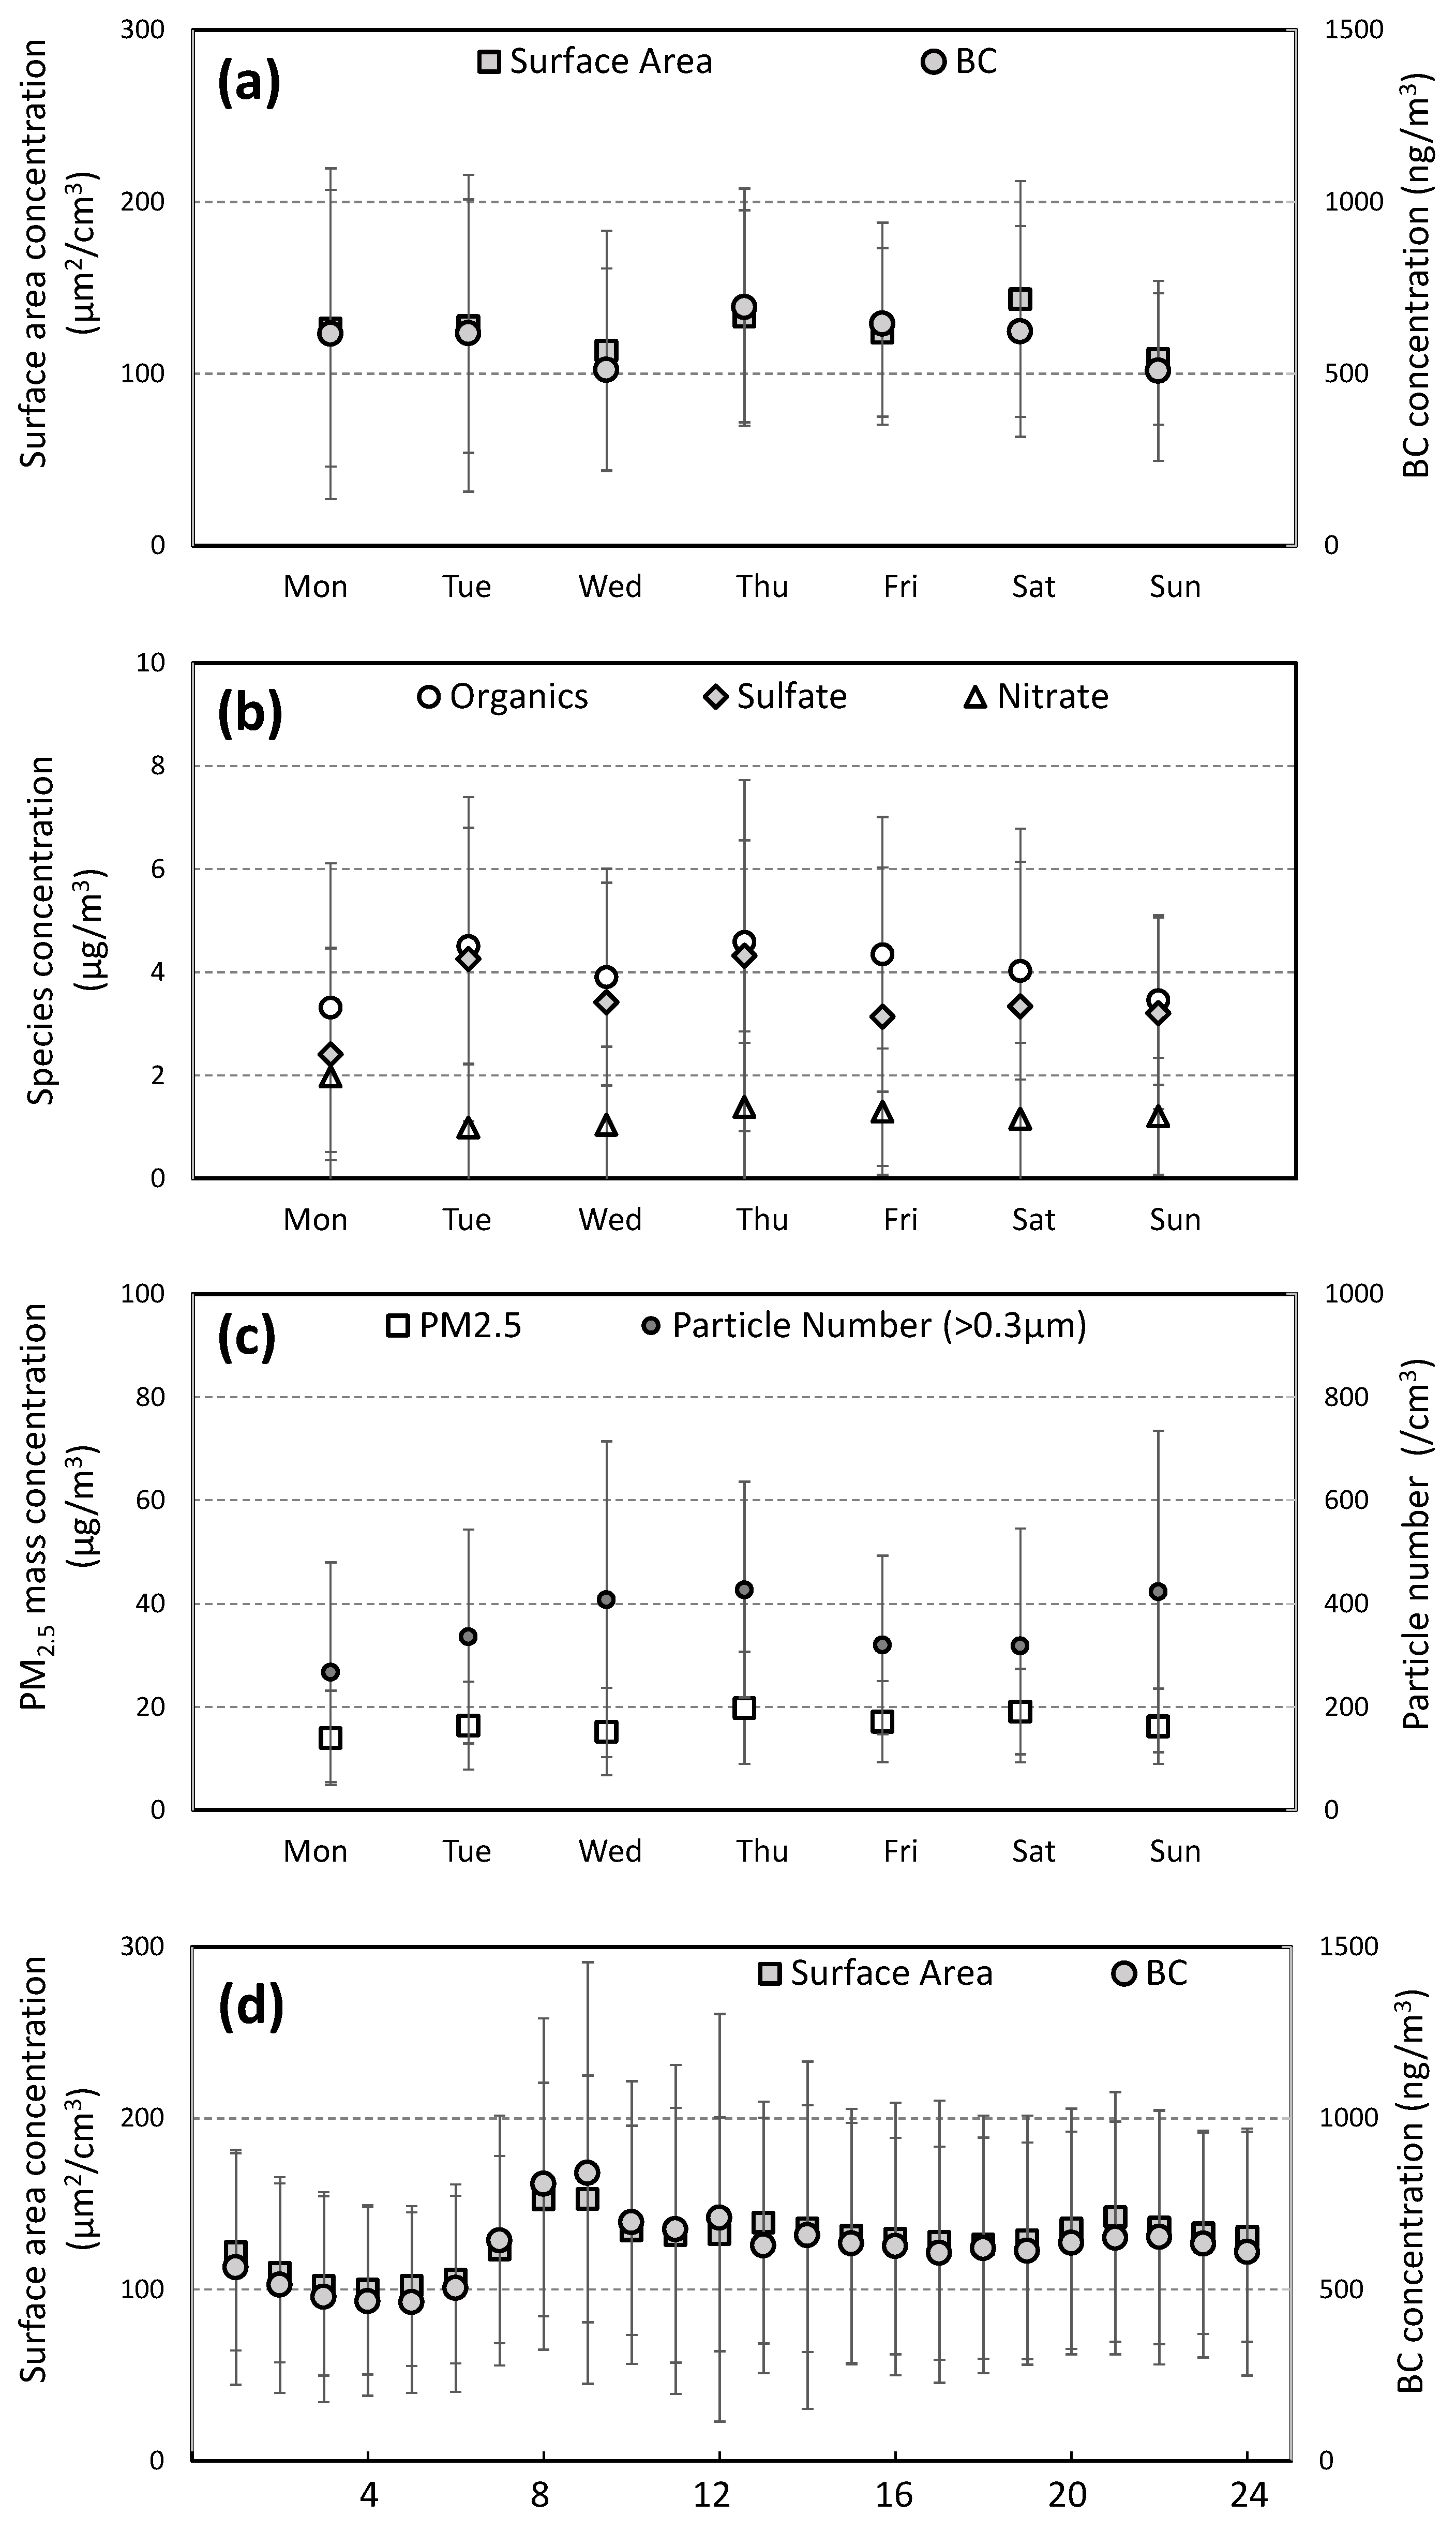
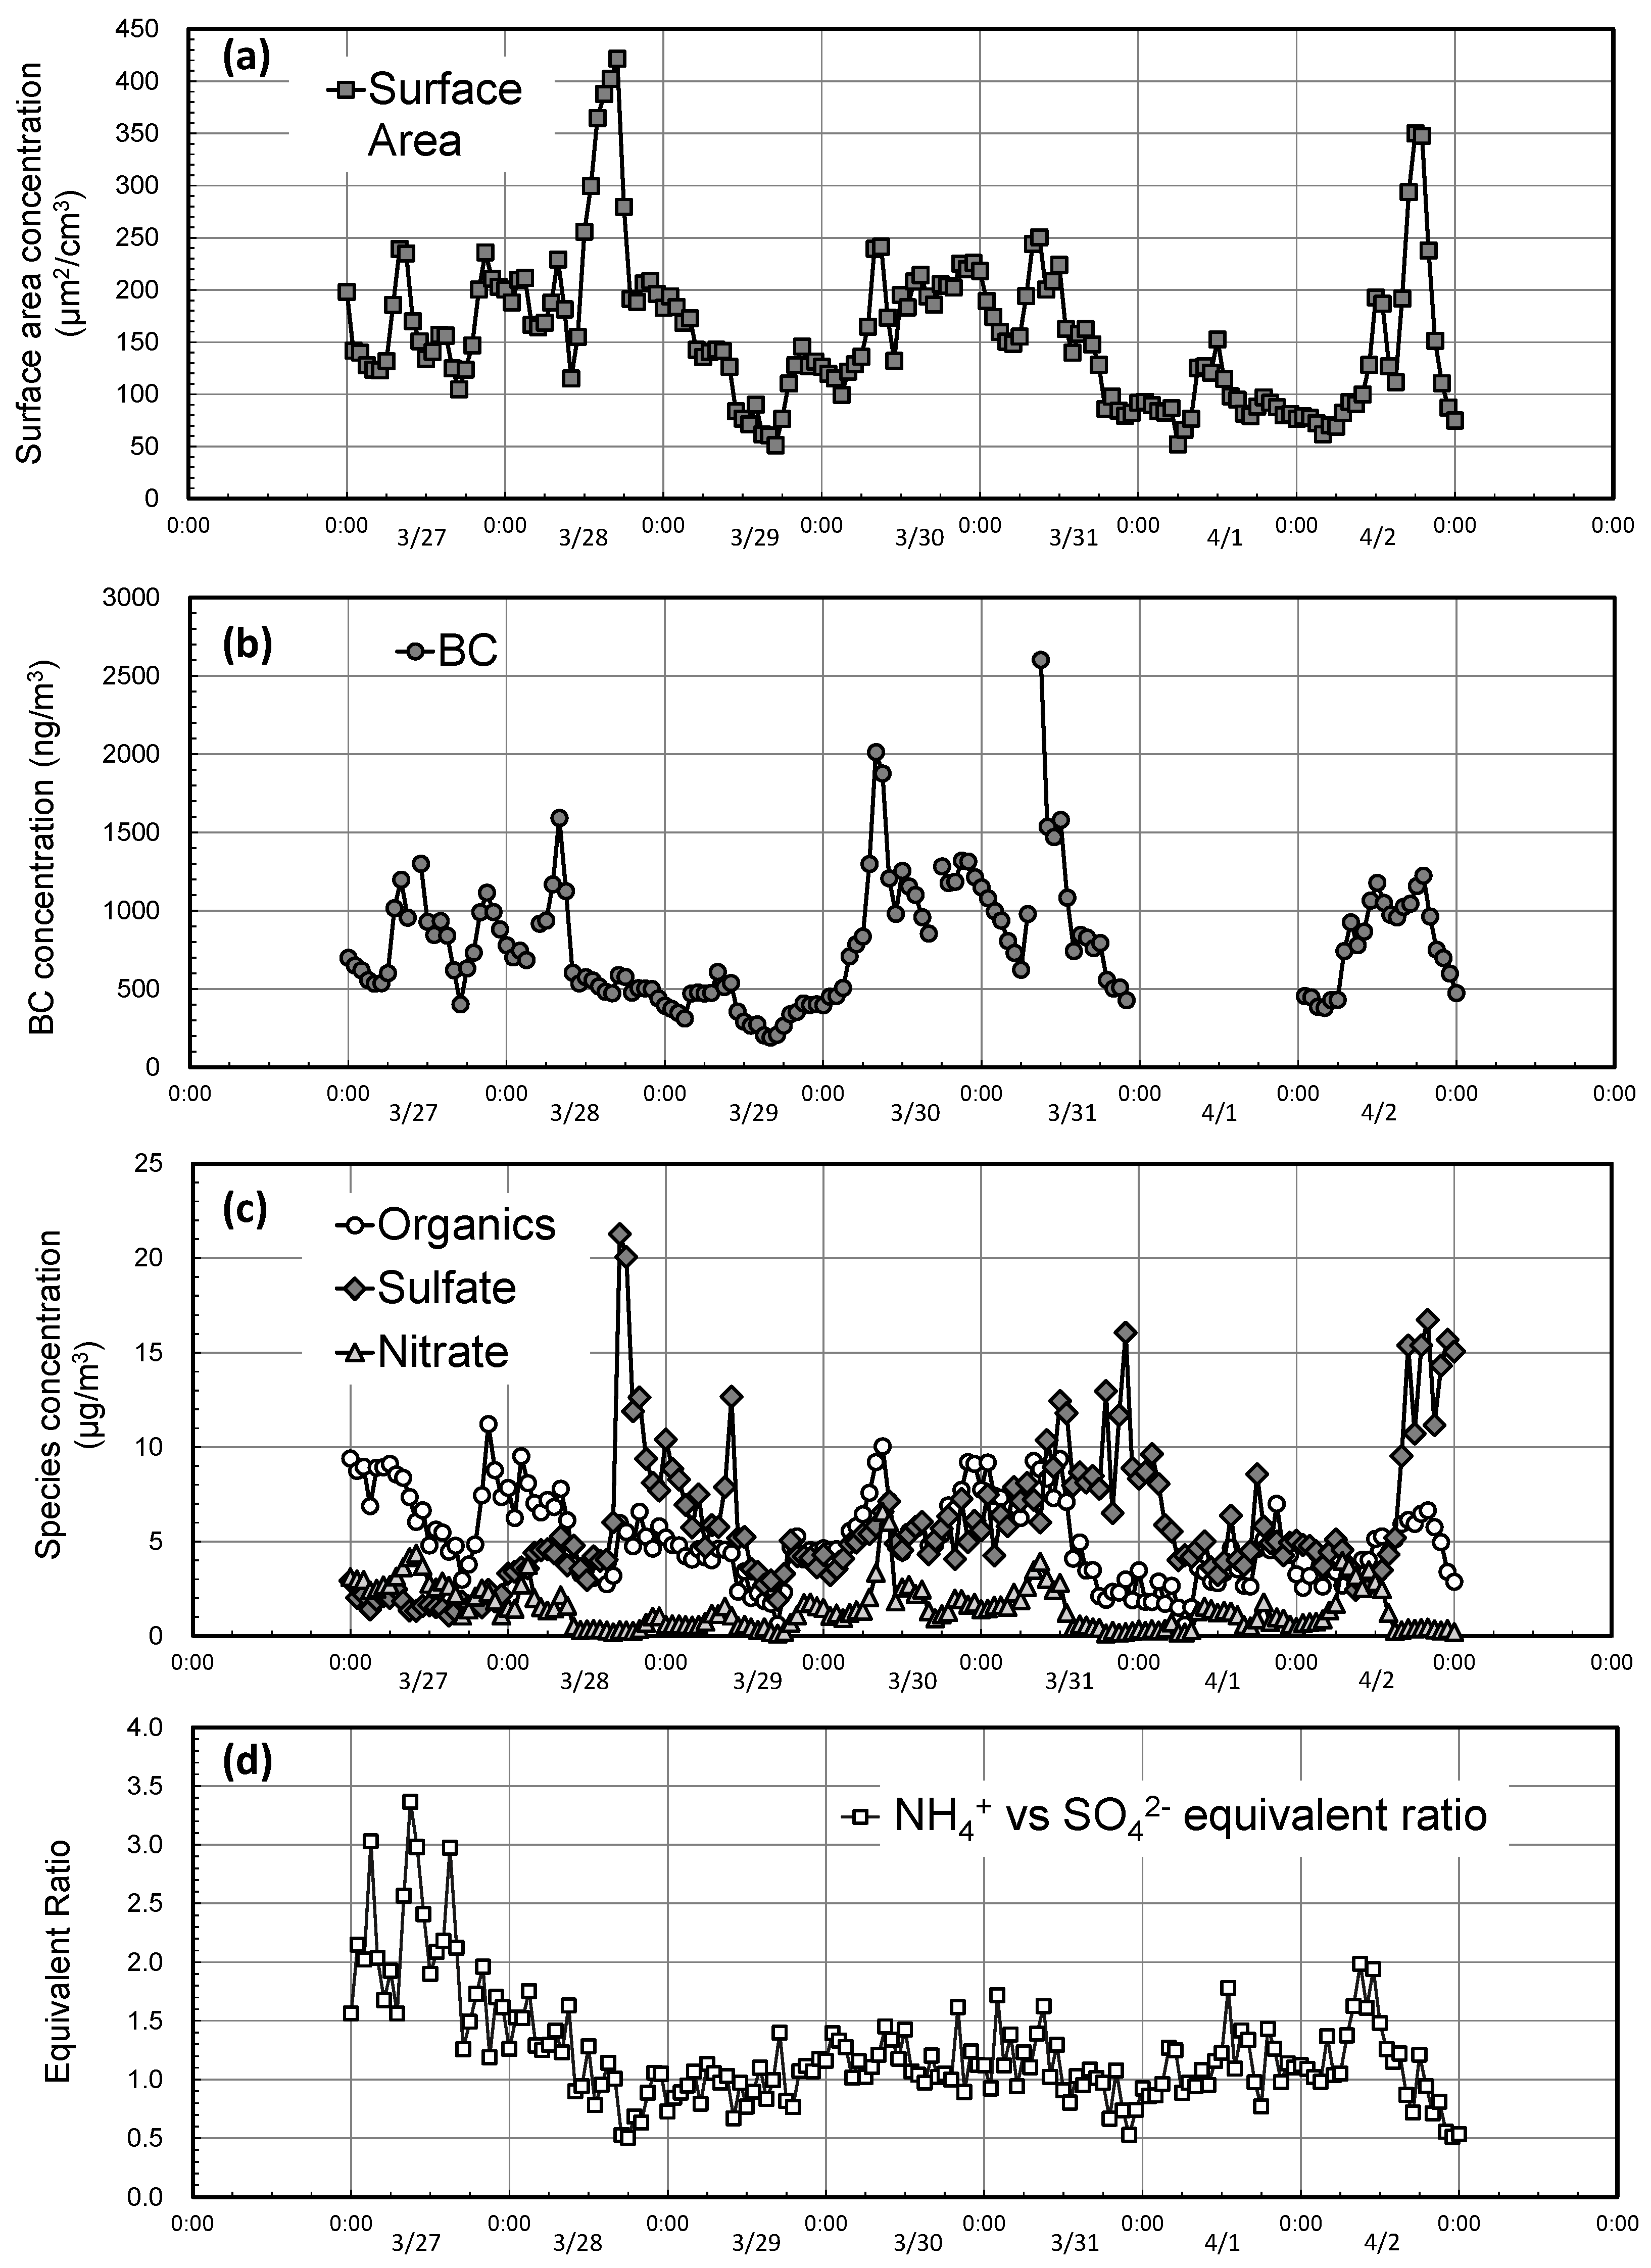
3.1. Aerosol Surface Area is Generally Controlled by Black Carbon

The mean values of each variable measured in this study are shown in Table 1. The surface area concentration and other parameters measured in this study were similar to those reported in previous studies [16,24,25,27].
A correlation matrix of the variables measured in this study is shown in Table 2. The variables that showed relatively higher correlation with aerosol surface area were BC (r = 0.74), organics (r = 0.67), ammonium (r = 0.57), and PM2.5 mass (r = 0.57). Both BC and organics showed relatively high correlation with the aerosol surface area. A comparison of the slopes of the regression lines indicated that a unit concentration of BC contributed to aerosol surface area five times more than an organics unit. Therefore, BC is considered to have a much higher contribution to aerosol surface area than organics.
Correlation plots of each variable against the aerosol surface area concentration are shown in Figure 2. Sulfate was a major component of PM2.5, and its major source at Fukuoka was considered to be long-range transport from the Asian Continent [27]. The results showed that the correlation between sulfate and aerosol surface area was weak (r = 0.41). The sum of sulfate, nitrate and ammonium accounted for approximately 35% of PM2.5 mass, but none of these variables appeared to contribute significantly to aerosol surface area. On the other hand, BC contributed significantly to aerosol surface area while only accounting for 3.5% of PM2.5 mass. This higher contribution of BC to aerosol surface area has been reported in previous studies [16,45]. We conclude that aerosol surface area in Fukuoka was mainly controlled by BC.
Day-of-week variation and diurnal variation of each variable were analyzed to investigate the relationship between aerosol surface area and human activity (Figure 3). The concentrations of aerosol surface area and BC on Sundays were significantly lower than on the other days of the week (t-test, p < 0.01). This is reasonable since automotive commutes are considered to decrease on Sundays. The aerosol surface area and BC also seemed to be lower on Wednesdays. However, as far as we know, there are currently no specific social activities that could be considered to contribute to these lower surface area and BC values (such as “car free day”) on Wednesdays in Fukuoka.
An examination of the diurnal variations exhibited clear daily morning peak in aerosol surface area and BC concentrations. In the morning (8:00–10:00), these concentrations were significantly higher than those measured at other times (t-test, p < 0.01). These morning peaks were related to concentrated automotive traffics near the monitoring site [23,24,45]. However, another report did not find this kind of traffic-related peak in aerosol surface area and BC [16]. The relationship between aerosol surface area (and BC) and automotive traffic may thus be variable and is probably affected by the distance between the monitoring site and nearby roads.
The other variables measured in this study did not exhibit morning peaks. Their restriction to BC among the chemical components of aerosol is supported by a previous study that showed that the elemental carbon in Fukuoka City was considered to originate mainly from locally emitted urban air pollutants rather than from long-range transport [27]. Organics showed no clear day-of-week/diurnal trends while correlation between aerosol surface area and organics was relatively high (see Table 2 and Figure 2). BC consistently showed the highest correlation with aerosol surface area, and was, thus, the major contributor to aerosol surface area in Fukuoka. This implies that even though BC accounts for relatively small percentage of PM2.5 mass, it should receive considerable attention when aerosol surface area is considered as an index of adverse health effects caused by exposure of the human body to aerosols.

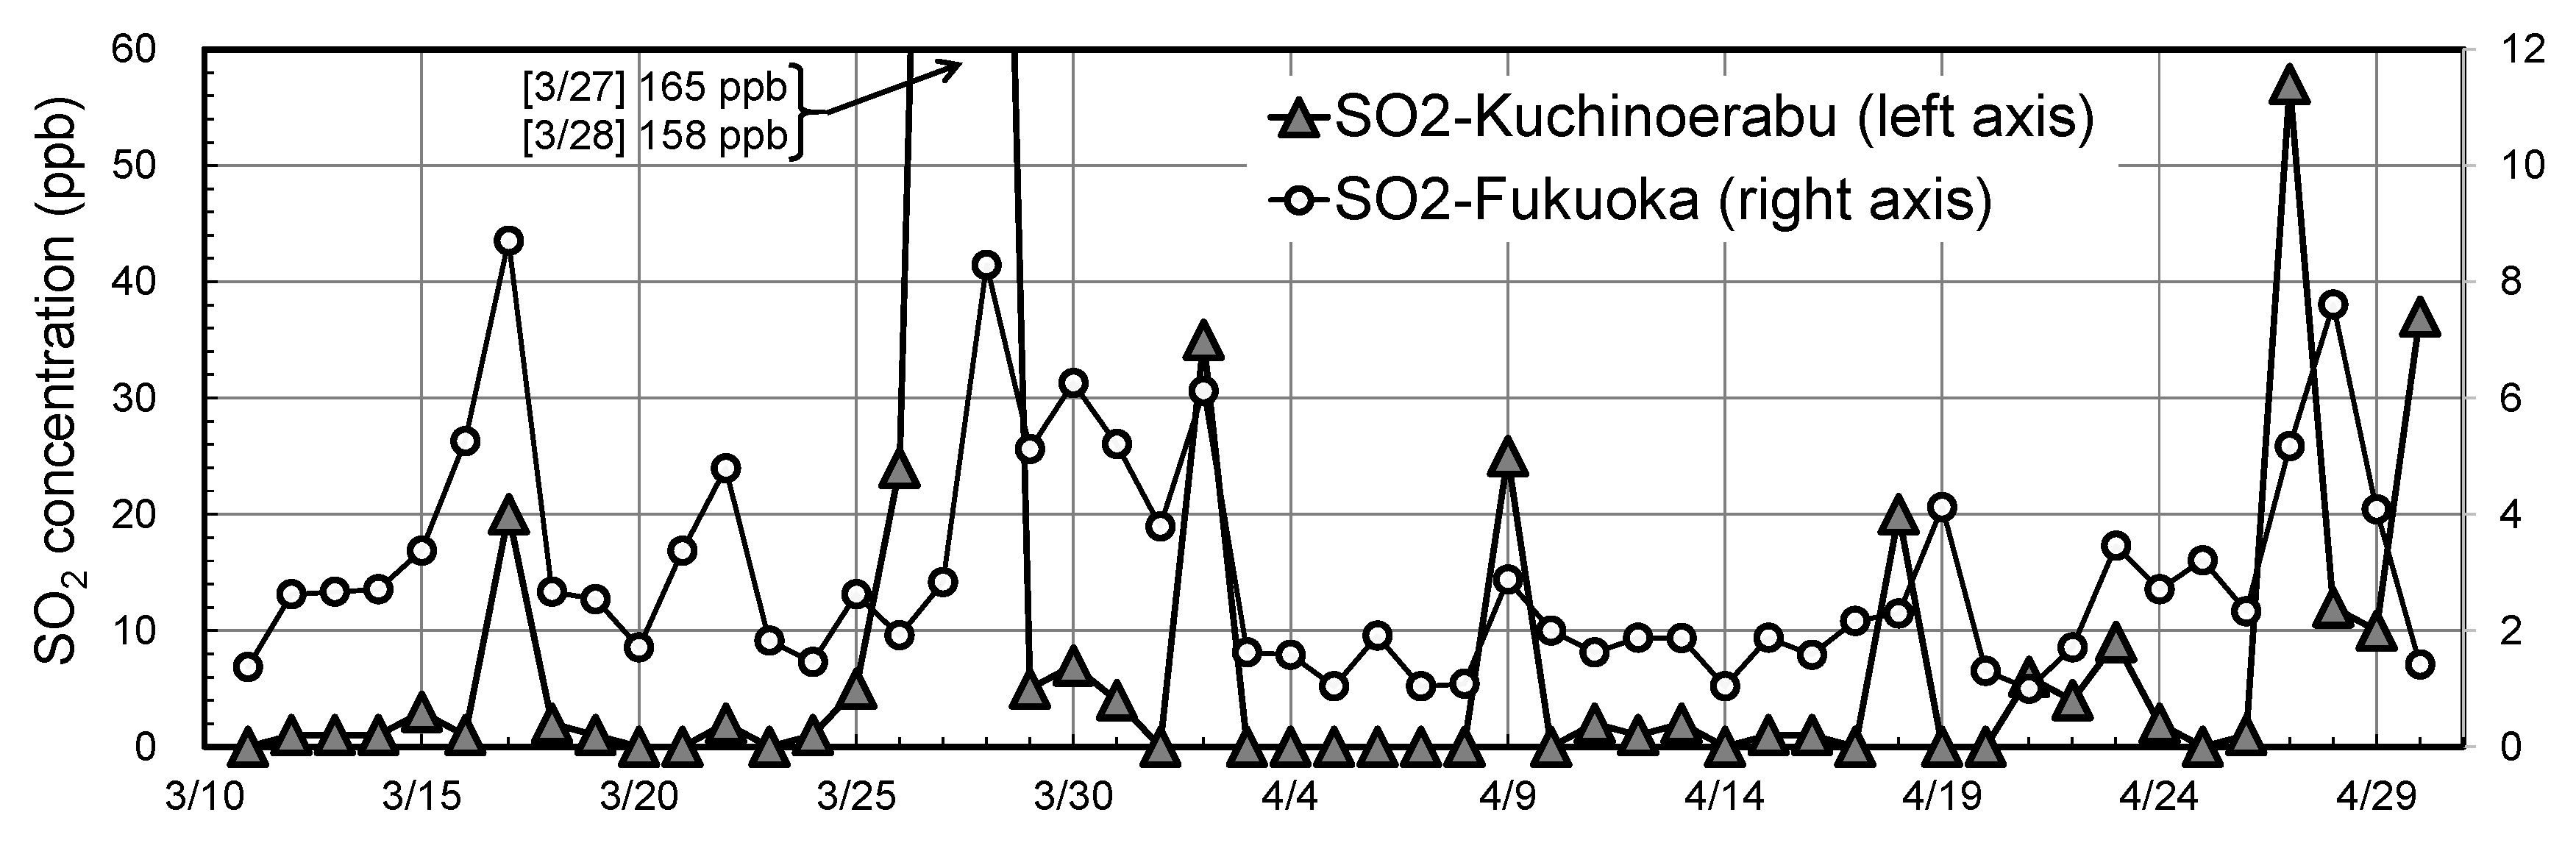
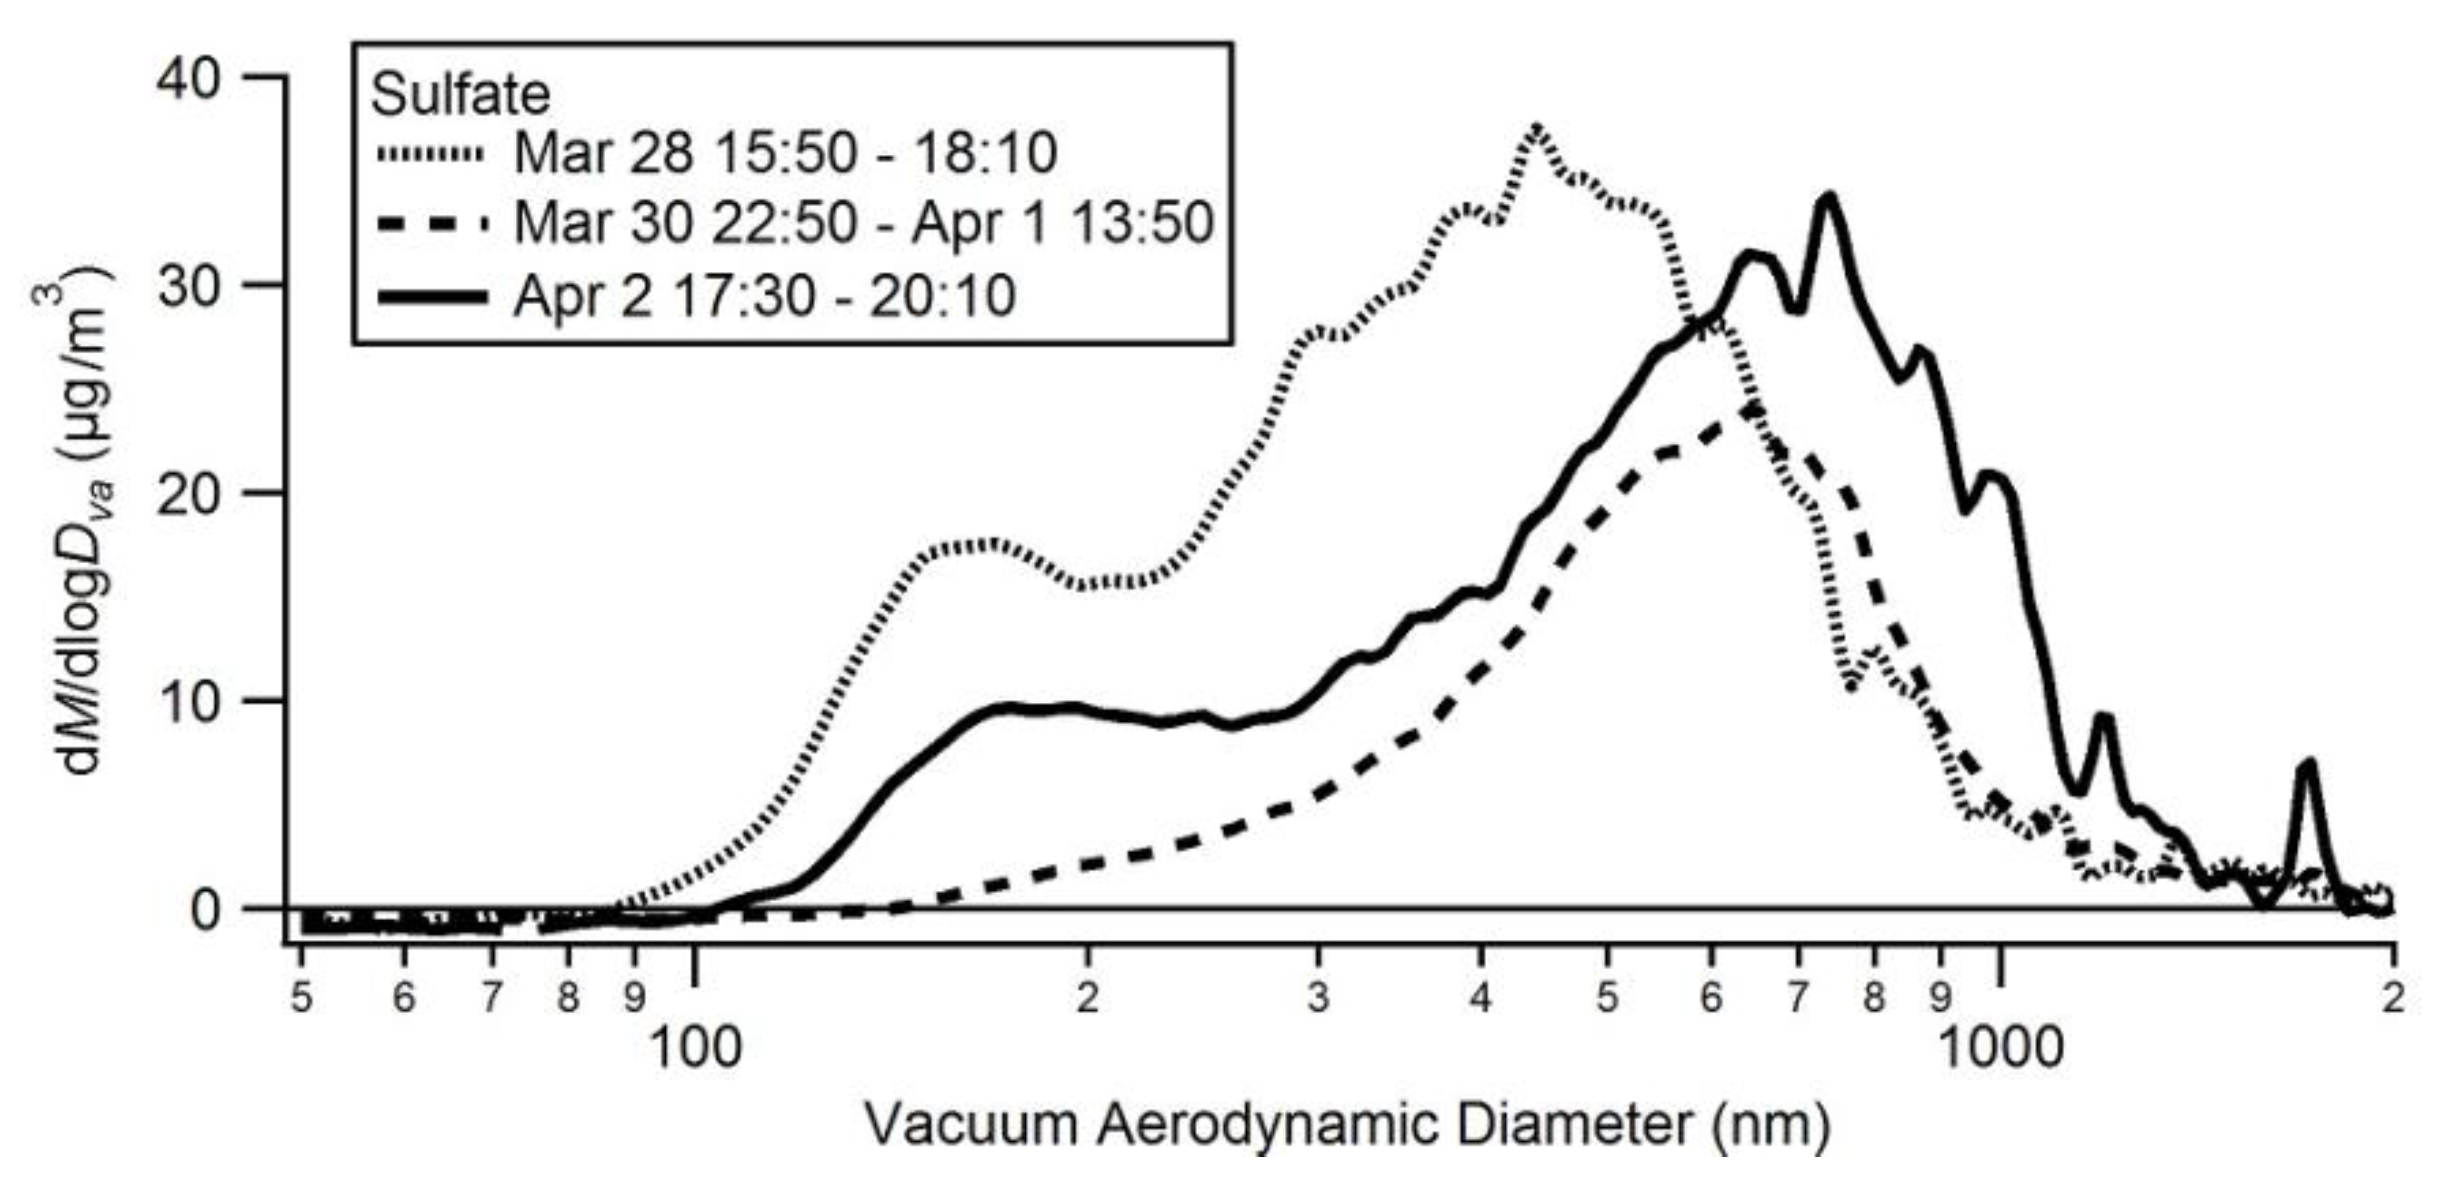
3.2. Case Study: Aerosol Surface Area is Occasionally Controlled by Sulfate

As mentioned above, aerosol surface area was strongly correlated with BC in Fukuoka. However, in some cases aerosol surface area was occasionally high while BC was low (see Figure 2). This high-surface area-low-BC type anomaly was not observed in Yokohama [16]. This section investigates the reasons for the occurrence of this anomaly.
A detailed investigation of the plots in the high-surface area-low-BC type anomaly zone in Figure 2 revealed that anomalies occurred on several specific days, in particular, 28 March and 2 April. It is likely that something unusual happened on these days; for example, changes in the trajectories of the airmass that reached Fukuoka city. Airmass backward trajectories starting from the monitoring site were obtained from March to April, 2015. In this period, approximately 75% of the airmass originated from the Asian continent (Figure 4a). A typical result for the trajectory is shown in Figure 4b. The trajectories on 28 March and 2 April are also shown in Figure 4c,d. Obviously, the trajectories on 28 March and 2 April were not “typical”. The airmass on these two days originated from the southern Kyushu area. Detailed records of variations in the variables measured in this study for the period including these two days are shown in Figure 5. Two distinct peaks of aerosol surface area were clearly observed on these dates. Sulfate showed clear peaks corresponding to these surface area peaks whereas BC did not. Sulfate concentrations can increase with nitrate and organics when a considerable quantity of air pollutants are transferred from the Asian continent to the Fukuoka area by long-range transport processes [27]. However, in the case of 28 March and 2 April, only the sulfate concentration increased while the concentrations of other components such as nitrate and organics did not show clear peaks at the same time. Therefore, reasons other than long-range transport from the Asian continent should be considered for these high-surface area-high-sulfate episodes.
Many active volcanoes exist around the Kyushu region, especially in southern Kyushu. Volcanic activity can introduce SO2 into the air, and volcanic SO2 can be converted into sulfate [46]. It would, thus, be possible that excess sulfate converted from volcanic SO2 had a significant effect on the increase in sulfate in Fukuoka on these two days. Figure 6 shows the daily mean values of SO2 concentrations at Kuchinoerabu Island (30.55°N, 130.22°E, approximately 350 km south of Fukuoka city, near an active volcano) and Fukuoka city from March to April, 2015. Volcanic SO2 was ejected several times during this period, and considerable SO2 ejection occurred on 27–28 March. The SO2 concentration in Fukuoka also showed a peak on 28 March. Consequently, the excess input of sulfate derived from volcanic emission can be considered a major reason for the increased aerosol surface area in Fukuoka on 28 March and 2 April, while concentration of BC, which was a major contributor to aerosol surface area on an ordinary day, was low on these two days.
The particle size of sulfuric acid mist newly formed from volcanic SO2 is in the single-nanometer range [47]. Newly-formed sulfuric acid mist is considered to have a much higher surface area per given mass than ammonium sulfate aerosol, whose particle size is normally in the submicron (hundreds of nanometers) range [37]. The chemically-resolved size distributions for sulfate in aerosols are shown in Figure 7. The averaged size distributions of sulfate from 30 March to 1 April was similar to a typical pattern of those on a day when aerosol particles were affected by long-range transport [28,37]. The sulfate size distributions on 28 March and 2 April showed a peak in a much smaller particle size range, and were clearly different from the typical one showing long-range transport. This means that relatively smaller sulfate particles increased on these days, which showed clear peaks of aerosol surface area. The variations in the equivalent ratio of ammonium to sulfate were calculated to investigate the chemical form of sulfate aerosol in Fukuoka during this period (Figure 5d). The average value of the equivalent ratio was nearly 1, showing that in general, sulfate was completely neutralized by ammonia. The ratio dropped on 28 March and 2 April, and finally reached 0.5. This indicates that even though volcanic SO2 emission may have initially introduced sulfuric acid mist into the air, which was neutralized by ammonia to form NH4HSO4 during the 350-km transportation to Fukuoka city. However, the particle size of the additionally introduced sulfate was much smaller than that of sulfate which was normally observed at Fukuoka city.
Consequently, sulfate aerosol does not usually affect aerosol surface area in Fukuoka, but it may occasionally have a significant effect when the airmass contains an excess amount of relatively smaller particles of sulfate derived from volcanic SO2.

4. Conclusions

The aerosol surface area concentration was measured together with black carbon (BC) and other chemical species, such as organic compounds, sulfate, and, nitrate in Fukuoka, Japan, and the effect of the chemical composition of aerosols on their surface area was investigated. Aerosol surface area concentration was highly correlated with BC concentration for the entire period. Day-of-week variation and diurnal variation also showed the strong correlation between aerosol surface area and BC. This implies that even though BC accounts for relatively small percentage (in this study, 3.5%) of PM2.5 mass, it should receive considerable attention when aerosol surface area is considered as an index of adverse health effects caused by exposure of the human body to aerosols. Sulfate aerosol does not usually affect aerosol surface area in Fukuoka, but it may occasionally have a significant effect when the airmass contains an excess amount of relatively smaller particles of sulfate derived from volcanic SO2.

Acknowledgments

This study was supported partly by JSPS/MEXT KAKENHI Grant Number 26340010, Ministry of Environment, Environment Research and Technology Development Fund, Japan (Grant No. 5-1452), Steel Foundation for Environmental Protection Technology, Grant for Environmental Research Projects from The Sumitomo Foundation, and Keio Gijuku Academic Development Funds.

Author Contributions

T.O. conceived and designed the experiments, and wrote the paper; H.Y. analyzed the data; K.H. (Keio University), K.F. and K.I. installed and operated the NSAM, N.K. performed the BC measurements; A.Y. and A.T. performed the AMS experiments; C.N., K.H. (Fukuoka University) and M.H. administrated the entire experiments. All authors contributed to revising the manuscript.

Conflicts of Interest

The authors declare no conflict of interest. The founding sponsors had no role in the design of the study; in the collection, analyses, or interpretation of data; in the writing of the manuscript, and in the decision to publish the results.

Abbreviations

The following abbreviations are used in this manuscript:
BC:
Black Carbon
BET:
Brunauer-Emmett-Teller method
ICRP:
International Commission on Radiological Protection
LDSA:
Lung deposited surface area
NSAM:
Nanoparticle surface area monitor
Q-AMS:
Quadrupole type aerosol mass spectrometer

References

  1. Dockery, D.W.; Pope, C.A., III; Xu, X.; Spengler, J.D.; Ware, J.H.; Fay, M.E.; Ferris, B.G., Jr.; Speizer, F.E. An association between air pollution and mortality in six U.S. cities. N. Engl. J. Med. 1993, 329, 1753–1759. [Google Scholar] [CrossRef] [PubMed]
  2. Pope, C.A., III; Thun, M.J.; Namboodiri, M.M.; Dockery, D.W.; Evans, J.S.; Speizer, F.E.; Heath, C.W., Jr. Particulate air pollution as a predictor of mortality in a prospective study of U.S. adults. Am. J. Respir. Crit. Care Med. 1995, 151, 669–674. [Google Scholar] [CrossRef] [PubMed]
  3. International Agency for Research on Cancer. Air Pollution and Cancer; IARC Scientific Publication: Lyon, France, 2013; No. 161. [Google Scholar]
  4. Donaldson, K.; Li, X.Y.; MacNee, W. Ultrafine (nanometre) particle mediated lung injury. J. Aerosol Sci. 1998, 29, 553–560. [Google Scholar] [CrossRef]
  5. Oberdörster, G.; Gelein, R.M.; Ferin, J.; Weiss, B. Association of particulate air pollution and acute mortality: Involvement of ultrafine particles? Inhal. Toxicol. 1995, 7, 111–124. [Google Scholar] [CrossRef] [PubMed]
  6. The National Institute for Occupational Safety and Health (NIOSH). The National Institute for Occupational Safety and Health (NIOSH): Approaches to Safe Nanotechnology; DHHS (NIOSH) Publication No. 2009-125; The National Institute for Occupational Safety and Health (NIOSH): Washington, DC, USA, 2009.
  7. Ferin, J.; Oberdörster, G.; Penney, D.P. Pulmonary retention of ultrafine and fine particles in rats. Am. J. Respir. Cell Mol. Biol. 1992, 6, 535–542. [Google Scholar] [CrossRef] [PubMed]
  8. Nakanishi, J. Risk Assessment of Manufactured Nanomaterials: Carbon Nanotubes (CNT). Final Report Issued on August 12, 2011, Executive Summary; NEDO project “Research and Development of Nanoparticle Characterization Methods.” (P06041); New Energy and Industrial Technology Development Organization: Kawasaki, Japan, 2011. [Google Scholar]
  9. Oberdörster, G.; Finkelstein, J.N.; Johnston, C.; Gelein, R.; Cox, C.; Baggs, R.; Elder, A.C.P. Acute pulmonary effects of ultrafine particles in rats and mice. Res. Rep. Health Eff. Inst. 2000, 96, 5–74. [Google Scholar] [PubMed]
  10. Oberdörster, G.; Oberdörster, E.; Oberdörster, J. Nanotoxicology: An emerging discipline evolving from studies of ultrafine particles. Environ. Health Perspect. 2005, 113, 823–839. [Google Scholar] [CrossRef] [PubMed]
  11. Giechaskiel, B.; Alföldy, B.; Drossinos, Y. A metric for health effects studies of diesel exhaust particles. J. Aerosol Sci. 2009, 40, 639–651. [Google Scholar] [CrossRef]
  12. Oberdörster, G. Pulmonary effects of inhaled ultrafine particles. Int. Arch. Occup. Environ. Health 2001, 74, 1–8. [Google Scholar] [CrossRef] [PubMed]
  13. Brunauer, S.; Emmett, P.H.; Teller, E. Adsorption of gases in multimolecular layers. J. Am. Chem. Soc. 1938, 60, 309–319. [Google Scholar] [CrossRef]
  14. Okuda, T. Measurement of the specific surface area and particle size distribution of atmospheric aerosol reference materials. Atmos. Environ. 2013, 75, 1–5. [Google Scholar] [CrossRef]
  15. Okuda, T.; Isobe, R.; Nagai, Y.; Okahisa, S.; Funato, K.; Inoue, K. Development of a high-volume PM2.5 particle sampler using impactor and cyclone techniques. Aerosol Air Qual. Res. 2015, 15, 759–767. [Google Scholar] [CrossRef]
  16. Hatoya, K.; Okuda, T.; Funato, K.; Inoue, K. On-line measurement of the surface area concentration of aerosols in Yokohama, Japan, using the diffusion charging method. Asian J. Atmos. Environ. 2016, in press. [Google Scholar]
  17. Fissan, H.; Neumann, S.; Trampe, A.; Pui, D.Y.H.; Shin, W.G. Rationale and principle of an instrument measuring lung deposited nanoparticle surface area. J. Nanopart. Res. 2007, 9, 53–59. [Google Scholar] [CrossRef]
  18. Heitbrink, W.A.; Evans, D.E.; Ku, B.K.; Maynard, A.D.; Slavin, T.J.; Peters, T.M. Relationships among particle number, surface area, and respirable mass concentrations in automotive engine manufacturing. J. Occup. Environ. Hyg. 2009, 6, 19–31. [Google Scholar] [CrossRef] [PubMed]
  19. Jung, H.; Kittelson, D.B. Characterization of aerosol surface instruments in transition regime. Aerosol Sci. Technol. 2005, 39, 902–911. [Google Scholar] [CrossRef]
  20. Shin, W.G.; Pui, D.Y.H.; Fissan, H.; Neumann, S.; Trampe, A. Calibration and numerical simulation of Nanoparticle Surface Area Monitor (TSI Model 3550 NSAM). J. Nanopart. Res. 2007, 9, 61–69. [Google Scholar] [CrossRef]
  21. Asbach, C.; Fissan, H.; Stahlmecke, B.; Kuhlbusch, T.A.J.; Pui, D.Y.H. Conceptual limitations and extensions of lung-deposited Nanoparticle Surface Area Monitor (NSAM). J. Nanopart. Res. 2009, 11, 101–109. [Google Scholar] [CrossRef]
  22. Gomes, J.F.P.; Albuquerque, P.C.S.; Esteves, H.M.D.S.; Carvalho, P.A. Notice on a methodology for characterizing emissions of ultrafine particles/nanoparticles in microenvironments. Energy Emiss. Cont. Technol. 2013, 1, 15–27. [Google Scholar] [CrossRef]
  23. Albuquerque, P.C.; Gomes, J.F.; Bordado, J.C. Assessment of exposure to airborne ultrafine particles in the urban environment of Lisbon, Portugal. J. Air Waste Manag. Assoc. 2012, 62, 373–380. [Google Scholar] [CrossRef] [PubMed]
  24. Ntziachristos, L.; Polidori, A.; Phuleria, H.; Geller, M.D.; Sioutas, C. Application of a diffusion charger for the measurement of particle surface concentration in different environments. Aerosol Sci. Technol. 2007, 41, 571–580. [Google Scholar] [CrossRef]
  25. Velasco, E.; Siegmann, P.; Siegmann, H.C. Exploratory study of particle-bound polycyclic aromatic hydrocarbons in different environments of Mexico City. Atmos. Environ. 2004, 38, 4957–4968. [Google Scholar] [CrossRef]
  26. China, S.; Salvadori, N.; Mazzoleni, C. Effect of traffic and driving characteristics on morphology of atmospheric soot particles at freeway on-ramps. Environ. Sci. Technol. 2014, 48, 3128–3135. [Google Scholar] [CrossRef] [PubMed]
  27. Kaneyasu, N.; Yamamoto, S.; Sato, K.; Takami, A.; Hayashi, M.; Hara, K.; Kawamoto, K.; Okuda, T.; Hatakeyama, S. Impact of long-range transport of aerosols on the PM2.5 composition at a major metropolitan area in the northern Kyushu area of Japan. Atmos. Environ. 2014, 97, 416–425. [Google Scholar] [CrossRef]
  28. Takami, A.; Miyoshi, T.; Irei, S.; Yoshino, A.; Sato, K.; Shimizu, A.; Hayashi, M.; Hara, K.; Kaneyasu, N.; Hatakeyama, S. Analysis of organic aerosol in Fukuoka, Japan using a PMF method. Aerosol Air Qual. Res. 2016, 16, 314–322. [Google Scholar] [CrossRef]
  29. Kaneyasu, N.; Takami, A.; Sato, K.; Hatakeyama, S.; Hara, S.; Kawamoto, K.; Yamamoto, S. Year-round behavior of PM2.5 in a remote island and urban site in the northern Kyushu area, Japan. J. Jpn. Soc. Atmos. Environ. 2011, 46, 111–118. (In Japanese) [Google Scholar]
  30. International Commission on Radiological Protection (ICRP). Human respiratory tract model for radiological protection. Ann. ICRP 1994, 24, 1–482. [Google Scholar]
  31. Ng, I.P.; Ma, H.; Kittelson, D.B.; Miller, A.L. Comparing Measurements of Carbon in Diesel Exhaust Aerosols Using the Aethalometer, NIOSH Method 5040, and SMPS; SAE Technical Paper Series 2007-01-0334; University of Minnesota: Minneapolis, MN, USA, 2007. [Google Scholar]
  32. Venkatachari, P.; Zhou, L.; Hopke, P.K.; Schwab, J.J.; Demerjian, K.L.; Weimer, S.; Hogrefe, O.; Felton, D.; Rattigan, O. An intercomparison of measurement methods for carbonaceous aerosol in the ambient air in New York City. Aerosol Sci. Technol. 2006, 40, 788–795. [Google Scholar] [CrossRef]
  33. Jayne, J.T.; Leard, D.C.; Zhang, X.; Davidovits, P.; Smith, K.A.; Kolb, C.E.; Worsnop, D.R. Development of an aerosol mass spectrometer for size and composition analysis of submicron particles. Aerosol Sci. Technol. 2000, 33, 49–70. [Google Scholar] [CrossRef]
  34. Allan, J.D.; Jimenez, J.L.; Coe, H.; Bower, K.N.; Williams, P.I.; Worsnop, D.R. Quantitative sampling using an Aerodyne aerosol mass spectrometer: Part 1. Techniques of data interpretation and error analysis. J. Geophys. Res. 2003, 108, 4090. [Google Scholar] [CrossRef]
  35. Allan, J.D.; Alfarra, M.R.; Bower, K.N.; Williams, P.I.; Gallagher, M.W.; Jimenez, J.L.; McDonald, A.G.; Nemitz, E.; Canagaratna, M.R.; Jayne, J.T.; et al. Quantitative sampling using an aerodyne aerosol mass spectrometer: Part 2. Measurements of fine particulate chemical composition in two U.K. cities. J. Geophys. Res. 2003b, 108. [Google Scholar] [CrossRef]
  36. Jimenez, J.L.; Jayne, J.T.; Shi, Q.; Kolb, C.E.; Worsnop, D.R.; Yourshaw, I.; Seinfeld, J.H.; Flagan, R.C.; Zhang, X.; Smith, K.A.; et al. Ambient aerosol sampling using the aerodyne aerosol mass spectrometer. J. Geophys. Res. 2003, 108. [Google Scholar] [CrossRef]
  37. Takami, A.; Miyoshi, T.; Shimono, A.; Hatakeyama, S. Chemical composition of fine aerosol measured by AMS at Fukue Island, Japan during APEX period. Atmos. Environ. 2005, 39, 4913–4924. [Google Scholar] [CrossRef]
  38. Canagaratna, M.R.; Jayne, J.T.; Jimenez, J.L.; Allan, J.D.; Alfarra, M.R.; Zhang, Q.; Onasch, T.B.; Drewnick, F.; Coe, H.; Middlebrook, A.; et al. Chemical and microphysical characterization of ambient aerosols with the aerodyne aerosol mass spectrometer. Mass Spectrom. Rev. 2007, 26, 185–222. [Google Scholar] [CrossRef] [PubMed]
  39. Takami, A.; Miyoshi, T.; Shimono, A.; Kaneyasu, N.; Kato, S.; Kajii, Y.; Hatakeyama, S. Transport of anthropogenic aerosols from Asia and subsequent chemical transformation. J. Geophys. Res. 2007, 112, D22S31. [Google Scholar] [CrossRef]
  40. Allan, J.D.; Coe, H.; Bower, K.N.; Alfarra, M.R.; Delia, A.E.; Jimenez, J.L.; Middlebrook, A.M.; Drewnick, F.; Onasch, T.B.; Canagaratna, M.R.; et al. A generalized method for the extraction of chemically resolved mass spectra from aerodyne aerosol mass spectrometer data. J. Aerosol. Sci. 2004, 35, 909–922. [Google Scholar] [CrossRef]
  41. Fukuoka Prefecture Website. Available online: http://www.fihes.pref.fukuoka.jp/taiki-new/Nipo/OyWbNpKm0151.htm (accessed on 14 January 2016).
  42. Kagoshima Prefecture Website. Available online: http://www.pref.kagoshima.jp/ (accessed on 14 January 2016).
  43. Draxler, R.R.; Rolph, G.D. HYSPLIT (HYbrid Single-Particle Lagrangian Integrated Trajectory) Model Access via NOAA ARL READY Website; NOAA Air Resources Laboratory: Silver Spring, MD, USA, 2015. [Google Scholar]
  44. Rolph, G.D. Real-time Environmental Applications and Display sYstem (READY) Website; NOAA Air Resources Laboratory: Silver Spring, MD, USA, 2015. [Google Scholar]
  45. Polidori, A.; Hu, S.; Biswas, S.; Delfino, R.J.; Sioutas, C. Real-time characterization of particle-bound polycyclic aromatic hydrocarbons in ambient aerosols and from motor-vehicle exhaust. Atmos. Chem. Phys. 2008, 8, 1277–1291. [Google Scholar] [CrossRef]
  46. Nagatani, T.; Yamada, M.; Kojima, T.; Zhang, D. Episodic particulate sulfate and sulfur dioxide on the southwestern Japan coast in March and April 2010. Asian J. Atmos. Environ. 2012, 6, 41–52. [Google Scholar] [CrossRef]
  47. Boulon, J.; Sellegri, K.; Hervo, M.; Laj, P. Observations of nucleation of new particles in a volcanic plume. Proc. Natl. Acad. Sci. 2011, 30, 12223–12226. [Google Scholar] [CrossRef] [PubMed]
Figure 1. Map of East Asia showing each sector classified by airmass backward trajectories from the monitoring site (Fukuoka University, Japan).
Atmosphere 07 00033 g001
Figure 2. Correlation plots of each variable against the aerosol surface area concentration measured in Fukuoka, Japan, from March to October, 2015. (a) PM2.5 mass; (b) particle number (>0.3 μm); (c) black carbon; (d) organics; (e) sulfate; and (f) nitrate.
Atmosphere 07 00033 g002
Figure 3. Day-of-week variation of (a) surface area and BC; (b) organics, sulfate, and nitrate; and (c) PM2.5 mass, particle number (>0.3 μm), and diurnal variation of (d) surface area and BC; (e) organics, sulfate, and nitrate; and (f) PM2.5 mass and particle number (>0.3 μm), measured in this study.
Atmosphere 07 00033 g003aAtmosphere 07 00033 g003b
Figure 4. Results of airmass backward trajectory analysis started at Fukuoka from March to April, 2015. The sector classification is shown in Figure 1. (a) Overall data for the sector analysis; (b) a typical trajectory result for the analysis period; (c) trajectory results for 28 March 2015; and (d) trajectory results for 2 April 2015.
Atmosphere 07 00033 g004
Figure 5. Hourly variation of variables obtained in this study in Fukuoka from 27 March to 2 April 2015. (a) Aerosol surface area; (b) black carbon; (c) organics, sulfate, and nitrate; and (d) equivalent ratio of ammonium to sulfate.
Atmosphere 07 00033 g005
Figure 6. The daily mean values of SO2 concentrations at Kuchinoerabu Island (near an active volcano), Kagoshima (triangle, left axis), and Fukuoka city (circle, right axis) from March to April 2015.
Atmosphere 07 00033 g006
Figure 7. The chemically-resolved size distributions for sulfate in aerosols at Fukuoka measured by Q-AMS on 28 March, 15:50–18:10 (dotted line), from 30 March, 22:50 to 1 April, 13:50 (dashed line), and on 2 April, 17:30–20:10 (solid line).
Atmosphere 07 00033 g007
Table 1. Mean value and standard deviation of each variable measured in this study in Fukuoka, Japan (March to April, 2015, 1 h average value).
MeanSDn
Surface Areaµm2/cm3128671035
PM2.5 massµg/m317.611.41220
BCng/m36213921150
Organicsµg/m34.022.30879
NH4+µg/m31.520.97879
SO42−µg/m33.432.85879
NO3µg/m31.301.60879
Clµg/m30.120.11879
Particle Number (>0.3 μm)#/cm3375318919
Table 2. Correlation matrix of the variables measured in this study.
Surface AreaPM2.5 massBCOrganicsNH4+SO42−NO3ClParticle Number
Surface Area1.000.570.740.670.570.410.460.220.43
PM2.5 mass-1.000.680.560.760.700.320.290.85
BC--1.000.630.520.320.480.310.64
Organics---1.000.520.350.490.400.42
NH4+----1.000.850.550.510.76
SO42−-----1.000.150.240.60
NO3------1.000.610.47
Cl-------1.000.49
Particle Number--------1.00

