1. Introduction
The Indian Summer Monsoon (ISM) provides up to 80% of the annual mean precipitation of the country and has great impacts on the Indian economy. India, being one of the most populated countries in the world, and the variations in ISM precipitation, considerably influence the global economy as well. In terms of global-scale atmospheric circulation, ISM plays an important part, as it dominates the boreal summer tropical meridional overturning,
i.e., the Hadley circulation [
1] . ISM is also influenced by local Hadley circulation and may be viewed as a superposition and interaction between a regional Hadley circulation and a planetary-scale Walker circulation [
2] . This view is similar to the lateral and transverse monsoons discussed in a review by [
3].
ISM represents a large-scale heat source situated off the equator at a mean position of about 20°N (though this varies between the east and western part of the subcontinent). The linear theory of the atmospheric response to such a heat source [
4] predicts that it will also be associated with a strong Hadley circulation. The regional Hadley circulation is due to the direct response of the off-equatorial monsoon heat source while the Walker circulation is due to equatorial heat sources. The regional Hadley circulation can be affected by changes in the location and strength of the monsoon heat source. By contrast, the Walker circulation over the equatorial Indian Ocean may be influenced remotely by the movement of equatorial heat sources in the Pacific, such as those associated with the El Niño-Southern Oscillation (ENSO).
Considering the role of regional Hadley circulation and Walker circulation in regulating ISM, various Monsoon Indices are proposed: zonal (U) and meridional (V) wind circulations at 200 mb and 850 mb level. Such indices have been shown to better quantify monsoon precipitation around the Indian subcontinent, for e.g., Indian Monsoon (IM) Index [
5], West North Pacific Monsoon (WNPM) Index [
6], Webster and Yang Monsoon (WYM) Index [
7], and are defined as follows:
IM Index: U850 (40°E–80°E, 5°N–15°N)—U850 (70°E–90°E, 20°N–30°N)
WNPM Index: U850 (100°E–130°E, 5°N–15°N)—U850 (110°E–140°E, 20°N–30°N)
WYM Index: U850 (40°E–110°E, EQ-20°N)—U200 (40°E–110°E, EQ-20°N)
The IM Index pertains to two box regions, one around Central North India and one covering the South Peninsular and Arabian Sea. It takes into account the difference between zonal wind fields at the 850-mb level in those two places. These differences (from the second box region to the first) indirectly indicate northward meridional wind advection at the 850-mb level, which is nothing but V850. Strengthening of the IM Index thus indirectly suggests more moisture flux to the land region from the ocean and intensification of ITCZ (Inter Tropical Convergence Zone) around the Indian subcontinent. For the WNPM Index, a similar technique was employed, but the two box regions were chosen at different places in the West North Pacific region. It similarly indirectly indicates the importance of V850 to regulate monsoon rainfall in that region. The WYM Index, on the other hand, considers only one box region that covers the southern peninsula, Bay of Bengal, Arabian Sea and parts of the North Indian Ocean. The zonal components of the mean wind field (U) at 200 mb and 850 mb are considered.
However, there could be limitations with those indices for ISM rainfall prediction. For e.g., let us consider the WYM Index [
7] that takes into account the zonal wind-shear (between 850 and 200 mb) anomaly averaged over 40°E–110°E, 0°–20°N. The definition of the WYM Index is based on the dynamic premise that the monsoon flow is a first baroclinic response to the diabatic heating over the south Asian region [
4,
7]. The WYM Index is strongly correlated with the ENSO [
8], and is a good indicator of the planetary-scale variations of the ISM. However, the WYM Index has low correlation with the total ISM rainfall for the summer season [
9,
10], also noted by [
7]. While the WYM Index may still be useful in representing the planetary-scale variations associated with the ISM, it does not represent the overall variation.
A Monsoon Index around other parts of the world is also proposed, for e.g., around Australia; it is the Australian Monsoon Index (AUSMI, [
11]) defined as:
Two other monsoon indices are also introduced [
12,
13], the East Asian Summer Monsoon Index (EASMI) and South Asian Summer Monsoon Index (SASMI), defined as:
As noticed, all these indices are directly based on zonal velocity; mainly at 850 mb level (U850) and also at U200 for the WYM Index and thus primarily consider planetary-scale Walker circulation. Noting the importance of regional Hadley circulation [
2] on ISM precipitation, [
14] proposed another monsoon Index, the Extended Indian Monsoon Rainfall (EIMR) Index that directly considers the meridional components of wind. The Index is the difference between V850 and V200 averaged over a box region (10°N–30°N, 70°E–110°E).
Though various monsoon indices are proposed based on the zonal and meridional components of wind velocity at the 200 mb and 850 mb level, regional monsoon indices have not been studied thus far. The interaction between large-scale circulation and the local topography plays a role in determining the spatial distribution of regional rainfall patterns for ISM and hence indicates the importance of specifying the regional ISM Index. The importance of different components of wind, associated with ISM precipitation, region wise, is an interesting area to explore.
Studies have shown that ISM is strongly modulated by ENSO (e.g., [
15,
16]), the major tropospheric variability originated through atmosphere ocean coupling. Different types of ENSO, based on spatial patterns of the Tropical Pacific sea surface temperature (SST), have been discussed in several studies [
17,
18,
19,
20,
21]. One is dominated by variability around the East Pacific, or EP type, (sometimes known as the Canonical ENSO) and the other is dominated by variability around the Central Pacific, or CP type (sometimes known as the Modoki ENSO). Research suggests that ENSO Modoki and Canonical ENSO have significant impacts on seasonal precipitation in several places around the world (Global: [
19,
22]; Pacific rim: [
23]; South China Sea: [
24]; Australia: [
25,
26,
27]; South America: [
23,
28]). It is discussed that EP ENSO shows basin-wide variation of several features and is mainly regulated by thermocline shifting [
29]. On the other hand, for CP ENSO, the variations in wind, and other atmospheric variables, are mainly localised around the central Pacific and atmospheric forcing plays the dominant role. Moreover, it also indicates an extratropical connection [
21,
29,
30,
31].
A recent study discussed that the precipitation changes around the Indian subcontinent, unexplained by SST, were likely due to the water vapour transport and were dominated by dynamic factors [
32]. With the increased SST, the moisture transported from oceans to interior land was likely redistributed and caused the complicated regional variability of precipitation. ISM ENSO teleconnection was also analysed, considering different types of ENSO, using an Atmospheric General Circulation Model (AGCM) [
33]. However, there is a lack of studies addressing the influences of dynamic factors on regional ISM precipitation, in various ENSO phases using a subsample of models. Studies relating to the regional ISM Index, in different ENSO phases, have not been performed to our knowledge using a subsample of model outputs. The proposed study focuses on those areas using a subsample of CMIP5 (5th phase of Coupled Model Inter-comparison Project) model outputs.
CMIP5 is a latest collaborative effort among various groups of modelling communities around the world,
i.e., those who are concerned with similar experiments [
34]. It replaced the CMIP3 (3rd Phase of Coupled Model Inter-comparison Project) and the details of CMIP5 are elaborately documented [
35]. The CMIP5 models are much improved, and include an interactive ocean. These are capable of simulating ENSO-like variability in the tropical Pacific and have simulated the interannual variability in the Central and Eastern equatorial Pacific with realistic amplitude [
36]. More CMIP5 models show a realistic range of ENSO frequencies in the 2–7 year band, in the eastern equatorial Pacific, compared with the CMIP3 group of models. Moreover, SST anomalies, which peak during November to January as seen in observations, are present in approximately half of the CMIP5 models [
36]. It is expected that CMIP5 models are better equipped to capture ENSO-related teleconnection features. Using CMIP3 and CMIP5 models, ISM precipitation is discussed in detail, including related teleconnections with ENSO [
37]. They also showed that the climatology of ISM is well captured in a number of models, matching reasonably well with observations.
The current study tries to explore areas of regional ISM precipitation and related teleconnection, in various categories of ENSO phases, analysing the CMIP5 model outputs. The main objective is to investigate various fields that could better represent regional characters of the ISM, correlating well with the regional precipitation. This could lead to the proposal of alternative regional ISM indices and has implication for improving understanding of regional monsoons in ENSO phases.
Section 2 covers Methodology and Data. It describes how different ENSO subcategories are defined and how those ENSO years are chosen. It also described sources of different data used in the study and discusses the CMIP5 models. Results are noted in
Section 3. The important influences on ISM, region-wide, are discussed considering wind fields and tropical Pacific SST. How such behaviour is captured among models, in different ENSO phases, is the main focus. The first part of
Section 3 focuses on the CNE region and the subsequent three parts cover the H, NW and S regions. The last part of section three includes a general discussion. Conclusions are described in
Section 4.
2. Methodology and Data
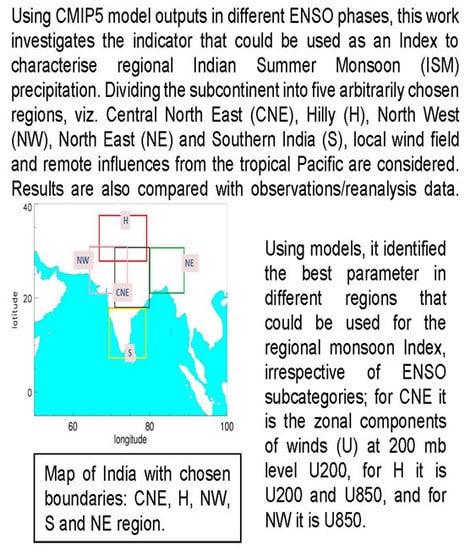
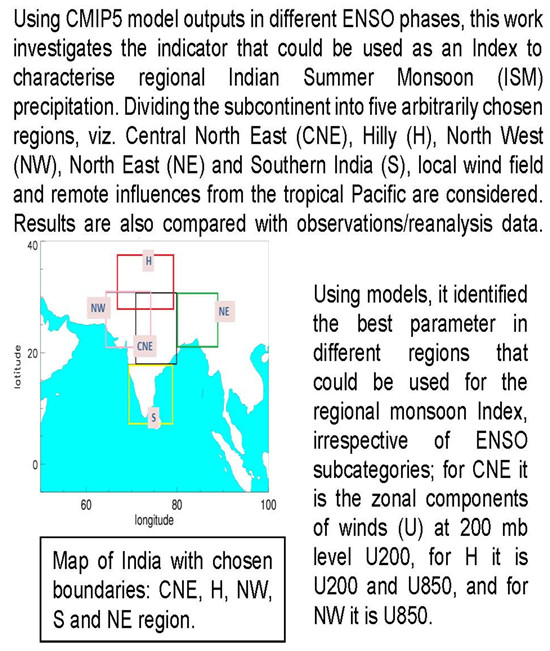
In
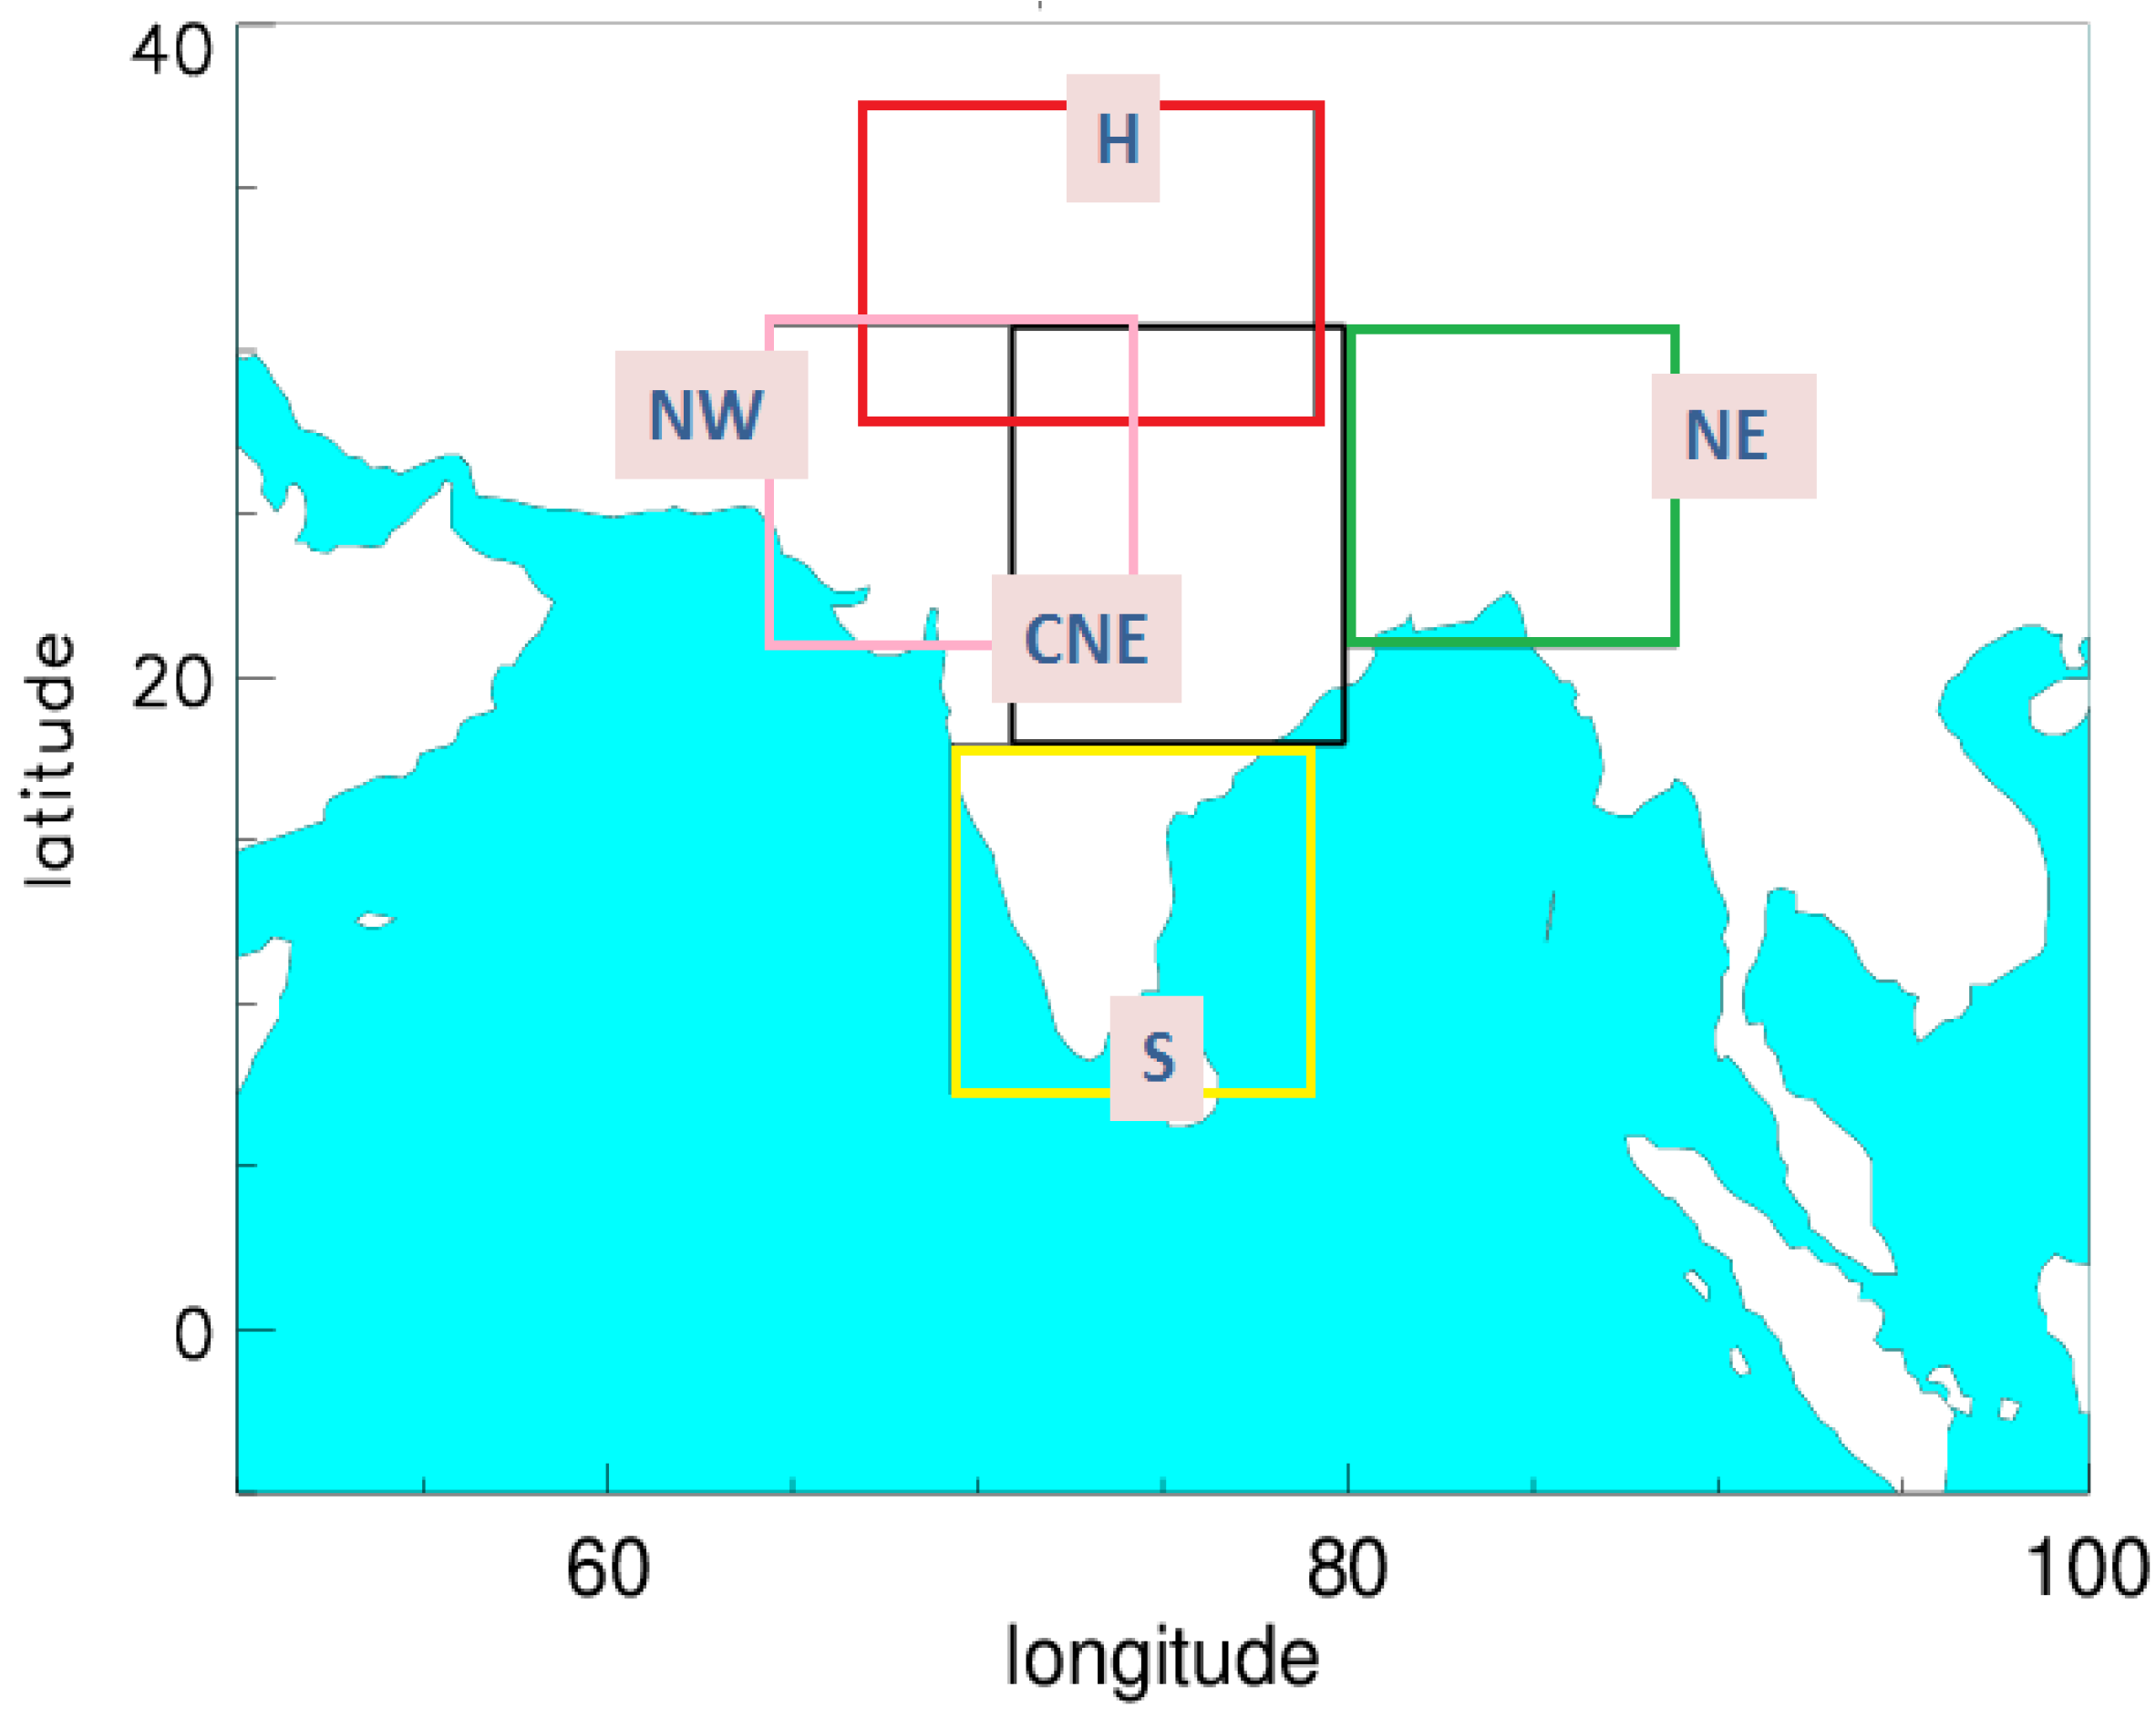
Figure 1, the map of the Indian subcontinent is presented, where various monsoon regions arbitrarily chosen in this analysis are marked with boxes. In choosing those areas, we kept in mind that each region should be at least 10 degrees wide both longitude-wise and latitude-wise. Because of such a demarcation, there was overlap among regions; however, we thought such a limit would help capture regional variability better, both in observations and modelling. The corresponding latitude and longitude of those boxes are mentioned here by name:
CNE (Central North East India): (18°N–31°N, 86°E–75°E);
H (Hilly region of India): (28°N–38°N, 85°E–70°E)
NW (North West India): (21°N–31°N, 79°E–67°E)
S (Southern India): (18°N–7°N, 73°E–85°E)
NE (North East India): (21°N–31°N, 86°E–97°E)
Figure 1.
Map of Indian subcontinent demarcating various arbitrarily chosen boundaries: Central North East (CNE), Hilly (H), North West (NW), South (S) and North East (NE) regions of India.
Figure 1.
Map of Indian subcontinent demarcating various arbitrarily chosen boundaries: Central North East (CNE), Hilly (H), North West (NW), South (S) and North East (NE) regions of India.
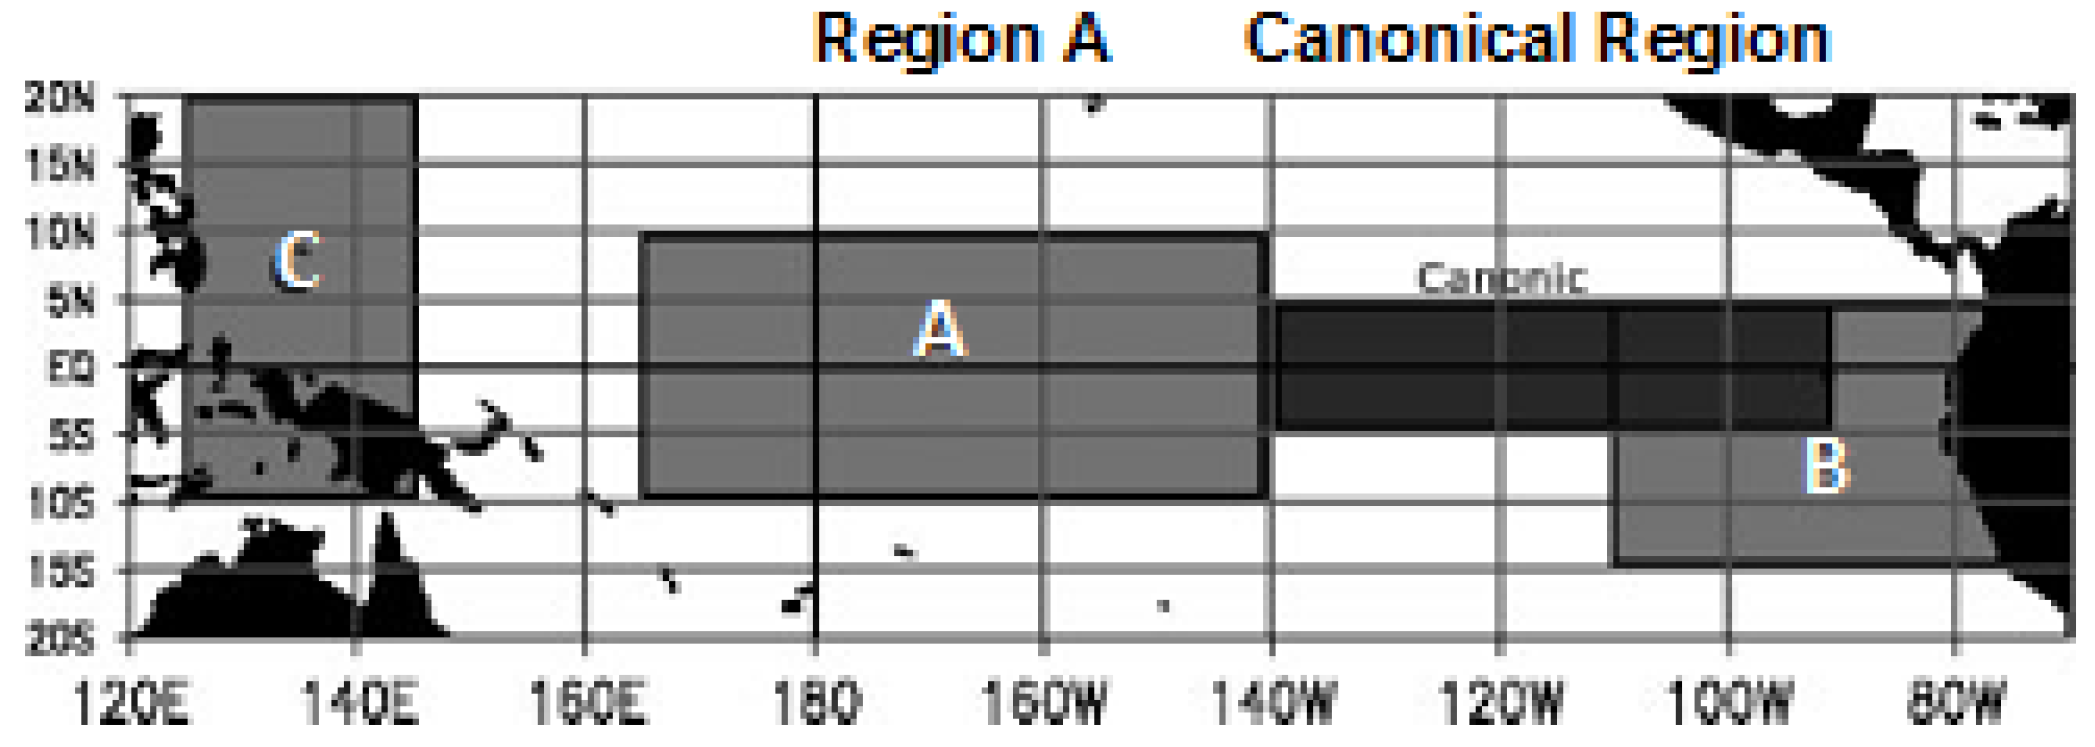
Different types of ENSO were defined considering conditions of SST around different places of the Tropical Pacific and presented in
Figure 2. Four different regions were considered, covering areas as follows: Canonical Region (90°W–140°W, 5°N–5°S), Region A (165°E–140°W, 10°S–10°N), Region B (110°W–70°W, 15°S–5°N) and Region C (125°E–145°E, 10°S–20°N). Anomalous SSTs (SSTA) are calculated in those regions.
The ENSO Modoki Index (EMI) is proposed by [
19], which can be written as:
This Index considers an increase in temperature around region A (ISSTAI
A), with a substantial decrease around region B (ISSTAI
B) and C (ISSTAI
A) (
Figure 2). Different types of ENSOs are defined [
19,
21,
29] that consider the EMI Index and the SSTA of the Canonical region as follows:
ENSO Modoki (ENM/LNM): If EMI is greater than 0.7σM, then σM is the standard deviation of EMI.
ENSO Canonical (ENC/LNC): If the SSTA in the Canonical region is greater than 0.7σC, σC is the standard deviation of season in that region.
ENSO Canonical and Modoki (ENCM/LNCM): If ENSO satisfies both the Canonical and Modoki criteria.
There is a discussion [
28] that by using the EMI Index, as defined above, some years having a strong SSTA in region B or C could be characterized as Modoki ENSO, even if the SSTA in the Central Pacific (region A) was not high. For e.g., the years 1997/1998, which are known as strong El Niño years, would be classified as a La Niña Modoki. Therefore, they slightly modified that definition for the Modoki Index and according to them, for the Modoki feature, region A should also be accompanied by large SST anomalies, exceeding a standard deviation of 0.7. We followed that definition of Modoki here. The years that satisfy the respective criteria of the specific ENSO pattern are marked as ENSO Modoki (ENM/LNM), Canonical ENSO (ENC/LNC) and ENSO Canonical and Modoki (ENCM/LNCM) years. Here, we consider only the months of June-July-August (JJA) for the current analysis of ISM rainfall.
Figure 2.
Various regions of Tropical Pacific are used to define different types of ENSO.
Figure 2.
Various regions of Tropical Pacific are used to define different types of ENSO.
Different observational/reanalyses data and model outputs were used, including ISM precipitation, tropical Pacific SST and zonal and meridional component of winds at 200 mb and 850 mb. Model outputs from CMIP5 [
35] during the period 1861-2005 were analysed. The CMIP5 Models considered here are (altogether 33 models) shown in
Table 1. One ensemble member from each model is included. For ISM precipitation, observational data from the Global Precipitation Climatology Project (GPCP) were used, which are discussed in detail by [
38,
39]. Data from over 6000 rain gauge stations, and satellite geostationary and low-orbit infrared, passive microwave, and sounding observations were merged to estimate monthly rainfall from 1979 to the present. The careful combination of satellite-based rainfall estimates provides the most complete analysis of rainfall available to date over the global oceans, and adds necessary spatial detail to the rainfall analyses over land. In addition to the combination of these data sets, estimates of the uncertainties in the rainfall analysis are provided as a part of the GPCP products. Observational data of SST used here are from the Met Office Hadley Centre Sea Ice and Sea Surface Temperature (HadISST) data set and discussed in detail by [
40]. They replace the Global sea Ice and Sea Surface Temperature (GISST) data set, and are a unique combination of monthly global-complete fields of SST and sea ice concentration on a 1 degree latitude-longitude grid from 1870 to date. For atmospheric zonal and meridional components of wind velocity at the 200 mb and 850 mb level, we used the ERA Interim (ECMWF (European Centre for Medium Range Weather Forecasts) Reanalysis Interim [
41]) data set from 1979 to present.
For each model and observed/reanalysis product, the average value of various meteorological parameters (precipitation, zonal and meridional wind at 200 mb and 850 mb) was calculated for five different chosen Indian regions (CNE, NE, NW, H and S), in various ENSO phases. The composites of the ENSO phases were then subtracted from the average of the whole record to indicate the anomaly value of that parameter in the respective ENSO phases. Using those anomaly values, scatter plots are presented to identify any possible connections between regional precipitation and wind fields, which are well captured among various models. The local influences of wind on the regulation of regional ISM precipitation were considered. Using such scatter plots, it is possible to understand whether there are agreements among various models in analysing regional ISM precipitation in various ENSO phases. Similarly, the remote influences of wind and SST from the tropical Pacific, with respect to regulation of regional ISM precipitation, are also considered. Here, similar scatter plots are presented to show if there are good agreements among various models in different ENSO phases.
Table 1.
CMIP5 models used in this analysis with the name of the modelling centres and respective countries.
Table 1.
CMIP5 models used in this analysis with the name of the modelling centres and respective countries.
| Modelling Centres, Country | CMIP5 Model Names |
|---|
| CSIRO-BOM, Australia | ACCESS1.0
ACCESS1.3 |
| BCC, China | BCC-CSM1.1
BCC-CSM1.1 (m) |
| GCESS, China | BNU-ESM |
| CCCMA, Canada | CanESM2 |
| NCAR, USA | CCSM4 |
| NSF-DOE-NCAR, USA | CESM1-BGC
CESM1-CAM5 |
| CMCC, Italy | CMCC-CESM
CMCC-CM
CMCC-CMS |
| CNRM-CERFACS, France | CNRM-CM5 |
| CSIRO-QCCCE, Australia | CSIRO-Mk3.6.0 |
| FIO, China | FIO-ESM |
| NOAA-GFDL, USA | GFDL-CM3
GFDL-ESM2G
GFDL-ESM2M |
| NASA-GISS, USA | GISS-E2-R |
| MOHC, England | HadGEM2-AO
HadGEM2-CC
HadGEM2-ES |
| INM, Russia | INM-CM4 |
| IPSL, France | IPSL-CM5A-LR
IPSL-CM5A-MR |
| MIROC, Japan | MIROC5
MIROC-ESM
MIROC-ESM-CHEM |
| MPI-M, Germany | MPI-ESM-LR
MPI-ESM-MR |
| MRI, Japan | MRI-CGCM3 |
| NCC, Norway | NorESM1-M
NorESM1-ME |
The results from our analyses are similar with or without trends, suggesting that trends play a nominal role in the current study. Moreover, using either shorter or longer periods, we found there are similarities between results with respect to the ENSO phases, in models as well as observation. The same was true for the precipitation composites, suggesting different time periods used in this study are not likely to alter our main findings. However, it is noteworthy that chosen periods can sometimes alter the results of some analyses [
15,
42].
3. Results
To study local atmospheric or remote influences of the tropical Pacific on regional ISM precipitation, we carried out the following analyses using data from the CMIP5 models and observations. From the wind velocity, the meridional component (V) and zonal components (U) were considered from the five typical regions described in
Figure 1. The average value of the local wind field at both levels,
i.e., 200 mb (U200, V200) and 850 mb (V200, V850), were calculated alongside the amount of average precipitation in regions CNE, S, NW, S and NE in various ENSO phases. The precipitation (mm/day) (X axis)
vs. wind (m/s) (Y axis) fields are presented in forms of a scatter diagram, considering various CMIP5 models. In all schematics, La Niña years are shown by blue (LNC), green (LNM) and cyan (LNCM), whereas, El Niño years are shown by red (ENC), pink (ENM) and yellow (ENCM). In each diagram, observations are also presented and shown with the large same coloured diamond, following their category. If the models are in agreement with observations, then those diamonds are often seen to be masked in the schematics.
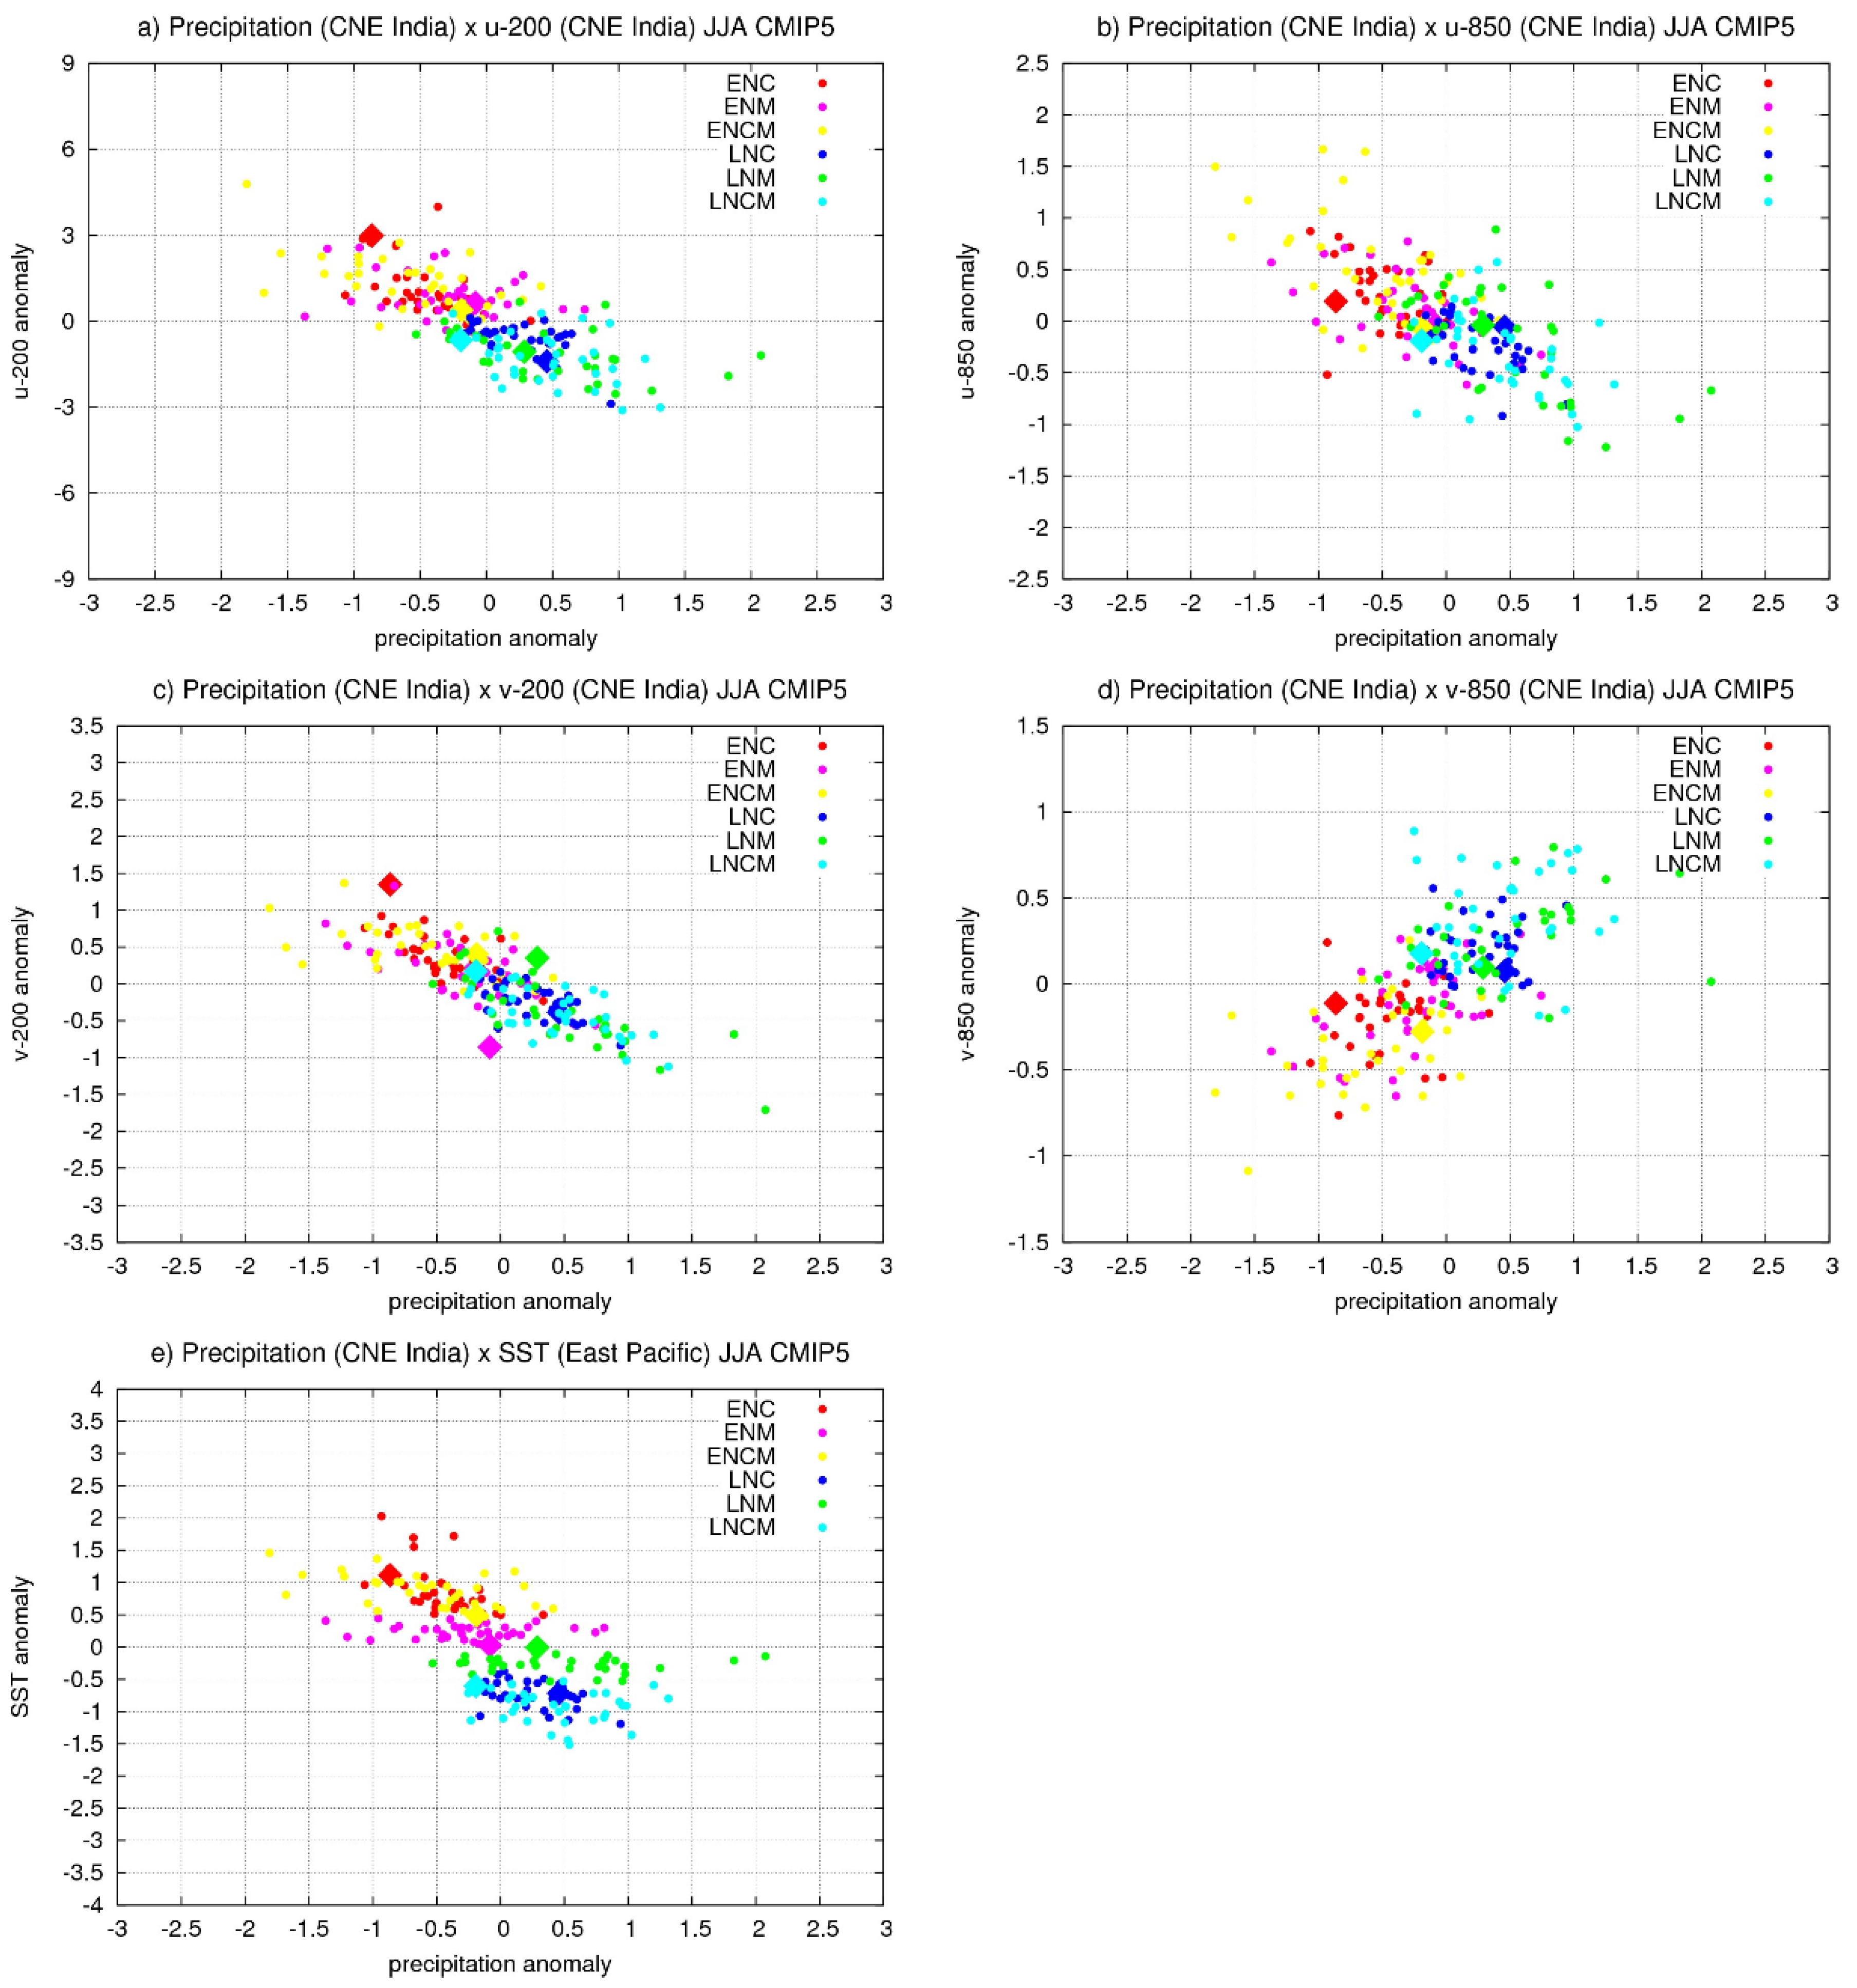
Figure 3.
CNE Region: ISM precipitation (mm/day) vs. various fields. Precipitation vs. local atmospheric influence of wind (m/s) is shown for U200 (a); U850 (b); V200 (c) and V850 (d). Precipitation vs remote influence from East Tropical Pacific SST (°C) is also shown (e).
Figure 3.
CNE Region: ISM precipitation (mm/day) vs. various fields. Precipitation vs. local atmospheric influence of wind (m/s) is shown for U200 (a); U850 (b); V200 (c) and V850 (d). Precipitation vs remote influence from East Tropical Pacific SST (°C) is also shown (e).
Similar plots were drawn with remote forcing from the tropical Pacific, via wind or sea surface temperature (SST). If the model results indicated good correspondence or correlation between wind fields (local/remote) and SST (remote) with regional ISM precipitation, then those plots were considered and are presented in
Figure 3 (for CNE region),
Figure 4 (for H region),
Figure 5 (for NW region) and
Figure 6 (for S region). The fields showing good correspondence with regional precipitation are also depicted in
Table 2 (1st row—CNE region, 2nd row—H region, 3rd row—NW and 4th row—S). In
Table 2, the nature of the correlation, if identified among models, was also mentioned. For the NE region, it was not possible to find good correspondence among model results and hence we did not include this region in
Table 2. Following analyses based on
Table 2,
Table 3 further notes the values of the correlation coefficient (c.c.) between regional ISM precipitation and local wind fields, in different subcategories of ENSO phases. The last column of
Table 3 shows that models suggest good correspondence between regional ISM precipitations with certain local wind fields in ENSO phases, when all ENSO subcategories are combined together. The level of significance of such correlations is significant up to the 99% level and marked in bold in
Table 3. Now, we discuss each region separately to identify which field could be a better estimate of local precipitation, using mainly models and cases where models match observations.
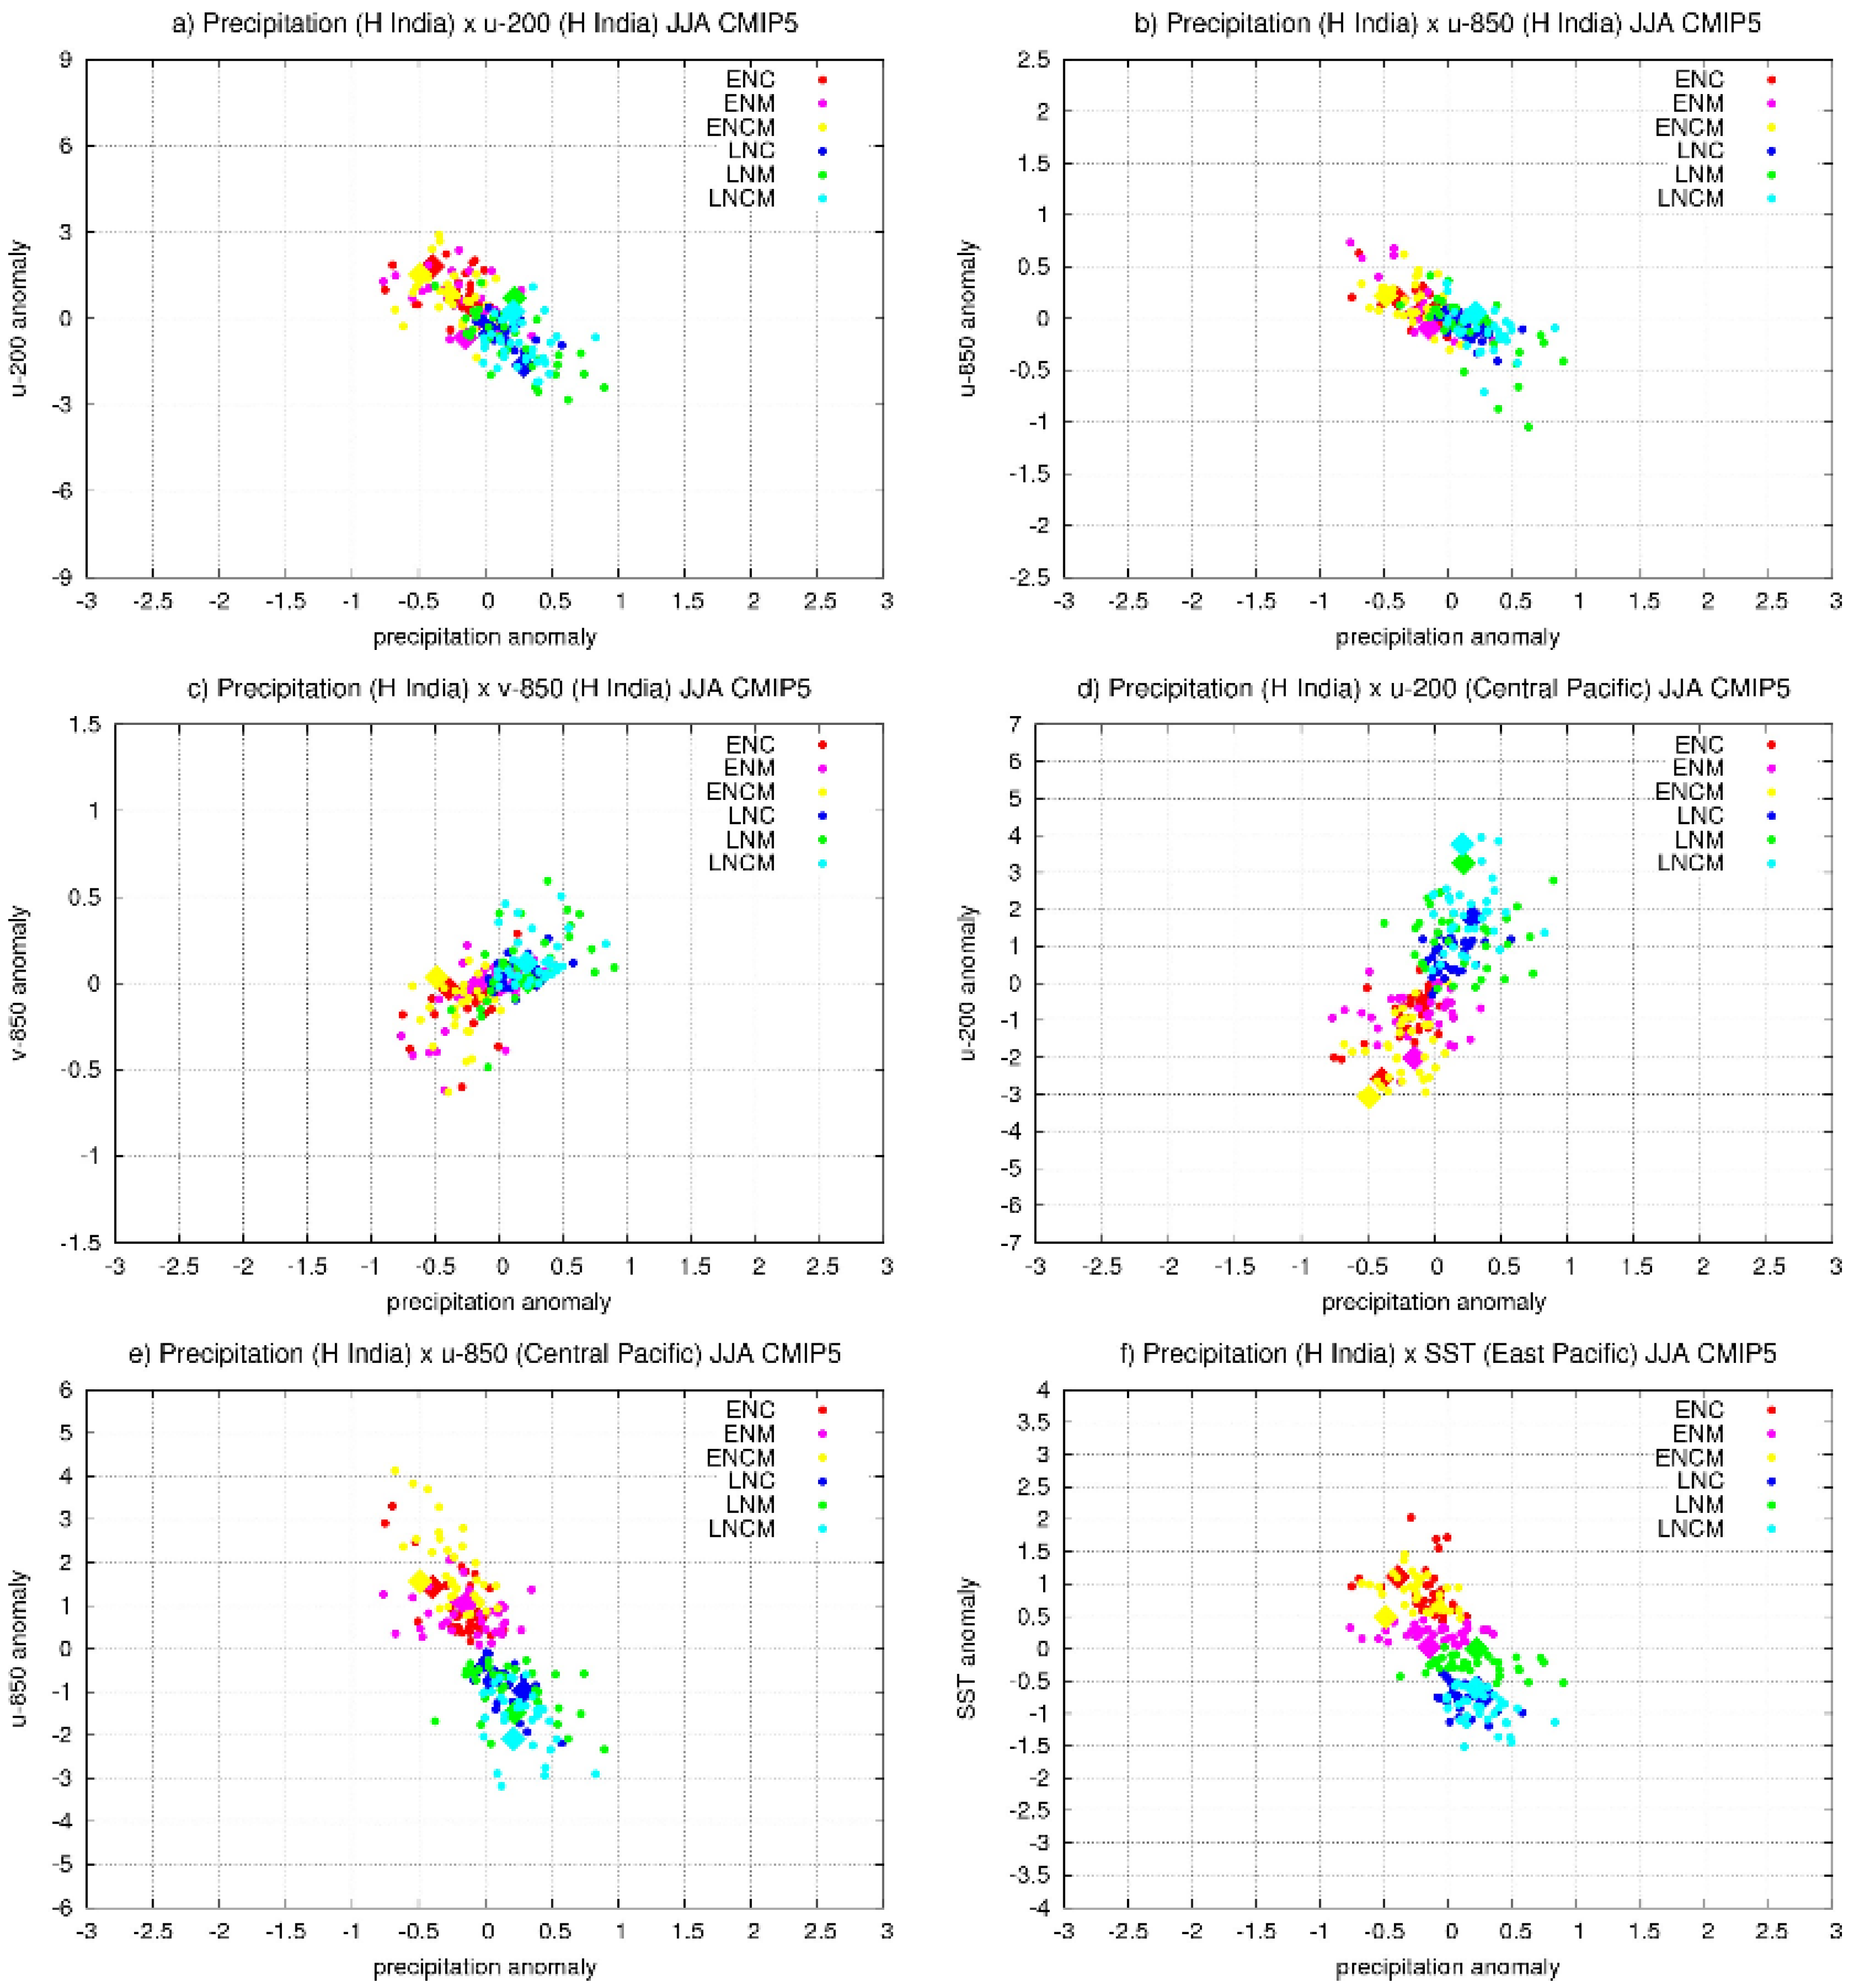
Figure 4.
H Region: ISM precipitation (mm/day) vs. various fields. Precipitation vs. local atmospheric influence of wind (m/s) is shown for U200 (a); U850 (b) and V850 (c). Precipitation vs. remote influence from Central Pacific (U200 (d); U850 (e)); and East Tropical Pacific SST (°C) are also shown (f).
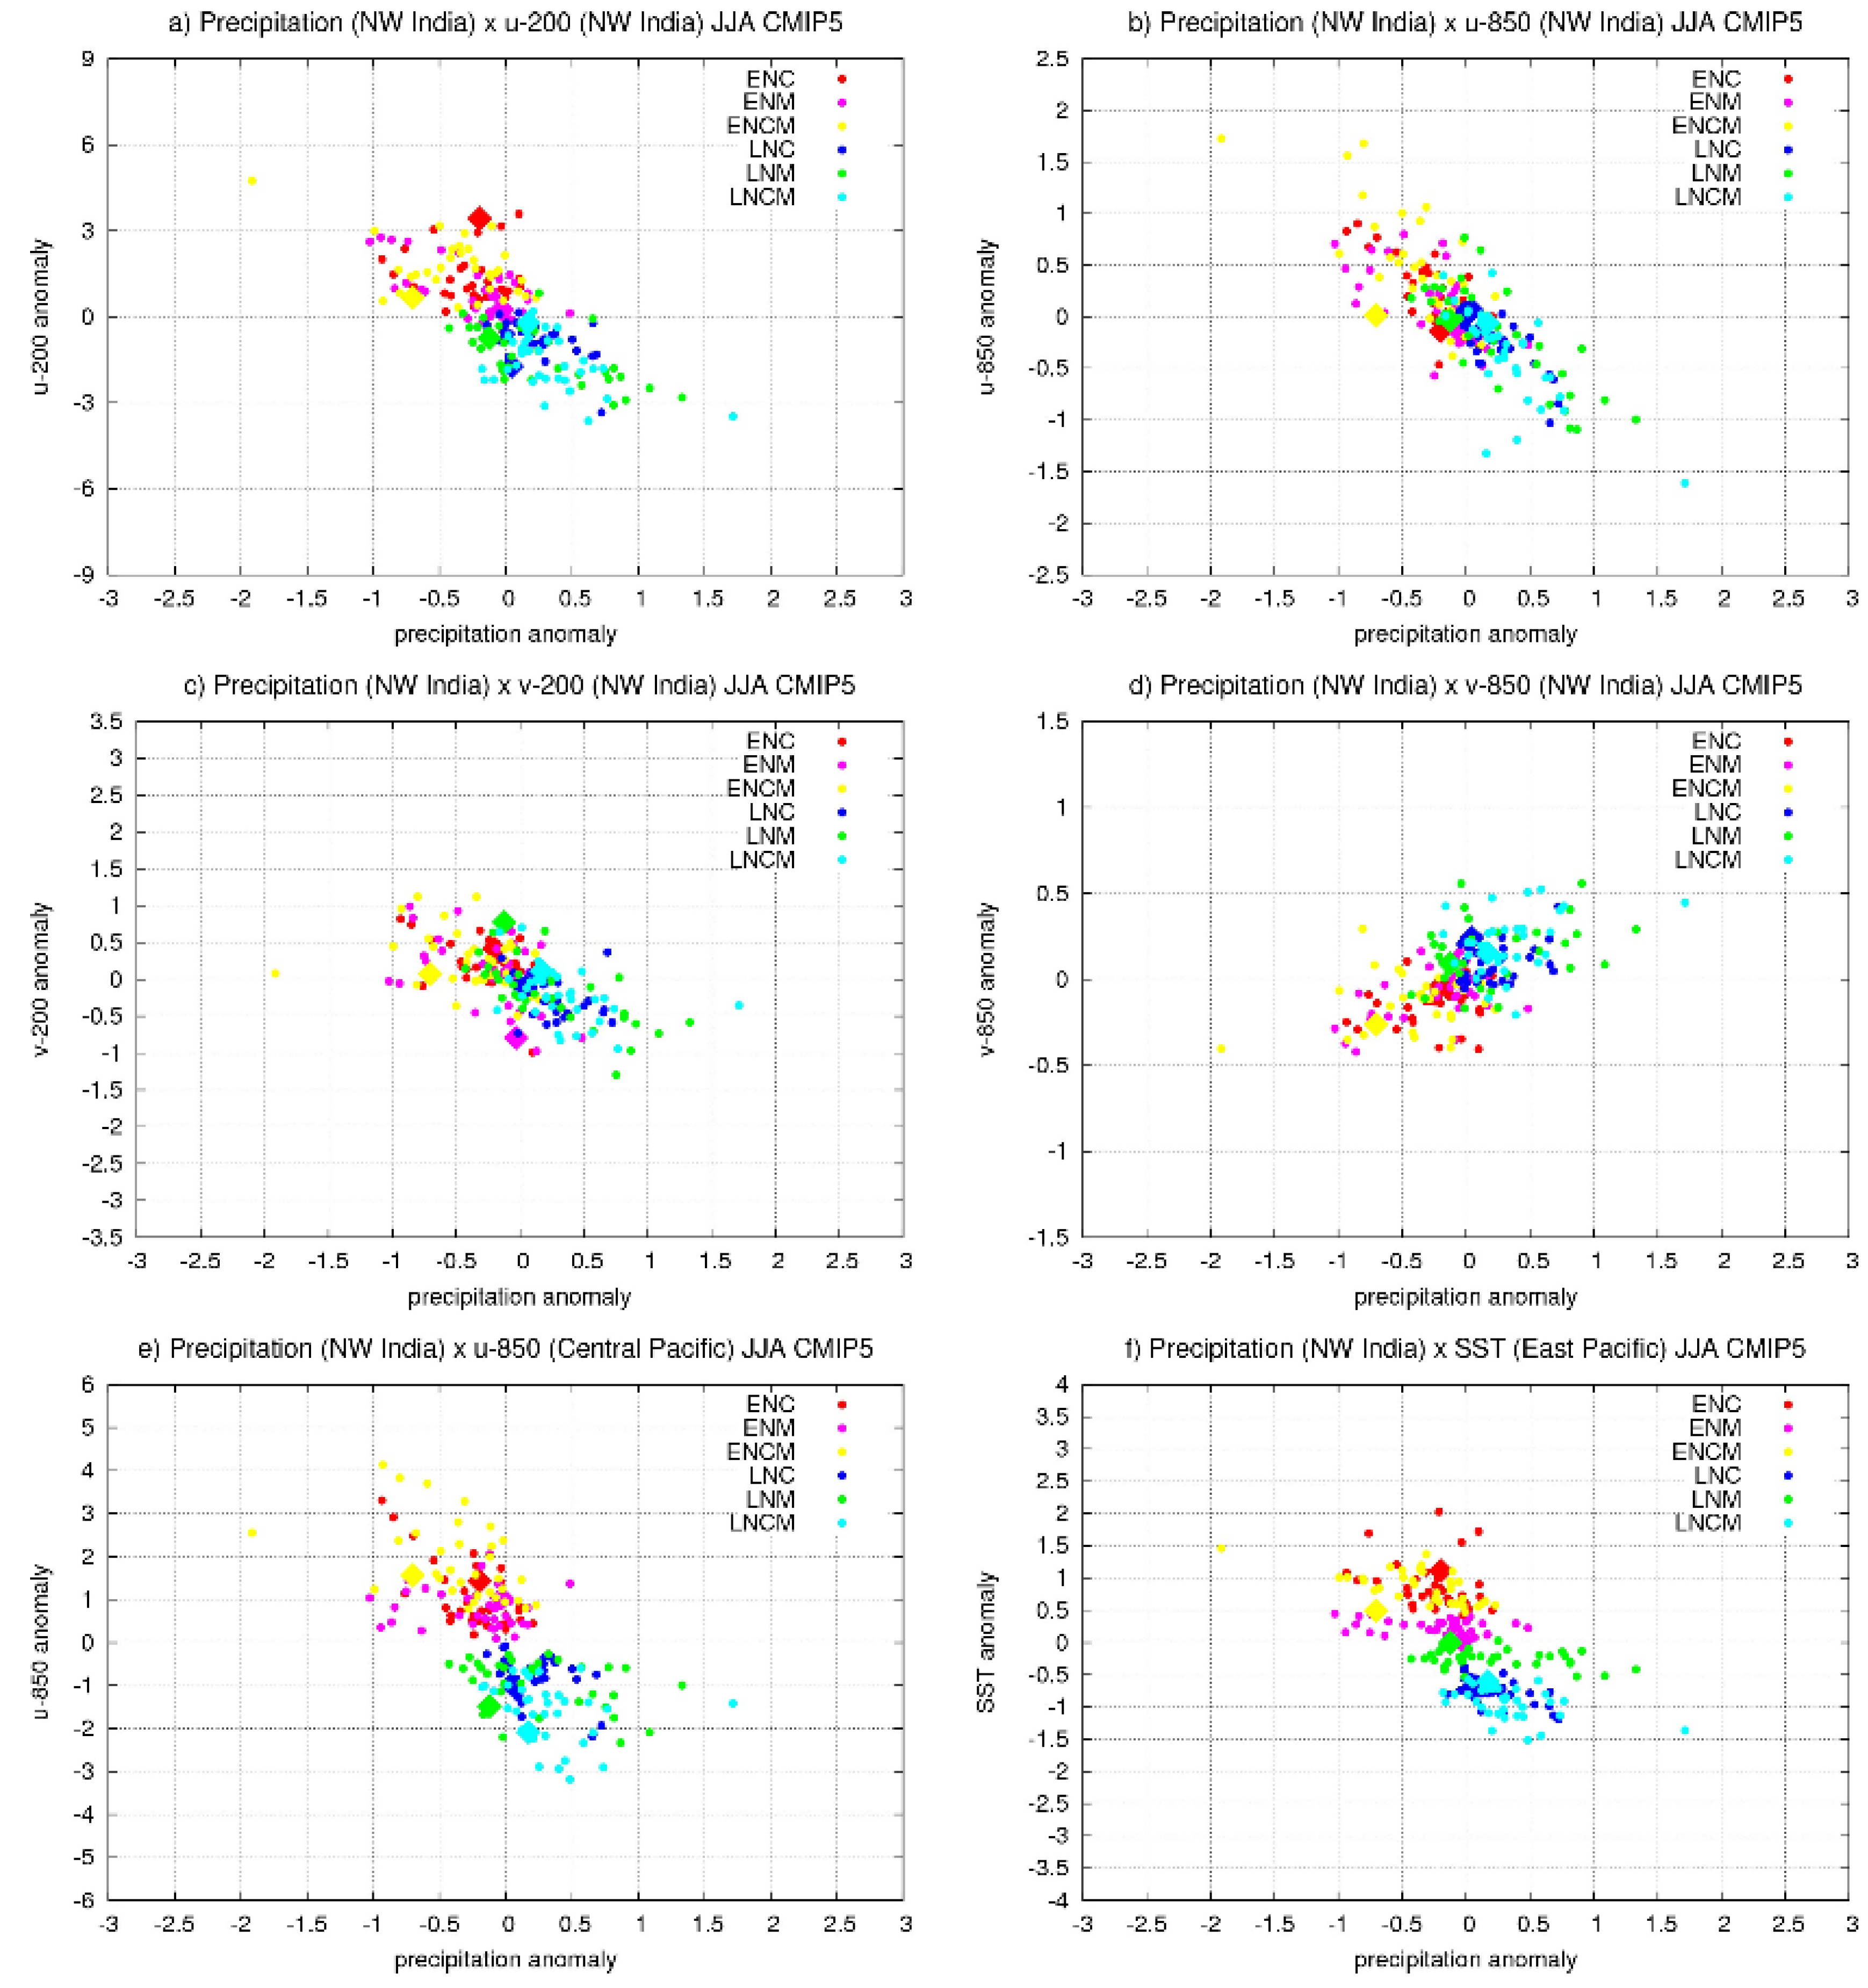
Figure 5.
NW Region: ISM precipitation (mm/day) vs. various fields. Precipitation vs. local atmospheric influence of wind (m/s) is shown for U200 (a); U850 (b), V200 (c) and V850 (d). Precipitation vs. remote influence from Central Tropical Pacific U 850 (e) and East Tropical Pacific SST (°C) (f) are also shown.
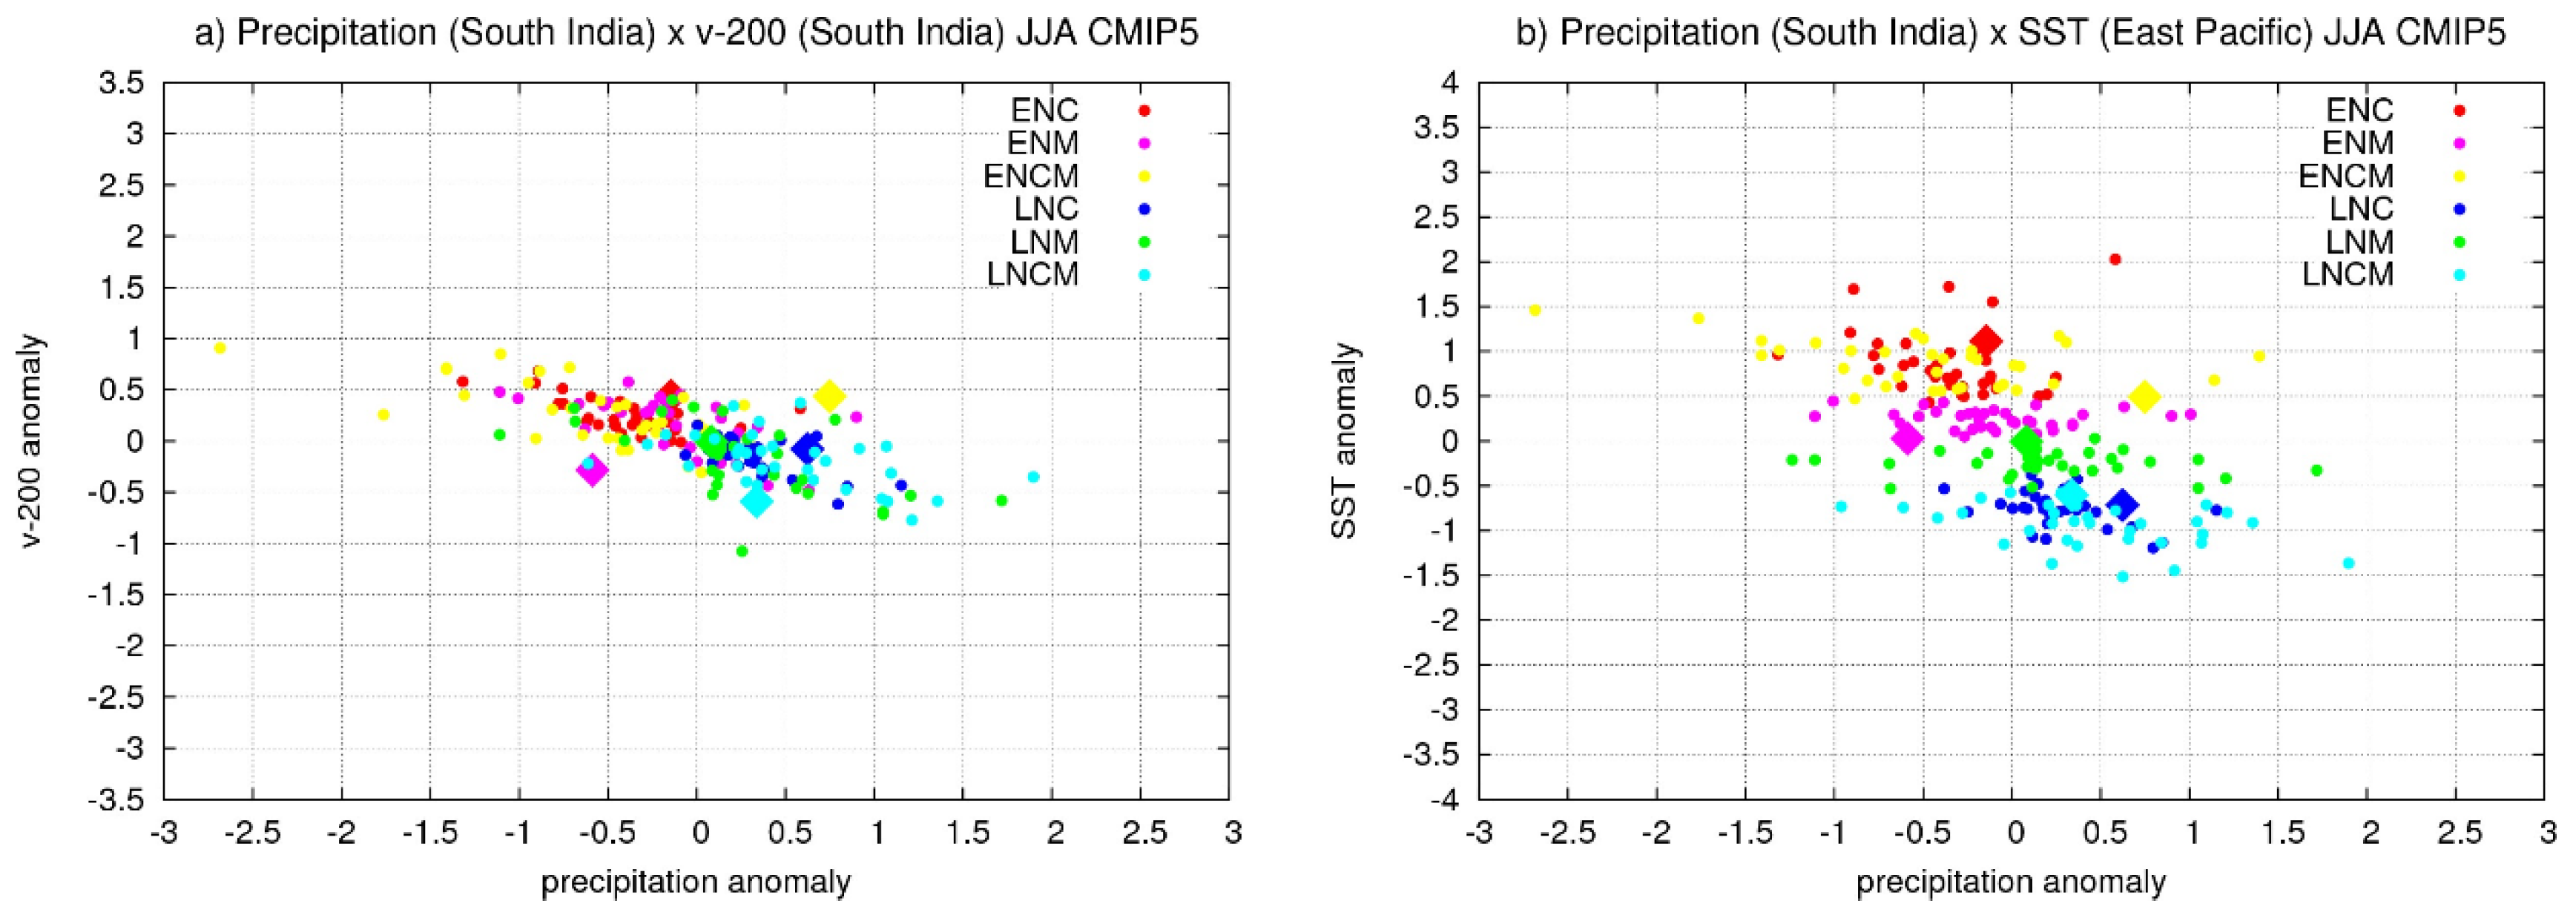
Figure 6.
S Region: ISM precipitation (mm/day) vs. various fields. Precipitation vs. local atmospheric influence of wind (m/s) is shown for V200 (a). Precipitation vs. remote influence from East Tropical Pacific SST (°C) (b) is also shown.
Figure 6.
S Region: ISM precipitation (mm/day) vs. various fields. Precipitation vs. local atmospheric influence of wind (m/s) is shown for V200 (a). Precipitation vs. remote influence from East Tropical Pacific SST (°C) (b) is also shown.
Table 2.
Influence on local precipitation via local wind or from remote regions (tropical Pacific).
Table 2.
Influence on local precipitation via local wind or from remote regions (tropical Pacific).
| Region | Local Influence (Wind Correlation ) | Remote Influence (Wind Correlation) | Remote Influence (SST Correlation) |
|---|
CNE
(Figure 3) | | | −ve (Figure 3e) |
H
(Figure 4) | | U200, +ve (Figure 4d)
U850, −ve (Figure 4e) | −ve (Figure 4f) |
NW
(Figure 5) | | U850, −ve (Figure 5e) | −ve (Figure 5f) |
S
(Figure 6) | | | Little −ve (large std.dev) (Figure 6b) |
| Comments | Except for the NE region—no good correspondence with any wind field | Only CP region shows remote wind influence, but not EP region. Blank indicates no influence. | Only EP region shows remote SST influence, but not CP region. |
Table 3.
Correlation of regional ISM precipitation with local wind fields in different ENSO phases.
Table 3.
Correlation of regional ISM precipitation with local wind fields in different ENSO phases.
| Region | Local Wind Fields | Precipitation Correlation |
|---|
| ENC ENM ENCM | LNC LNM LNCM | Total (EN and LN) |
|---|
| CNE | | −0.49 −0.28 −0.54 | −0.58 −0.55 −0.41 | −0.76 |
| −0.45 −0.59 −0.55 | −0.55 −0.66 −0.45 | −0.72 |
| −0.69 −0.68 −0.55 | −0.60 −0.77 −0.60 | −0.83 |
| +0.16 +0.50 +0.48 | +0.15 +0.46 −0.02 | +0.68 |
| H | | −0.28 −0.57 −0.23 | −0.55 −0.78 −0.12 | −0.72 |
| −0.64 −0.80 −0.44 | −0.60 −0.68 −0.46 | −0.72 |
| +0.51 +0.63 +0.39 | +0.51 +0.48 +0.15 | +0.64 |
| NW | | −0.20 −0.66 −0.49 | −0.57 −0.73 −0.45 | −0.75 |
| −0.82 −0.65 −0.80 | −0.80 −0.80 −0.82 | −0.84 |
| −0.49 −0.47 −0.30 | −0.35 −0.66 −0.43 | −0.61 |
| +0.20 +0.50 +0.20 | +0.40 +0.36 +0.33 | +0.61 |
| S | | −0.66 −0.60 −0.67 | −0.65 −0.61 −0.49 | −0.74 |
3.1. Precipitation in CNE
For the CNE region, there were influences from the local wind field as well as from remote SST; the results are presented in
Figure 3. Precipitation was influenced by the local wind field, zonal as well as meridional wind, at both the 200 mb and 850 mb levels. Here, various scatter plots are presented that indicate ISM precipitation in the CNE region
vs. local atmospheric influence for U200 (
Figure 3a), U850 (
Figure 3b), V200 (
Figure 3c) and V850 (
Figure 3d). The influence on regional ISM precipitation remotely via East Tropical Pacific SST is presented in
Figure 3e. The fields showing good correspondence with regional CNE precipitation in the models are also depicted in
Table 2 (1st row).
Local Influence: Focusing on local influences, let us begin with
Figure 3a. It agrees well with the known relationship between ENSO and ISM precipitation. The La Niña in general suggests more precipitation (shown by blue, cyan and green); whereas the El Niño indicates less (shown by red, orange and yellow). It is also noticed that during the El Niño, U200 is positive, but negative for La Niña, indicating a change in direction of the Walker circulation. Moreover, it suggests that precipitation in the CNE region is generally negatively correlated with the local zonal eastward velocity at 200 mb (U200). Model results thus show consistencies, and are in accordance with the known mechanism of EN and LN and directions of the Walker circulation. As is seen from
Figure 3a, observations also match with the model results. This could be one reason for proposing the WYM Index [
7] that takes U200 into account.
Figure 3b, which uses U850, again suggests a negative correlation, though here the standard deviation among models is larger compared with the former (
Figure 3a). For
Figure 3b, the value of the correlation coefficient (c.c.) was reduced to −0.72 from −0.76, as noted for
Figure 3a (
Table 3, last column). Model results are also found within the range of observations. For V200 (
Figure 3c), models show very strong correlation (−0.83,
Table 3, last column), though for some EN, there is deviation between the observed and modelled range. U200 (
Figure 3a) and V200 (
Figure 3c) both suggest a stronger correlation (−0.76 and −0.83, respectively,
Table 3) compared to other fields, which could be an indication that around CNE, upper level features are captured relatively well in the models. However, in the CNE region, the best estimate for precipitation is U200. For the CNE region, U200, U850, V200 and V850 all suggest good correspondence with precipitation, but V850 (
Figure 3d) shows a positive correlation, which is associated with the largest standard deviation (c.c. +0.68,
Table 3). Here, a positive correlation suggests a northward meridional velocity for La Niña, but a southward one for El Niño. Such analyses, based on El Niño/La Niña phases are also useful for wind-related renewable energy studies for maximising business profits.
Remote Influence: The remote influence from the tropical Pacific is considered with a particular focus on the east and central Pacific region. Wind velocities at 200 mb and 850 mb are considered alongside SST around those places. The Central Pacific region does not show any consistent influence on the CNE region among the models. However, SST around the east Pacific shows a negative correlation with regional precipitation around CNE (
Figure 3e), which is captured well among the models. The negative correlation indicates more precipitation (here La Niña, shown by blue, green cyan) when SST around the east tropical Pacific is negative and vice versa, which agrees well with an usual ENSO and ISM connection.
3.2. Precipitation in H
For the H region, there are influences from local as well as remote wind fields, and also from remote SST, as presented in
Figure 4a–f. Various plots are shown indicating ISM precipitation
vs. local atmospheric influence for U200 (
Figure 4a), U850 (
Figure 4b), V850 (
Figure 4c); remote influence from Central Pacific via U200 (
Figure 4d) and U850 (
Figure 4e); and remote influence from East Tropical Pacific SST (
Figure 4f). The fields showing good correspondence with regional H precipitation are also depicted in
Table 2 (2nd row).
Local Influence: For the H region, the best parameters for rainfall estimation could be U200, U850 and V850, and the respective c.c. for the ENSO phases are −0.72, −0.72 and +0.64 (
Table 3, last column). For U200 and U850, there is agreement with the WYM Index [
7], who consider these two parameters in the definition of their Index. V850 agrees with the EIMR Index as proposed by [
14].
Remote Influence: The H region shows a remote influence from the central tropical Pacific via atmospheric fields. The strength of the Walker circulation as defined by U200 and U850 around the central Pacific influences precipitation in the H region (
Figure 4d,e). It was discussed that EP ENSO is mainly regulated by thermocline shifting and captures basin-wide variation of several features [
29]. Agreeing with that,
Figure 4f shows SST in that location can indicate known negative correlation with ISM precipitation, which is consistently captured among models in the ENSO phases. For CP ENSO, atmospheric forcing plays the dominant role and the variation in wind is mainly localised around the central Pacific [
29]. It is believed to be the same mechanism that could regulate regional ISM precipitation through atmospheric zonal components of the wind field feature around the central tropical Pacific.
Figure 4 indicates that in the H region, observations usually match model results.
3.3. Precipitation in NW
For the NW region, there are influences from local as well as remote wind fields, and also from remote SST as presented in
Figure 5a–f. Various plots are shown, indicating ISM precipitation
vs. local atmospheric influence (for U200 (
Figure 5a), U850 (
Figure 5b), V200 (
Figure 5c), V850 (
Figure 5d)), remote influence from Central Pacific (via U850 (
Figure 4e)) and East Tropical Pacific (via, SST (
Figure 4f)). The fields showing good correspondence with precipitation in the NW region among models are also presented in
Table 2 (3rd row) with respective c.c. in various ENSO phases (
Table 3).
Table 3 clearly suggests that the relationship, as identified between regional ISM and local wind fields in the models, is also captured well among various subcategories of ENSO phases, though strongest (99% significant) when all phases of ENSO are considered together.
Local Influence: Here, the best parameter for regional ISM precipitation could be the local U850 field (c.c. −0.84,
Table 3).
Remote Influence: The NW region also shows remote wind influence from the central tropical Pacific, though only for U850, as captured by the models. As noticed for other regions, east tropical Pacific SST influences precipitation in this region, and models show consistency.
3.4. Precipitation in S
For the S region, there are influences from local as well as remote SST, as presented in
Figure 6. Plots describing ISM precipitation
vs. local atmospheric influence for V200 are shown in
Figure 6a, while remote influence from the East Tropical Pacific via, SST (though large standard deviation) is shown in
Figure 6b. These two fields, indicating reasonably good correspondence with regional precipitation among models, are also presented in
Table 2 (4th row). Analyses with meridional wind at 200 mb (V200) indicate good correspondence among models (c.c. −0.74), but sometimes deviate from observations, as seen here for the El Niño situation. This might indicate some missing mechanism in the models.
3.5. Discussion
As also seen in
Table 3, U200, U850 and V850 suggest good correlation for all three regions of CNE, H and NW. These are consistent with the proposed WYM Index [
7], IM Index [
5,
6] and EIMR Index [
14]. For e.g., U200 and U850, agree with the WYM Index, which includes these two parameters in its definition. V850 agrees with the EIMR Index and also with the IM Index as discussed earlier. Hence, the current study not only suggests consistency among previous work, but also indicates the regional ISM Index and introduces model results in support.
Table 3 suggests that the relationship, as identified between regional ISM precipitation and local wind fields in the models, is also well captured among various subcategories of ENSO phases. Almost all the results are significant up to the 95% level, though the strongest (significant up to 99% level, last column) correspondence is noticed when all the ENSO phases are considered together.
In terms of remote influence from the Pacific, zonal wind components (U200, U850) from the central Pacific region show a consistent influence on regional ISM precipitation in the models only for the H and NW regions. It is seen that the remote influence of atmospheric contribution from the East Pacific plays an inconsistent role, as captured by models on regional ISM precipitation, but it is the SST that suggests a strong connection for regional precipitation.
NE India does not indicate anything clearly in this analysis, suggesting that the models do not agree well in capturing the useful mechanism. NE India, where the Meghalaya Hills are located, can be treated as a relatively separate region, with summer monsoon rainfall weakly correlated or out of phase with other parts of India [
43,
44]. The interaction between large-scale circulation and the local topography plays a crucial role in determining the spatial distribution of rainfall over that region [
45,
46]. Recent analyses indicate that the monsoon air masses reach Meghalaya mainly from the Bay of Bengal [
47] and the northern Bay of Bengal is an especially important source of the moisture there. The area receives high rainfall and shows large variability. The annual mean rainfall is approximately 2066 mm and the coefficient of variation is 8.6%, suggesting a large standard deviation. Relating to multiscale interaction with topography, its large spatiotemporal variation also results in difficulties in detecting trends [
10,
48].
It could be argued that the location of the H and NE regions are both close to hilly areas, but it is not clear why the results are so different. Moreover, it is unclear why the S region does not correlate well with the other parameters. This is mainly because topography plays an important role and models vary from each other in representing those features. For e.g., the NE region has a hilly area in the north, but it is also influenced by the Bay of Bengal in the South. By contrast, the H region is landlocked and only has the influence of a hilly area. For the S region, the influence from ocean is stronger, as three sides are covered by the Indian Ocean, Bay of Bengal and Arabian Sea. The different topography of these three regions is most likely cause to suggest different behaviour in the NE, H and S regions.
Here are few suggestions for further research based on the results of this study. For example, modelling groups can work together on improving the representation of topography in the NE and S regions. There are other areas where modelling groups need to pay attention, viz., to improve understanding of the mechanism part. For instance, using model, this study identified the best parameter in different regions that could be used for a regional monsoon Index, viz. U200 and/or U850. It indicates features relating to the Walker circulation and some regional ISM teleconnections are captured well by the models but the regional Hadley circulation needs improved representation. Analyses with V at 200 mb (V200) indicate that the upper branch of the Hadley circulation in regions CNE and S, while suggesting the best agreement among models in comparison with other fields, sometimes deviates from observations. This suggests there could be some missing mechanism that is inherent in all models relating to mid-latitude atmospheric connections. These are a few areas, among others, where modelling teams can work together. Such analyses, based on El Niño/La Niña phases are also useful for wind-related renewable energy studies for maximising business profits. Results using models can be investigated and developed further for the purpose of future prediction and planning.
4. Conclusions
Using CMIP5 model outputs in different ENSO phases, this work investigates the indicator that could be used as the best Index to characterise regional ISM precipitation. Here, results are also compared with observations/reanalysis data to pinpoint areas of shortcomings and agreements. For the CNE, H and NW regions, there is good correspondence among model results, between local precipitation and different local wind fields, viz., zonal wind (U) at both the 200 mb (U200) and 850 mb (U850) level and also the meridional wind component (V) at the 850 mb (V850) level. Such observations are independent of different subcategories of ENSO phases and models also show good correspondence with observations.
In the CNE and S regions, the meridional component of local velocity at the 200 mb level (V200) suggests the best correlation with regional precipitation among models. It is present irrespective of different subcategories of ENSO phases, though observations sometimes disagree. As such, disagreement is seen in the upper branch of the Hadley circulation, indicating extratropical influences, and though very uniformly captured among all models, suggests some important mechanism present in observations might be overlooked.
This analysis could identify the best parameter in different regions, using model results and observations that could be used to define a regional monsoon Index. For CNE it is U200, for H it is U200 and U850 and for NW it is U850. The current analysis fails to indicate anything about the NE region.
In terms of remote influence from the Pacific, the zonal wind components (U200 and U850) from the central Pacific region show a consistent influence on regional ISM precipitation in models for H and NW and it is independent of different subcategories of ENSO phases. However, when a similar remote influence of wind from the eastern Pacific region is examined, it fails to suggest uniformity among model results. It is found that the remote influence of the atmospheric contribution from the East Pacific plays an inconsistent role, as captured by models on regional ISM precipitation, but it is the SST that suggests a strong connection with regional precipitation.


