Article

Carbon Sequestration and Carbon Markets for Tree-Based Intercropping Systems in Southern Quebec, Canada

1
Department of Civil and Environmental Engineering, University of California, Davis, CA 95616, USA
2
Department of Natural Resource Sciences, McGill University, Ste. Anne de Bellevue, QC H9X 3V9, Canada
3
Département des Sciences Naturelles, Université du Québec en Outaouais, Ripon, QC J0V 1V0, Canada
4
Institut de Recherche en Biologie Végétale, Université de Montréal & Jardin botanique de Montréal, Montreal, QC H1X 2B2, Canada
5
Département de Biologie, Université de Sherbrooke, Sherbrooke, QC J1K 2R1, Canada
*
Author to whom correspondence should be addressed.
Atmosphere 2016, 7(2), 17; https://doi.org/10.3390/atmos7020017
Submission received: 20 November 2015 / Revised: 19 January 2016 / Accepted: 22 January 2016 / Published: 28 January 2016
(This article belongs to the Special Issue Land Carbon Sequestration and Climate: Present and Future)

Abstract

:
Since agriculture directly contributes to global anthropogenic greenhouse gas (GHG) emissions, integrating trees into agricultural landscapes through agroforestry systems is a viable adaptive strategy for climate change mitigation. The objective of this study was to evaluate the carbon (C) sequestration and financial benefits of C sequestration according to Quebec’s Cap-and-Trade System for Greenhouse Gas Emissions Allowances (C & T System) or the Système de plafonnement et d’échange de droits d’émission de gaz à effet de serre du Québec (SPEDE) program for two experimental 10-year-old tree-based intercropping (TBI) systems in southern Quebec, Canada. We estimated total C stored in the two TBI systems with hybrid poplar and hardwoods and adjacent non-TBI systems under agricultural production, considering soil, crop and crop roots, litterfall, tree and tree roots as C stocks. The C sequestration of the TBI and adjacent non-TBI systems were compared and the market value of the C payment was evaluated using the net present value (NPV) approach. The TBI systems had 33% to 36% more C storage than adjacent non-TBI systems. The financial benefits of C sequestration after 10 years of TBI practices amounted to of $2,259–$2,758 CAD ha−1 and $1,568–$1,913 CAD ha−1 for St. Edouard and St. Paulin sites, respectively. We conclude that valorizing the C sequestration of TBI systems could be an incentive to promote the establishment of TBI for the purpose of GHG mitigation in Quebec, Canada.

1. Introduction

Integrating trees into temperate agricultural landscapes through tree-based intercropping (TBI) systems offers several potential advantages, from increased crop productivity and stability under climate change, to optimization of inputs and resilience to disruption, to restoring soil and water quality and biodiversity [1,2]. Since agriculture directly contributes 10%–12% of global anthropogenic greenhouse gas (GHG) emissions [3], TBI systems that increase carbon (C) sequestration on farms can mitigate 26% of these GHG emissions [4]. Because trees and agricultural crops use resources differently, they can be complementary, often yielding more above-ground and below-ground C sequestration than the equivalent land use with monocultures of arable crops and forestry plantations [5,6,7].
Despite the potential for higher primary production and C sequestration in TBI systems than non-TBI systems, very few examples of commercial TBI systems exist in the temperate regions of Canada. In part, this is due to a historical segregation of commodities produced by the agricultural and forestry sectors but also reflects different economic models for these sectors, where agriculture is practiced on a fixed land base that produces annual economic returns with short amortization periods (five years or less). Given the uncertainties with respect to the future monetary value of lumber and other commodities produced after 10–20 years or longer from TBI systems, providing financial incentives based on quantifiable environmental benefits or ecosystem services such as C sequestration could promote adoption of TBI systems [8]. A promising incentive for farmers interested in TBI systems emerged in January 2012 with the implementation of Quebec’s Cap-and-Trade System (C & T) System or the Système de plafonnement et d’échange de droits d’émission de gaz à effet de serre du Québec (SPEDE). The SPEDE program was developed with the aim to reduce GHG emissions to 20% below 1990 levels by 2020, and was linked to California’s C market in January 2013 [9,10].
According to the SPEDE program, a “natural person” or individual and a “legal entity,” e.g., municipality, not subject to regulation, may voluntarily set up an account as “entities” or “participants” in the Compliance Instrument Tracking System Service [11]. A natural person may receive profits based on emissions units; the value of which is dictated by the Quebec government C market floor, i.e., $11.39 Canadian Dollar (CAD) per metric tonne CO2 equivalent (t−1 CO2e) in 2012–2014 [11]. This potential profit for a “natural person” may be a reasonable incentive for tree planting and could favor TBI establishment because afforestation has an estimated break-even price of $10 CAD per t CO2e in forests producing goods at a rate of 14 m3 ha−1 year−1 in southern Ontario, according to the C Budget Model of the Canadian Forest Sector [12]. The objective of this study was to evaluate the C sequestration and C payments according to the SPEDE program for two experimental 10-year-old TBI systems in southern Quebec, Canada. We estimated total C stored in the two TBI systems with hybrid poplar and hardwoods and adjacent non-TBI systems in agricultural production, considering soil, crop and crop roots, litterfall, tree and tree roots as components of the C stock. The C sequestration of the TBI and adjacent non-TBI systems were compared, and the financial benefits of C sequestration were evaluated using the net present value (NPV) approach.

2. Results and Discussion

2.1. Carbon Sequestration
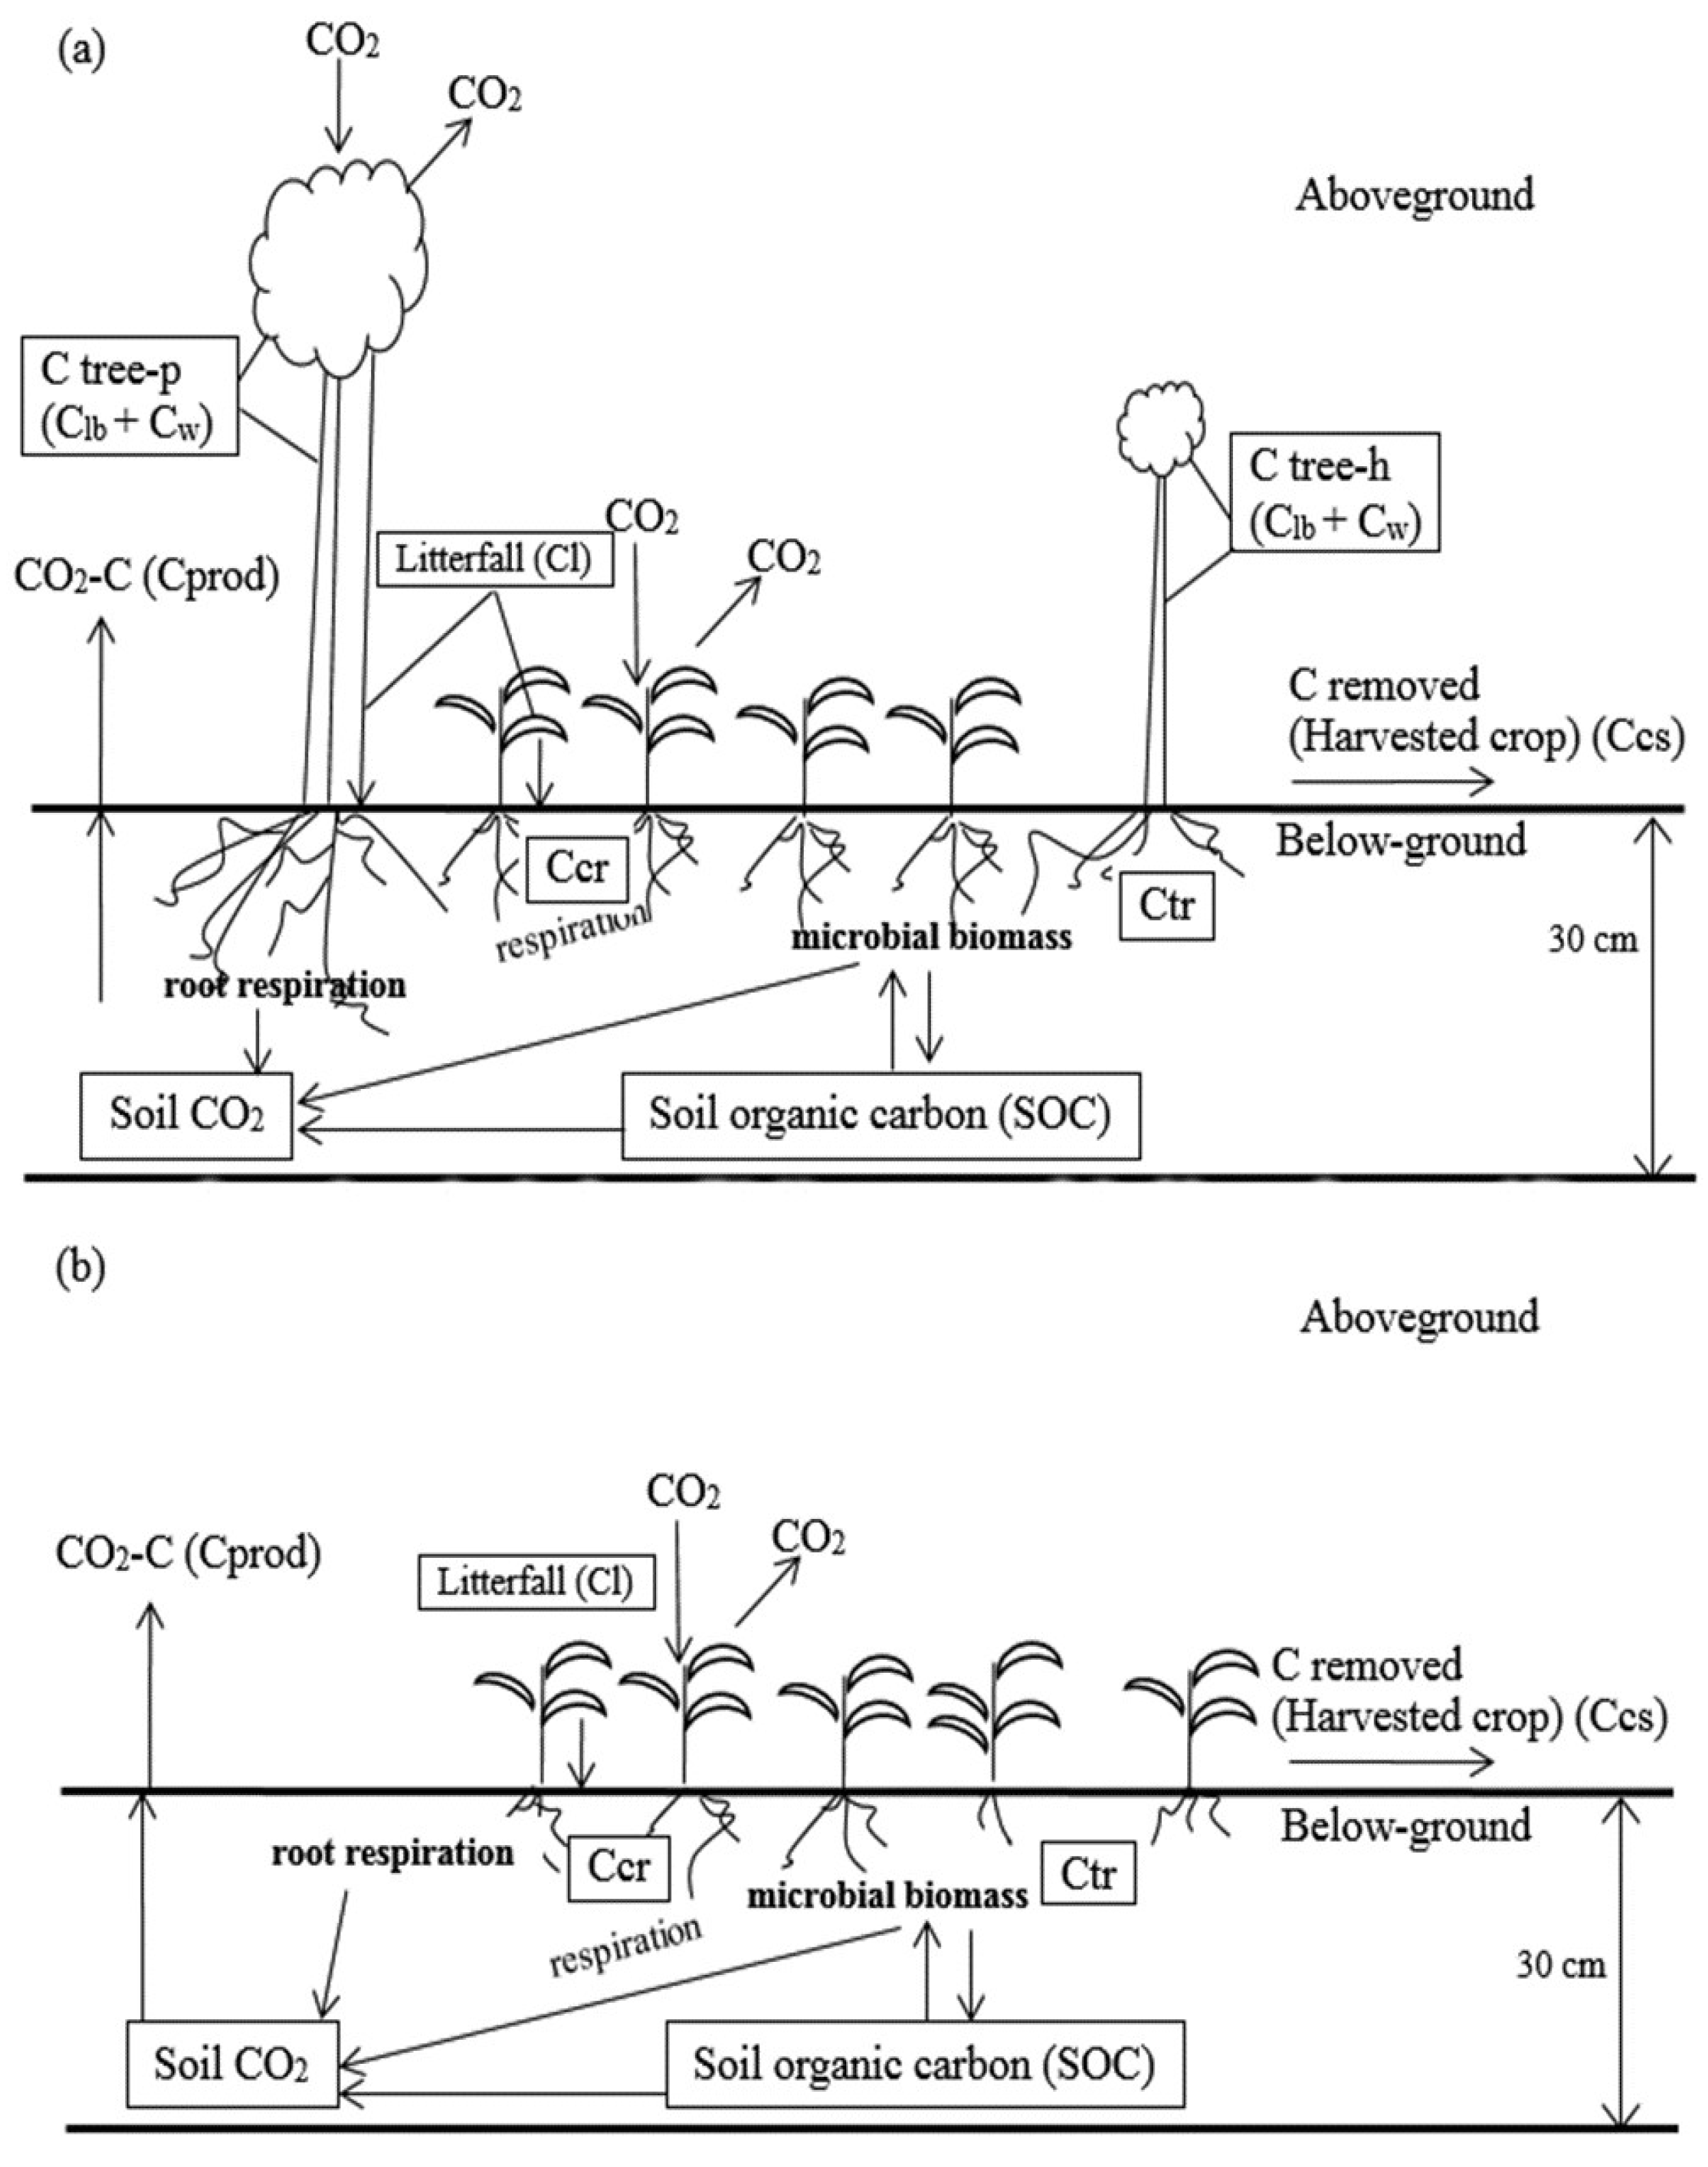
At the St. Edouard site, the C balance was 244.35 t C ha−1 in the TBI system compared to 167.05 t C ha−1 in the adjacent non-TBI system (Table 1). Estimated C stored in poplar and hardwoods accounted for 56.09 t C ha−1 and 13.22 t C ha−1, respectively, in branches, foliage, and wood (Table 1). Average measured soil CO2-C produced in TBI and non-TBI systems was 1.93 t CO2-C ha−1 year−1 and 2.02 t CO2-C ha−1 year−1, respectively. The soil respiration data measured for the study presented in this paper are low compared to annual C efflux observed in TBI systems (5.86–6.35 t CO2-C ha−1 year−1) [5] and soybean cropping systems (4.57 t CO2-C ha−1 year−1) in Ontario [13]. The soil respiration data measured for the study presented in this paper are based on too few experimental measurements to provide reliable data and are not consistent with the more robust measurements that are available for TBI systems. As such, we eliminated the soil respiration data from the C balance calculations and refer to the previous mentioned study [5] for annual C efflux expected in TBI systems in temperate regions of Canada.
At the St. Paulin site, the C balance was 185.07 t C ha−1 in the TBI system compared to 131.58 t C ha−1 in the adjacent non-TBI system (Table 1). Estimated C stored in poplar and hardwoods accounted for 26.38 t C ha−1 and 3.61 t C ha−1, respectively, in branches, foliage, and wood (Table 1). At year 10, TBI systems stored 77.30 t C ha−1 and 53.49 t C ha−1 more C than non-TBI systems at the St. Edouard and the St. Paulin sites, respectively, primarily due to the tree C stock (including tree roots).
Table 1. Carbon contained in crop, tree and soil components, and C sequestration in tree-based intercropping (TBI) and adjacent agricultural systems (non-TBI), expressed as the t C ha−1 in each component (in the rows labeled TBI and non-TBI). Values were estimated from measurements taken in 10-year old TBI and non-TBI systems at St. Edouard and St. Paulin experimental sites in Quebec, QC, Canada.
St. EdouardClCcsCcrC Soil (0–30 cm)C Tree-h (Clb + Cw)C Tree-h (Ctr)C Tree-p (Clb + Cw)C Tree-p (Ctr)C Sequestration
TBI0.621.440.36159.9013.223.7956.0911.80244.35
non-TBI0.672.020.50167.90NANANANA167.05
St. PaulinClCcsCcrC Soil (0–30 cm)C Tree-h (Clb + Cw)C Tree-h (Ctr)C Tree-p (Clb + Cw)C Tree-p (Ctr)C Sequestration
TBI0.411.100.66148.503.611.0426.385.55185.07
non-TBI0.201.300.78131.90NANANANA131.58
Cl denotes litterfall (mixed species); Ccs crop biomass; Ccr crop roots; Ctr tree roots; C tree-h (Clb + Cw) hardwood components (wood, bark, branches, foliage (in tree and not litterfall from tree)); C tree-p (Clb + Cw) poplar components (wood, bark, branches, foliage (in tree and not litterfall from tree); carbon (C) sequestration in TBI is C stored in soil, tree and crop biomass, and roots minus C removed via litterfall and biomass.
Overall, the C balance in St. Edouard is higher than St. Paulin in TBI and non-TBI systems. This result is likely due to the tree planting density at St. Edouard (500 trees ha−1) compared to at St. Paulin (276 trees ha−1). Planting hybrid poplars and hardwoods in TBI systems in Ontario resulted in 3–5 times of the C budget stored in soils compared to trees of 25-year-old TBI systems [5], which corroborates with observed C stored at St. Edouard and St. Paulin. Differences between TBI and non-TBI systems are observed numerically, and further accounted for in terms of the financial benefits of C sequestration in the next section in accordance with the SPEDE program. The statistical differences in C stocks between these two systems is not observed in this study (t-test, p = 0.05 for St. Edouard and p = 0.10 for St. Paulin) nor in a previous 19-year short rotation willow system [14].
The estimation of C stored in the systems is limited. The tree biomass was calculated based on mean diameter at breast height (DBH)-based equations and a number of assumptions that are stated in the methods section. The DBH)-based equations assume trees are sampled in a forest, and there are several differences between TBI and forest systems such as tree spacing which result in differences in nutrient cycling and C sequestration [15]. The DBH-based equations and model is also limited in that it does not account for hardwoods such as black cherry, in which case, although a common practice in modeling, a proxy was used and can lead to inaccuracies in model results.
The estimated C sequestration in this study is a static measure, although it is derived from the C stored in components that may accumulate CO2-C from the atmosphere (e.g., as photosynthates produced in leaves) or lose C as CO2-C due to respiration and decomposition (e.g., during litterfall decomposition). Whether each soil, crop and tree component is a short-term (hours to days) or long-term (days to years) sink or source of C during the growing season also needs to be considered. Photosynthetic material accumulation and distribution in a tree-soil system occurs within ~30 days.
Overall, during the growing season, C loss and soil respiration may be attributed to loss from turnover of soil C pools [16,17], although a flush of soil respiration could be expected when litterfall from crops and trees is newly fallen on the soil surface or incorporated by tillage operations in the intercropped space between tree rows. The annual C efflux expected in TBI systems in temperate regions of Canada (Ontario and perhaps southern Quebec) is 5.86–6.35 t CO2-C ha−1 year−1 [5]. In addition, the total mean residence time of C in trees varies depending on tree species [18], however, in TBI systems in Quebec, the trees will be cut in ~20 years for poplar and ~60 years for oaks and cherries. Gradual accumulation of soil C leading to a measureable gain in soil C storage may be evident after year 30 [15]. In contrast, the C accumulated in crop is either harvested as grain or forage, and the non-harvested components like stems and roots are left behind as readily decomposable litterfall/root inputs that contribute to the soil C pool. Approximately 6%–10% of crop C and tree C inputs will be integrated in the stable soil C pool [19], suggesting that the remaining crop C and tree C entering the soil is subject to gradual decomposition and loss due to soil respiration, dissolved organic C leaching and erosion. In the context of the current study, this would result in 11–24 t C ha−1 stored in soil from crop roots, tree roots and litterfall originating from crops and trees. Soil respiration is expected to be the major source of CO2-C loss from the C balance, since C loss through leaching is relatively minor in the humid regions, based on data collected from TBI systems in southern Ontario [5].

2.2. Financial Benefits of C Sequestration

Based on local policy and the regional program, i.e., the SPEDE program, total financial benefits of C sequestration to farmers would be calculated from emissions units, rather than the financial costs associated with establishment of the TBI system and its land management. Hence, the financial benefits to farmers in terms of emissions units ($11.39 CAD t−1 CO2e) and in the context of the Quebec C & T System program are comparable for the TBI and adjacent non-TBI systems at St. Edouard and St. Paulin. The St. Edouard and St. Paulin sites show positive returns of $2,259–$2,758 CAD·ha−1 and $1,568–$1,913 CAD ha−1, respectively, at discount rates of 6%–2%, where the lower returns correspond to the higher discount rate (6%).
This study shows that farmers can gain the financial benefits of C sequestration from afforestation when they use the emissions allowance options provided by the SPEDE program at the current market value of $11.39 CAD t−1 CO2e. In eastern Canada, TBI systems provide cash flow and income while trees are growing, but a net cost of TBI systems may occur because of lower crop yield, and the net return from trees is low, especially for slower growing trees [20]. Payments to farmers for ecosystem services such as C sequestration can help overcome the revenue gap between TBI systems and conventional agricultural systems. For instance, Alam et al. [8] showed that although conventional agriculture provides more private financial benefits than TBI systems, the value of non-market ecosystem services (e.g., C sequestration, water quality, pollination) is much higher than this private value [8]. The authors estimated that the potential financial benefits of ecosystem services (including timber and agricultural provisioning) provided by TBI systems in Quebec were equivalent to about $5 billion CAD year−1 [8], assuming that 20% of Quebec’s croplands (~0.40 M ha) can be converted to TBI systems.
The financial costs associated with establishment of the TBI system, and its land management are not accounted for in this study, and this may mean overestimation of the NPVs. It is important to note, however, that according to the SPEDE program, the C payments will be based on a C sequestration budget only and will be independent from the initial cost of investment. Perhaps, it should be considered whether these C payments after 10 years would cover the initial cost of investment of the tree establishment. In Quebec, and in many other regions in Canada, the trees are often provided free of charge by public nurseries to farmers for forest plantations, and a minimum number of trees should be obtained. Tree planting and weed control with plastic mulch is around $2 CAD per tree. There are also subsides covering tree establishment (tree planting and weed control with plastic mulch) in Quebec with forest landowner grant programs, which can account for around 70% of the establishment costs. Hence, tree establishment costs in our TBI systems could be completely overcome by C payments (Table 2).
Table 2. Financial benefits of carbon (C) sequestration in tree-based intercropping systems 10 years after tree establishment for St. Edouard and St. Paulin experimental sites, Quebec, QC, Canada.
Experimental SiteDiscount RateNet Present Value (CAD ha−1)
St. Edouard2%2259
4%2490
6%2758
St. Paulin2%1568
4%1728
6%1913
Although the financial benefits of C sequestration and GHG mitigation can be incentivized by the SPEDE program, planners need to develop a protocol for implementation of TBI systems in line with criteria provided by SPEDE. There is no protocol or reporting requirement for SPEDE that is designed for TBI systems at this time. At a minimum, such a protocol may help to facilitate C management at the farmer-level, but it must be farmer-driven, i.e., farmers will voluntarily set up an account as an “entity” or “participant” in the Compliance Instrument Tracking System Service. The minimum amount of data one may expect should be included in such a protocol would be soil type and soil conditions, e.g., suitability for tree planting including tree species, soil chemical properties, such as pH, and C and nitrogen (N) content (i.e., “initial” or soil C and N content before tree planting). Since we observed measurable gains in the above-ground C stored in the tree biomass at year 10, the protocol should include an estimation of the amount of C storage to expect in TBI systems at year 10, to comply with the SPEDE program. The soil C storage accumulates more gradually, and should be assessed every 10 to 30 years. Crops grown in TBI systems can be accounted for by total biomass harvested, and reference values for C content of crop components left behind after harvest. Although this C would not be stored in the system, it would be good for farmers who manage land for C sequestration to be able to do a basic “black-box” verification of the annual C accrual based on the estimated C inputs and outputs (including crop removal) for their TBI system. Although more difficult to estimate, yet important, the C losses due to soil respiration and leaching are expected to account for 2%–3% of the total annual C loss from TBI systems.

3. Experimental Section

3.1. Site Description and Experimental Design

The experimental sites were 10-year-old TBI hybrid-poplar-hardwood systems with adjacent non-TBI systems at St. Paulin (46°27′ north (N), 72°59′ west (W), 141 meters (m) above sea level) and St. Edouard (46°20′N, 73°11′W, 176 m above sea level), both located in southern Quebec, Canada. Mean annual precipitation was 1078 millimeters mm year−1 and 998 mm year−1 for St. Paulin and St. Edouard, respectively [21]. Mean annual temperature was 4 °C and 3 °C for St. Paulin and St. Edouard, respectively [22]. Soil physical and chemical analyses were conducted by Bambrick et al. [15], and the soils were classified as Dystric Brunisol in St. Paulin and Humo-Ferric Podzol at St. Edouard [23].
The two sites had randomized complete block experimental design with three blocks each including two systems (TBI system vs. non-TBI system) established in spring 2004. Before the systems were established the entire site (for TBI and adjacent non-TBI) was ploughed (20 centimeter (cm) depth) followed by two or three harrowing events (10 cm depth), and a plastic mulch strip (90 cm wide) was installed to cover tree rows. Hybrid poplar (DN3333 and DN3570; DN denotes Populus deltoides Bartr. Ex Marsh x nigra L.) rows were separated by one row of hardwoods. For each site, all agronomic operations after tree planting were the same for TBI and adjacent non-TBI systems, including crop species, fertilizer, manure application, and tillage. The field operations for this study period (2013) are different than the previous year (2012) field operations. Field operations varied from year to year at both sites based farmers’ preferred management practices, and historic land use for both sites is described in Winans et al. [24].

3.2. Field Operations for St. Paulin

At St. Paulin, hardwoods species were Quercus rubra L. and Prunus serotina Ehrh. Total tree density was 276 trees ha−1, with 142 trees ha−1 poplar and 134 trees ha−1 hardwoods in a total area of 3.11 ha. Spacing between tree rows (poplar and hardwood) was 12 m, with hardwoods planted at 3 m and poplars planted at 5 m intervals within rows. In October 2013, the mean diameter at breast height (DBH, 1.3 m) was measured for hybrid poplar and hardwood species, and was 20 cm and 5 cm, respectively.
The alleys between tree rows were cultivated with a disk harrow at a depth of approximately 8 cm, and within ~1–2 m of tree base in spring. Any residues remaining in the field at that time were incorporated into the soil. Buckwheat (Fagopyrum esculentum Moench) was planted in alleys in mid-June, 2013 and did not require mechanical or chemical weed control during the growing season. No fertilizers (organic or inorganic) were applied in 2013. A moldboard plow (to 15 cm depth) was used to plow the field in fall, after buckwheat harvest.

3.3. Field Operations for St. Edouard

Hardwoods included Quercus rubra L. and Fraxinus americana L. Total tree density was 500 trees ha−1, with 285 trees ha−1 poplar and 215 trees ha−1 hardwoods in a total area of 1.05 ha. Spacing between tree rows (poplar and hardwood) was 10 m, with hardwoods and poplars planted at 2 m intervals within rows. In October 2013, mean DBH of hybrid poplar and hardwood species was 16 cm and 7 cm, respectively.
A forage mix (Mix Bo-hamp 1043) with common 25% timothy (Phleum pratense L.), 75% alfalfa (Medicago sativa L.), and red clover (Trifolium pratense L.) was planted in mid-June 2013. No fertilizers (organic or inorganic) were applied in 2013. No tillage occurred after the forage was planted in 2013.

3.4. Soil Sampling for C and CO2-C Analyses

Soil samples were collected in August 2013 by making composites of three soil samples taken with a 7.6 cm diameter soil corer, at three depths (0–5 cm, 5–20 cm, and 20–30 cm), within ~1–2 m east and west of poplar and hardwoods and mid-way between rows, as well as at three randomly selected locations with the non-TBI plots. Soil samples were placed in a cooler with ice in the field and transferred to a refrigerator at 4 °C until analysis. A subsample of soil from each plot and sampling depth was dried (60 °C for three days). Each subsample was then finely ground and sieved to 40 microns prior to total C determination with a ThermoFinnigan Flash EA 1112 CN analyzer (Carlo Erba, Milan, Italy). In a previous study for the same site, the soils were analyzed for carbonates following treatment with dilute acid (1 molar HCl) and total C was determined to be equivalent to soil organic carbon (SOC; [15]). For the current study, it was assumed that soil carbonate concentration did not change between 2010 and 2013 and, therefore, total C was equivalent to SOC. Soil bulk density was measured by taking an intact soil cores (3 cm diameter) from the middle (e.g., 1–4 cm) of depth increments 0–5, 5–20, and 20–30 cm. Bulk density was determined by drying (60 °C) the soil cores to a constant mass and weighing them. Soil stocks were calculated per depth as soil C stock in kg C m−2 = bulk density (Mg m−3) × soil depth (m) × C (kg per Mg−1). We then summed the soil C stocks (kg C m−2) for the three depth increments (0–5, 5–20, and 20–30 cm) to get a total soil C stock (kg C m−2) for the 0–30 cm depth increment. According to Winans et al. [24], there was no difference in 0–30 cm soil C stock (kg C m−2) at 1–2 m west of trees and 6 m from the tree row in fall 2012 and this did not change by fall 2013 (Tables S1 and S2). As such, the assumption was that a weighted average of the total soil C stock (0–30 cm) from sampling positions across the alley (described in the Supplementary Materials) was a good approximation of the total soil C stock within the TBI system for the C budget. The total soil C stock (0–30 cm) in the non-TBI system was the average of 12 sampling points (three randomly selected locations × four replicate plots) at each field site.
For the St. Edouard site only, soil carbon dioxide (CO2-C) production was estimated using a closed chamber method (2.8 L volume). In the TBI systems, the chambers (n = 3) were located ~1–2 m east of the tree row, and ~1–2 m west of the tree row and mid-way between rows. Additional chambers (n = 3) were placed in the middle of the non-TBI systems. Headspace gas samples were collected from chambers in summer months, i.e., on 5 July, 6 August, and 9 September 2012 when crops and trees were growing in the TBI and the non-TBI systems. For calculation of CO2 fluxes, six gas samples were taken at three minute time intervals (0–18 min; between the hours of 6 a.m. and 5 p.m.), injected into 5 mL evacuated Exetainer® vials and transferred to laboratory for analysis using a model CP-2002 P Micro-GC (Chrompack, Middelburg, The Netherlands). The CO2-C concentration was converted with the ideal gas law into ppm, then the CO2-C flux (in g CO2-C m−2 year−1) was calculated based on Livingston and Hutchinson [25]. The mean CO2-C flux on each sampling date was calculated for the TBI system (n = 3) and the non-TBI system (n = 3). Hourly CO2-C fluxes were multiplied by 24 h to estimate the daily CO2-C emission (g m−2) and then interpolated linearly from 5 July to 9 September to get the cumulative CO2-C emission (g m−2), which was converted to kg C m−2 (1000 g 1 kg−1) and then to t C ha−1 for the C sequestration calculation (Equation (1)). This interpolation assumed that hourly CO2 fluxes could represent the emissions for a whole day; although fluxes change with time especially due to diurnal variations [26], we had no information on the magnitude of the daily CO2 fluxes in TBI systems and thus assumed that our measurements were representative for a particular day. Second, linear interpolation between gas sampling dates implies that the area under the curve represents the total CO2-C emissions during the sampling period (July to September). The total CO2-C emissions estimated during the sampling period (July to September) were assumed to represent the total annual CO2-C emissions, which would include the frost-free period when soil respiration occurs (seven months of the year, from April to November) and considered emissions of 0 t CO2-C ha−1 from December to March (winter months) when soils in the study area are generally frozen.

3.5. Above- and Below-Ground Biomass and Crop C Content

Above-ground biomass was collected from TBI systems in August 2013 in a 0.25 m2 (50 cm × 50 cm) sampling quadrat located ~1–2 m east and west of trees and mid-way between rows, i.e., within alleys, as well as in the middle of the non-TBI system, and within 1 m of soil sampling locations, similar to the sampling method used in previous studies [15,24]. Within the sampling quadrat, aboveground biomass was cut to ground level with grass shears, placed in a paper bag for transport, drying (60 °C for 3 d) and weighing. A subsample of each biomass sample was finely ground and sieved to 40 microns prior to analysis for total C with a Thermo Finnigan Flash EA 1112 CN analyzer. Crop C stock (kg C m−2) was above-ground biomass (g dry weight per m2, assuming that 0.25 m2 quadrat was representative of biomass produced per m2) × crop C content (g g−1) × 1 kg 1000 g−1. As the aboveground biomass C stock was similar across the alley in St. Edouard (Table S3) but produced a larger above-ground biomass C stock in the position mid-way between tree rows than beside the tree row at St. Paulin (Table S3), we determined that the weighted average crop C stock, described in the Supplementary Materials, would give unbiased values for each TBI system. The weighted average accounts for the relative position of the measured value within transects, the rationale for which is described in detail in Winans et al. 2014 [24]. For the non-TBI system, the average above-ground biomass C stock (n = 4) was calculated for the St. Edouard and St. Paulin sites separately.
Crop roots were not excavated, so root biomass was estimated from shoot to root (S:R) ratios derived from literature values (Table 3). The S:R ratio is an indicator of belowground biomass and can provide an estimate of belowground C [27]; although not the most accurate method, it is a low cost, non-destructive option. We assumed that root C content was 45% of the total crop root biomass following Bolinder et al. [28] and Intergovernmental Panel on Climate Change (IPCC) Guidelines [29]. Total C in crop (kg C m−2) was estimated as Ccs (kg C m−2) + Ccr (kg C m−2) where Ccs was C measured in above-ground biomass of crop and Ccr is C in root contribution. The C in root contribution was calculated as Ccr (kg C m−2) equal to ((Ccs (kg m−2)/S:R) × 0.45 g C g−1) based on S:R values presented in Table 3. Total C in crop (kg C m−2) was converted to total C in crop (t ha−1) using conversion factors 10,000 m2 per 1 ha and 1000 kg per 1 t for the C budget calculations.
Table 3. Shoot:Root (S:R) values used for C budget calculations for crop and tree species grown in tree-based intercropping systems at St. Paulin and St. Edouard, southern Quebec, Canada.
SpeciesS:RReferences
Fagopyrum esculentum Moench0.17 ± 0.58 a[30,31]
Forages (Eastern Canada)1.80 ± 1.10[28]
Populus spp.5.42 ± 1.53[32,33]
Quercus spp.1.20 ± 1.88[33,34]
Prunus serotina0.78 ± 0.55 b[35,36]
Fraxinus Americana4.15 ± 3.35 c[37,38]
a Mean S:R for species in the Polygonacea Juss. family; b Mean S:R for species in the Prunus L. genus; c S:R of O. europea tree.

3.6. Litterfall

Litterfall from trees and crop, denoted as Cl in Equation (1), was collected from TBI systems from June–October 2013, at 2-week intervals. Litterfall from crop, denoted as Cl in Equation (2), was also collected from non-TBI systems from June–October 2013, at 2-week intervals. Litterfall traps (dimensions: 0.25 m2; 50 cm × 50 cm) were positioned at ~1–2 m east and west of trees and mid-way between rows, i.e., within alleys, of the TBI system, as well as in the middle of the non-TBI system and within 1 m of soil sampling locations. Litterfall collected in traps was placed in a paper bag, dried (60 °C for 3 d), and weighed. A subsample of each litterfall sample was finely ground and sieved to 40 microns prior to analysis of total C with a ThermoFinnigan Flash EA 1112 CN analyzer. Litterfall C input to each plot was litterfall dry mass (g m−2, assuming that 0.25 m−2 litterfall trap was representative of litterfall deposited per m−2) × litterfall C content (g g−1) × 1 kg 1000 g−1. Cumulative litterfall (kg dry mass per m2 and kg C m−2) was the sum of litterfall biomass and litterfall C input during the sampling period. Although the litterfall C stock was similar at every sampling position within the TBI systems at St. Edouard and St. Paulin (Table S4), for consistency with other estimates in the C balance, a weighted average litterfall C stock was calculated for the TBI system (described in the Supplementary Materials). For the non-TBI system, the average litterfall C stock was calculated for St. Edouard (n = 4) and St. Paulin (n = 4). Cumulative litterfall (kg C m−2) was converted to cumulative litterfall (t ha−1) using conversion factors 10,000 m2 per 1 ha and 1000 kg per 1 t for the C budget calculations.

3.7. Estimation of Biomass and C Content for Tree Components

Biomass of the components (wood, bark, foliage within tree, i.e., not from tree litterfall and branches) of each tree was calculated using DBH-based equations and allometric model established by Lambert et al. [39] for hybrid poplars and hardwoods growing in natural forest stands in Canada. The estimated component values were based on the tree DBH values measured at the St. Paulin and St. Edouard sites in October 2013. Since Lambert et al. [39] did not include equations to evaluate tree root biomass and estimate C content of tree components, these were done as follows:
(1)
The S:R ratios for trees were based on literature values (Table 3), and we assumed that root C content was 43% of the total tree root biomass following Borden et al. [40].
(2)
The estimated C content for trees was based on a literature value, 50% of the total tree biomass content, following Smith et al. [41] and IPCC Guidelines [29]. This value was appropriate because foliage from the canopy of the tree species in our TBI systems contained 46%–54% C content. Foliage for C analysis was sampled from three trees in the middle of each row by taking the third branch below the top of the tree was selected on three sides of the tree. Then 10–15 leaves with petioles were collected from the top, middle, and bottom of each tree branch. Leaves were then dried, ground and analyzed for C content with a ThermoFinnigan Flash EA 1112 CN analyzer.
Since all trees were measured at each site, the reported values represent the total biomass (t biomass ha−1) and total C (t C ha−1) contained in all hybrid poplar trees and hybrid poplar tree components, as well as hardwood trees and hardwood tree components, in the TBI system, divided by the total number of hectares in each TBI system. Total C (t C ha−1) contained in all hybrid poplar trees and hybrid poplar tree components, as well as hardwood trees and hardwood tree components values used for C budget calculations were converted to kg C m−2 using conversion factors 10,000 m2 per 1 ha and 1000 kg per 1 t for the C budget calculations. The total C in trees (kg C m−2) was equal to (Cbl (kg m−2) + Cw (kg m−2)) × 0.50 g C g−1 + Ctr (kg C m−2) where Cbl was C estimated in branch and foliage (in tree, not tree litterfall), Cw was C in wood biomass estimated from equations and model described above, developed by Lambert et al. [39], and Ctr was C in tree root contribution (kg C m−2) calculated as (Cw (kg m−2)/S:R) × 0.43 g C g−1 using S:R values from Table 3.

3.8. Estimated C Sequestration for the TBI and the Non-TBI Systems

The C budgets for the TBI system (Figure 1a) and non-TBI system (Figure 1b) were compiled from the soil C stock (0–30 cm), annual CO2-C emission, crop C production in shoot and root biomass, litterfall C input and tree C production in branches, foliage, wood and roots, described in the previous section. The C budget permitted estimation of the C sequestration in TBI and non-TBI systems as follows:
C sequestration in TBI system (t C ha−1) = (Soil C stock (kg C m−2) + total C in crop (kg C m−2) + C tree total-p (kg C m−2) + C tree total-h (kg C m−2) + Cl (kg C m−2) − Ccs (kg C m−2))× 10,000 m2 ha−1 × 1 t 1000 kg−1
where C tree total-p and C tree total-h denote C in hybrid poplar and hardwoods, respectively. The Cl is litterfall from crop and mixed species of trees (hardwoods and hybrid poplar). Total C sequestration for the non-TBI system was calculated using Equation (2).
C sequestration in non-TBI system (t C ha−1) = (Soil C stock (kg C m−2) + total C in crop (kg C m−2) + Cl (kg C m−2) − Ccs (kg C m−2)) × 10,000 m2 ha−1 × 1 t 1000 kg−1
The Cl is litterfall from crop only in the non-TBI system.
Figure 1. Diagram of C pools and C fluxes within (a) a tree-based intercropping (TBI) system; (b) a temperate agricultural (non-TBI) system for St. Edouard and St. Paulin sites, southern Quebec, Canada. Boxes indicate C pools and arrows indicate C fluxes. Cl denotes litterfall (mixed species); Ccs, crop biomass; Ccr, crop roots; Ctr, tree roots; C tree-h (Clb + Cw), hardwood components (wood, bark, branches, foliage (in tree, not litterfall from tree)); C treep (Clb + Cw), poplar components (wood, bark, branches, foliage (in tree, not litterfall from tree)).
Atmosphere 07 00017 g001

3.9. Potential C Payment of the TBI Systems

Our objective was to evaluate the C sequestration and the corresponding C payments according to the SPEDE program in different TBI systems. According to the SPEDE program, the C payments will be based on a C sequestration budget only and will be independent from the initial cost of investment. The SPEDE program may potentially make a C payment to land owners of TBI systems, based on the TBI system’s ability to store C, above that of the non-TBI system, which is why C sequestration in non-TBI systems is subtracted from TBI systems (Equation (3)). The annual market value for C sequestration was calculated using the market value reported in 2015 [11] of $11.39 CAD t CO2e−1 and Equation (3).
CAD t CO2e−1 = C sequestration TBI system − C sequestration non-TBI system × 44/12 × 11.39 CAD t CO2e−1
where 1 t of C equals 44/12 = 3.67 t of CO2 from one hectare of land managed as a TBI or non-TBI system, respectively, in a year.
Since the difference in C sequestration between TBI and adjacent non-TBI systems will change with time and greater C sequestration is expected with older trees than younger trees, the market value of the C payment must be evaluated using the net present value (NPV) approach. The NPV is calculated with a discount rate, which is used to determine the present value of C sequestration future cash flow for a period of time. The NPV for C sequestration in non-TBI and TBI systems was calculated according to Equation (4):
NPV C sequestation = t = 0 T 1 ( 1 + r ) t * ( C sequestation t T B I C sequestation t n o n T B I )
where t represents the time period ranging from zero to T, where T = 10 years, the study duration, and r is the discount rate. C SequestrationtTBI represents the C sequestration in a 10-year-old TBI system with hybrid poplar and hardwoods considering the C accrued from soil, crop and crop roots, litterfall, and tree and tree roots. C Sequestrationtnon-BI represents the C sequestration in a non-TBI system under agricultural production during the same 10 year period, considering soil, crop and crop roots, and litterfall. The NPV for C payment does not include the cost of production or revenues generated. Following Winans et al. [24], discount rates 2%, 4%, and 6% were considered in the present study. Comparison of total C sequestration for TBI and non-TBI systems statistical analysis was conducted using a t-test and α = 0.05.

4. Conclusions

Overall, ten years of TBI with hybrid-poplar-hardwood systems at two sites in southern Quebec showed 33% and 36% more C stored compared to adjacent non-TBI systems. It is potentially profitable to establish an on-farm TBI system if the farmer is eligible to receive a C credit payment. A protocol for implementation of TBI systems that sequester C, which can be validated by SPEDE, needs to be developed to encourage farmers to manage their TBI systems in a way that maximizes C sequestration gains. Short-term and long-term financial benefits of C sequestration in TBI systems that consider financial tradeoffs, C storage sinks and storage, as well as the value of other ecosystem services (e.g., improved water quality) attributed to TBI practices merit further investigation in Quebec and elsewhere in Canada. Such studies could incentivize the adoption of TBI systems, which are currently marginalized by the Canadian agricultural sector.

Supplementary Materials

The following are available online at www.mdpi.com/2073-4433/7/2/17/s1, Table S1: Measured soil carbon stocks (kg C m−2) at tree-based intercropping site in St. Edouard, southern Quebec, Table S2: Measured soil carbon stocks (kg C m−2) at tree-based intercropping site in St. Paulin, southern Quebec, Table S3: Measured above-ground biomass stocks (kg C m−2) at tree-based intercropping sites in St. Edouard and St. Paulin, southern Quebec, Table S4: Measured litterfall stocks (kg C m−2) at tree-based intercropping sites in St. Edouard and St. Paulin, southern Quebec, Table S5: Contrast analysis for soil C stocks (kg C m−2) at tree-based intercropping site in St. Edouard, southern Quebec, Table S6: Contrast analysis for soil C stocks (kg C m−2) at tree-based intercropping site in St. Paulin, southern Quebec, Table S7: Contrast analysis for above-ground biomass stocks (kg C m−2) at tree-based intercropping sites in St. Edouard and St. Paulin, southern Quebec, Table S8: Contrast analysis for litterfall stocks (kg C m−2) at tree-based intercropping sites in St. Edouard and St. Paulin, southern Quebec.

Acknowledgments

The authors gratefully acknowledge the funds provided by the Agricultural Greenhouse Gases Program, Agricultural and Agri-Food Canada and Fonds Québécois de la Recherche sur la nature et les Technologies (FQRNT) for supporting the establishment and maintenance of the experimental installations. We acknowledge Kim-Ly Thompson for her contribution to the analysis of tree-based biomass data, and Claude Fortin, Bureau des changements climatiques (Direction du marché du carbone) du Ministère du Développement durable, de l'Environnement et de la Lutte contre les changements climatiques for his review and comment on this document. We also thank the land owners, René-Paul and Louis Lessard, and Michel Arès, who collaborated with us for this study.

Author Contributions

Kiara S. Winans collected, analyzed, and synthesized the data, and wrote the initial manuscript draft. David Rivest and Joann K. Whalen wrote parts of the manuscript and provided editorial corrections on manuscript drafts. David Rivest and Alain Cogliastro developed the experimental design for the St. Paulin and St. Edouard sites, and helped with data procurement. Alain Cogliastro and Robert L. Bradley provided valuable feedback and edited the manuscript.

Conflicts of Interest

The authors declare no conflict of interest.

References

  1. Schoeneberger, M.; Bentrup, G.; de Gooijer, H.; Soolanayakanahally, R.; Sauer, T.; Brandle, J.; Zhou, X.; Current, D. Branching out: Agroforestry as a climate change mitigation and adaptation tool for agriculture. J. Soil Water Conserv. 2012, 67, 128–136. [Google Scholar] [CrossRef]
  2. Smith, J.; Pearce, B.D.; Wolfe, M.S. Reconciling productivity with protection of the environment: Is temperate agroforestry the answer? Renew. Agric. Food Syst. 2013, 28, 80–92. [Google Scholar] [CrossRef]
  3. Smith, P.; Martino, D.; Cai, Z.; Gwary, D.; Janzen, H.; Kumar, P.; McCarl, B.; Ogle, S.; O’Mara, F.; Rice, C.; et al. Greenhouse gas mitigation in agriculture. Philos. Trans. R. Soc. B 2008, 363, 789–813. [Google Scholar] [CrossRef] [PubMed]
  4. Lorenz, K.; Lal, R. Soil organic carbon sequestration in agroforestry systems. A review. Agron. Sustain. Dev. 2014, 34, 443–454. [Google Scholar] [CrossRef]
  5. Peichl, M.; Thevathasan, N.V.; Gordon, A.M.; Huss, J.; Abohassan, R.A. Carbon sequestration potentials in temperate tree-based intercropping systems, southern Ontario, Canada. Agrofor. Syst. 2006, 66, 243–257. [Google Scholar] [CrossRef]
  6. Graves, A.R.; Burgess, P.J.; Palma, J.H.N.; Herzog, F.; Moreno, G.; Bertomeu, M.; Dupraz, C.; Liagre, F.; Keesman, K.; van der Werf, W.; et al. Development and application of bio-economic modeling to compare silvoarable, arable, and forestry systems in three European countries. Ecol. Eng. 2007, 29, 434–449. [Google Scholar] [CrossRef] [Green Version]
  7. Udawatta, R.P.; Jose, S. Carbon sequestration potential of agroforestry practices in temperate North America. In Carbon Sequestration Potential of Agroforestry Systems: Opportunities and Challenges; Kumar, B., Nair, P.K.R., Eds.; Advances in Agroforestry; Springer: New York, NY, USA, 2011; Volume 8, pp. 17–42. [Google Scholar]
  8. Alam, M.; Olivier, A.; Paquette, A.; Dupras, J.; Revéret, J.P.; Messier, C. A general framework for the quantification and valuation of ecosystem services of tree-based intercropping systems. Agrofor. Syst. 2014, 88, 679–691. [Google Scholar] [CrossRef]
  9. Salvail, M.C. Liaison des Marchés du Carbone Québec-Californie: L’assemblée Nationale Donne le Feu Vert. 2013. Available online: http://www.mddelcc.gouv.qc.ca/infuseur/communique.asp?no=2701 (accessed on 1 October 2014). [Google Scholar]
  10. Scott, S. Carbon Pricing Options for Canada. Can. Public Policy 2013, 39, S109–S124. [Google Scholar] [CrossRef]
  11. Government of Quebec. The Carbon Market: The Québec Cap and Trade System for Greenhouse Gas Emissions Allowances. Available online: http://www.mddelcc.gouv.qc.ca/changements/carbone/Systeme-plafonnement-droits-GES-en.htm (accessed on 1 October 2014).
  12. Yemshanov, D.; McKenney, D.W.; Hatton, T.; Fox, G. Investment attractiveness of afforestation in Canada inclusive of carbon sequestration benefits. Can. J. Agric. Econ. 2005, 53, 307–323. [Google Scholar] [CrossRef]
  13. Peng, X.; Thevathasan, N.V.; Gordon, A.M.; Mohammed, I.; Gao, P. Photosynthetic response of soybean to microclimate in 26-year-old tree-based intercropping systems in southern Ontario, Canada. PLoS ONE 2015, 10, e0129467. [Google Scholar] [CrossRef] [PubMed]
  14. Pacaldo, R.S.; Volk, T.A.; Briggs, R.D. No differences in soil organic carbon in short rotation willow (Salix x dasyclados) along a 19-year chronosequence. Biomass Bioenergy 2013, 58, 136–142. [Google Scholar] [CrossRef]
  15. Bambrick, A.; Whalen, J.; Bradley, R.; Cogliastro, A.; Gordon, A.; Olivier, A.; Thevathasan, N. Spatial heterogeneity of soil organic carbon in tree-based intercropping systems in Quebec and Ontario, Canada. Agrofor. Syst. 2010, 79, 343–353. [Google Scholar] [CrossRef]
  16. Guo, L.B.; Gifford, R.M. Soil carbon stocks and land use change: A meta analysis. Glob. Chang. Biol. 2002. [Google Scholar] [CrossRef]
  17. Carbone, M.S.; Czimczik, C.I.; McDuffee, K.E.; Trumbore, S.E. Allocation and residence time of photosynthestic products in a boreal forest using a low-level 14C pulse-chase labeling technique. Glob. Chang. Biol. 2007, 13, 1–12. [Google Scholar] [CrossRef]
  18. Watson, R.T.; Noble, I.R.; Bolin, B.; Ravindranath, N.H.; Verardo, D.J.; Dokken, D.J. Land Use, Land-Use Change and Forestry: A Special Report of the Intergovernmental Panel on Climate Change; Cambridge University Press: Cambridge, UK, 2000. [Google Scholar]
  19. Centre de Référence en Agriculture et Agroalimentaire du Québec (CRAAQ). Guide de Référence en Fertilisation, 2nd ed.; Centre de Référence en Agriculture et Agroalimentaire du Québec: St-Foy, QC, Canada, 2010. [Google Scholar]
  20. Toor, I.A.; Smith, E.C.; Whalen, J.K.; Naseem, A. Tree-based intercropping in southern Ontario, Canada. Can. J. Agric. Econ. 2012, 60, 141–154. [Google Scholar] [CrossRef]
  21. Wei, Y.; Liu, S.; Huntzinger, D.; Michalak, A.; Viovy, N.; Post, W.; Schwalm, C.; Schaefer, K.; Jacobson, A.; Lu, C.; et al. The North American carbon program multi-scale synthesis and terrestrial model intercomparison project—Part 2: Environmental driver data. Geosci. Model Dev. Discuss. 2013, 6, 5375–5422. [Google Scholar] [CrossRef]
  22. Government of Canada. Available online: http://climate.weather.gc.ca (accessed on 1 October 2014).
  23. Soil Classification Working Group. The Canadian System of Soil Classification, 3rd ed.; NRC Research Press: Ottawa, ON, Canada, 1998. [Google Scholar]
  24. Winans, K.; Whalen, J.; Coglisatro, A.; Rivest, D.; Ribaudo, L. Soil carbon stocks in two hybrid poplar-hay crop systems in southern Quebec, Canada. Forests 2014, 5, 1952–1966. [Google Scholar] [CrossRef]
  25. Livingston, G.P.; Hutchinson, G.L. Enclosure-based measurement of trace gas exchange: Applications and sources of error. In Methods in Ecology. Biogenic trace Gases: Measuring Emissions from Soil and Water; Matson, P.A., Harriss, R.C., Eds.; Blackwell Science: Malden, MA, USA, 1995; pp. 14–51. [Google Scholar]
  26. Parkin, T.B.; Kaspar, T.C. Temperature controls on diurnal carbon dioxide flux. Soil Sci. Soc. Am. J. 2003, 67, 1763–1772. [Google Scholar] [CrossRef]
  27. Schenk, H.J.; Jackson, R.B. Rooting depths, lateral root spreads and below-ground/above-ground allometries of plants in water-limited ecosystems. J. Ecol. 2002, 90, 480–494. [Google Scholar] [CrossRef]
  28. Bolinder, M.; Janzen, H.; Gregorich, E.; Angers, D.; Vanden Bygaart, A.J. An approach for estimating net primary productivity and annual carbon inputs to soil for common agricultural crops in Canada. Agric. Ecosyst. Environ. 2007, 118, 29–42. [Google Scholar] [CrossRef]
  29. Pipatti, R.; Wagner, J.; Alves, S.; Gao, Q.; Cabrera, C.; Mareckova, K.; Yamada, M. 2006 IPCC Guidelines for National Greenhouse Gas Inventories; IPCC: Washington, DC, USA, 2006. [Google Scholar]
  30. Abe, T.; Fukami, M.; Ogasawara, M. Cadmium accumulation in the shoots and roots of 93 weed species. Soil Sci. Plant Nutr. 2008, 54, 566–573. [Google Scholar] [CrossRef]
  31. Murakami, T.; Murayama, S.; Uchitsu, M.; Yoshida, S. Root length and distribution of field-grown buckwheat (Fagopyrum esculentum Moench). Soil Sci. Plant Nutr. 2002, 48, 609–613. [Google Scholar] [CrossRef]
  32. Fortier, J.; Truax, B.; Gagnon, D.; Lambert, F. Plastic Allometry in Coarse Root Biomass of Mature Hybrid Poplar Plantations. BioEnergy Res. 2015, 8, 1691–1704. [Google Scholar] [CrossRef]
  33. Kimmins, J.P.; Binkley, D.; Chatarpaul, L.; de Catanzaro, J. Biogeochemistry of Temperate Forest Ecosystems: Literature on Inventories and Dynamics of Biomass and Nutrients; Information Report PI-X-47; Canadian Forestry Service, Petawawa National Forestry Institute: Chalk River, ON, Canda, 1985; p. 227. [Google Scholar]
  34. Jensen, A.M.; Löf, M.; Gardiner, E.S. Effects of above-and below-ground competition from shrubs on photosynthesis, transpiration and growth in Quercus robur L. seedlings. Environ. Exp. Bot. 2011, 71, 367–375. [Google Scholar] [CrossRef]
  35. Rieger, M.; Duemmel, M.J. Comparison of drought resistance among Prunus species from divergent habitats. Tree Physiol. 1992, 11, 369–380. [Google Scholar] [CrossRef] [PubMed]
  36. Gottschalk, K.W. Effects of shading on growth and development of northern red oak, black oak, black cherry, and red maple seedlings, I. Height, diameter, and root/shoot ratio. In Proceedings of the Central Hardwood Forest Conference, Urbana, IL, USA, 15–17 April 1985.
  37. Ilarioni, L.; Nasini, L.; Brunori, A.; Proietti, P. Experimental measurement of the biomass of olea europaea L. Afr. J. Biotechnol. 2013, 12, 1216–1222. [Google Scholar]
  38. Kerr, G.; Cahalan, C. A review of site factors affecting the early growth of ash (Fraxinus excelsior L.). For. Ecol. Manag. 2004, 188, 225–234. [Google Scholar]
  39. Lambert, M.C.; Ung, C.H.; Raulier, F. Canadian national tree aboveground biomass equations. Can. J. For. Res. 2005, 35, 1996–2018. [Google Scholar] [CrossRef]
  40. Borden, K.A.; Isaac, M.E.; Thevathasan, N.V.; Gordon, A.M.; Thomas, S.C. Estimating coarse root biomass with ground penetrating radar in a tree-based intercropping system. Agrofor. Syst. 2014, 88, 657–669. [Google Scholar] [CrossRef]
  41. Smith, K.; Coyea, M.; Munson, A. Soil carbon, nitrogen, and phosphorus stocks and dynamics under disturbed black spruce forests. Ecol. Appl. 2000, 10, 775–788. [Google Scholar] [CrossRef]

