
The Effect of Freezing Drizzle, Sleet and Snow on Microphysical Characteristics of Supercooled Fog during the Icing Process in a Mountainous Area

Abstract
:1. Introduction
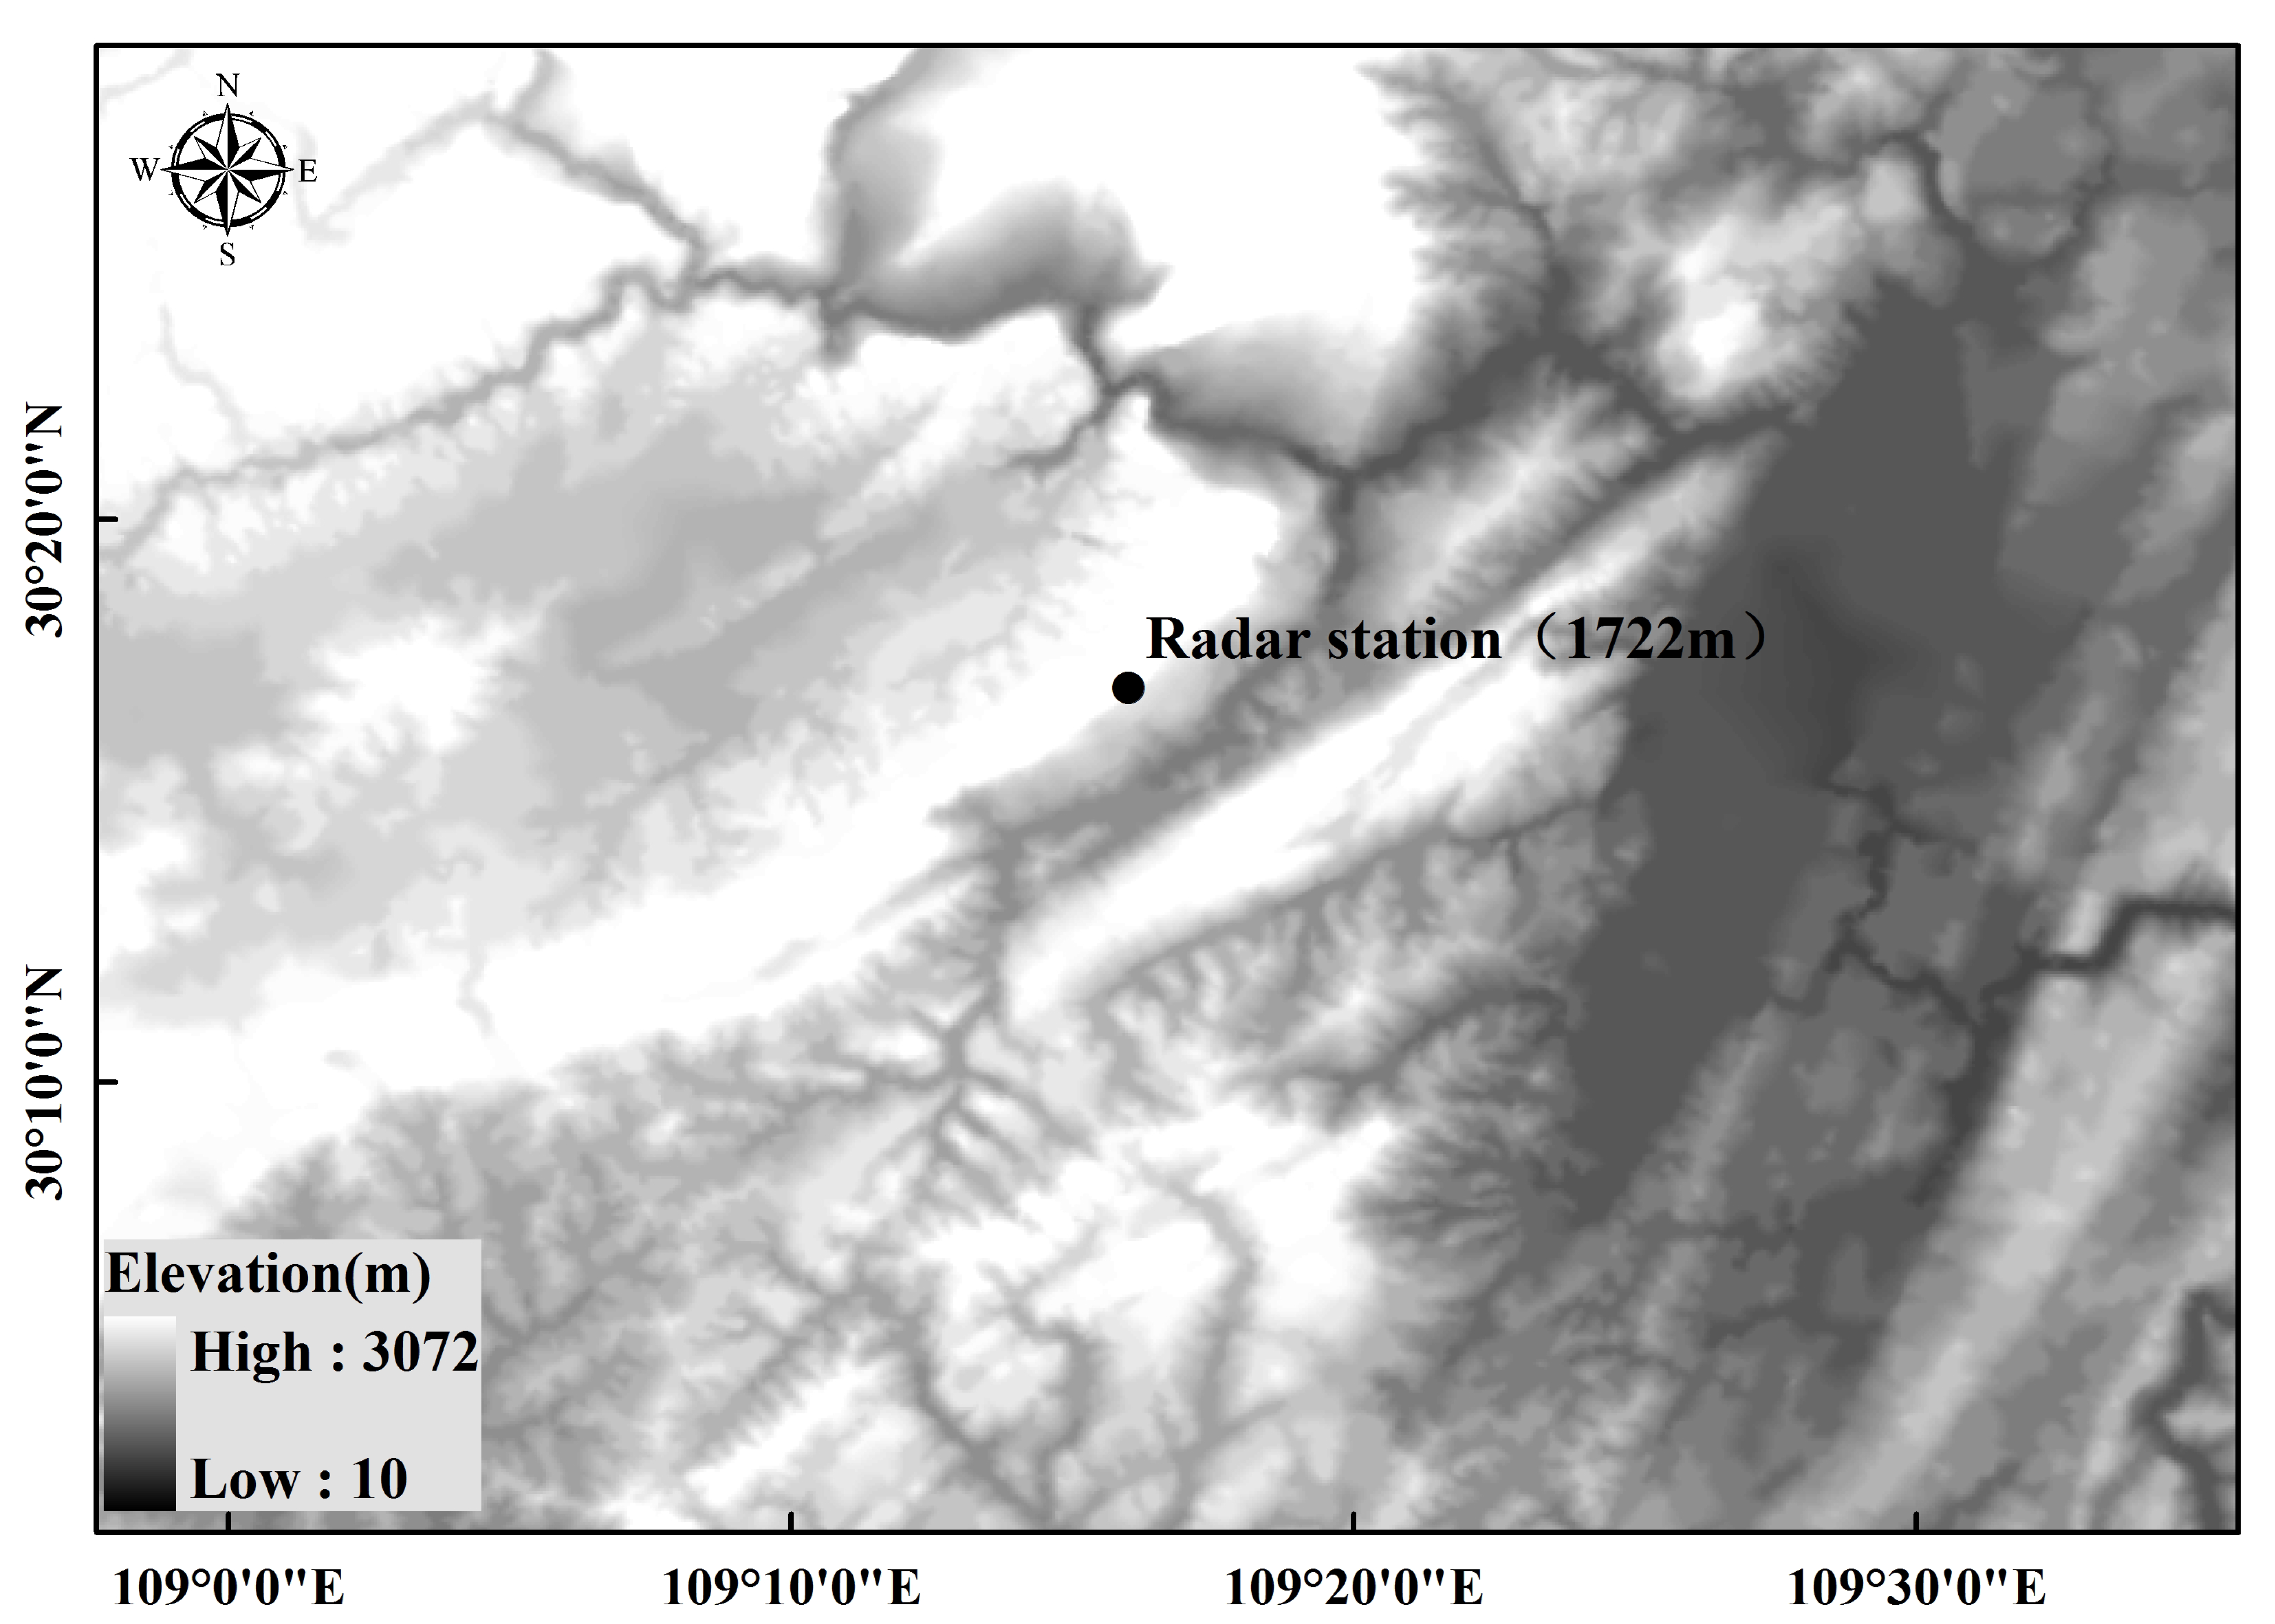
2. Observation Site and Instruments
3. Results and Discussion
3.1. General Characteristics of Drizzle/Sleet/Snow–Mixed Fog
3.2. Effect of Drizzle/Sleet/Snow on Number Concentrations of Fog
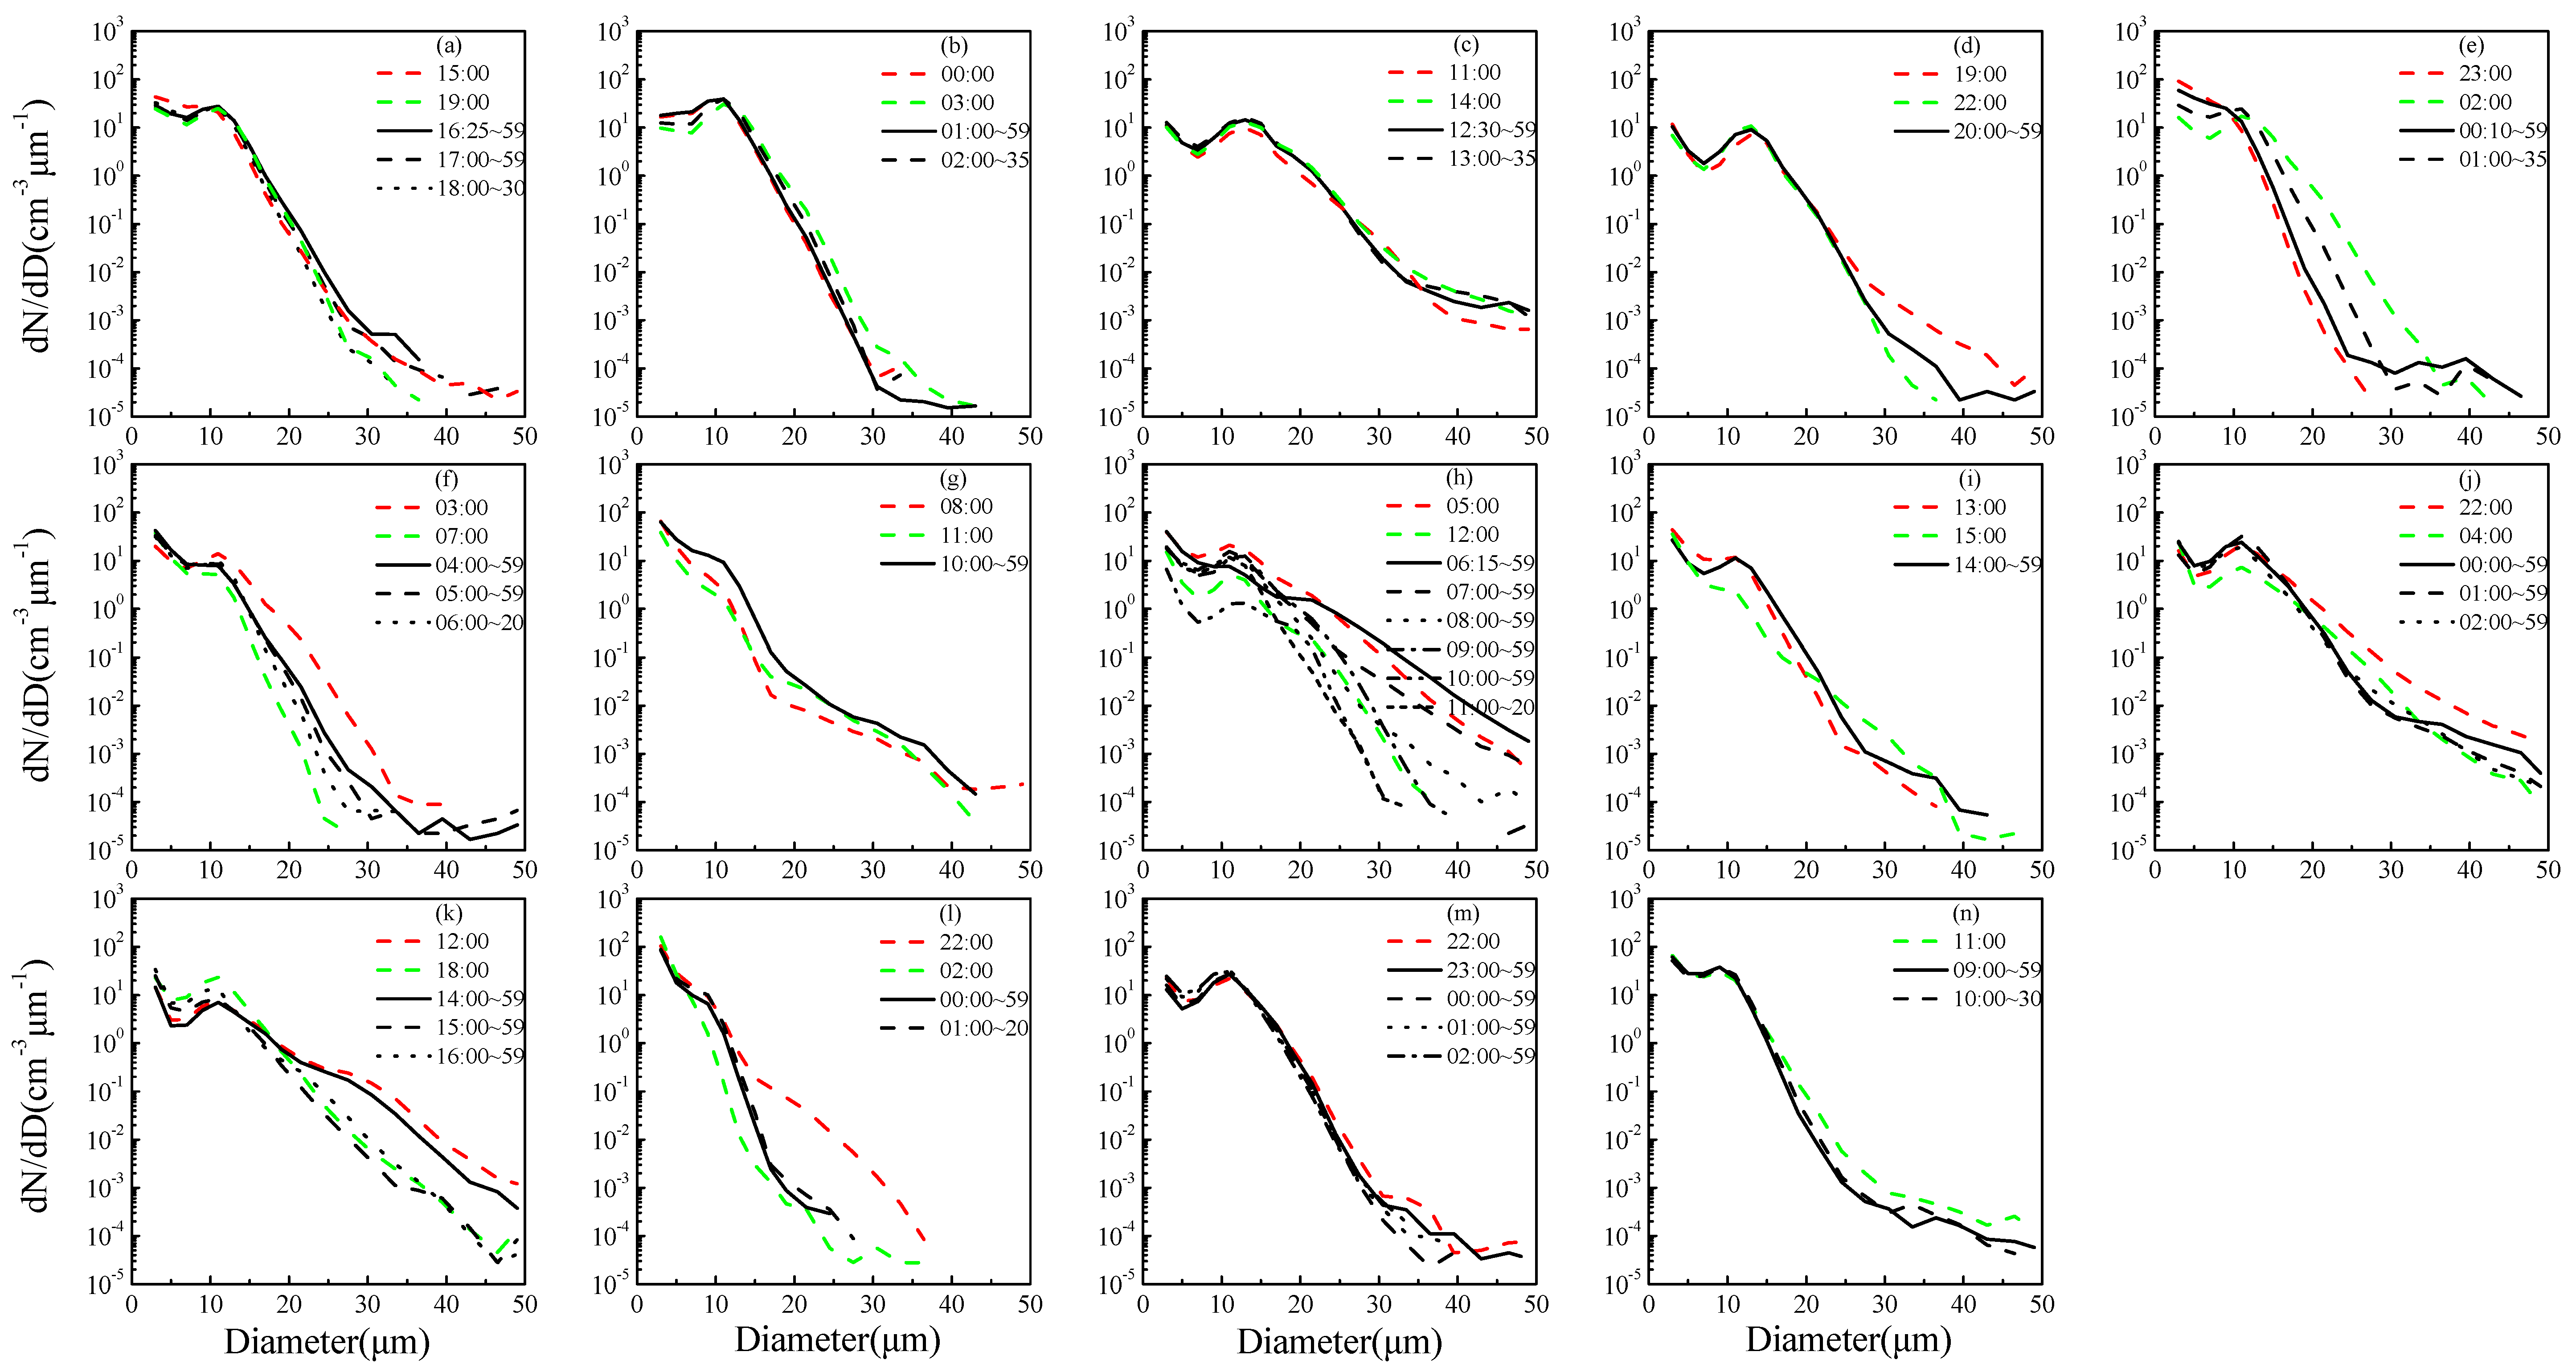
3.3. Evolution of Fog Droplet Spectra under the Influence of Drizzle/Sleet/Snow
3.4. Quantitative Estimation for Fog Droplet Size Distribution under the Influence of Drizzle/Sleet/Snow
3.5. Microphysical Mechanisms of Fog under the Influence of Drizzle/Sleet/Snow
4. Conclusions
- (1)
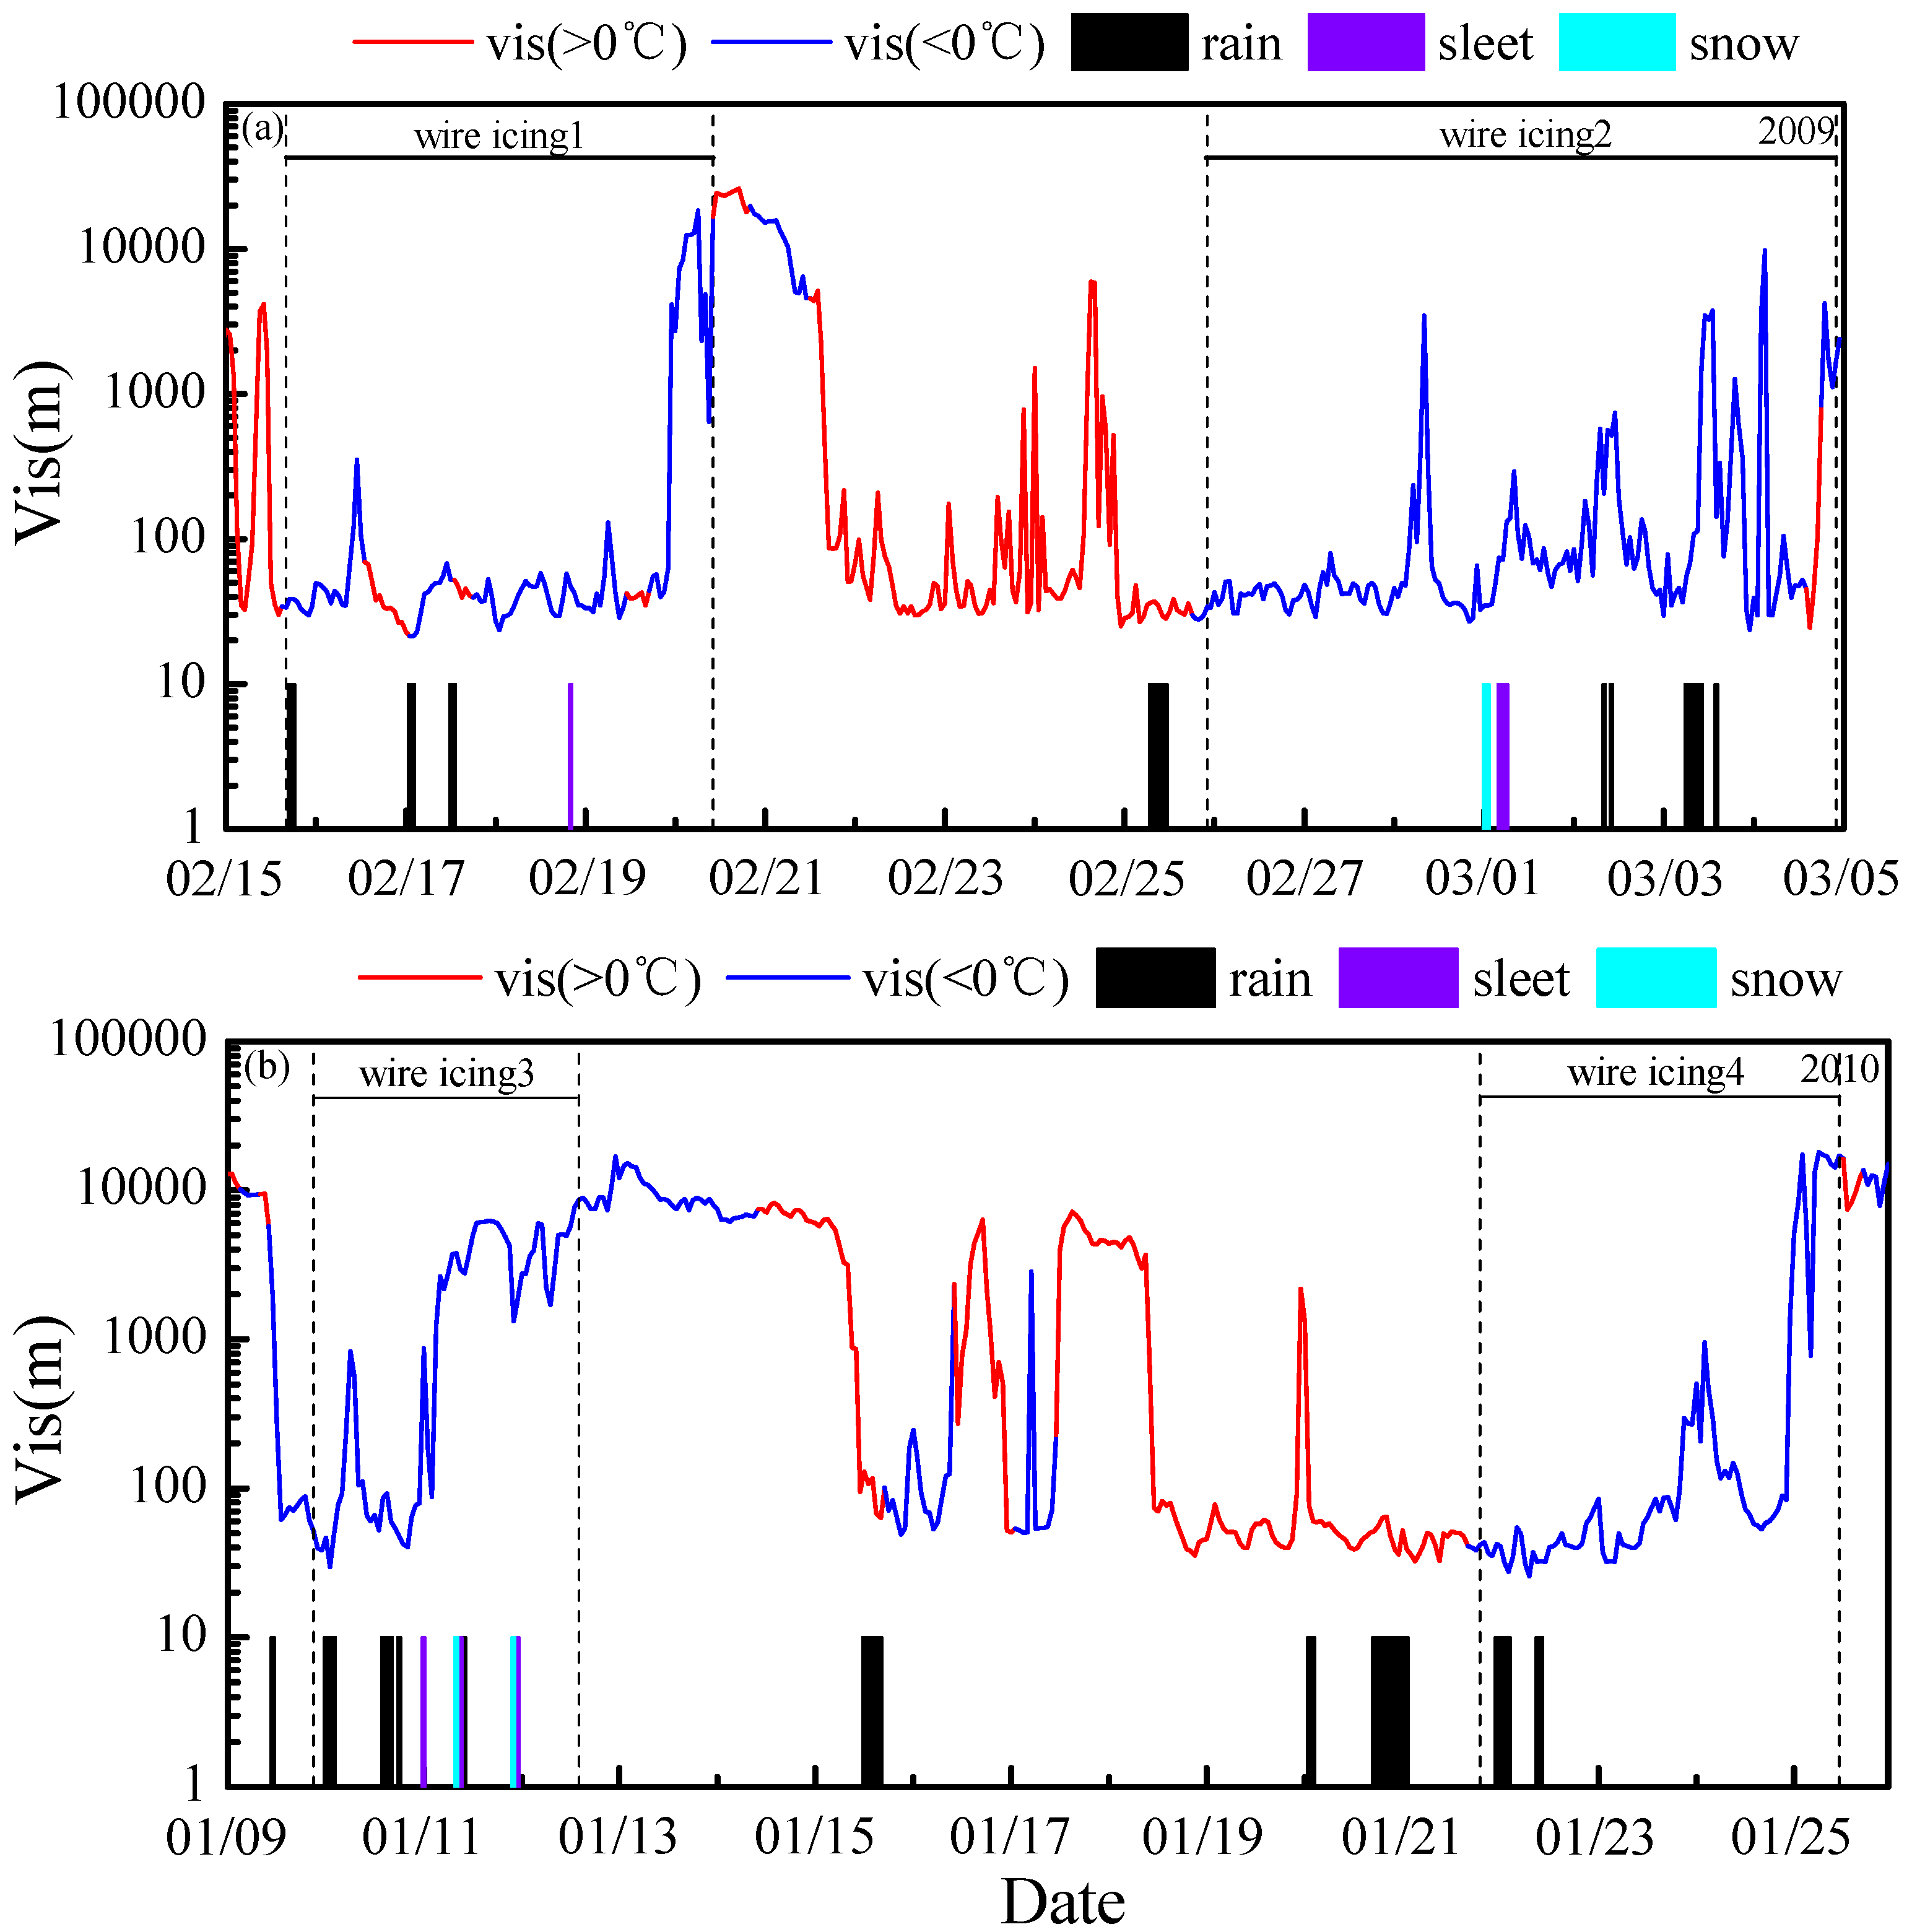
- In icing processes of mountainous areas, liquid precipitation was a relatively stable form of precipitation. The duration of precipitation was usually more than 5 h with temperature above 0 °C, while 1–3 h short-term precipitation was dominant with temperature below 0 °C. Due to the high altitude of the observational site, the visibility was below 1000 m for a long time. The rainfall intensity of freezing drizzle was substantially below 0.2 mm·h−1, while that of sleet and snow was greater than 1 mm·h−1. Precipitation occurred at different periods of fog processes, but sleet and snow mainly occurred in the dissipation and oscillation periods. When precipitation occurred, the number concentration, diameter and liquid water content of fog were 300 cm−3, 5 μm and 0.02–0.17 g·cm−3, respectively, which were lower than those of fog processes in other regions.
- (2)
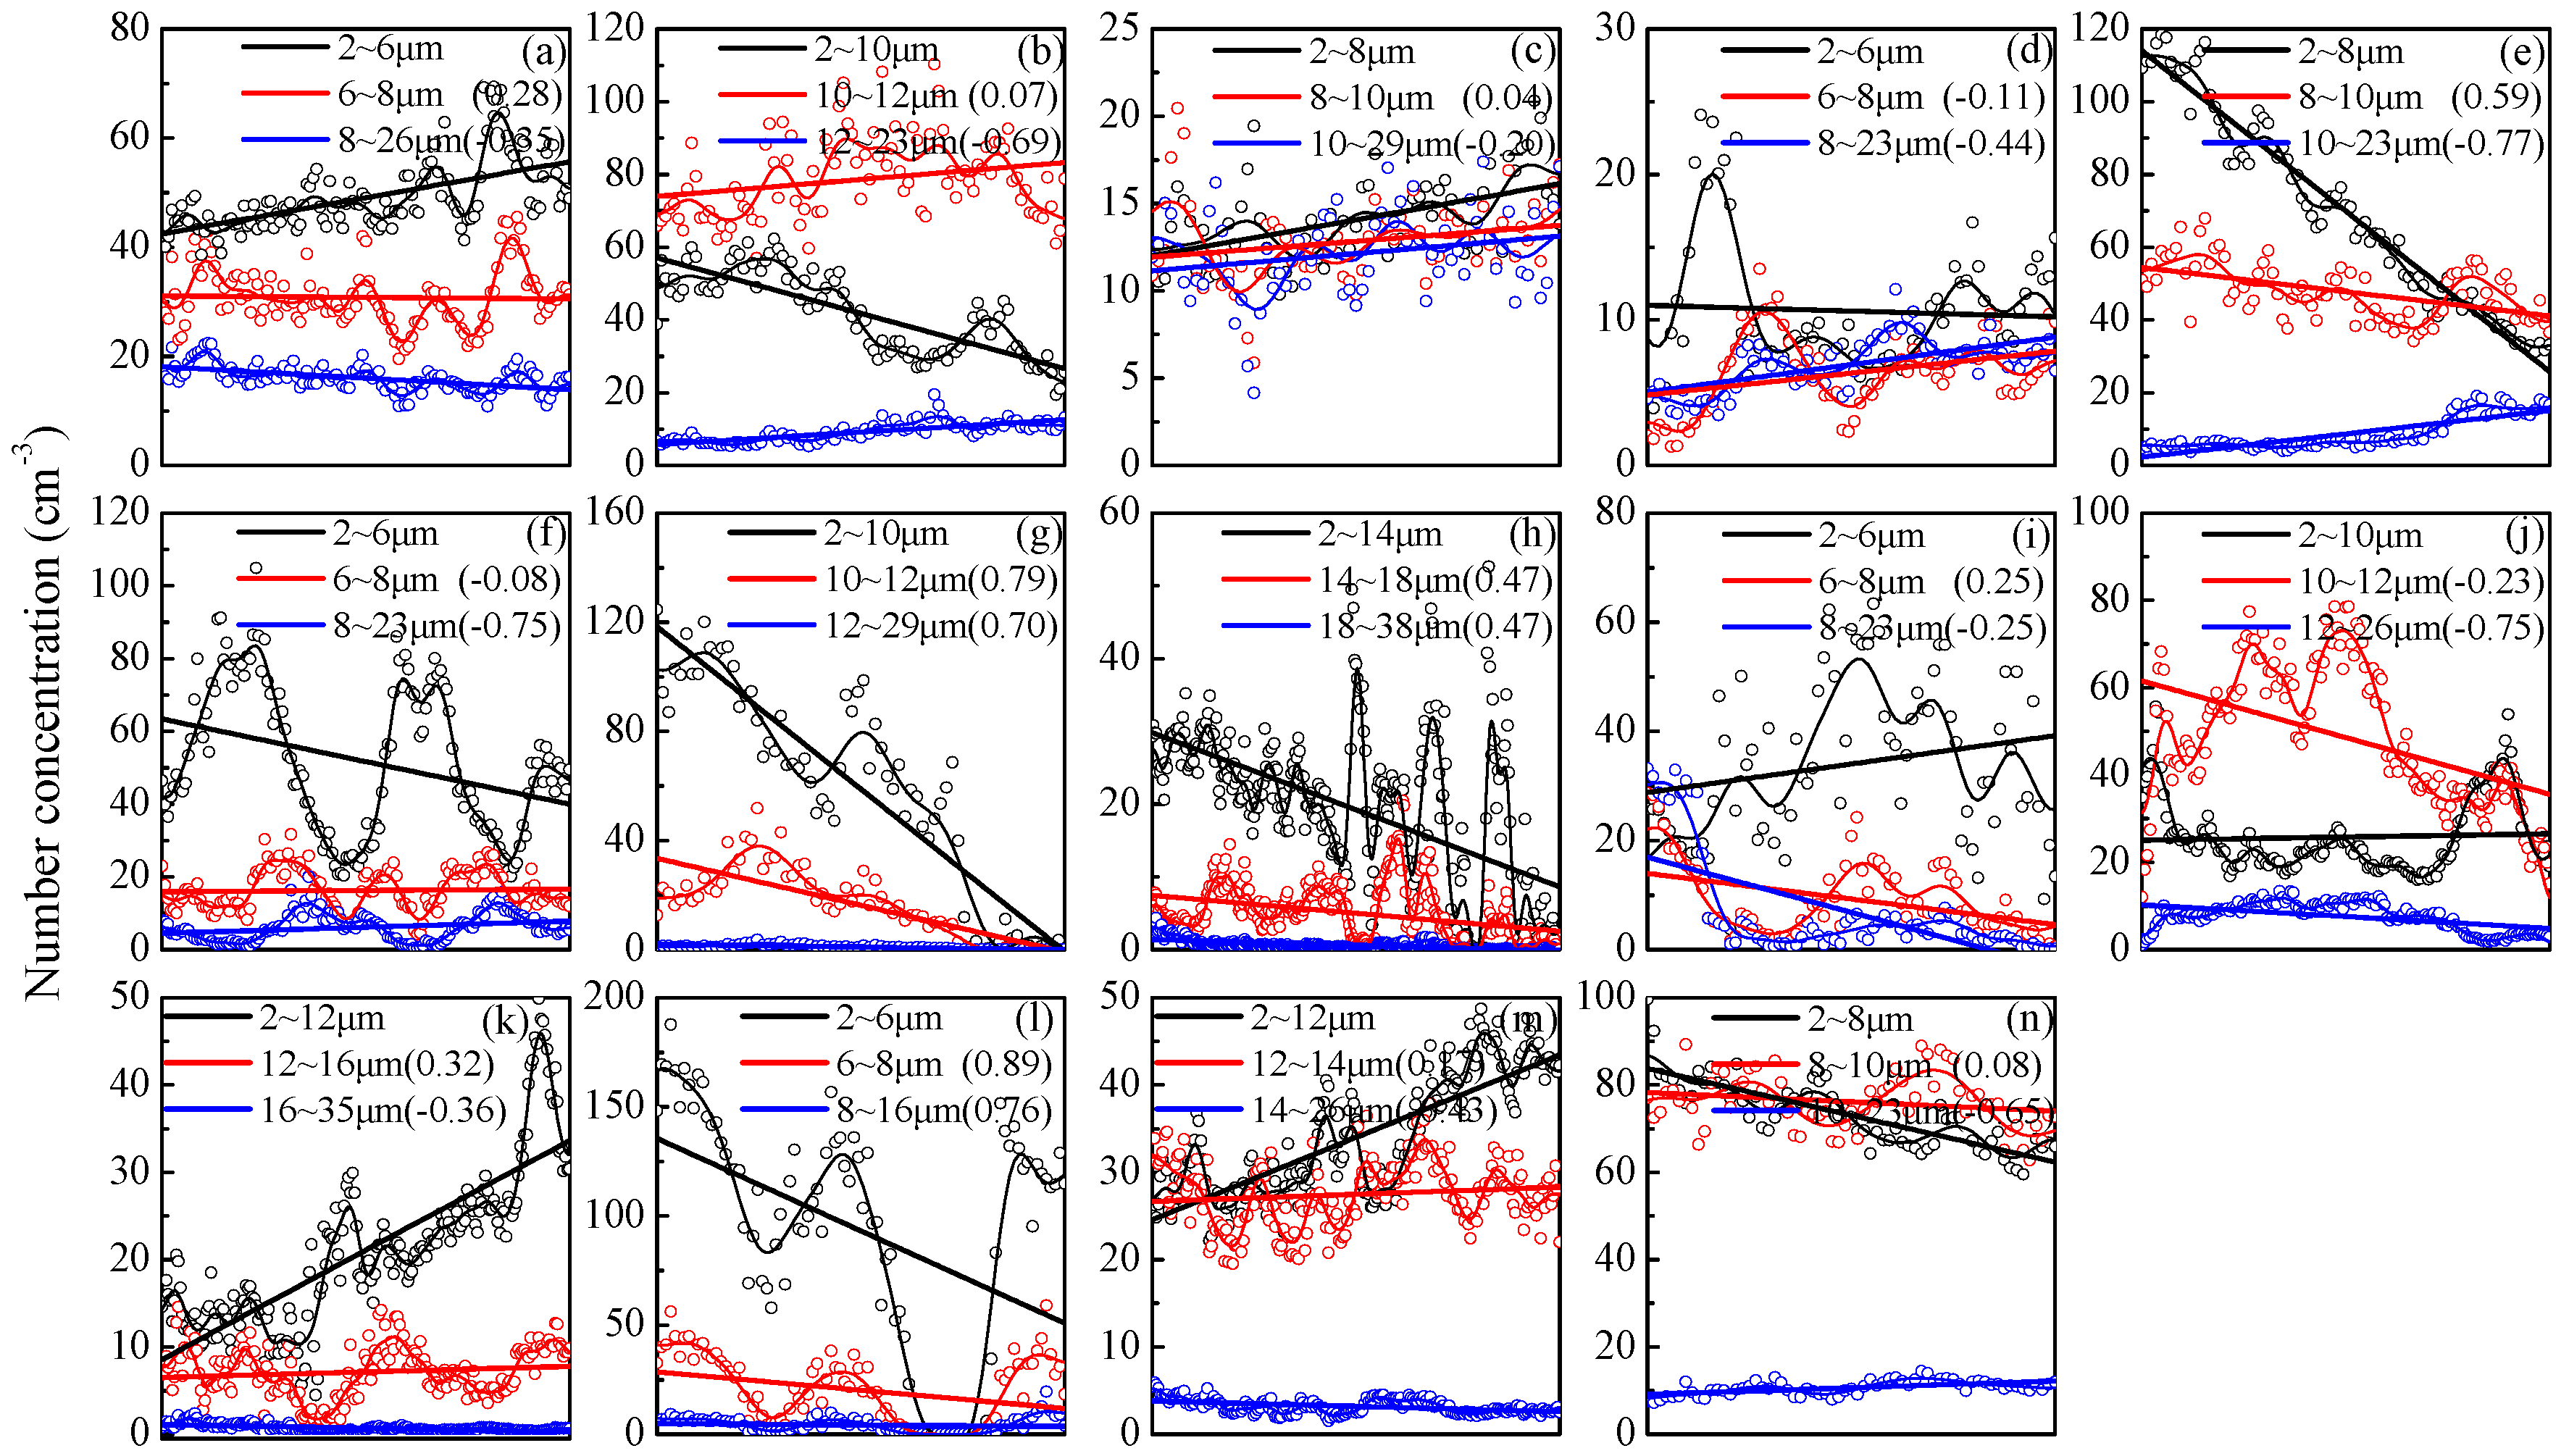
- The wet scavenging effect of freezing drizzle on small fog droplets with a size range less than 6–12 μm was weak but stronger for fog droplets with a larger size, which was opposite to the effects of solid precipitation. Moreover, the number concentrations of small droplets had a strong negative correlation with those of large droplets under the influence of precipitation. Droplet spectra had a basic bimodal pattern, with the peak value located at 3 μm and 11–13 μm. Freezing drizzle increased the number concentrations at 3 μm and decreased the values at 11–13 μm, while the occurrence of solid precipitation significantly broadened the droplet spectra.
- (3)
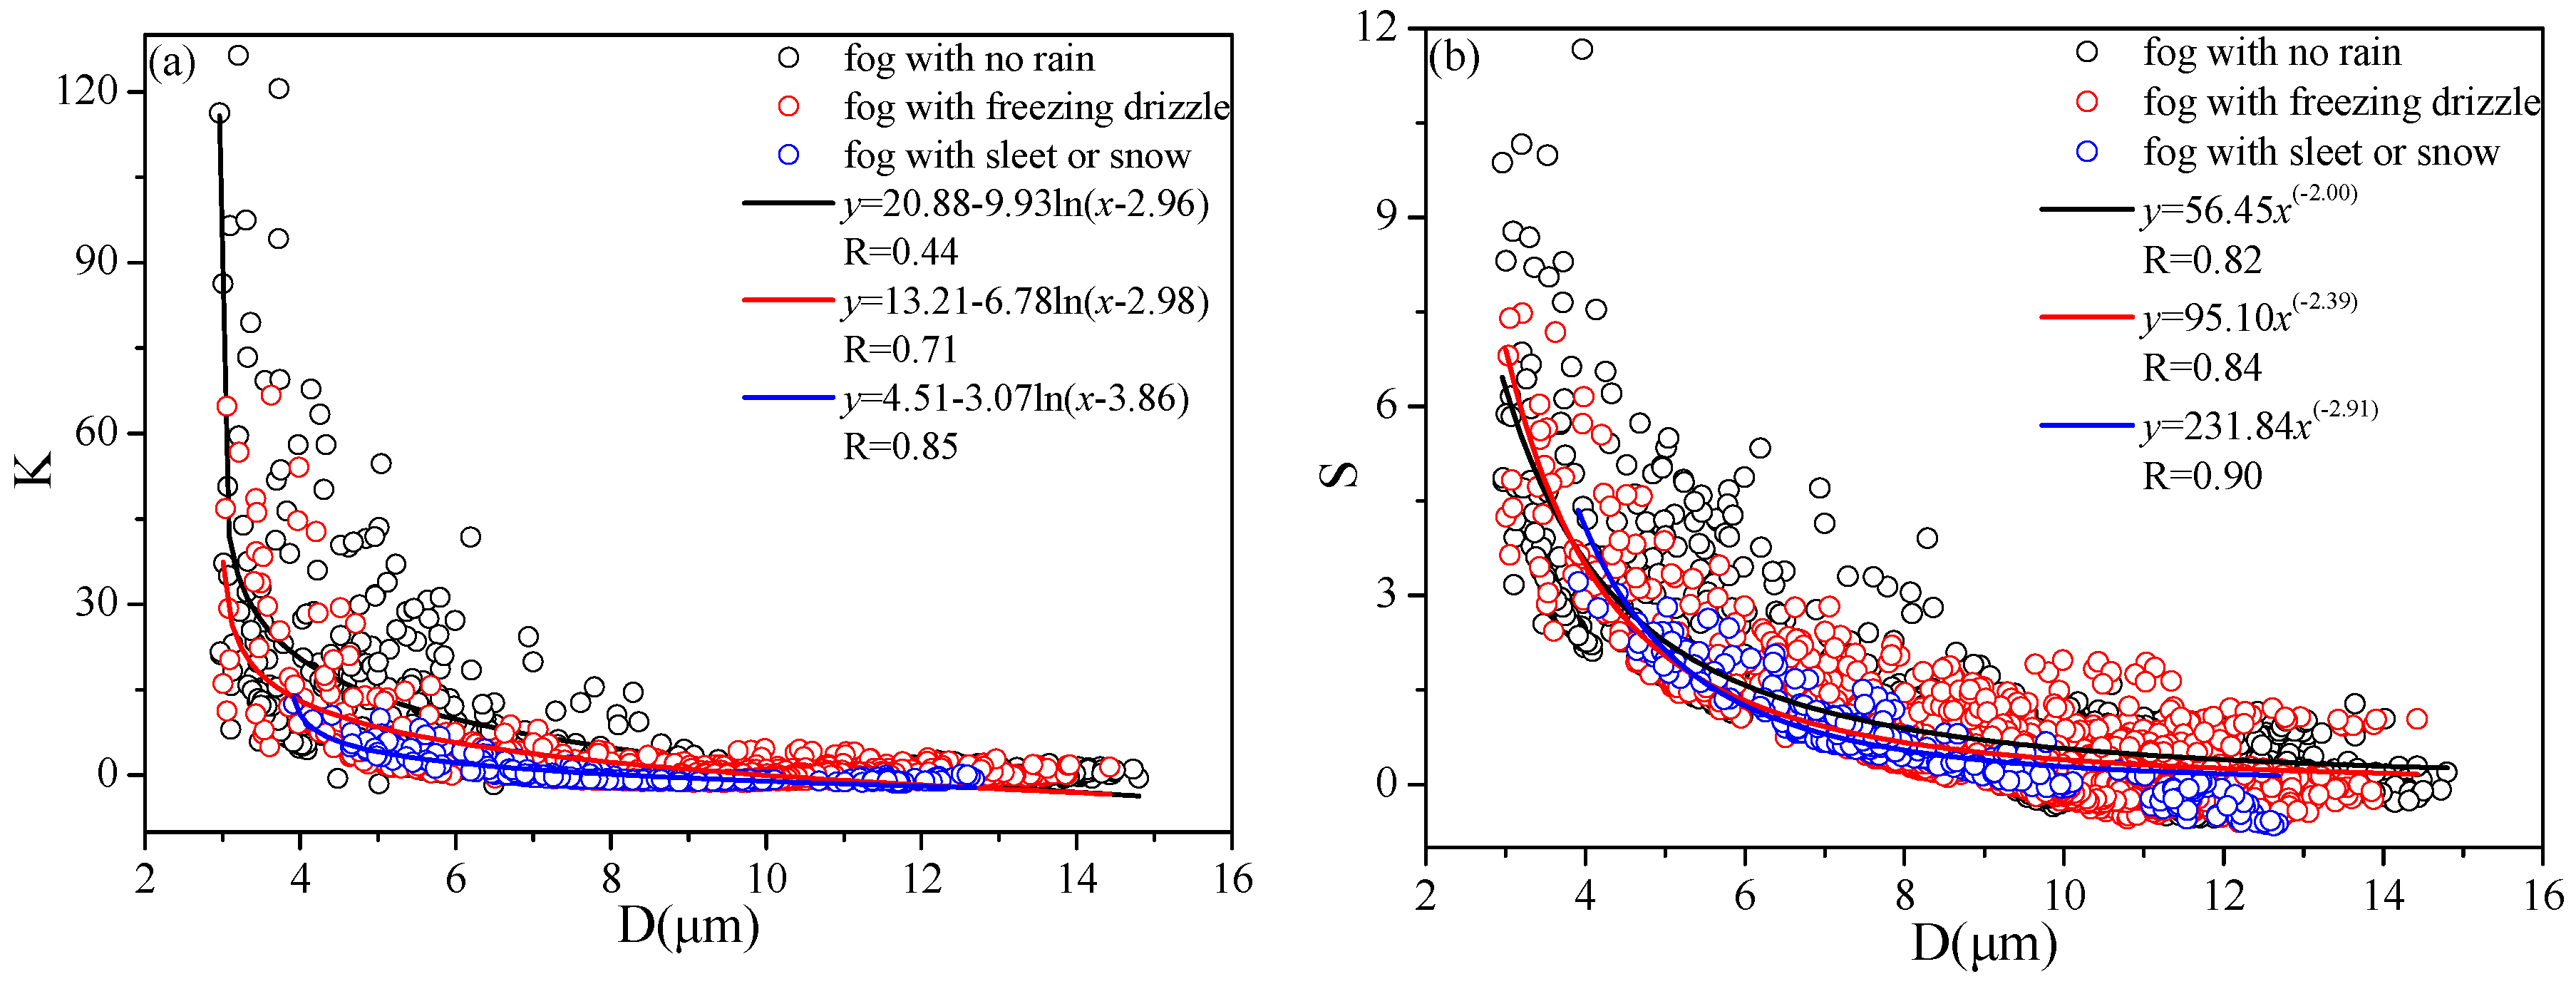
- Under the suppression of raindrops, the distributions of fog droplets showed regular evolution. The distributions of droplet spectra changed from leptokartosis to platykurtosis and from positive skewness to negative skewness with the increase in diameter. The spectrum was closest to a platykurtic distribution under the influence of sleet/snow. In addition, when the average diameter of the fog droplets was smaller than 4 μm, the skewness of the droplet spectrum was greater under the conditions of freezing drizzle.
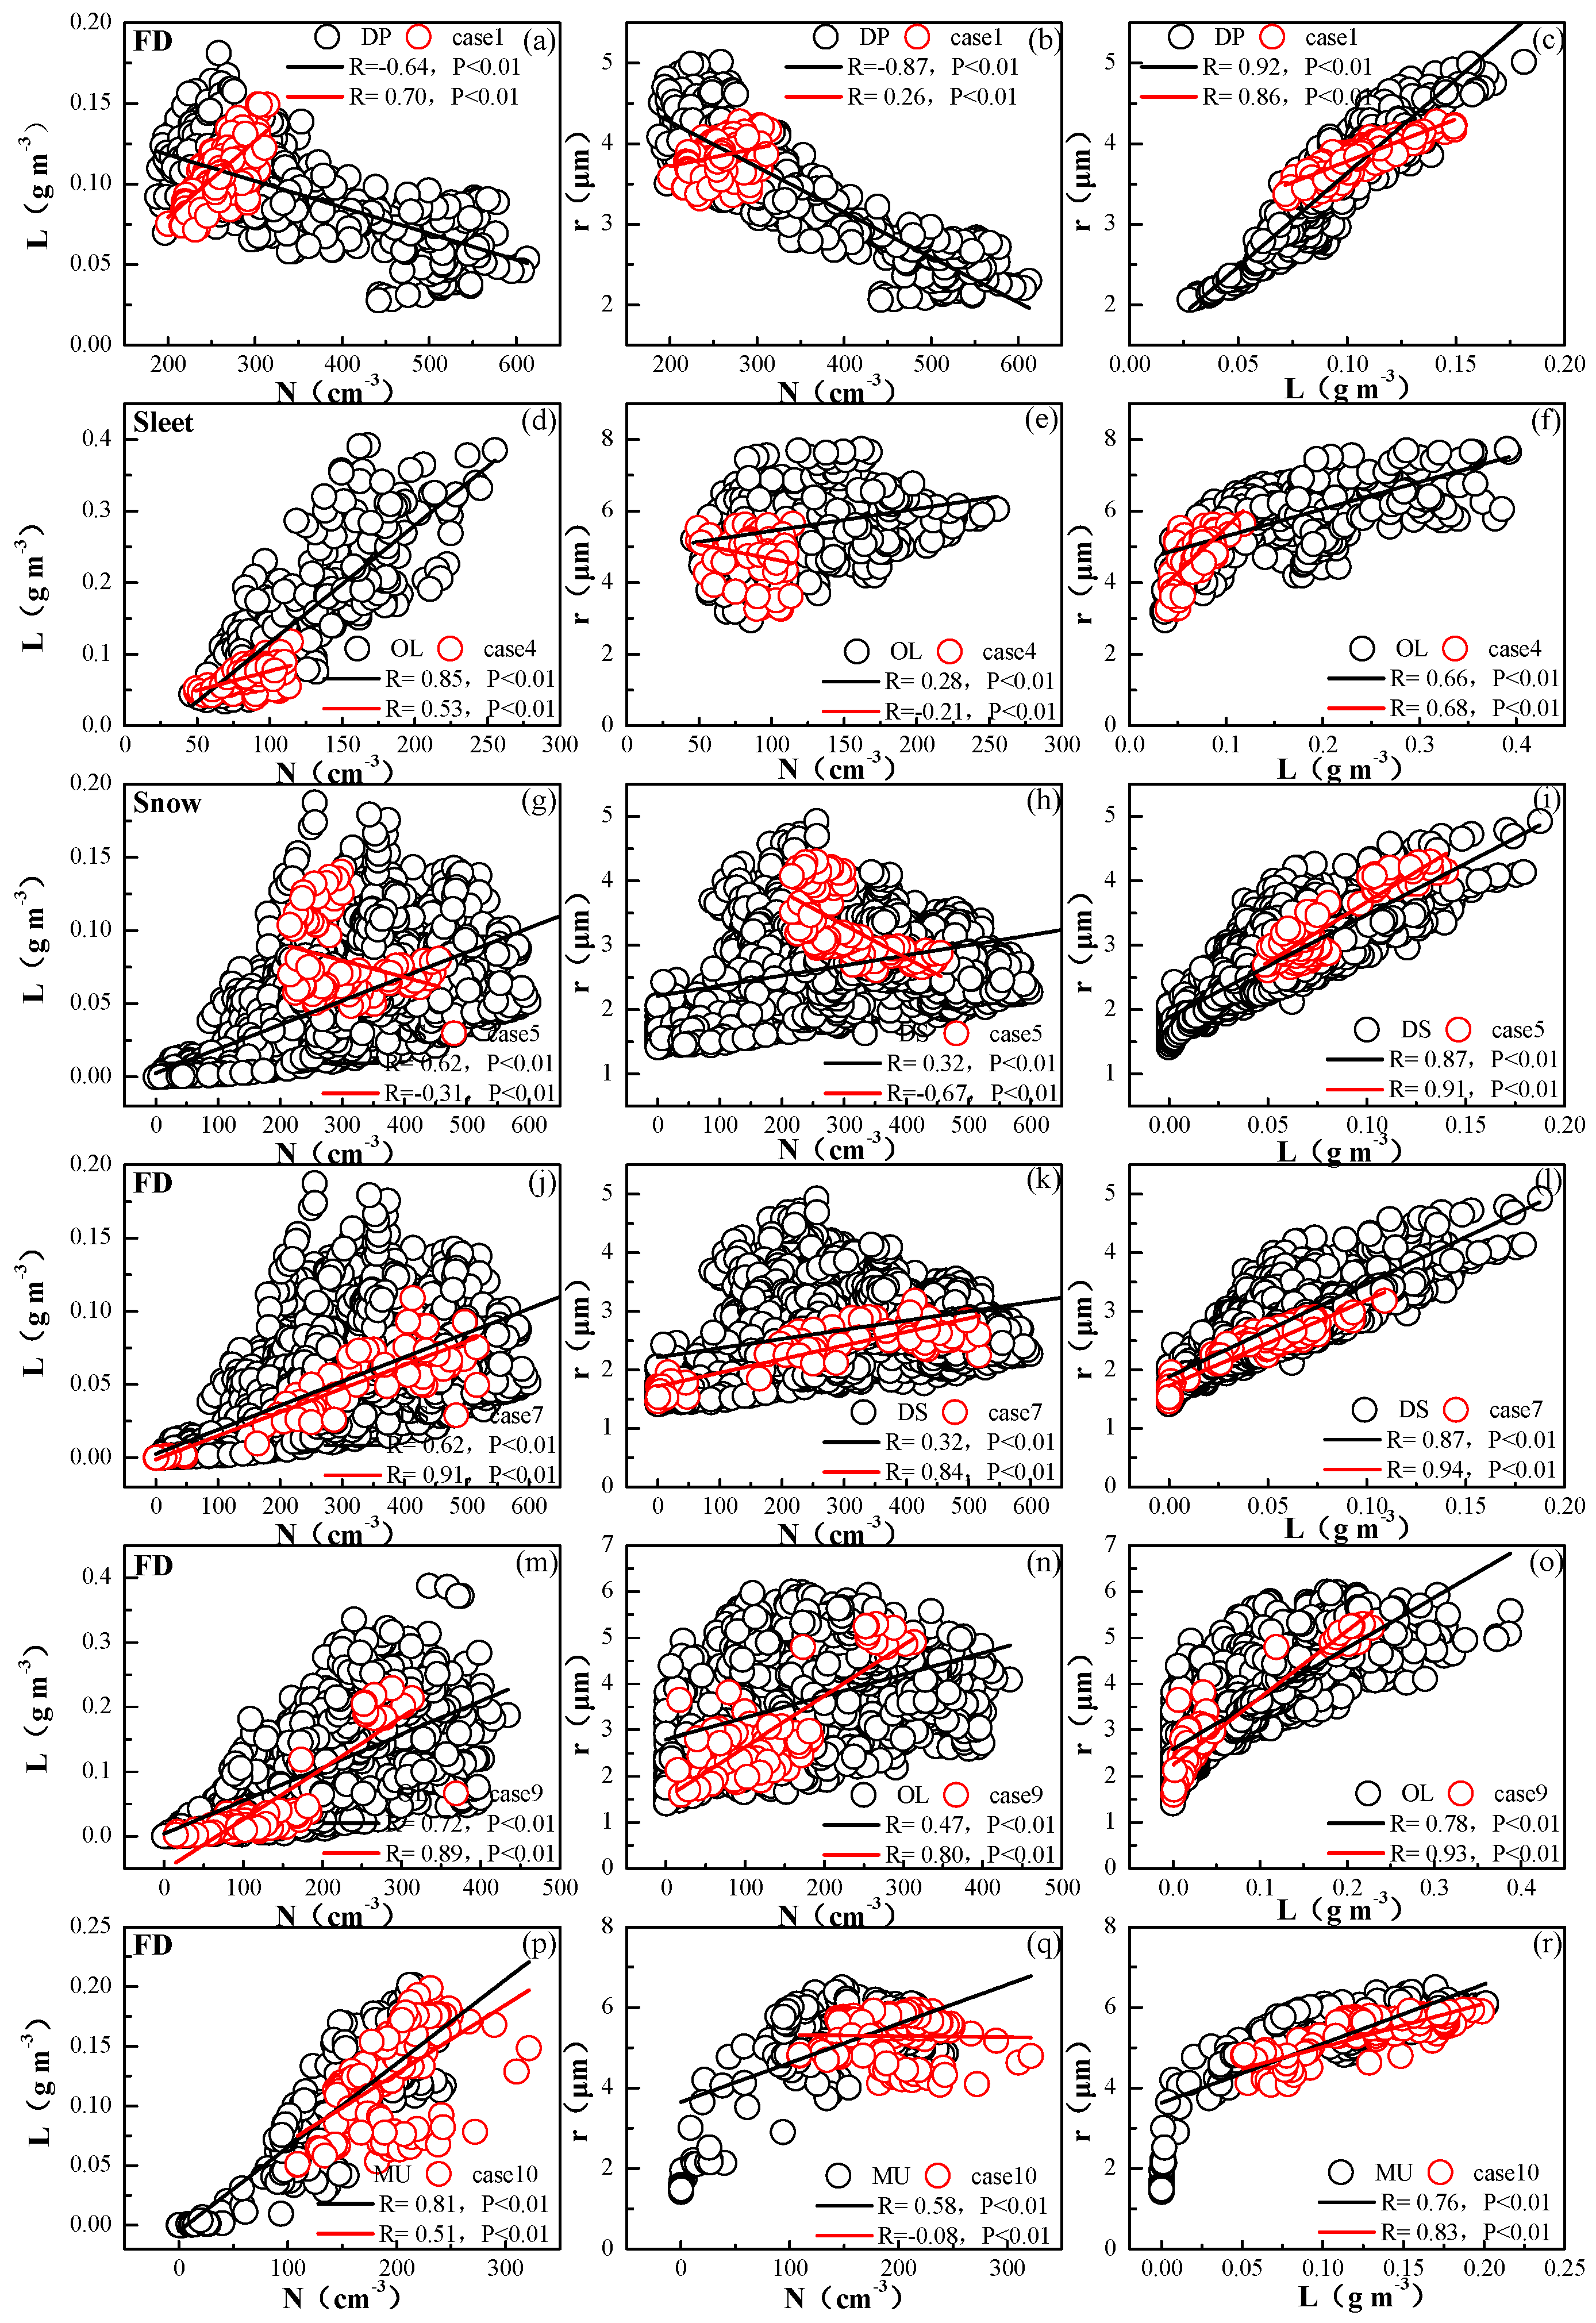
- (4)
- Fog droplets mainly affected by activation with subsequent condensational growth (deactivation via complete droplet evaporation) would lead to the co-variations of N, r, and L, when fog processes were in the maturity, dissipation and oscillation periods. Freezing drizzle would improve the positive correlation of N-r in the dissipation and oscillation periods and reduce the negative correlation of N-r in the maturity period. The relationships among N, r and L demonstrated a strong negative correlation when the fog process was in the development period. The major microphysical mechanism in this period was collision-coalescence, while the occurrence of freezing drizzle would result in the transition of relationships of N-L and N-r into positive correlations. With the advent of solid precipitation particles, relationships of N-L and N-r would transit into negative correlation. Moreover, the number concentrations of small droplets decreased and those for large droplets increased under the influence of snow, causing the negative correlation of N-r to be stronger than that of N-L.
Acknowledgments
Author Contributions
Conflicts of Interest
References
- Lamraoui, F.; Fortin, G.; Benoit, R.; Perron, J.; Masson, C. Atmospheric icing impact on wind turbine production. Cold Reg. Sci. Technol. 2014, 100, 36–49. [Google Scholar] [CrossRef]
- Parent, O.; Llinca, A. Anti-icing and de-icing techniques for wind turbines. Cold Reg. Sci. Technol. 2011, 65, 88–96. [Google Scholar] [CrossRef]
- Neil, D.; Hahmann, A.N.; Clausen, N.E. Forecast of icing events at a wind farm in Sweden. J. Appl. Meteorol. Climatol. 2014, 53, 262–281. [Google Scholar]
- Hu, Y. Analysis and countermeasures for large area accident cause by icing on transmission line. High Volt. Eng. 2005, 31, 14–15. [Google Scholar]
- Drage, M.A.; Hauge, G. Atmospheric icing in a coastal mountainous terrain: Measurements and numerical simulations, a case study. Cold Reg. Sci. Technol. 2008, 53, 150–161. [Google Scholar] [CrossRef]
- Carrière, J.M.; Lainard, C.; Bot, C.L.; Robart, F. A climatological study of surface freezing precipitation in Europe. Meteorol. Appl. 2000, 7, 229–238. [Google Scholar] [CrossRef]
- Yang, J.B.; Li, Z.; Yang, F.L.; Huang, T.Z. Analysis of the features of covered ice and collapsed tower of transmission line snow and ice Attacked in 2008. Adv. Power Syst. Hydroelectr. Eng. 2008, 24, 4–8. [Google Scholar]
- Li, Z.; Yang, J.B.; Han, J.K.; Huang, T.Z.; Huang, H. Analysis on transmission tower toppling caused by icing disaster in 2008. Power Syst. Technol. 2009, 33, 31–35. [Google Scholar]
- Jasinski, W.J.; Noe, S.C.; Selig, M.S.; Bragg, M.B. Wind turbine performance under icing conditions. J. Sol. Energy Eng. 1998, 120, 60–65. [Google Scholar] [CrossRef]
- Jiang, X.L.; Yi, H. Transmission Line Regelation Harm and Protection; China Power Press: Beijing, China, 2002; pp. 3–15. [Google Scholar]
- Farzaneh, M. Atmospheric Icing of Power Networks; Springer: Québec, QC, Canada, 2008; pp. 83–110. [Google Scholar]
- Chen, B.J.; Hu, W.; Pu, J.P. Characteristics of the raindrop size distribution for freezing precipitation observed in southern China. J. Geophys. Res. 2011, 116. [Google Scholar] [CrossRef]
- Bernstein, B.C. Regional and local influences on freezing drizzle, freezing rain, and ice pellet events. Weather Forecast. 2000, 15, 485–508. [Google Scholar] [CrossRef]
- Ikeda, K.; Rasmussen, R.M.; Hall, W.D.; Thompson, G. Observations of freezing drizzle in extratropical cyclonic storms during IMPROVE-2. J. Atmos. Sci. 2007, 64, 3016–3043. [Google Scholar] [CrossRef]
- Changnon, S.A.; Karl, T.R. Temporal and spatial variations of freezing rain in the contiguous United States: 1948–2000. J. Appl. Meteorol. 2003, 42, 1302–1315. [Google Scholar] [CrossRef]
- Frohboese, P.; Anders, A. Effects of icing on wind turbine fatigue loads. J. Phys. Conf. Ser. 2007, 75, 1–13. [Google Scholar] [CrossRef]
- Makkonen, L.; Ahti, K. Climatic mapping of ice loads based on airport weather observations. Atmos. Res. 1995, 36, 185–193. [Google Scholar] [CrossRef]
- Zhou, Y.; Niu, S.J.; Lü, J.J.; Zhao, L.J. Meteorological conditions of ice accretion based on real-time observation of high voltage transmission line. Chin. Sci. Bull. 2012, 57, 812–818. [Google Scholar] [CrossRef]
- Thorkildson, R.M.; Jones, K.F.; Emery, M.K. In-cloud icing in the Columbia Basin. Mon. Weather Rev. 2009, 137, 4369–4381. [Google Scholar] [CrossRef]
- Niu, S.J.; Liu, D.Y.; Zhao, L.J.; Lu, C.S.; Lü, J.J.; Yang, J. Summary of a 4-year fog field study in Northern Nanjing, Part 2: Fog Microphysics. Pure Appl. Geophys. 2012, 169, 1137–1155. [Google Scholar] [CrossRef]
- Pu, M.J.; Zhang, G.Z.; Yan, W.L.; Li, Z.H. The characteristics of an infrequent advection radiation fog. Sci. China Earth Sci. 2008, 38, 776–783. [Google Scholar]
- Fan, Q.; Wang, A.Y.; Fan, S.J.; Wu, D.; Liang, J.J. Numerical simulation study of a radiation fog in Pearl River Delta regions. Sci. Meteorol. Sin. 2004, 24, 1–8. [Google Scholar]
- Niu, S.J.; Lu, C.S.; Liu, Y.G.; Zhao, L.J.; Lü, J.J.; Yang, J. Analysis of the microphysical structure of heavy fog using a droplet spectrometer: A case study. Adv. Atmos. Sci. 2010, 27, 1259–1275. [Google Scholar] [CrossRef]
- Lu, C.S.; Niu, S.J.; Tang, L.L.; Lü, J.J.; Zhao, L.J.; Zhu, B. Chemical composition of fog water in Nanjing area of China and its related fog microphysics. Atmos. Res. 2010, 97, 47–69. [Google Scholar] [CrossRef]
- Jiang, L.L.; Wei, M. Application of fog monitoring with FY-3A data. Remote Sens. Technol. Appl. 2011, 264, 489–495. [Google Scholar]
- Liu, D.Y.; Wei, J.S.; Yan, W.L.; Lü, J.; Sun, Y. Trends of Urban Haze in Jiangsu Province China over the Past 33 Years. Environ. Sci. 2014, 35, 3247–3255. [Google Scholar]
- Wang, L.P.; Chen, S.Y.; Dong, A.X. The distribution and seasonal variations of fog in China. Acta Geogr. Sin. 2005, 60, 134–139. [Google Scholar]
- Li, Z.H.; Huang, J.P.; Huang, Y.S.; Yang, Z.Y.; Wang, Q. Study on the physical process of winter valley fog in Xishuangbanna Region. Acta Meteorol. Sin. 1999, 13, 494–508. [Google Scholar]
- Tang, H.H.; Fan, S.J.; Wu, D.; Deng, X.J. Research of the microphysical structure and evolution of dense fog over Nanling Mountain area. Acta Sci. Nat. Univ. Sunyatseni 2002, 41, 92–96. [Google Scholar]
- Wu, D.; Deng, X.J.; Ye, Y.X.; Mao, W.K. The study of fog-water chemical composition in Dayaoshan of Nanling Mountain. Acta Meteorol. Sin. 2004, 62, 476–485. [Google Scholar]
- Niu, S.J.; Lu, C.S.; Lü, J.J.; Xu, F.; Zhao, L.J.; Liu, D.Y.; Yue, Y.Y.; Zhou, Y.; Yu, H.Y.; Wang, T.S. Advances in fog research in China. Adv. Meteorol. Sci. Technol. 2016, 2, 1–14. [Google Scholar]
- Niu, S.J.; Lu, C.S.; Yu, H.Y.; Zhao, L.J.; Lü, J.J. Fog research in China: An overview. Adv. Atmos. Sci. 2010, 27, 639–662. [Google Scholar] [CrossRef]
- Deng, X.J.; Wu, D.; Ye, Y.X. Physical characteristics of dense fog at Nanling mountain region. J. Trop. Meteorol. 2002, 18, 227–237. [Google Scholar]
- Shi, Y.Q.; Deng, X.J.; Hu, Z.J.; Wu, D. Three-dimensional numerical study on dense fog over mountain area. J. Trop. Meteorol. 2006, 22, 351–359. [Google Scholar]
- Wu, D.; Zhao, B.; Deng, X.J.; Bi, X.Y.; Fan, S.J. A study on bad visibility over foggy section of freeway in Nanling mountainous region. Plateau Meteorol. 2007, 26, 649–654. [Google Scholar]
- Deng, X.J.; Wu, D.; Tang, H.H.; Fan, S.J.; Huang, H.H.; Mao, W.K.; Ye, Y.X. Analyses on boundary layer structure of a frontal heavy fog process in Nanling mountain area. Plateau Meteorol. 2007, 26, 881–889. [Google Scholar]
- Luo, N.; Wen, J.F.; Zhao, C.; Tang, L. Observation study on properties of cloud and fog in ice accretion areas. J. Appl. Meteorol. Sci. 2008, 19, 91–95. [Google Scholar]
- Hodges, D.; Pu, Z.X. The climatology, frequency, and distribution of cold season fog events in Northern Utah. Pure Appl. Geophys. 2015, 172, 1–15. [Google Scholar] [CrossRef]
- Gultepe, I.; Isaac, G.A.; Joe, P.; Kucera, P.A.; Theriault, J.M.; Fisico, T. Roundhouse (RND) mountain top research site: Measurements and uncertainties for winter alpine weather conditions. Pure Appl. Geophys. 2014, 171, 59–85. [Google Scholar] [CrossRef]
- Rauber, R.M.; Olthoff, L.S.; Ramamurthy, M.K.; Kunkel, K.E. The relative importance of warm rain and melting processes in freezing precipitation events. J. Appl. Meteor. 2000, 39, 1185–1195. [Google Scholar] [CrossRef]
- Rasmussen, R.M.; Geresdi, I.; Thompson, G.; Manning, K.; Karplus, E. Freezing drizzle formation in stably stratified layer clouds: The role of radiative cooling of cloud droplets and cloud condensation and ice nuclei. J. Atmos. Sci. 2002, 59, 837–860. [Google Scholar] [CrossRef]
- Cortinas, J.V.; Bernstein, B.C.; Robbins, C.C.; Strapp, J.W. An analysis of freezing rain, freezing drizzle, and ice pellets across the United States and Canada. Weather Forecast. 2010, 19, 377–390. [Google Scholar] [CrossRef]
- Fernández, G.S.; Valero, F.; Sanchez, J.L.; Gascón, E.; López, L.; Garcia, O.E.; Merino, A. Observation of a freezing drizzle episode: A case study. Atmos. Res. 2014, 149, 244–254. [Google Scholar] [CrossRef]
- Li, H.Y.; Hu, Z.X.; Wei, X. Analysis of meteorological elements in rain/snow-mixed fogs. Chin. J. Atmos. Sci. 2010, 34, 843–852. [Google Scholar]
- Geresdi, I.; Rasmussen, R.; Grabowski, W.; Bernstein, B. Sensitivity of freezing drizzle formation in stably stratified clouds to ice processes. Meteorol. Atmos. Phys. 2005, 88, 91–105. [Google Scholar] [CrossRef]
- Niu, S.J.; Zhou, Y.; Jia, R.; Yang, J.; Lü, J.J.; Ke, Y.M.; Yang, Z.B. The microphysics of ice accretion on wires: Observations and simulations. Sci. China Earth Sci. 2012, 55, 428–437. [Google Scholar] [CrossRef]
- Yue, Y.Y.; Niu, S.J.; Zhao, L.J.; Zhang, Y.; Xu, F. Chemical composition of sea fog water along the South China Sea. Pure Appl. Geophys. 2012, 169, 2231–2249. [Google Scholar] [CrossRef]
- Niu, S.J.; Jia, X.C.; Sang, J.R.; Liu, X.L.; Lu, C.S.; Liu, Y.G. Distributions of raindrop sizes and fall velocities in a semiarid plateau climate: Convective versus stratiform rains. J. Appl. Meteorol. Climatol. 2010, 49, 632–645. [Google Scholar] [CrossRef]
- Jones, K.F. A simple model for freezing rain ice loads. Atmos. Res. 1998, 46, 87–97. [Google Scholar] [CrossRef]
- Gultepe, I.; Tardif, R.; Michaelides, S.C.; Cermak, J.; Bott, A.; Bendix, J.; Müller, M.D.; Pagowski, M.; Hansen, B.; Ellrod, G.; et al. Fog research: A review of past achievements and future perspectives. Pure Appl. Geophys. 2007, 164, 1121–1159. [Google Scholar] [CrossRef]
- Sheng, P.X.; Mao, J.T.; Li, J.G.; Zhang, A.C.; Sang, J.G.; Pan, N.X. Atmospheric Physics; Peking University Press: Beijing, China, 2003; pp. 336–342. [Google Scholar]
- Lin, C.L.; Lee, S.C. Collision efficiency of water drops in the atmosphere. J. Atmos. Sci. 1975, 32, 1412–1418. [Google Scholar] [CrossRef]
- Gu, Z.C. Recent investigations in the theory of the formation of the cloud-drop spectra. Acta. Meteorol. Sin. 1962, 32, 267–284. [Google Scholar]
- Lu, C.S. Investigation of Main Macro and Micro Physical Processes in Fogs and Low-Level Clouds. Ph.D. Thesis, Nanjing University of Information Science and Technology, Nanjing, China, 2012; pp. 1–5. [Google Scholar]
- Liu, Y.G. The application of skewness and kurtosis to the studies on particle distribution. Meteorol. Mon. 1991, 17, 9–14. [Google Scholar]
- Liu, Y.G.; Chen, W.K.; Liu, G.Z. Investigation of aerosol particle size spectra-a simple statistical method. Acta Sci. Circumstantiae 1993, 13, 22–30. [Google Scholar]


| Event | Time | Precipitation Type | Duration (min) | R (mm·h−1) | Nfog (cm−3) | Lfog (g·m−3) | Dfog (μm) | Period |
|---|---|---|---|---|---|---|---|---|
| case1 | 15 February 2009 16:25–18:30 | freezing drizzle | 125 | 0.47 | 257.69 | 0.11 | 3.85 | development |
| case2 | 17 February 2009 01:00–02:35 | freezing drizzle | 95 | 0.09 | 289.10 | 0.15 | 4.47 | maturity |
| case3 | 17 February 2009 12:30–13:35 | freezing drizzle | 65 | 0.23 | 151.53 | 0.17 | 5.40 | maturity |
| case4 | 18 February 2009 20:00–21:10 | sleet | 70 | 4.16 | 86.75 | 0.07 | 4.78 | oscillation |
| case5 | 1 March 2009 00:10–01:35 | snow | 85 | 1.33 | 305.45 | 0.08 | 3.31 | dissipation |
| case6 | 1 March 2009 04:00–06:20 | sleet | 140 | 3.32 | 161.58 | 0.04 | 2.88 | dissipation |
| case7 | 2 March 2009 09:50–11:00 | freezing drizzle | 70 | 0.09 | 254.81 | 0.04 | 2.32 | dissipation |
| case8 | 3 March 2009 06:15–11:20 | freezing drizzle | 305 | 0.36 | 129.25 | 0.09 | 3.93 | oscillation |
| case9 | 3 March 2009 14:00–15:15 | freezing drizzle | 75 | 0.09 | 120.66 | 0.04 | 2.85 | oscillation |
| case10 | 9 January 2010 23:50–10 January 03:05 | freezing drizzle | 195 | 0.12 | 187.12 | 0.13 | 4.65 | maturity |
| case11 | 10 January 2010 13:50–17:10 | freezing drizzle | 200 | 0.17 | 123.83 | 0.06 | 3.73 | dissipation |
| case12 | 10 January 2010 23:50–11 January 01:20 | freezing drizzle | 90 | 0.20 | 223.64 | 0.02 | 1.91 | oscillation |
| case13 | 21 January 2010 23:00–22 January 03:00 | freezing drizzle | 240 | 0.08 | 213.75 | 0.13 | 4.56 | maturity |
| case14 | 22 January 2010 08:45–10:30 | freezing drizzle | 105 | 0.18 | 359.24 | 0.10 | 3.30 | maturity |
© 2016 by the authors; licensee MDPI, Basel, Switzerland. This article is an open access article distributed under the terms and conditions of the Creative Commons Attribution (CC-BY) license (http://creativecommons.org/licenses/by/4.0/).
Share and Cite
Zhou, Y.; Niu, S.; Lü, J.; Zhou, Y. The Effect of Freezing Drizzle, Sleet and Snow on Microphysical Characteristics of Supercooled Fog during the Icing Process in a Mountainous Area. Atmosphere 2016, 7, 143. https://doi.org/10.3390/atmos7110143
Zhou Y, Niu S, Lü J, Zhou Y. The Effect of Freezing Drizzle, Sleet and Snow on Microphysical Characteristics of Supercooled Fog during the Icing Process in a Mountainous Area. Atmosphere. 2016; 7(11):143. https://doi.org/10.3390/atmos7110143
Chicago/Turabian StyleZhou, Yue, Shengjie Niu, Jingjing Lü, and Yuehua Zhou. 2016. "The Effect of Freezing Drizzle, Sleet and Snow on Microphysical Characteristics of Supercooled Fog during the Icing Process in a Mountainous Area" Atmosphere 7, no. 11: 143. https://doi.org/10.3390/atmos7110143