
Bacterial and Fungal Aerosols in Rural Nursery Schools in Southern Poland


Abstract
:1. Introduction
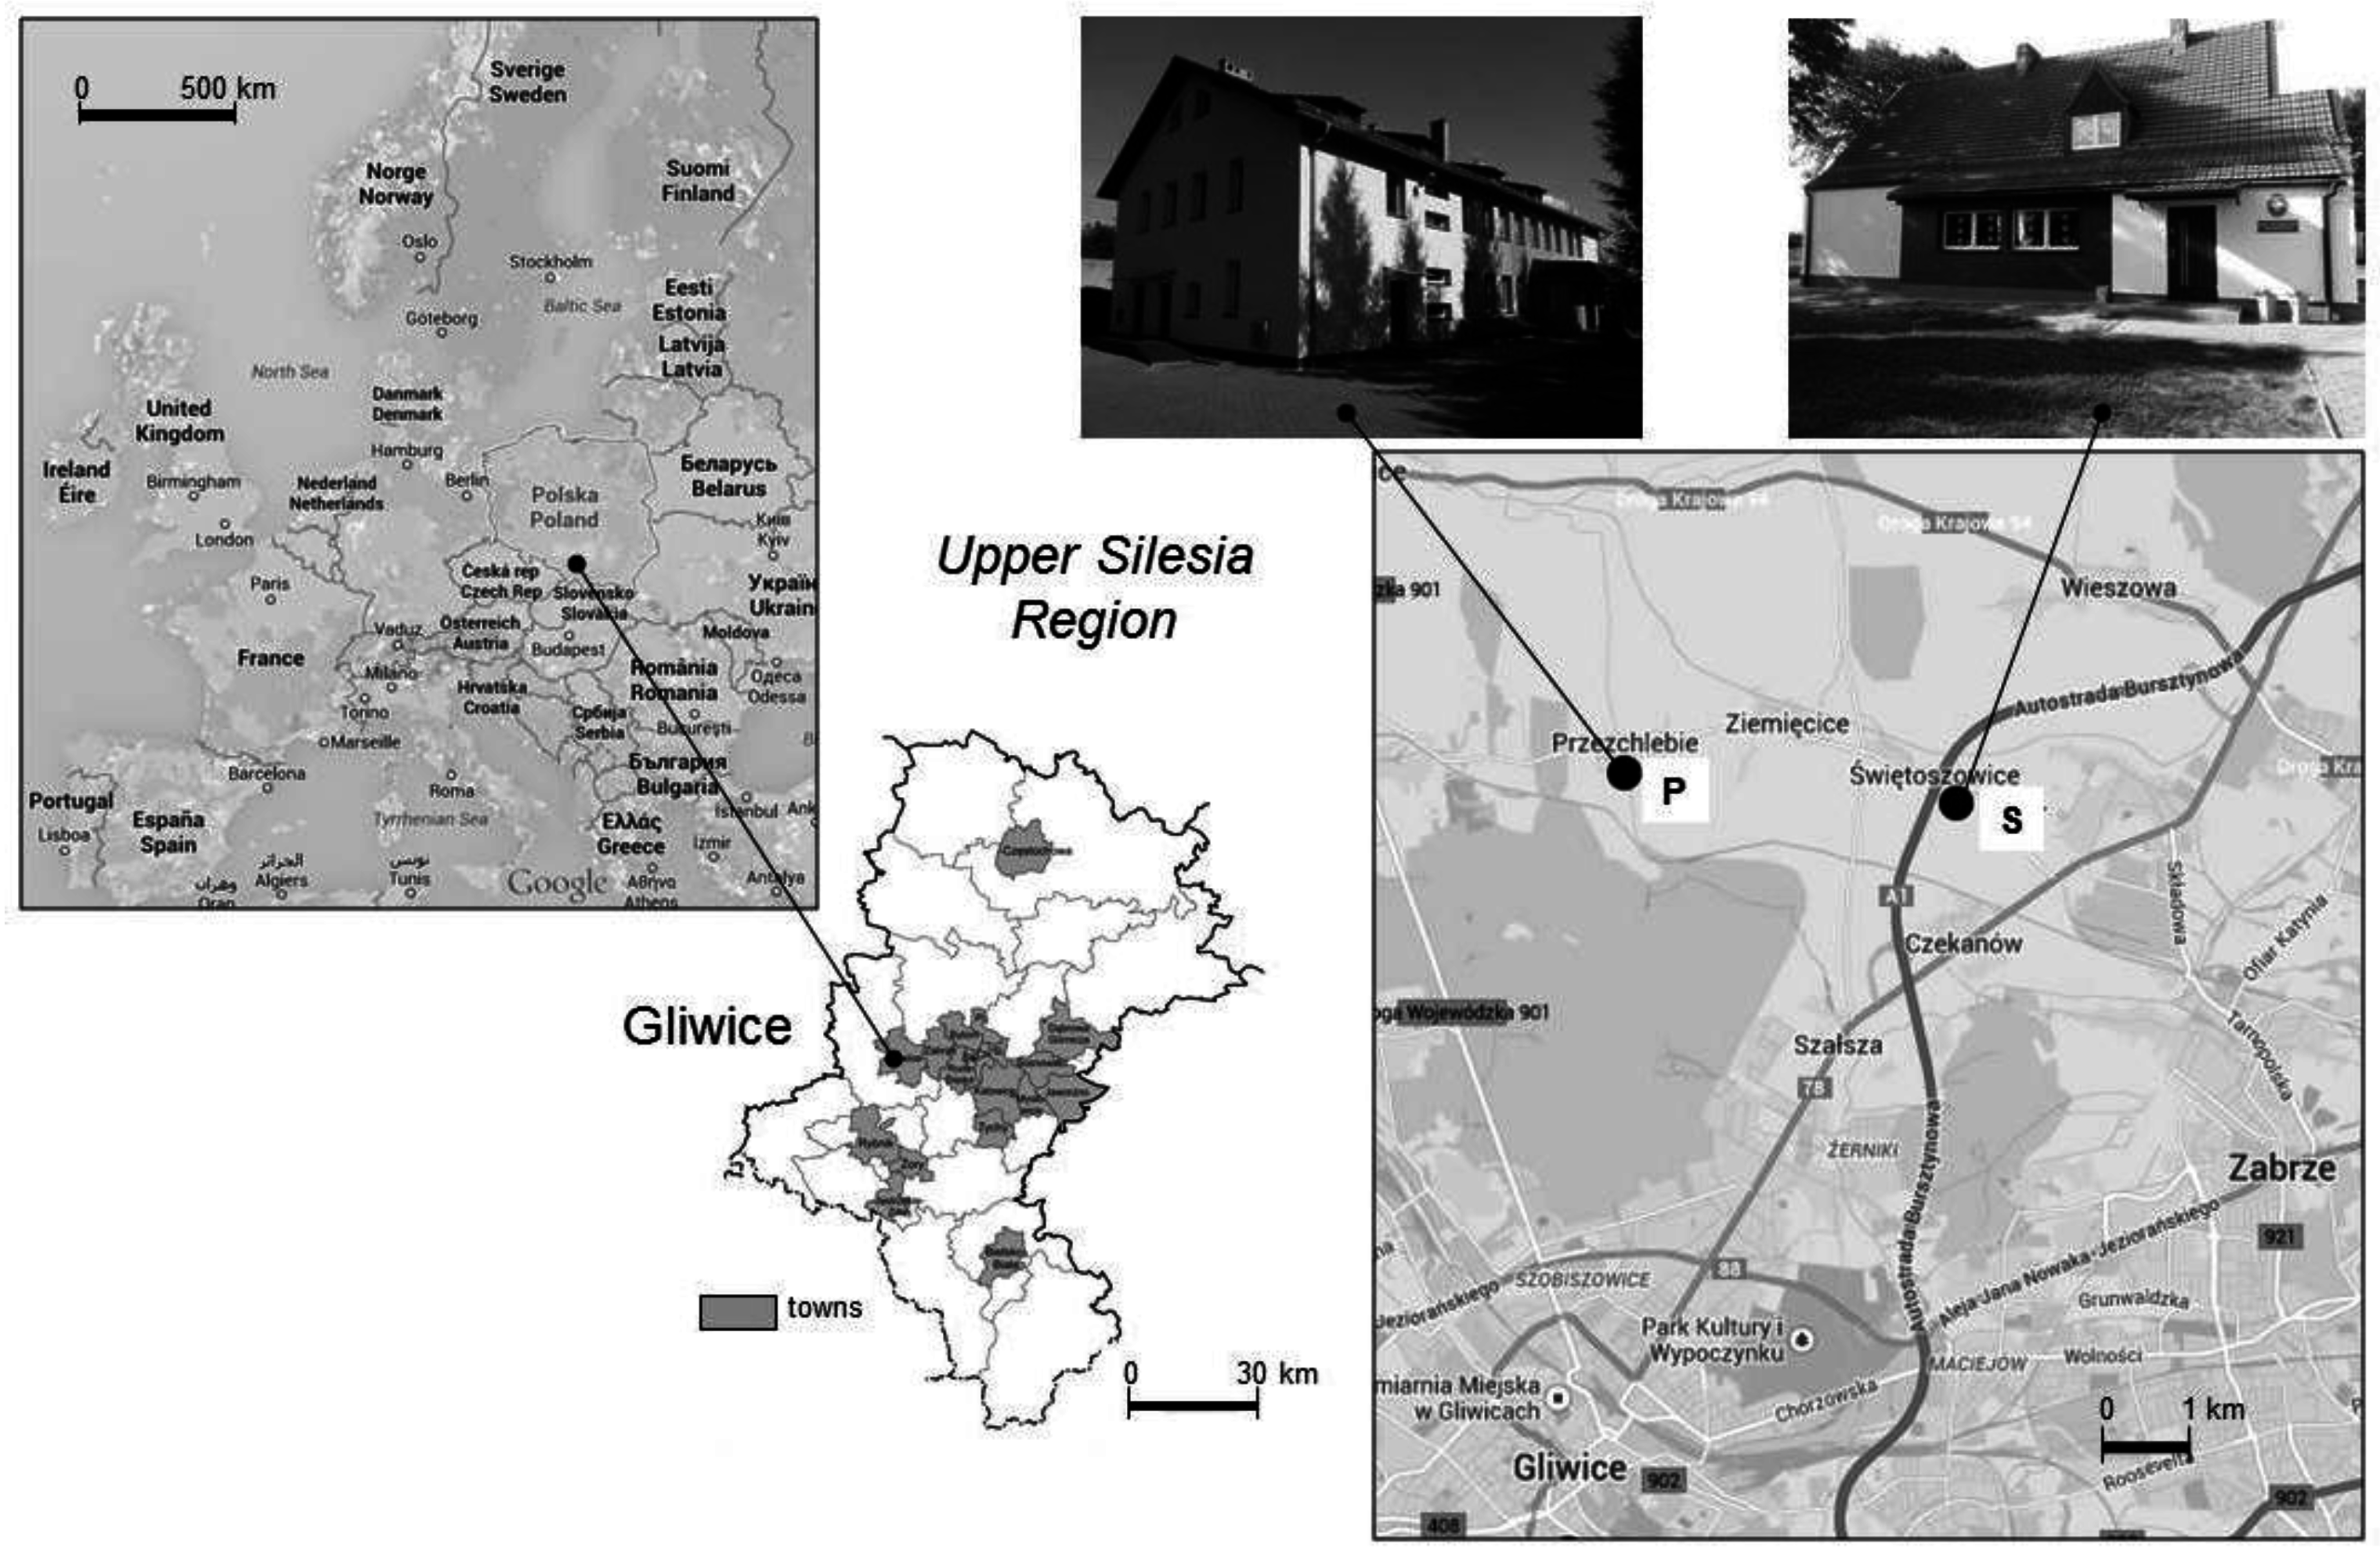
2. Materials
3. Methods
4. Results and Discussion
4.1. Total Concentration of Bacterial and Fungal Aerosols
4.2. Indoor-Outdoor and Winter-Spring Relationships
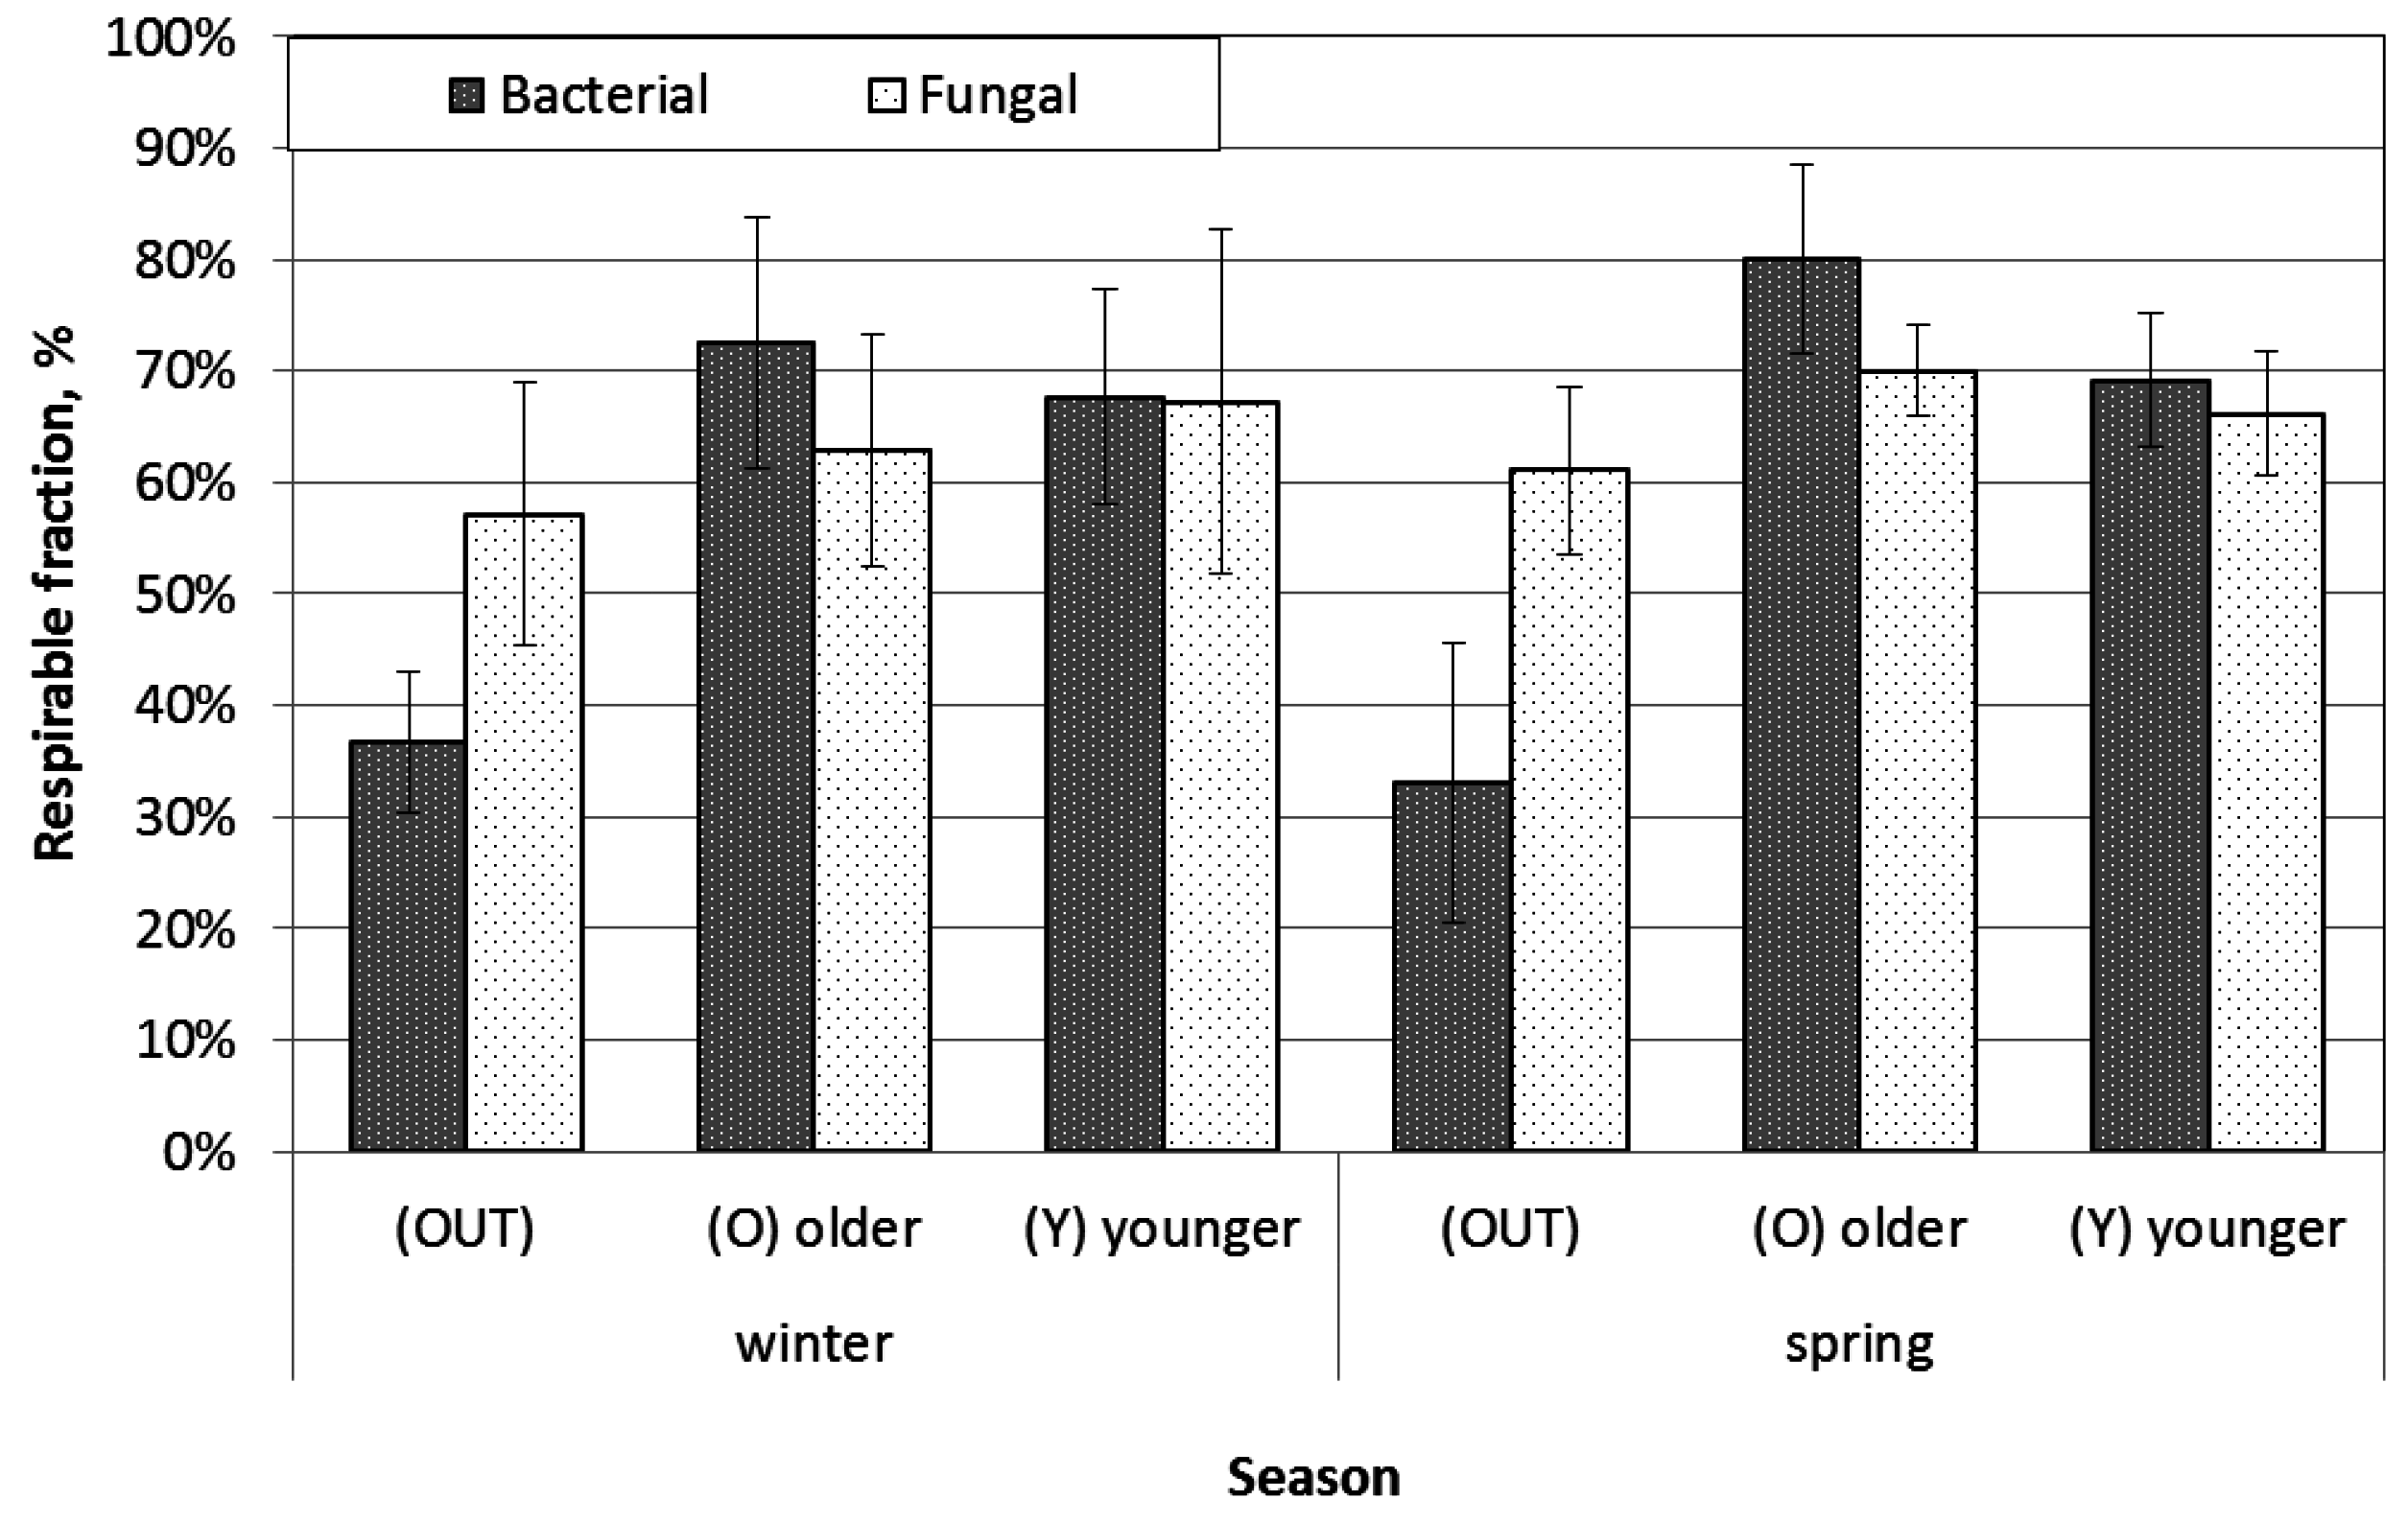
4.3. Size Distribution of Bacterial and Fungal Aerosol
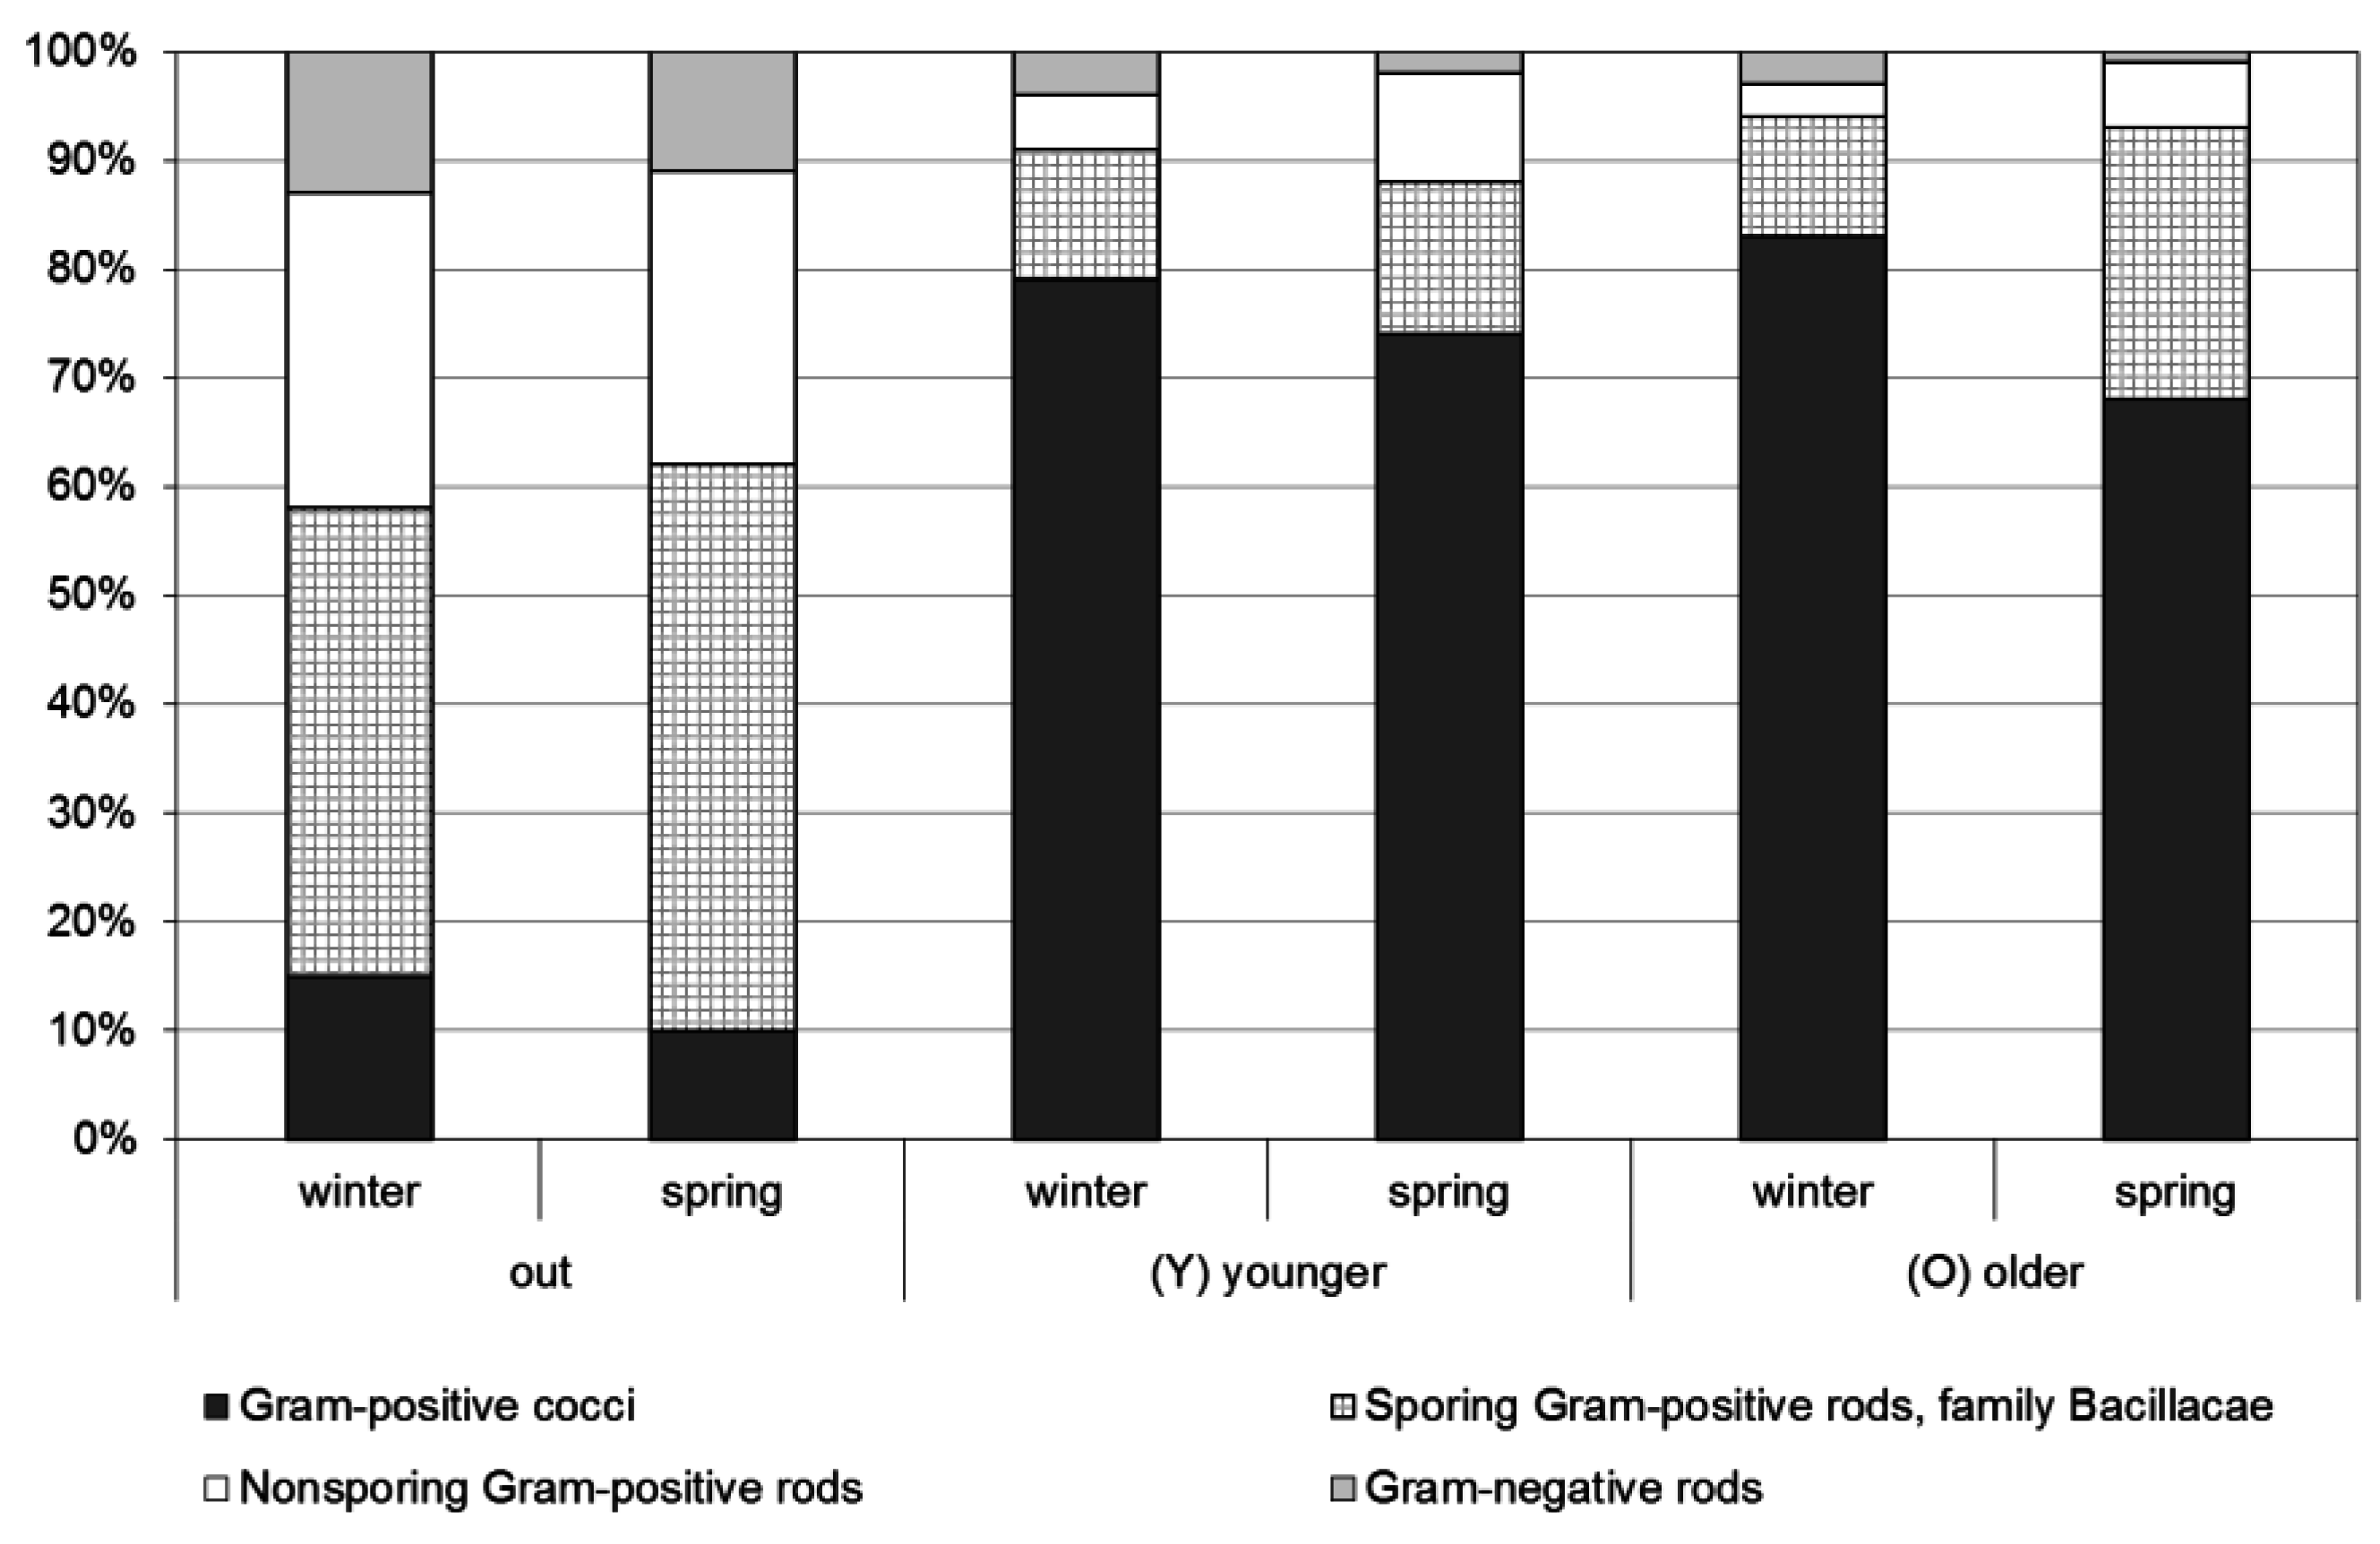
4.4. Characterization of Bacterial Aerosols
4.5. Nursery School Exposure Dose (NSED)
5. Conclusions
Supplementary Materials
Acknowledgments
Author Contributions
Conflicts of Interest
References
- Kotzias, D. Indoor air and human exposure assessment—Needs and approaches. Exp. Toxicol. Pathol. 2005, 57, 5–7. [Google Scholar] [CrossRef] [PubMed]
- Yassin, M.F.; Almouqatea, S. Assessment of airborne bacteria and fungi in an indoor and outdoor environment. Int. J. Environ. Sci. Technol. 2010, 7, 535–544. [Google Scholar] [CrossRef]
- D’Arcy, N.; Canales, M.; Spratt, D.A. Healthy schools: Standardisation of culturing methods for seeking airborne pathogens in bioaerosols emitted from human sources. Aerobiologia (Bologna) 2012, 28, 413–422. [Google Scholar] [CrossRef]
- Demirel, G.; Özden, Ö.; Döǧeroǧlu, T.; Gaga, E.O. Personal exposure of primary school children to BTEX, NO2 and ozone in Eskişehir, Turkey: Relationship with indoor/outdoor concentrations and risk assessment. Sci. Total Environ. 2014, 473–474, 537–548. [Google Scholar] [CrossRef] [PubMed]
- Yoon, C.; Lee, K.; Park, D. Indoor air quality differences between urban and rural preschools in Korea. Environ. Sci. Pollut. Res. 2011, 18, 333–345. [Google Scholar] [CrossRef] [PubMed]
- Patelarou, E.; Tzanakis, N.; Kelly, F.J. Exposure to Indoor Pollutants and Wheeze and Asthma Development during Early Childhood. Int. J. Environ. Res. Public Health 2015, 12, 3993–4017. [Google Scholar] [CrossRef] [PubMed]
- Walser, S.M.; Gerstner, D.G.; Brenner, B.; Bünger, J.; Eikmann, T.; Janssen, B.; Kolb, S.; Kolk, A.; Nowak, D.; Raulf, M.; et al. Evaluation of exposure–response relationships for health effects of microbial bioaerosols—A systematic review. Int. J. Hyg. Environ. Health 2015, 218, 577–589. [Google Scholar] [CrossRef] [PubMed]
- Mentese, S.; Rad, A.Y.; Arisoy, M.; Gullu, G. Seasonal and Spatial variations of bioaerosols in indoor urban environments, Ankara, Turkey. Indoor Built Environ. 2012, 21, 797–810. [Google Scholar] [CrossRef]
- Nasir, Z.A.; Colbeck, I. Assessment of bacterial and fungal aerosol in different residential settings. Water Air Soil Pollut. 2010, 211, 367–377. [Google Scholar] [CrossRef]
- Fabian, M.P.; Miller, S.L.; Reponen, T.; Hernandez, M.T. Ambient bioaerosol indices for indoor air quality assessments of flood reclamation. J. Aerosol Sci. 2005, 36, 763–783. [Google Scholar] [CrossRef]
- Nazaroff, W.W. Indoor bioaerosol dynamics. Indoor Air 2015, 26, 61–78. [Google Scholar] [CrossRef] [PubMed]
- Hospodsky, D.; Qian, J.; Nazaroff, W.W.; Yamamoto, N.; Bibby, K.; Rismani-Yazdi, H.; Peccia, J. Human occupancy as a source of indoor airborne bacteria. PLoS ONE 2012, 7, e34867. [Google Scholar] [CrossRef] [PubMed] [Green Version]
- Moon, K.W.; Huh, E.H.; Jeong, H.C. Seasonal evaluation of bioaerosols from indoor air of residential apartments within the metropolitan area in South Korea. Environ. Monit. Assess. 2014, 186, 2111–2120. [Google Scholar] [CrossRef] [PubMed]
- Aydogdu, H.; Asan, A.; Tatman Otkun, M. Indoor and outdoor airborne bacteria in child day-care centers in Edirne City (Turkey), seasonal distribution and influence of meteorological factors. Environ. Monit. Assess. 2010, 164, 53–66. [Google Scholar] [CrossRef] [PubMed]
- Menteşe, S.; Arisoy, M.; Rad, A.Y.; Güllü, G. Bacteria and fungi levels in various indoor and outdoor environments in Ankara, Turkey. Clean Soil Air Water 2009, 37, 487–493. [Google Scholar] [CrossRef]
- Górny, R.L.; Dutkiewicz, J. Bacterial and fungal aerosols in indoor environment in central and eastern European countries. Ann. Agric. Environ. Med. 2002, 9, 17–23. [Google Scholar] [PubMed]
- Kim, K.Y.; Kim, C.N. Airborne microbiological characteristics in public buildings of Korea. Build. Environ. 2007, 42, 2188–2196. [Google Scholar] [CrossRef]
- Dumała, S.M.; Dudzińska, M.R. Microbiological indoor air quality in Polish schools. Annu. Set Environ. Prot. 2013, 15, 231–244. [Google Scholar]
- Canha, N.; Almeida, S.M.; do Carmo Freitas, M.; Wolterbeek, H.T. Assessment of bioaerosols in urban and rural primary schools using passive and active sampling methodologies. Arch. Environ. Prot. 2015, 41, 11–22. [Google Scholar] [CrossRef]
- Hospodsky, D.; Yamamoto, N.; Nazaroff, W.W.; Miller, D.; Gorthala, S.; Peccia, J. Characterizing airborne fungal and bacterial concentrations and emission rates in six occupied children’s classrooms. Indoor Air 2015, 25, 641–652. [Google Scholar] [CrossRef] [PubMed]
- Pastuszka, J.S. Exposure of the General Population Living in Upper Silesia Industrial Zone to the Particulate, Fibrous and Biological (Bacteria and Fungi) Aerosols; Wroclaw Technical University: Wroclaw, Poland, 2001. (In Polish) [Google Scholar]
- Pastuszka, J.S.; Marchwińska-Wyrwał, E.; Wlazło, A. Bacterial aerosol in Silesian hospitals: Preliminary results. Pol. J. Environ. Stud. 2005, 14, 883–890. [Google Scholar]
- Nasir, Z.A.; Mula, V.; Stokoe, J.; Colbeck, I.; Loeffler, M. Evaluation of total concentration and size distribution of bacterial and fungal aerosol in healthcare built environments. Indoor Built Environ. 2015, 24, 269–279. [Google Scholar] [CrossRef]
- Prussin, A.J.; Vikram, A.; Bibby, K.J.; Marr, L.C. Seasonal dynamics of the airborne bacterial community and selected viruses in a children’s daycare center. PLoS ONE 2016, 11, e0151004. [Google Scholar] [CrossRef] [PubMed]
- Lee, L.; Tin, S.; Kelley, S.T. Culture-independent analysis of bacterial diversity in a child-care facility. BMC Microbiol. 2007, 7, 27–30. [Google Scholar] [CrossRef] [PubMed]
- Andersson, A.M.; Weiss, N.; Rainey, F.; Salkinoja-Salonen, M.S. Dust-borne bacteria in animal sheds, schools and children’s day care centers. J. Appl. Microbiol. 1999, 86, 622–634. [Google Scholar] [CrossRef] [PubMed]
- Shin, S.-K.; Kim, J.; Ha, S.; Oh, H.-S.; Chun, J.; Sohn, J.; Yi, H. Metagenomic insights into the bioaerosols in the indoor and outdoor environments of childcare facilities. PLoS ONE 2015, 10, e0126960. [Google Scholar] [CrossRef] [PubMed]
- Cyprowski, M.; Buczyńska, A.; Szadkowska-Stańczyk, I. Indoor allergens in settled dust from kindergartens in city of Łódź, Poland. Int. J. Occup. Med. Environ. Health 2013, 26, 890–899. [Google Scholar] [CrossRef] [PubMed]
- Górny, R.; Gołofit-Szymczak, M.; Stobnicka, A. Biological agents in kindergartens [in Polish Szkodliwe czynniki biologiczne w przedszkolach]. Bezpieczeństwo Pracy Nauka i Praktyka 2014, 2, 16–20. [Google Scholar]
- Deng, W.; Chai, Y.; Lin, H.; So, W.W.M.; Ho, K.W.K.; Tsui, A.K.Y.; Wong, R.K.S. Distribution of bacteria in inhalable particles and its implications for health risks in kindergarten children in Hong Kong. Atmos. Environ. 2016, 128, 268–275. [Google Scholar] [CrossRef]
- Mainka, A.; Brągoszewska, E.; Kozielska, B.; Pastuszka, J.S.; Zajusz-Zubek, E. Indoor air quality in urban nursery schools in Gliwice, Poland: Analysis of the case study. Atmos. Pollut. Res. 2015, 6, 1098–1104. [Google Scholar] [CrossRef]
- Brągoszewska, E.; Mainka, A.; Pastuszka, J.S. Bacterial aerosols in an urban nursery school in Gliwice, Poland: A case study. Aerobiologia (Bologna) 2016, 32, 469–480. [Google Scholar] [CrossRef]
- Mainka, A.; Zajusz-Zubek, E. Indoor Air quality in urban and rural preschools in Upper Silesia, Poland: Particulate Matter and carbon dioxide. Int. J. Environ. Res. Public Health 2015, 12, 7697–7711. [Google Scholar] [CrossRef] [PubMed]
- Brągoszewska, E. Bacterial Aerosol Occuring in the Atmospheric Air in Gliwice and Its Share of the Total Human Exposure to the Bacteria Absorbed by Inhalation. Ph.D. Thesis, Silesian University of Technology, Gliwice, Poland, 2014. [Google Scholar]
- Kubera, Ł.; Studzińska, J.; Dokładna, W.; Małecka-Adamowicz, M.; Donderski, W. Microbiological air quality in some kindergartens and antibiotic resistance of bactaria of the Staphylococcus spp. genus. Med. Pr. 2015, 66, 49–56. [Google Scholar] [PubMed]
- Pegas, P.N.; Evtyugina, M.G.; Alves, C.A.; Nunes, T.; Cerqueira, M.; Franchi, M.; Pio, C.; Almeida, S.M.; Freitas, M.C. Outdoor/indoor air quality in primary schools in Lisbon: A preeliminary study. Quim. Nova 2010, 33, 1145–1149. [Google Scholar] [CrossRef]
- Yang, W.; Sohn, J.; Kim, J.; Son, B.; Park, J. Indoor air quality investigation according to age of the school buildings in Korea. J. Environ. Manag. 2009, 90, 348–354. [Google Scholar] [CrossRef] [PubMed]
- Pastuszka, J.S.; Kyaw Tha Paw, U.; Lis, D.O.; Wlazło, A.; Ulfig, K. Bacterial and fungal aerosol in indoor environment in Upper Silesia, Poland. Atmos. Environ. 2000, 34, 3833–3842. [Google Scholar] [CrossRef]
- Pastuszka, J.S.; Wlazło, A.; Łudzeń-Izbińska, B.; Pastuszka, K. Bacterial and fungal aerosol in the school sport hall. Ochrona Powietrza i Problemy Odpadów 2004, 38, 62–66. (In Polish) [Google Scholar]
- Madureira, J.; Pereira, C.; Paciência, I.; Teixeira, J.P.; de Oliveira Fernandes, E. Identification and levels of airborne fungi in Portuguese primary schools. J. Toxicol. Environ. Health A 2014, 77, 816–826. [Google Scholar] [CrossRef] [PubMed]
- Zuraimi, M.S.; Fang, L.; Tan, T.K.; Chew, F.T.; Tham, K.W. Airborne fungi in low and high allergic prevalence child care centers. Atmos. Environ. 2009, 43, 2391–2400. [Google Scholar] [CrossRef]
- Górny, R.; Cyprowski, M.; Ławniczek-Wałczyk, A.; Gołofit-Szymczak, M.; Zapór, L. Biohazards in the indoor environment-a role for threshold limit values in exposure assessment. In Management of Indoor Air Quality; Dudzińska, M.R., Ed.; Taylor & Francis Group CRC Press: London, UK, 2011; pp. 1–20. [Google Scholar]
- Goyer, N.; Lavoie, J.; Lazure, L.; Marchand, G. Bioaerosols in the Workplace: Evaluations, Control and Prevention Guide; IRSST, Occupational Health and Safety Research Institute Robert Sauvé: Montréal, QC, Canada, 2001. [Google Scholar]
- Zhong, X.; Qi, J.; Li, H.; Dong, L.; Gao, D. Seasonal distribution of microbial activity in bioaerosols in the outdoor environment of the Qingdao coastal region. Atmos. Environ. 2016, 140, 506–513. [Google Scholar] [CrossRef]
- Wu, Y.H.; Chan, C.C.; Chew, G.L.; Shih, P.W.; Lee, C.T.; Chao, H.J. Meteorological factors and ambient bacterial levels in a subtropical urban environment. Int. J. Biometeorol. 2012, 56, 1001–1009. [Google Scholar] [CrossRef] [PubMed]
- ASHRAE. Standard 62-1999 Ventilation for Acceptable Indoor Air Quality; American Society of Heating, Refrigerating and Air-Conditioning Engineers, Inc.: Atlanta, GA, USA, 1999. [Google Scholar]
- Stryjakowska-Sekulska, M.; Piotraszewska-Pajak, A.; Szyszka, A.; Nowicki, M.; Filipiak, M. Microbiological quality of indoor air in university rooms. Pol. J. Environ. Stud. 2007, 16, 623–632. [Google Scholar]
- Wang, Y.F.; Wang, C.H.; Hsu, K.L. Size and seasonal distributions of airborne bioaerosols in commuting trains. Atmos. Environ. 2010, 44, 4331–4338. [Google Scholar] [CrossRef]
- Brągoszewska, E.; Świercz, M.; Pastuszka, J.S. Charakterystyka aerozolu bakteryjnego występującego w powietrzu pomieszczeń mieszkalnych oraz w powietrzu atmosferycznym wybranej dzielnicy Katowic. In Inżynieria i Ochrona Powietrza; Kuropka, J., Musialik-Piotrowska, A., Eds.; Oficyna Wydawnicza Politechniki Wrocławskiej: Wrocław, Poland, 2014; pp. 89–97. [Google Scholar]
- Brągoszewska, E.; Kowal, A.; Pastuszka, J.S. Bacterial aerosol occurring in atmospheric air in Gliwice, Upper Silesia, Poland. Archit. Civ. Eng. Environ. 2013, 4, 61–66. [Google Scholar]
- Kim, N.Y.; Kim, Y.R.; Kim, M.K.; Cho, D.W.; Kim, J. Isolation and characterization of airborne bacteria and fungi in indoor environment of elementary schools. Korean J. Microbiol. 2007, 43, 193–200. [Google Scholar]
- Daisey, J.M.; Angell, W.J.; Apte, M.G. Indoor air quality, ventilation and health symptoms in schools: An analysis of existing information. Indoor Air 2003, 13, 53–64. [Google Scholar] [CrossRef] [PubMed]
- Henningson, E.W.; Lundquist, M.; Larsson, E.; Sandström, G.; Forsman, M. A comparative study of different methods to determine the total number and the survival ratio of bacteria in aerobiological samples. J. Aerosol Sci. 1997, 28, 459–469. [Google Scholar] [CrossRef]
- Douwes, J.; Thorne, P.; Pearce, N.; Heederik, D. Bioaerosol Health effects and exposure assessment: progress and prospects. Ann. Occup. Hyg. 2003, 47, 187–200. [Google Scholar] [CrossRef] [PubMed]
- Alekseev, V.V.; Tikhonov, N.G.; Savchenko, S.T.; Kurilov, V.Y.; Vjazmina, T.N.; Yakovlev, A.T.; Denisov, I.I.; Popov, S.F. Experimental bacterial aerosols: Some physical and biological (pathogenic) properties. J. Aerosol Sci. 1994, 25, 1413–1423. [Google Scholar] [CrossRef]
- US Environmental Protection Agency. Child-Specific Exposure Factors Handbook; Environmental Protection Agency: Washington, DC, USA, 2002.
- Johnson-Restrepo, B.; Kannan, K. An assessment of sources and pathways of human exposure to polybrominated diphenyl ethers in the United States. Chemosphere 2009, 76, 542–548. [Google Scholar] [CrossRef] [PubMed]
- Ott, W. Exposure Analysis; Taylor & Francis Group CRC Press: London, UK, 2006. [Google Scholar]
- US Environmental Protection Agency. Risk Assessment: “Supplemental Guidance for Dermal Risk Assessment”, Part E of Risk Assessment Guidance for Superfund, Human Health Evaluation Manual; US Environmental Protection Agency: Washington, DC, USA, 2004.
- US Environmental Protection Agency. Exposure Factors Handbook; US Environmental Protection Agency: Washington, DC, USA, 2011.


| Parameters | Nursery School | |||
| Nursery School | P | S | ||
| Classroom of children | Older (O) | Younger (Y) | Older (O) | Younger (Y) |
| Children’s age, years | 5–6 | 3–4 | 5–6 | 3–4 |
| Floor | Ground floor | 1st floor | Ground floor | Ground floor |
| Volume, m3 | 209.2 | 203.7 | 169.7 | 118.6 |
| Period of occupation | 6:30–16:00 | 8:00–12:30 | 6:30–16:00 | 8:00–12:30 |
| Number of children in group | 25 | 25 | 24 | 21 |
| Median occupancy of children—winter | 21 | 19 | 16 | 14 |
| Median occupancy of children—spring | 20 | 18 | 18 | 14 |
| Indoor temperature, °C—winter | 23.2 ± 1.4 | 24.5 ± 1.2 | 27.8 ± 3.6 | 26.2 ± 2.7 |
| Indoor temperature, °C—spring | 27.3 ± 1.5 | 23.8 ± 1.2 | 23.6 ± 2.7 | 24.2 ± 1.9 |
| Indoor relative humidity (RH), %—winter | 31.5 ± 5.7 | 25.8 ± 5.1 | 24.5 ± 6.7 | 26.0 ± 6.6 |
| Indoor relative humidity (RH), %—spring | 38.0 ± 7.6 | 27.2 ± 6.1 | 46.5 ± 5.6 | 42.5 ± 4.8 |
| Indoor CO2 concentration, ppm—winter | 1102.9 ± 415.9 | 872.0 ± 476.6 | 1122.7 ± 571.0 | 1265.4 ± 652.6 |
| Indoor CO2 concentration, ppm—spring | 775.6 ± 286.2 | 729.2 ± 388.8 | 1374.5 ± 825.5 | 1090.8 ± 630.8 |
| Outdoor Parameters, Mean ± SD | ||||
| Season | Winter | Spring | Winter | Spring |
| Temperature, °C | 7.6 ± 4.7 | 21.1 ± 5.5 | 13.4 ± 9.2 | 24.4 ± 11.6 |
| Relative humidity (RH), % | 62.9 ± 23.4 | 43.3 ± 21.2 | 47.0 ± 28.8 | 54.3 ± 34.0 |
| CO2 concentration, ppm | 372.0 ± 15.4 | 354.3 ± 21.9 | 374.0 ± 17.1 | 353.5 ± 16.2 |
| Season | Aerosol | Location | P | S | ||||
|---|---|---|---|---|---|---|---|---|
| Average Concentration | SD | I/O Ratio | Average Concentration | SD | I/O Ratio | |||
| Winter | Bacterial aerosol (CFU·m−3) | OUT | 258 | 63.7 | - | 751 | 223.4 | - |
| (Y) | 1031 | 135.6 | 3.99 | 1596 | 288.8 | 2.12 | ||
| (O) | 670 | 25.4 | 2.59 | 1990 | 301.9 | 2.65 | ||
| Fungal aerosol (CFU·m−3) | OUT | 82 | 23.9 | - | 156 | 28.6 | - | |
| (Y) | 94 | 25.7 | 1.14 | 241 | 21.5 | 1.55 | ||
| (O) | 98 | 11.4 | 1.19 | 172 | 34.7 | 1.10 | ||
| Spring | Bacterial aerosol (CFU·m−3) | OUT | 564 | 166.2 | - | 1428 | 138.7 | - |
| (Y) | 1996 | 63.4 | 3.54 | 2223 | 291 | 1.56 | ||
| (O) | 1744 | 221.3 | 3.09 | 2588 | 85.8 | 1.81 | ||
| Fungal aerosol (CFU·m−3) | OUT | 707 | 70.4 | - | 1549 | 222.4 | - | |
| (Y) | 461 | 43.7 | 0.65 | 707 | 119.5 | 0.46 | ||
| (O) | 497 | 218.5 | 0.71 | 670 | 93.7 | 0.43 | ||
| Activity of the Occupants of the Nursery School | Children | Nursery School | ||||
|---|---|---|---|---|---|---|
| Older (O) | Younger (Y) | Staff | ||||
| IR, m3/h | IEF, h | IR, m3/h | IEF, h | IR, m3/h | IE, h | |
| Sleep or Nap | 0.26 | - | 0.26 | 2 | 0.30 | - |
| Sedimentary Passive | 0.27 | 2 | 0.27 | - | 0.29 | 3 |
| Light Intensity | 0.66 | 3 | 0.66 | 3 | 0.78 | 3.5 |
| Moderate Intensity | 1.26 | 2 | 1.26 | 2 | 1.68 | 1.5 |
| High Intensity | 2.22 | - | 2.22 | - | 3.12 | - |
| NSED—Nursery School Exposure Dose Of Bacterial Aerosol (CFU·kg−1) | ||||||||
| Season | P | S | ||||||
| Children | Staff | Children | Staff | |||||
| (O) | (Y) | (O) | (Y) | (O) | (Y) | (O) | (Y) | |
| Winter | 143.6 | 327.4 | 69.4 | 106.9 | 426.9 | 506.7 | 206.3 | 165.4 |
| Spring | 374.0 | 633.8 | 180.7 | 206.9 | 555.0 | 705.7 | 268.2 | 230.4 |
| NSED—Nursery School Exposure Dose of Fungal Aerosol (CFU·kg−1) | ||||||||
| Winter | 20.2 | 31.1 | 9.8 | 10.2 | 36.9 | 76.4 | 17.8 | 24.9 |
| Spring | 106.6 | 146.2 | 51.5 | 47.7 | 143.8 | 224.6 | 69.5 | 73.3 |
© 2016 by the authors; licensee MDPI, Basel, Switzerland. This article is an open access article distributed under the terms and conditions of the Creative Commons Attribution (CC-BY) license (http://creativecommons.org/licenses/by/4.0/).
Share and Cite
Brągoszewska, E.; Mainka, A.; Pastuszka, J.S. Bacterial and Fungal Aerosols in Rural Nursery Schools in Southern Poland. Atmosphere 2016, 7, 142. https://doi.org/10.3390/atmos7110142
Brągoszewska E, Mainka A, Pastuszka JS. Bacterial and Fungal Aerosols in Rural Nursery Schools in Southern Poland. Atmosphere. 2016; 7(11):142. https://doi.org/10.3390/atmos7110142
Chicago/Turabian StyleBrągoszewska, Ewa, Anna Mainka, and Jozef S. Pastuszka. 2016. "Bacterial and Fungal Aerosols in Rural Nursery Schools in Southern Poland" Atmosphere 7, no. 11: 142. https://doi.org/10.3390/atmos7110142