
The Role of Highly-Resolved Gust Speed in Simulations of Storm Damage in Forests at the Landscape Scale: A Case Study from Southwest Germany


Abstract
:
1. Introduction
2. Material and Methods
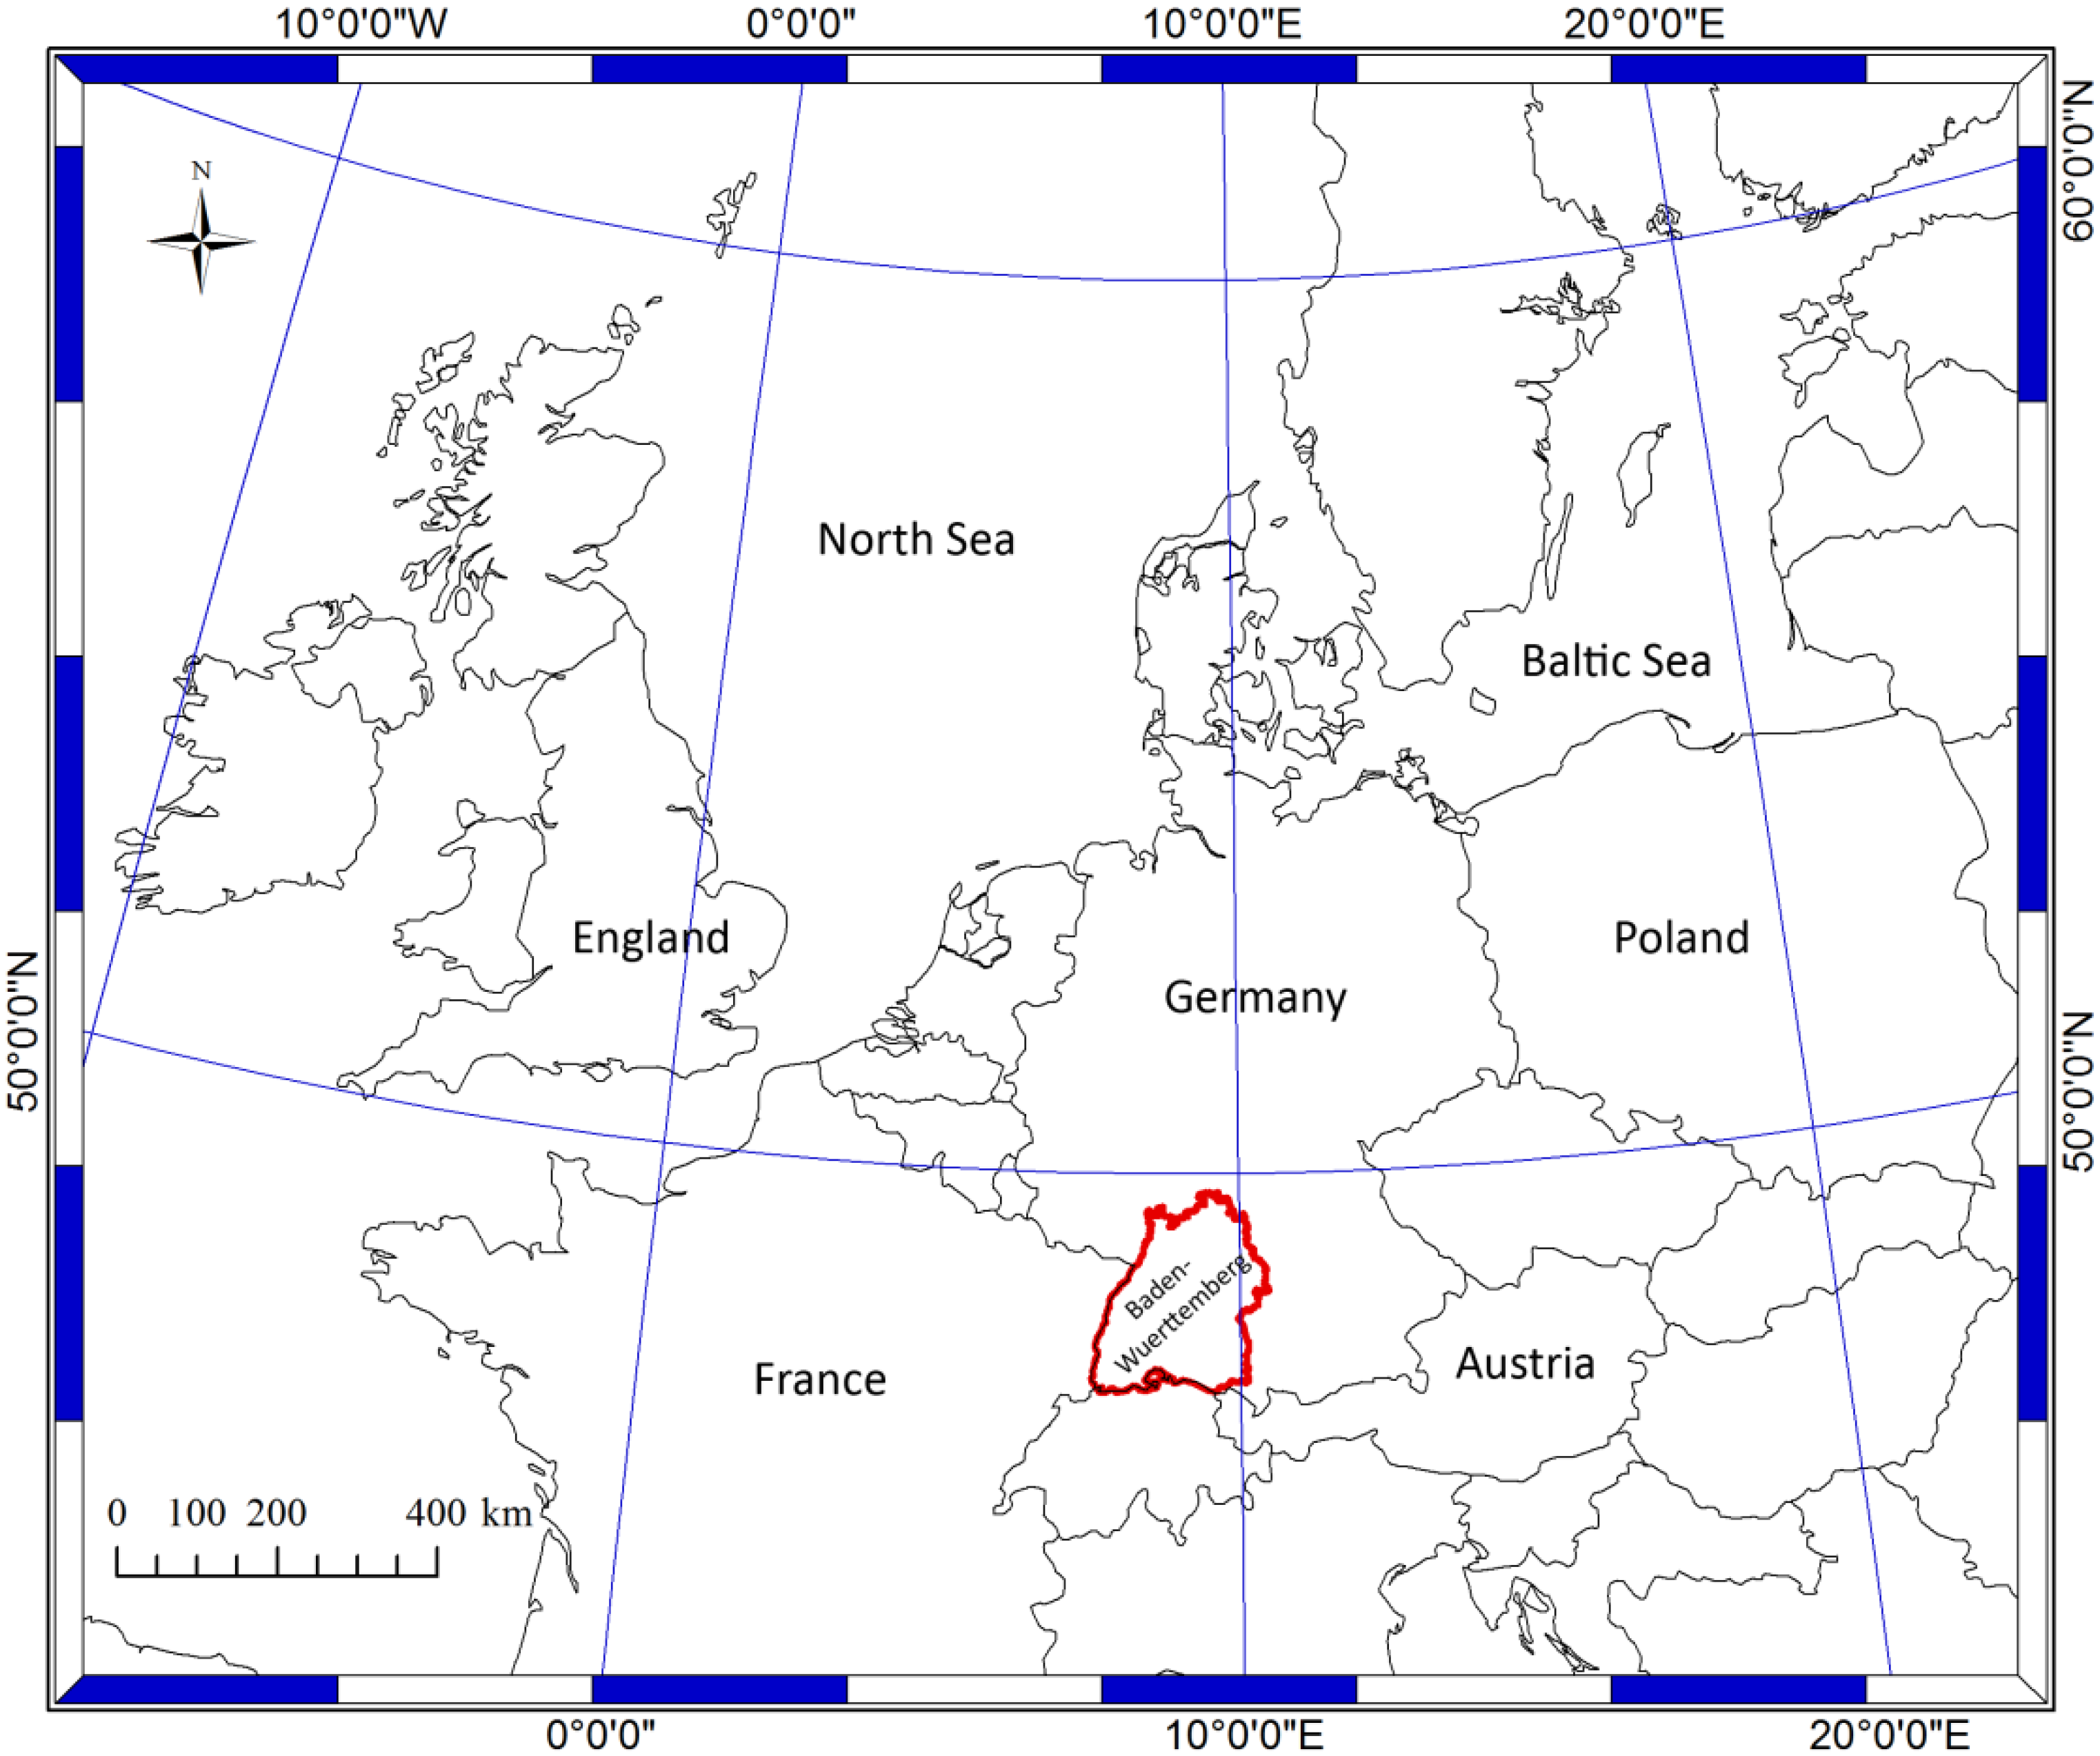
2.1. Study Area
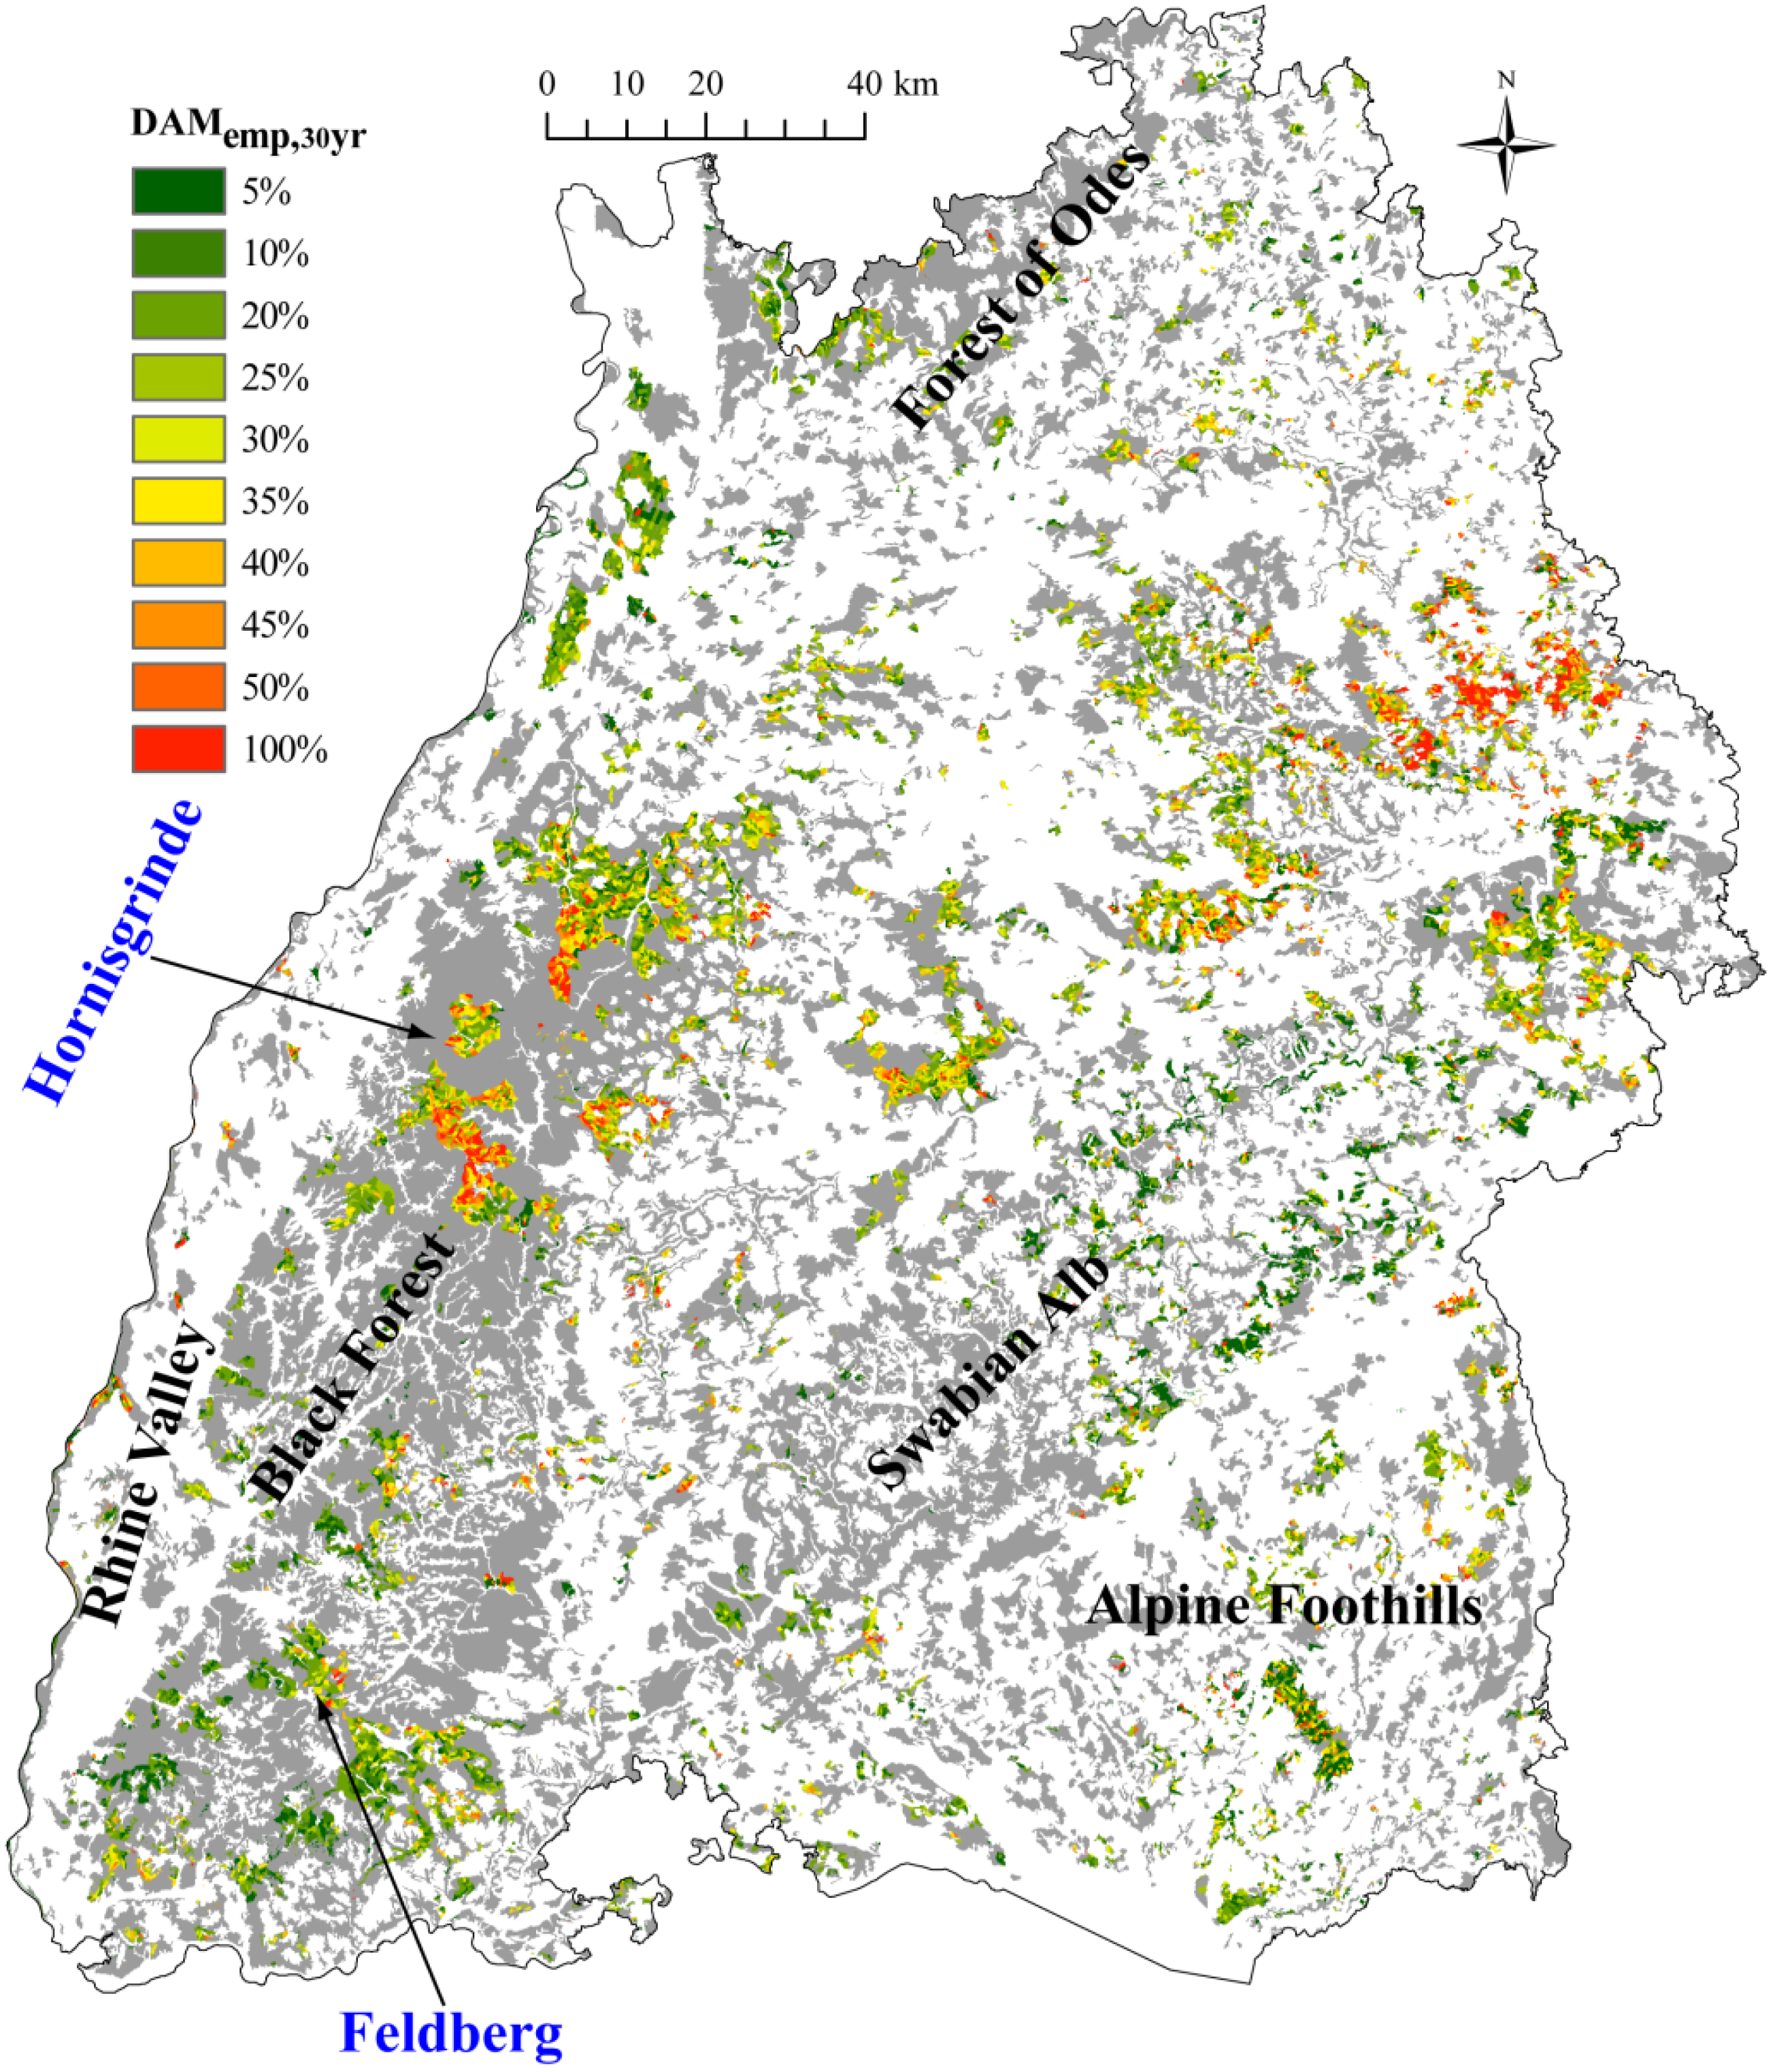
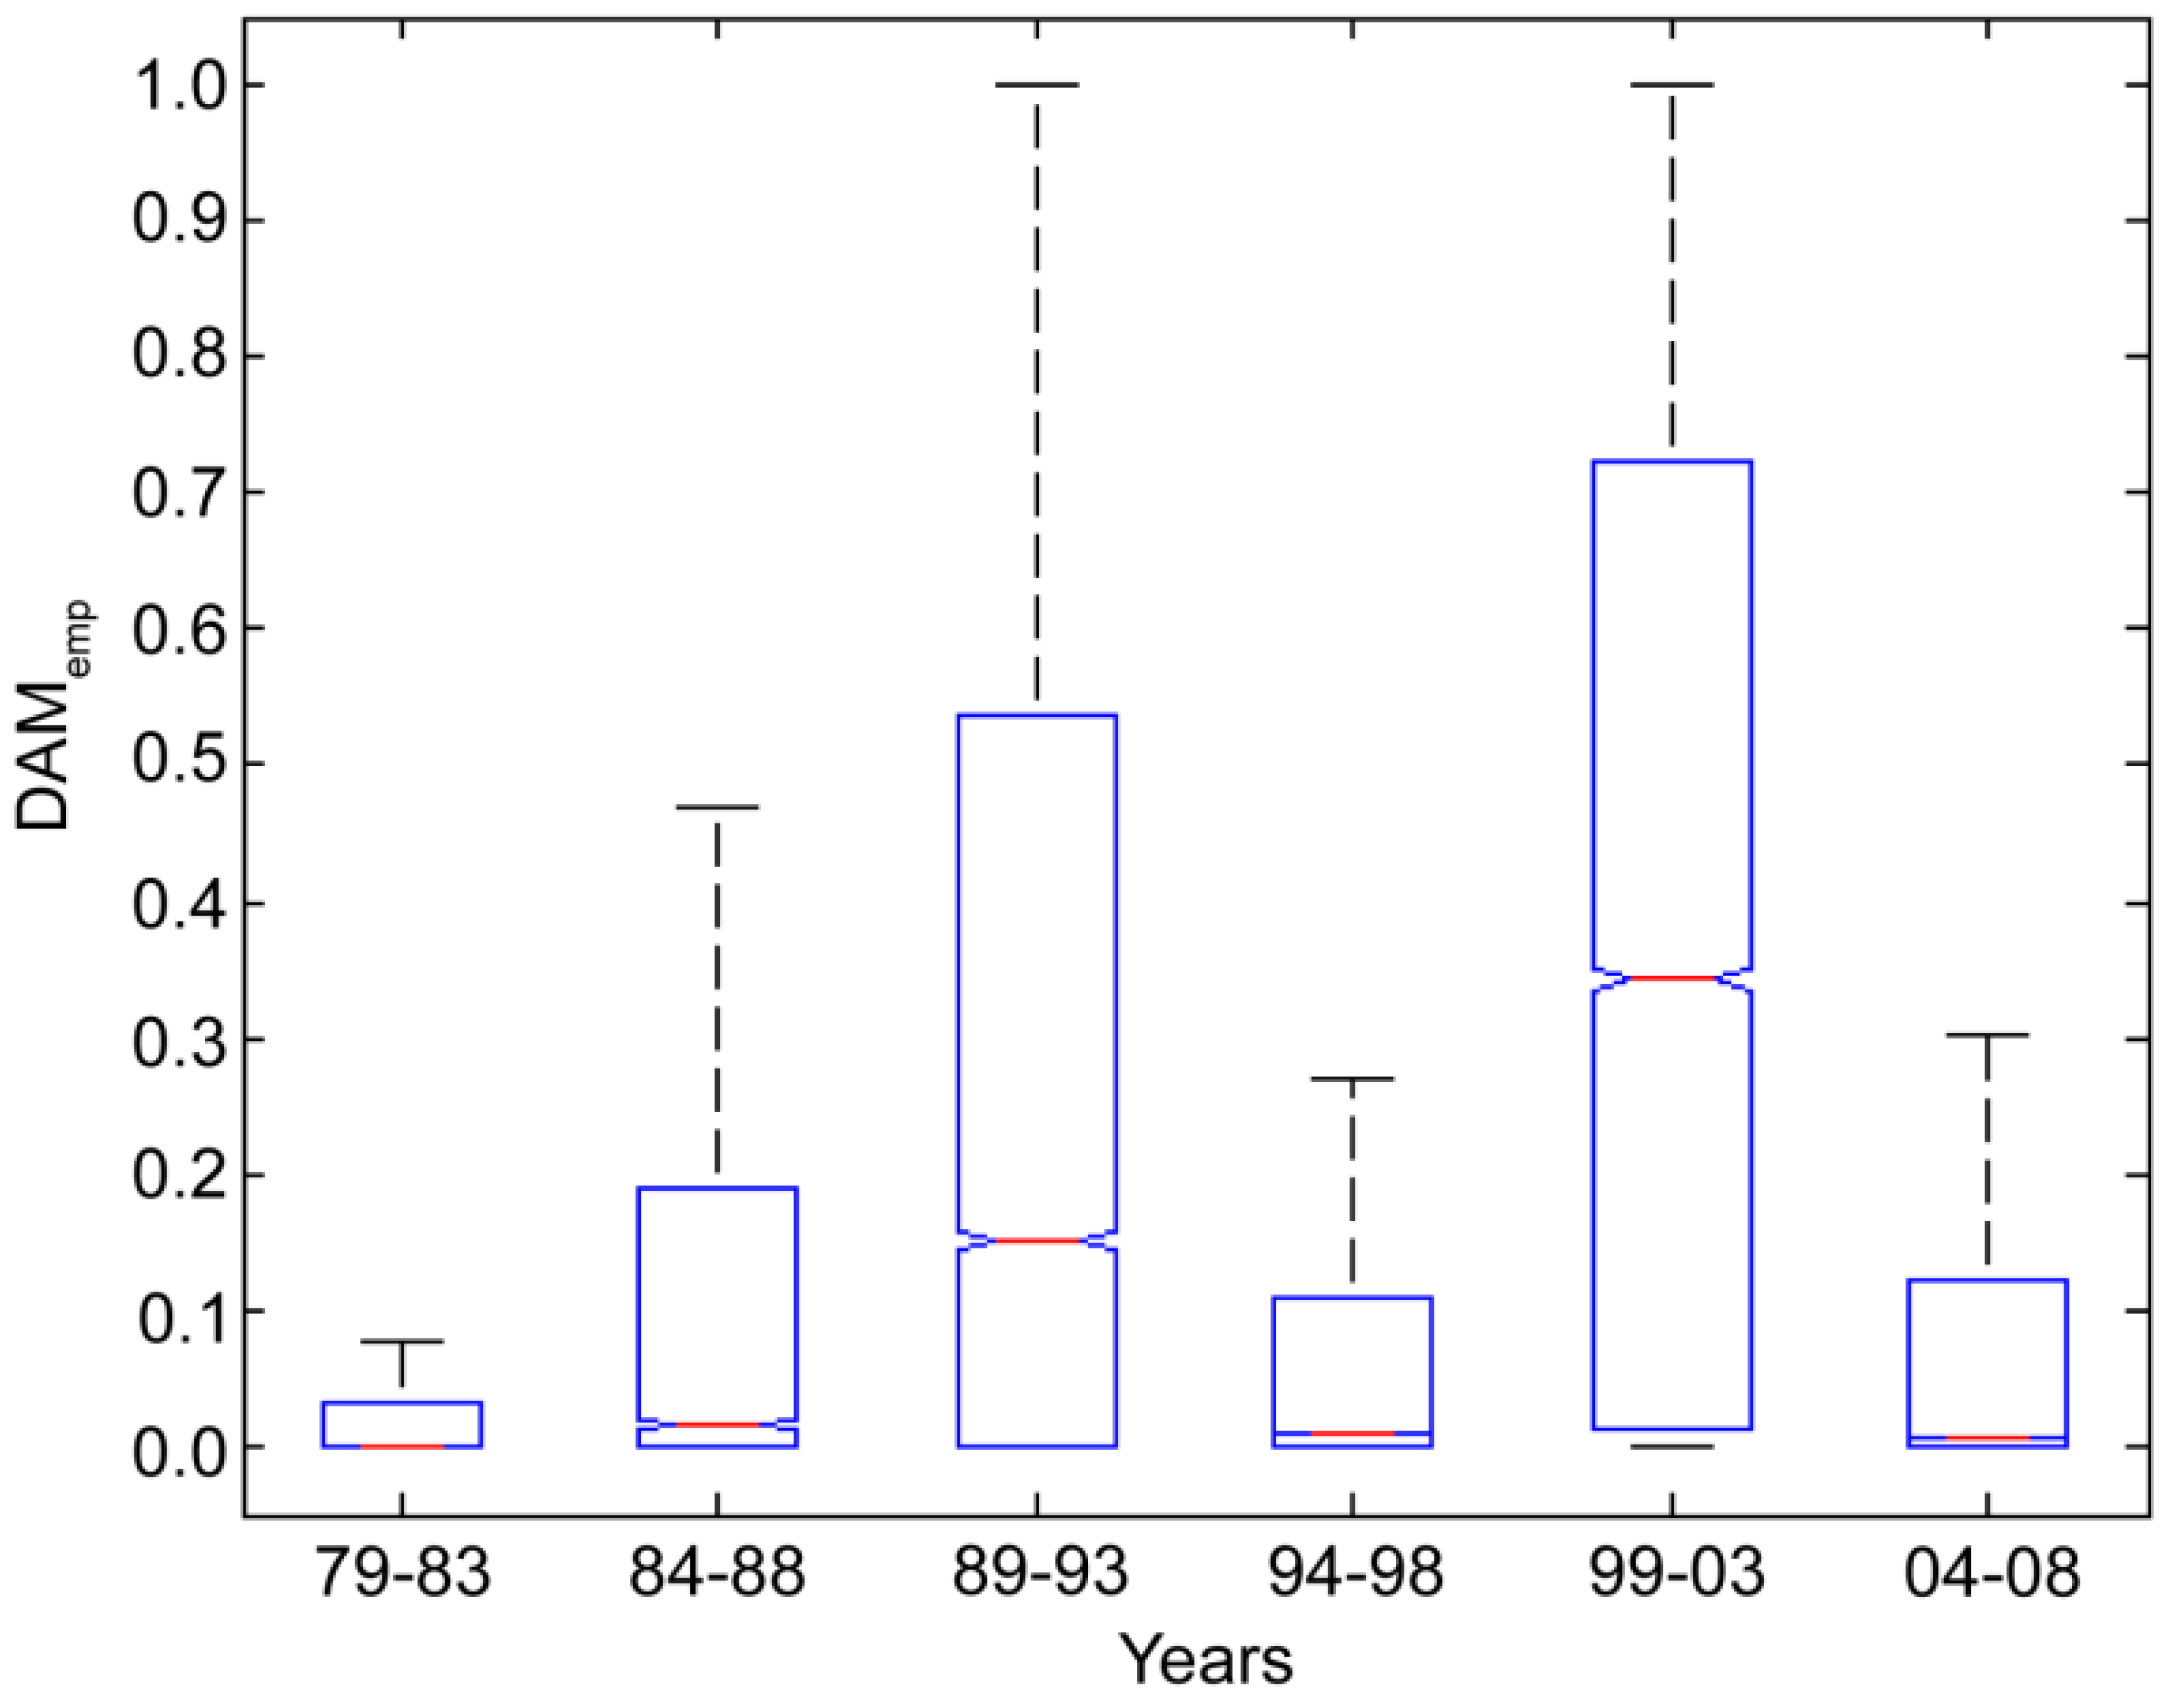
2.2. Forest Damage Data
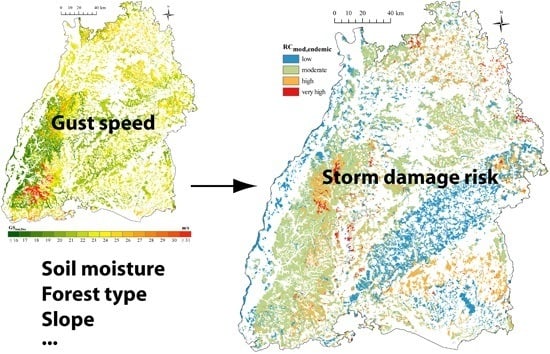
2.3. Predictor Variables

| Predictor | Acronym | Scale | Classes | Data Source |
|---|---|---|---|---|
| Forest type | FOR | Categorical | 3 | LUBW1 |
| Soil type | SOIL | Categorical | 20 | WSA2 |
| Soil depth | DEPTH | Categorical | 5 | WSA2 |
| Soil substrate | SUB | Categorical | 17 | WSA2 |
| Soil acidification | ACID | Categorical | 13 | WSA2 |
| Soil moisture regime | MOIST | Categorical | 21 | WSA2 |
| Groundwater affected soils | GRD | Categorical | 4 | WSA2 |
| Geology | GEOL | Categorical | 14 | WSA2 |
| Slope | SL | Ordinal | 7 | LUBW1 |
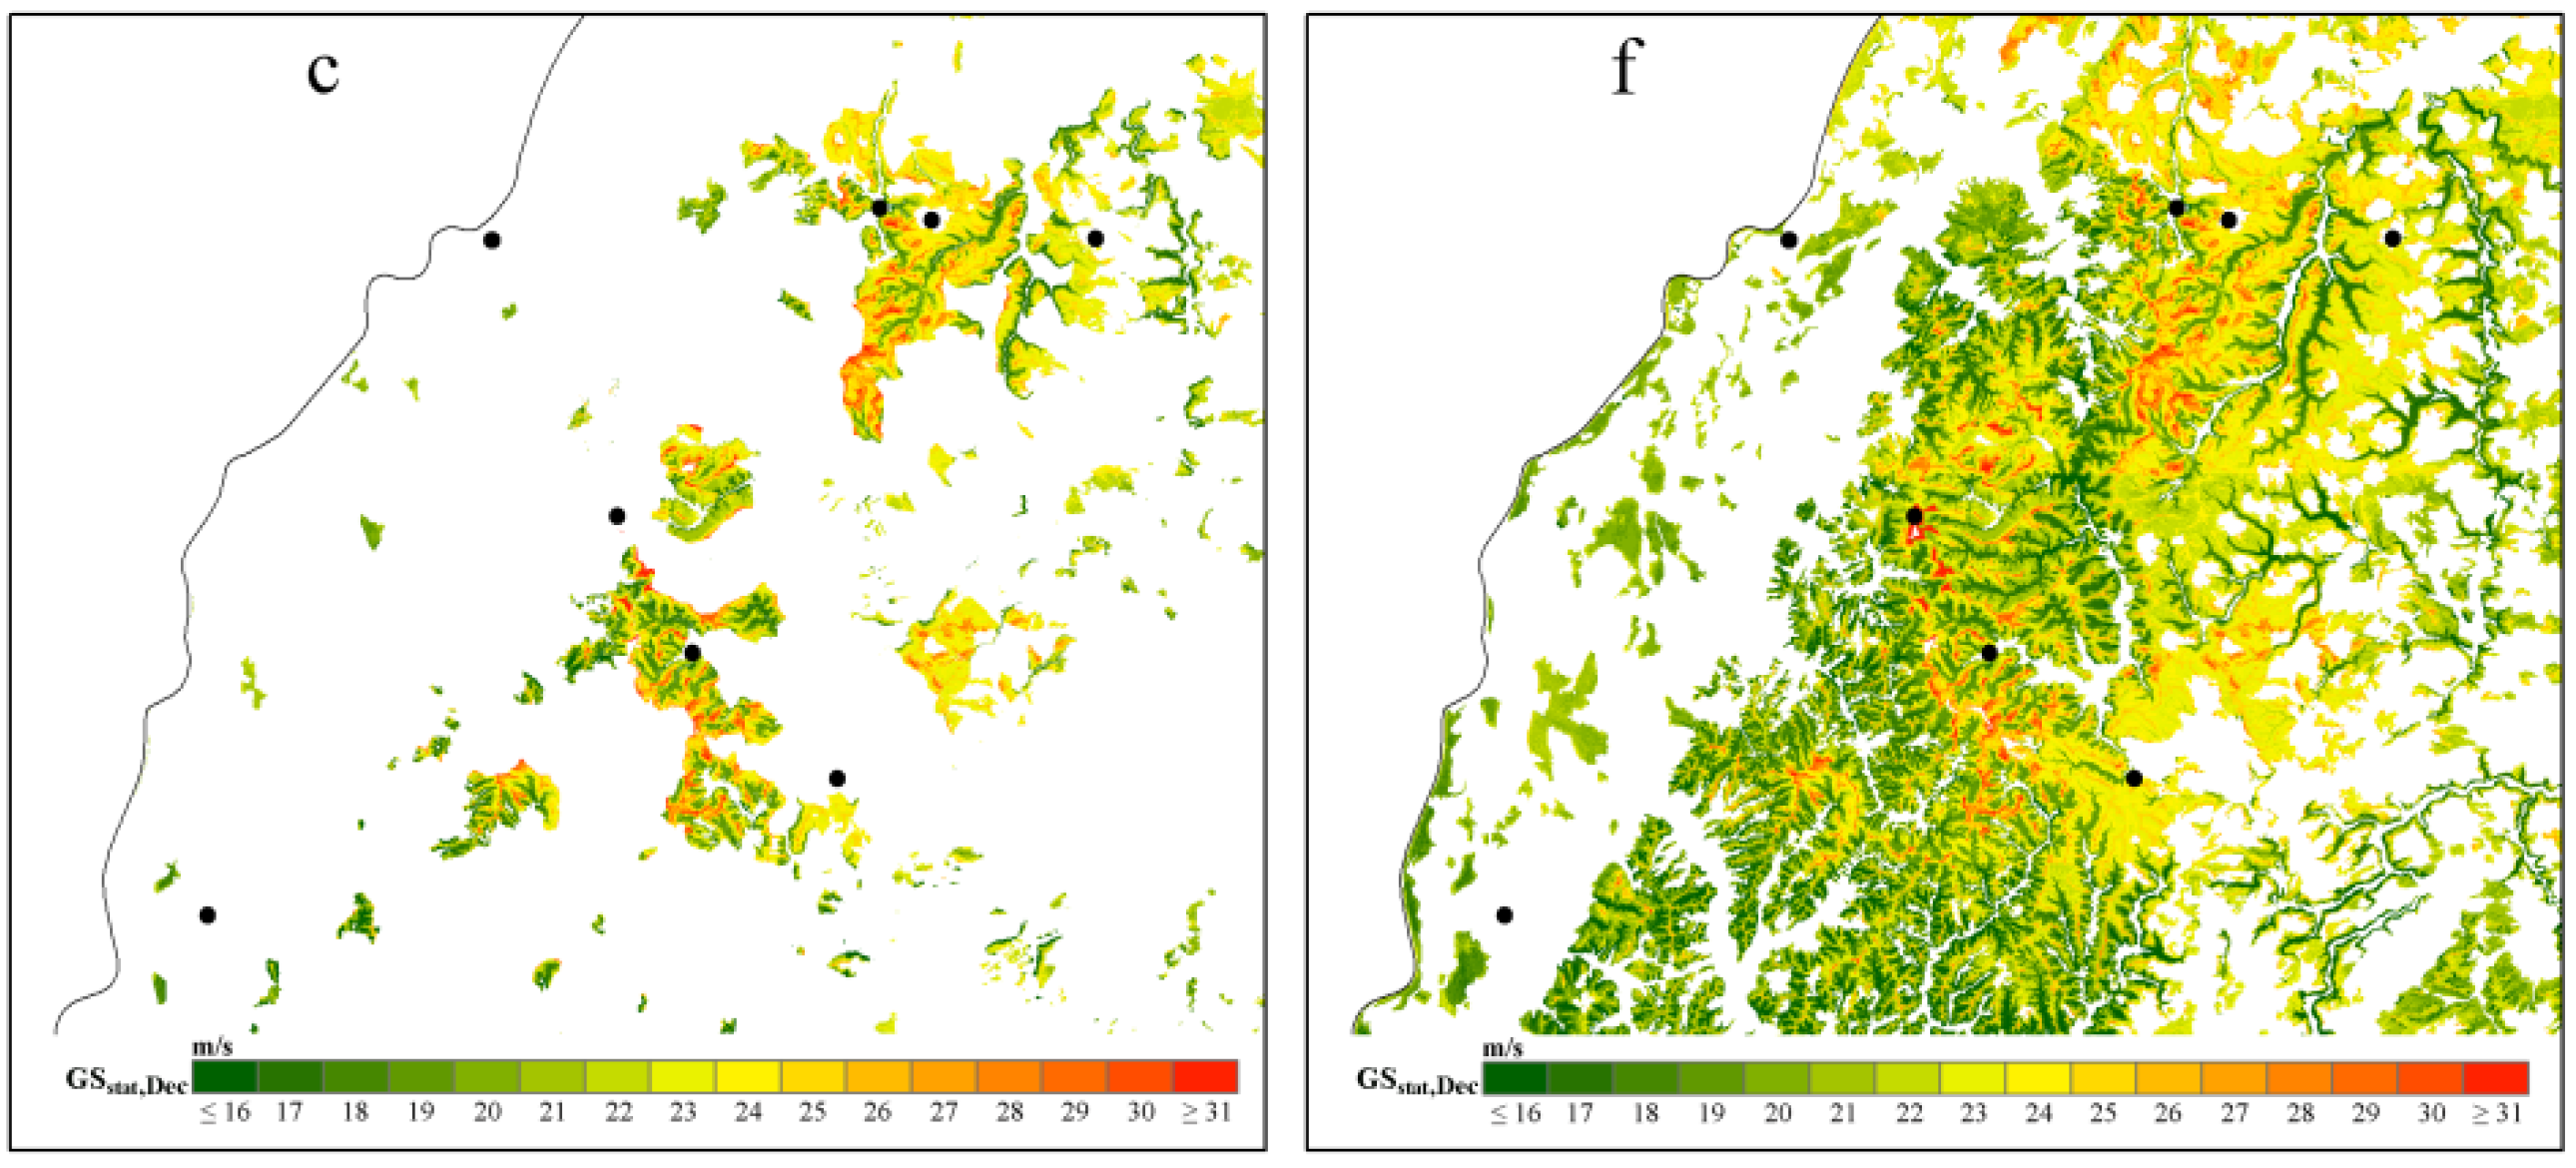
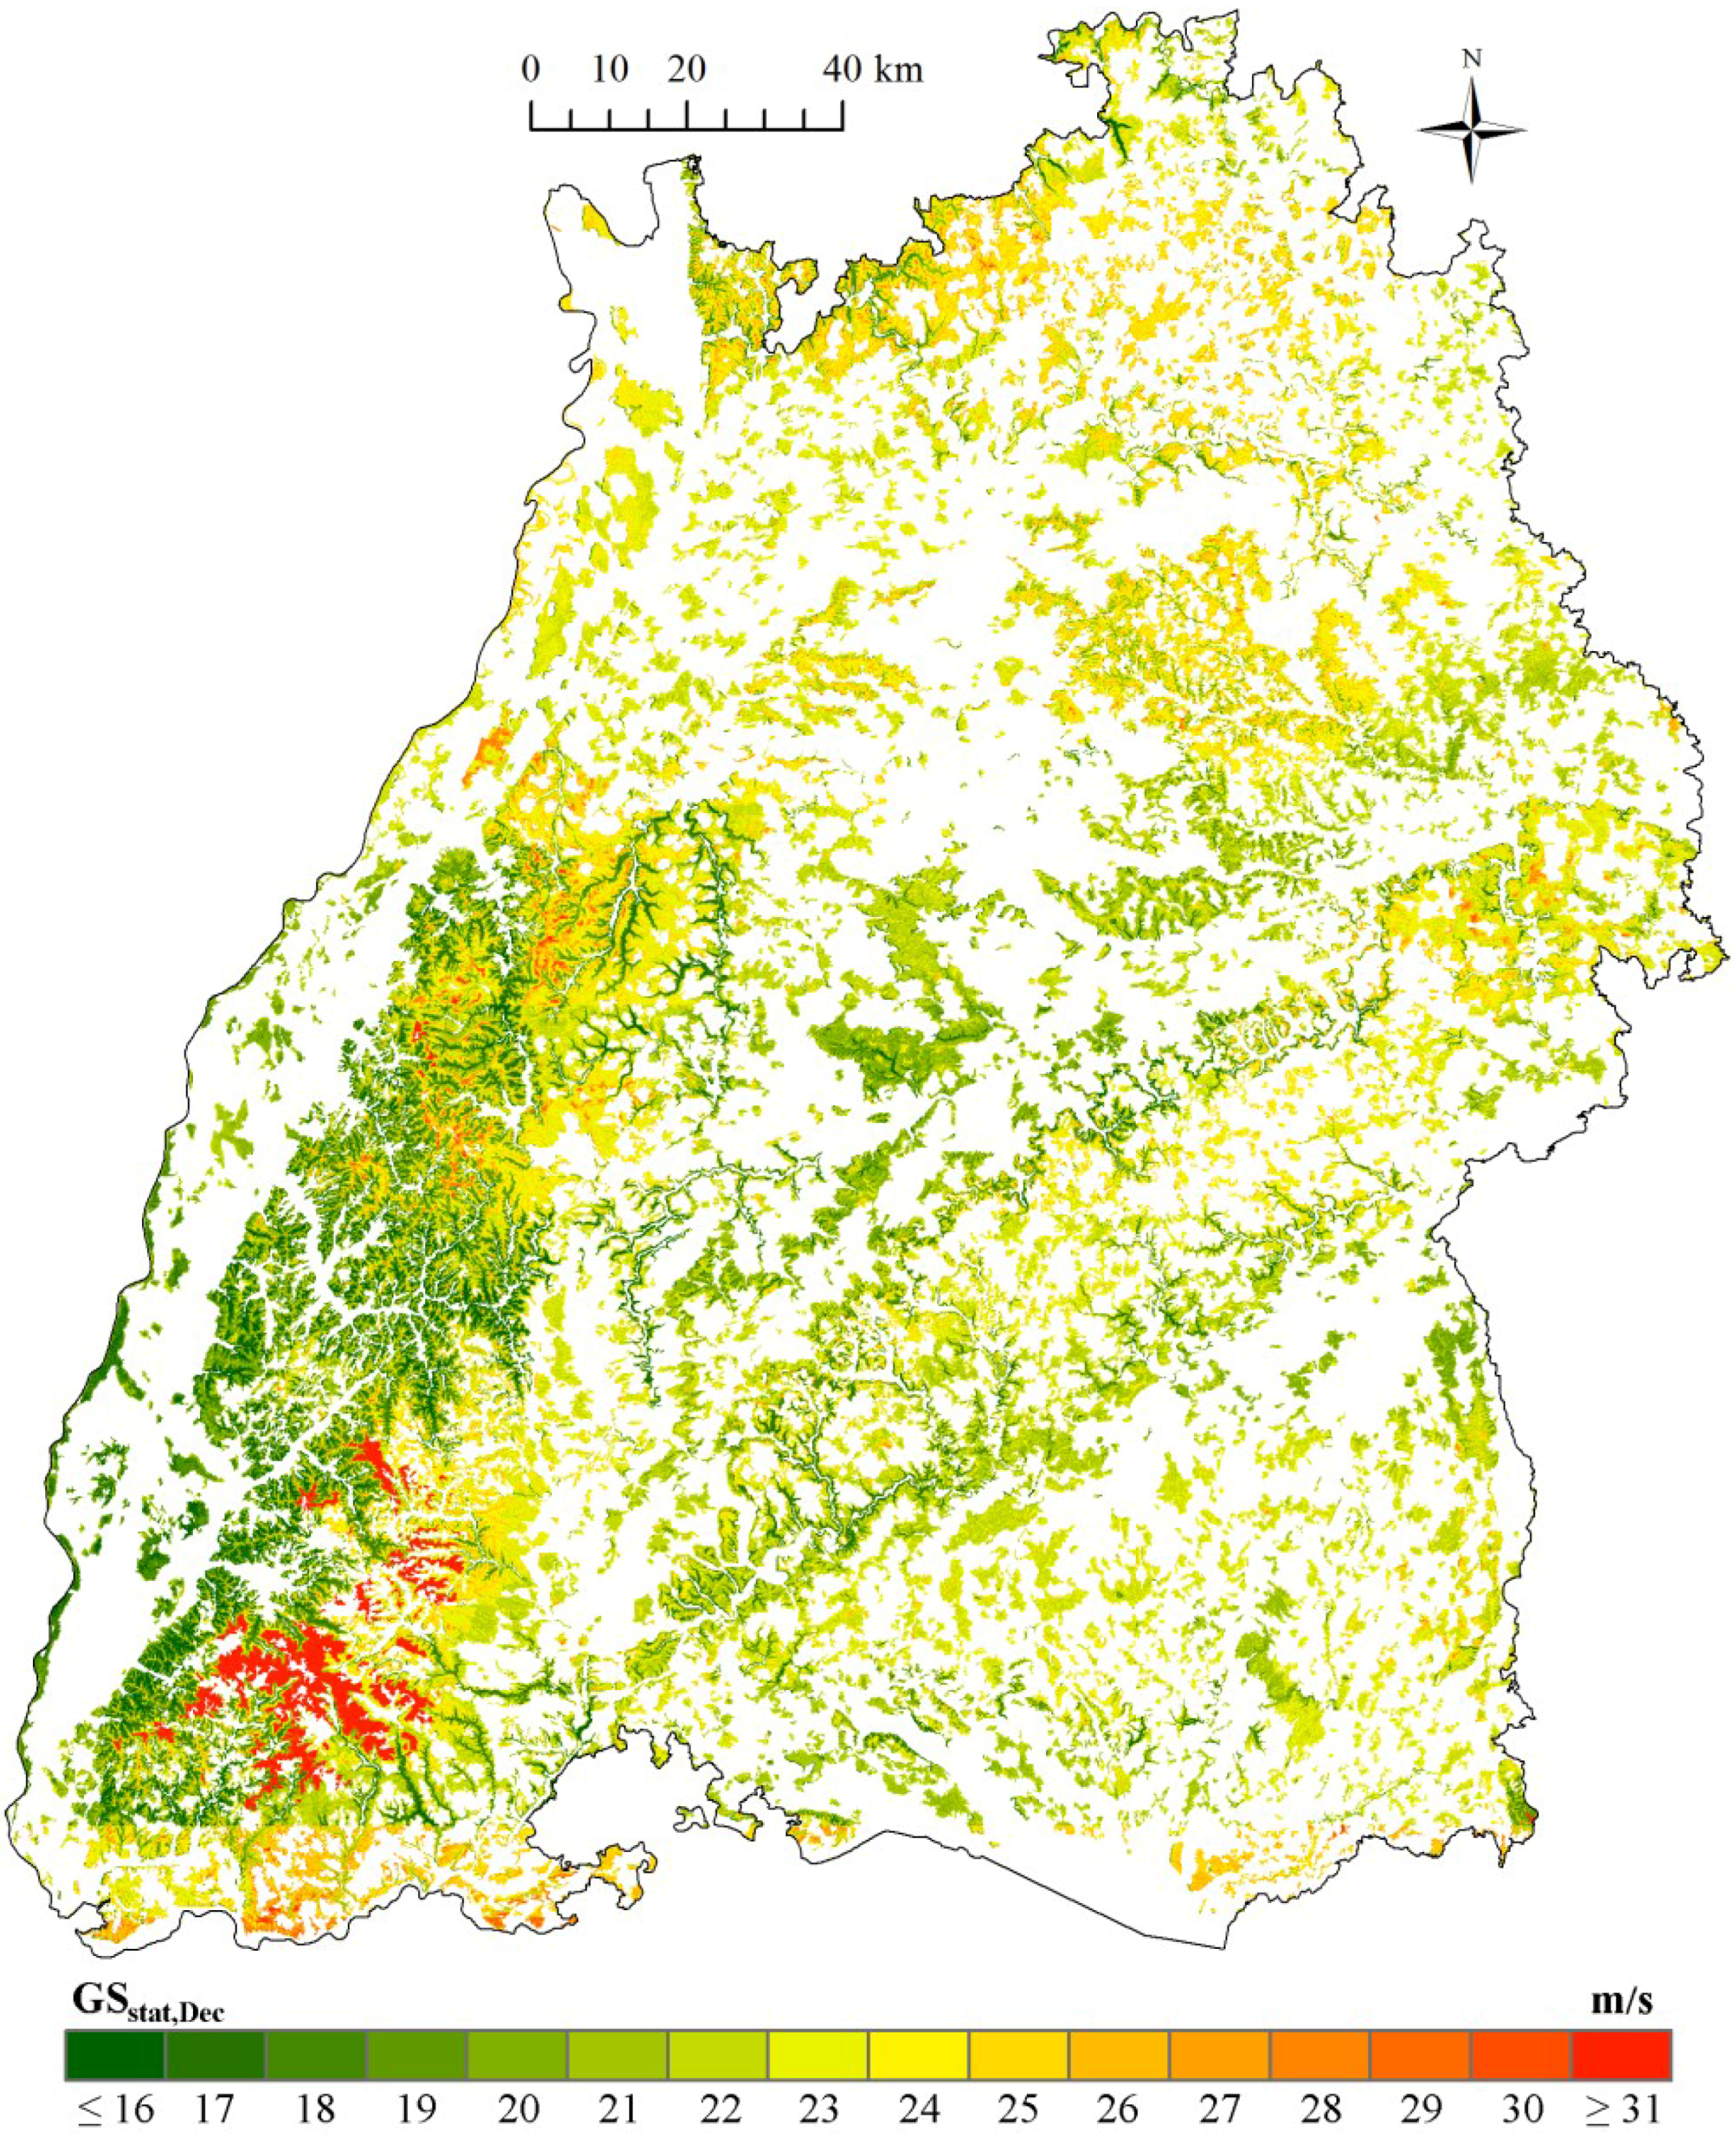
| Gust speed of December | GSstat,Dec | Continuous | - | [27] |
| Gust speed of January | GSstat,Jan | Continuous | - | [27] |
| Gust speed of 1 March 1990 | GSWiebke | Continuous | - | According to [27] |
| Gust speed of 26 December 1999 | GSLothar | Continuous | - | According to [27] |
2.4. Model Building
| Periods | Gust Speed Field | ||||||||||
|---|---|---|---|---|---|---|---|---|---|---|---|
| RF-Model Output | 1 | 2 | 3 | 4 | 5 | 6 | 30 Year | Wiebke | Lothar | Stat,December | Stat,January |
| DAMmod,30yr | ● | ● | |||||||||
| DAMmod,1 | ● | ● | |||||||||
| DAMmod,2 | ● | ● | |||||||||
| DAMmod,3 | ● | ● | |||||||||
| DAMmod,4 | ● | ● | |||||||||
| DAMmod,5 | ● | ● | |||||||||
| DAMmod,6 | ● | ● | |||||||||
| DAMmod,endemic | ● | ● | ● | ● | ● | ||||||
| DAMmod,30yr* | ● | ● | ● | ● | |||||||
| DAMmod,3* | ● | ● | ● | ||||||||
| DAMmod,5* | ● | ● | ● | ||||||||
2.5. Predictor Importance
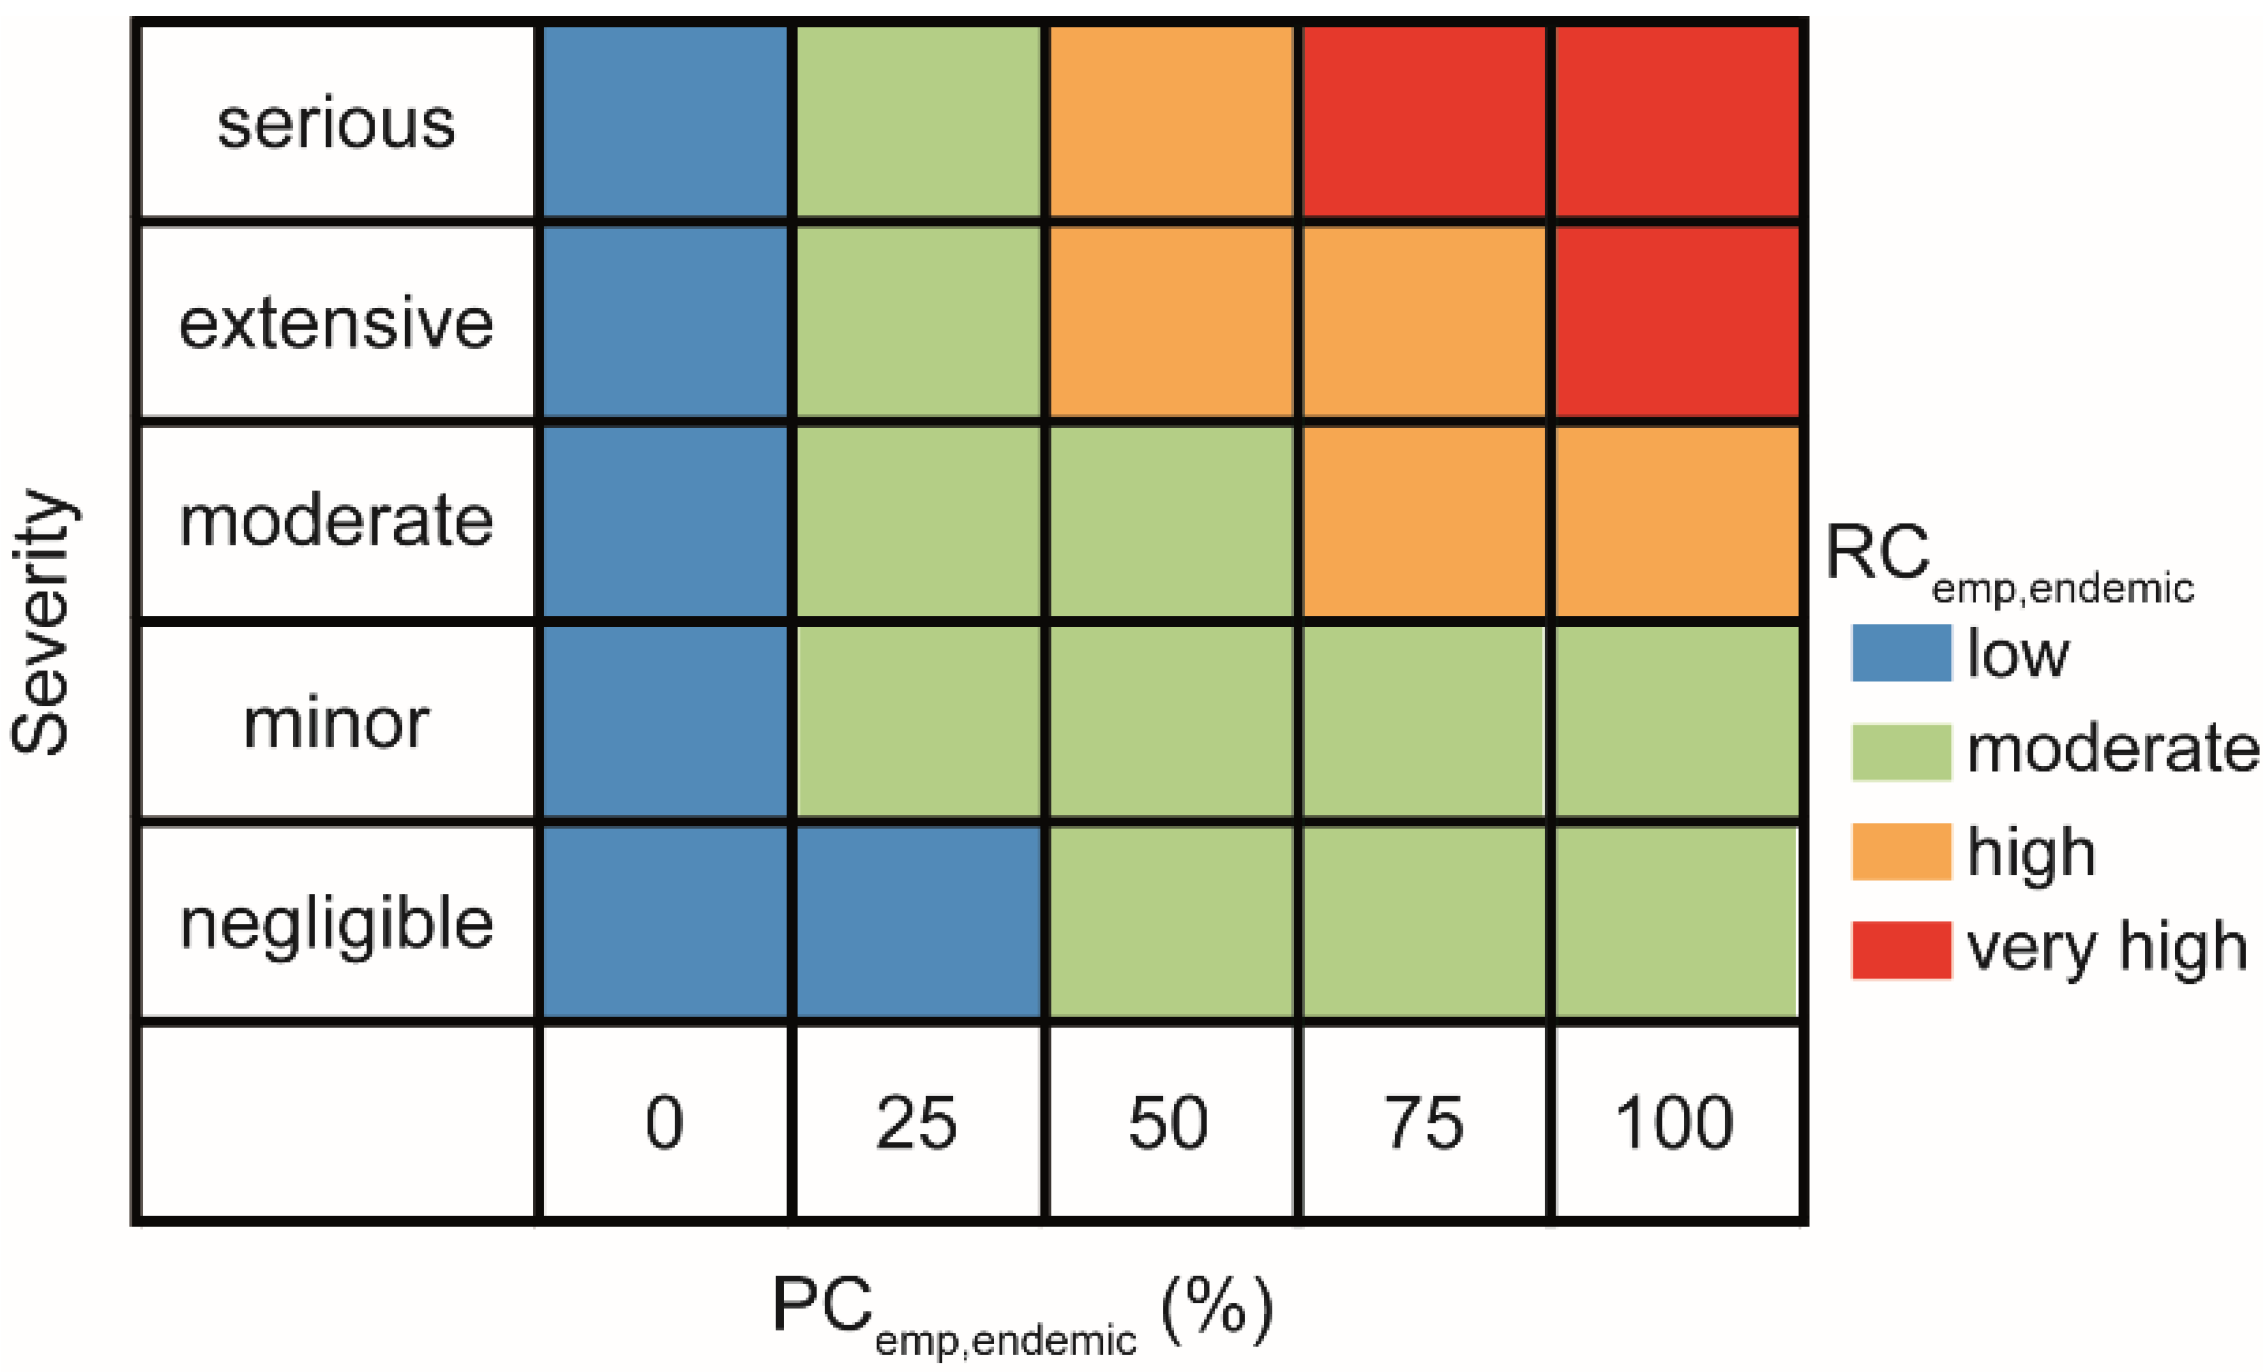
2.6. Risk Modeling
3. Results and Discussion
3.1. Predictor Importance
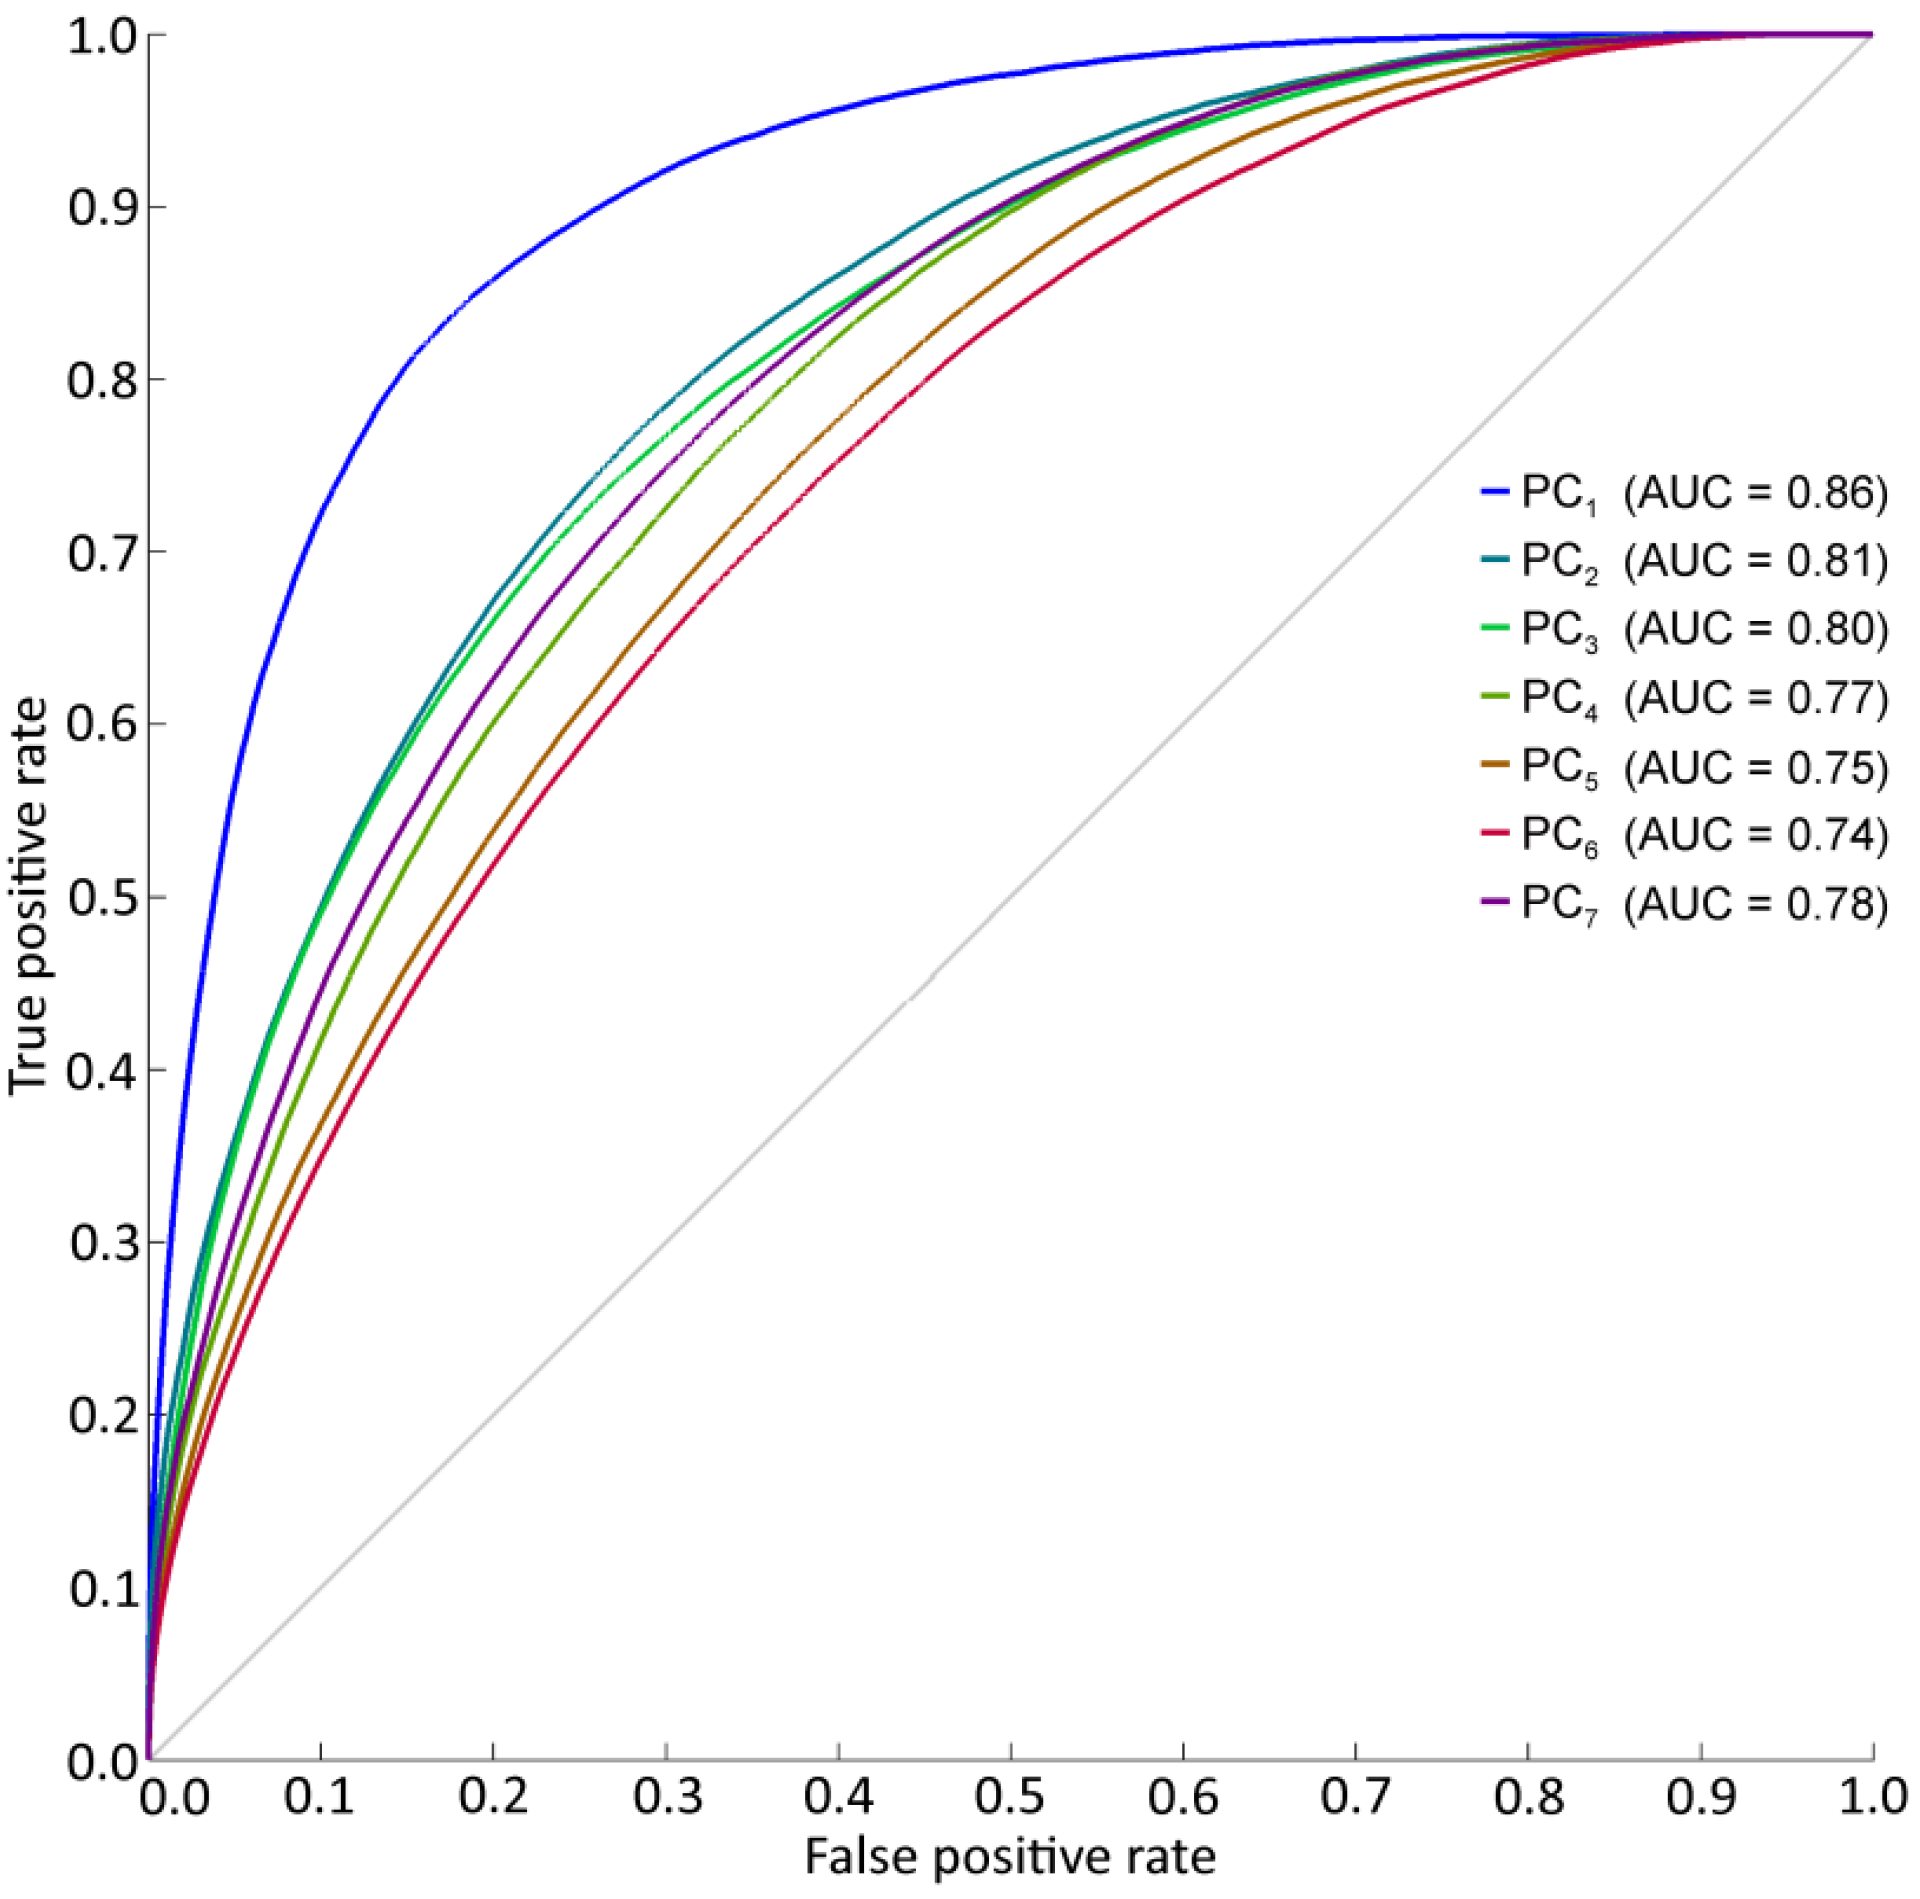
3.1.1. Damage Probability
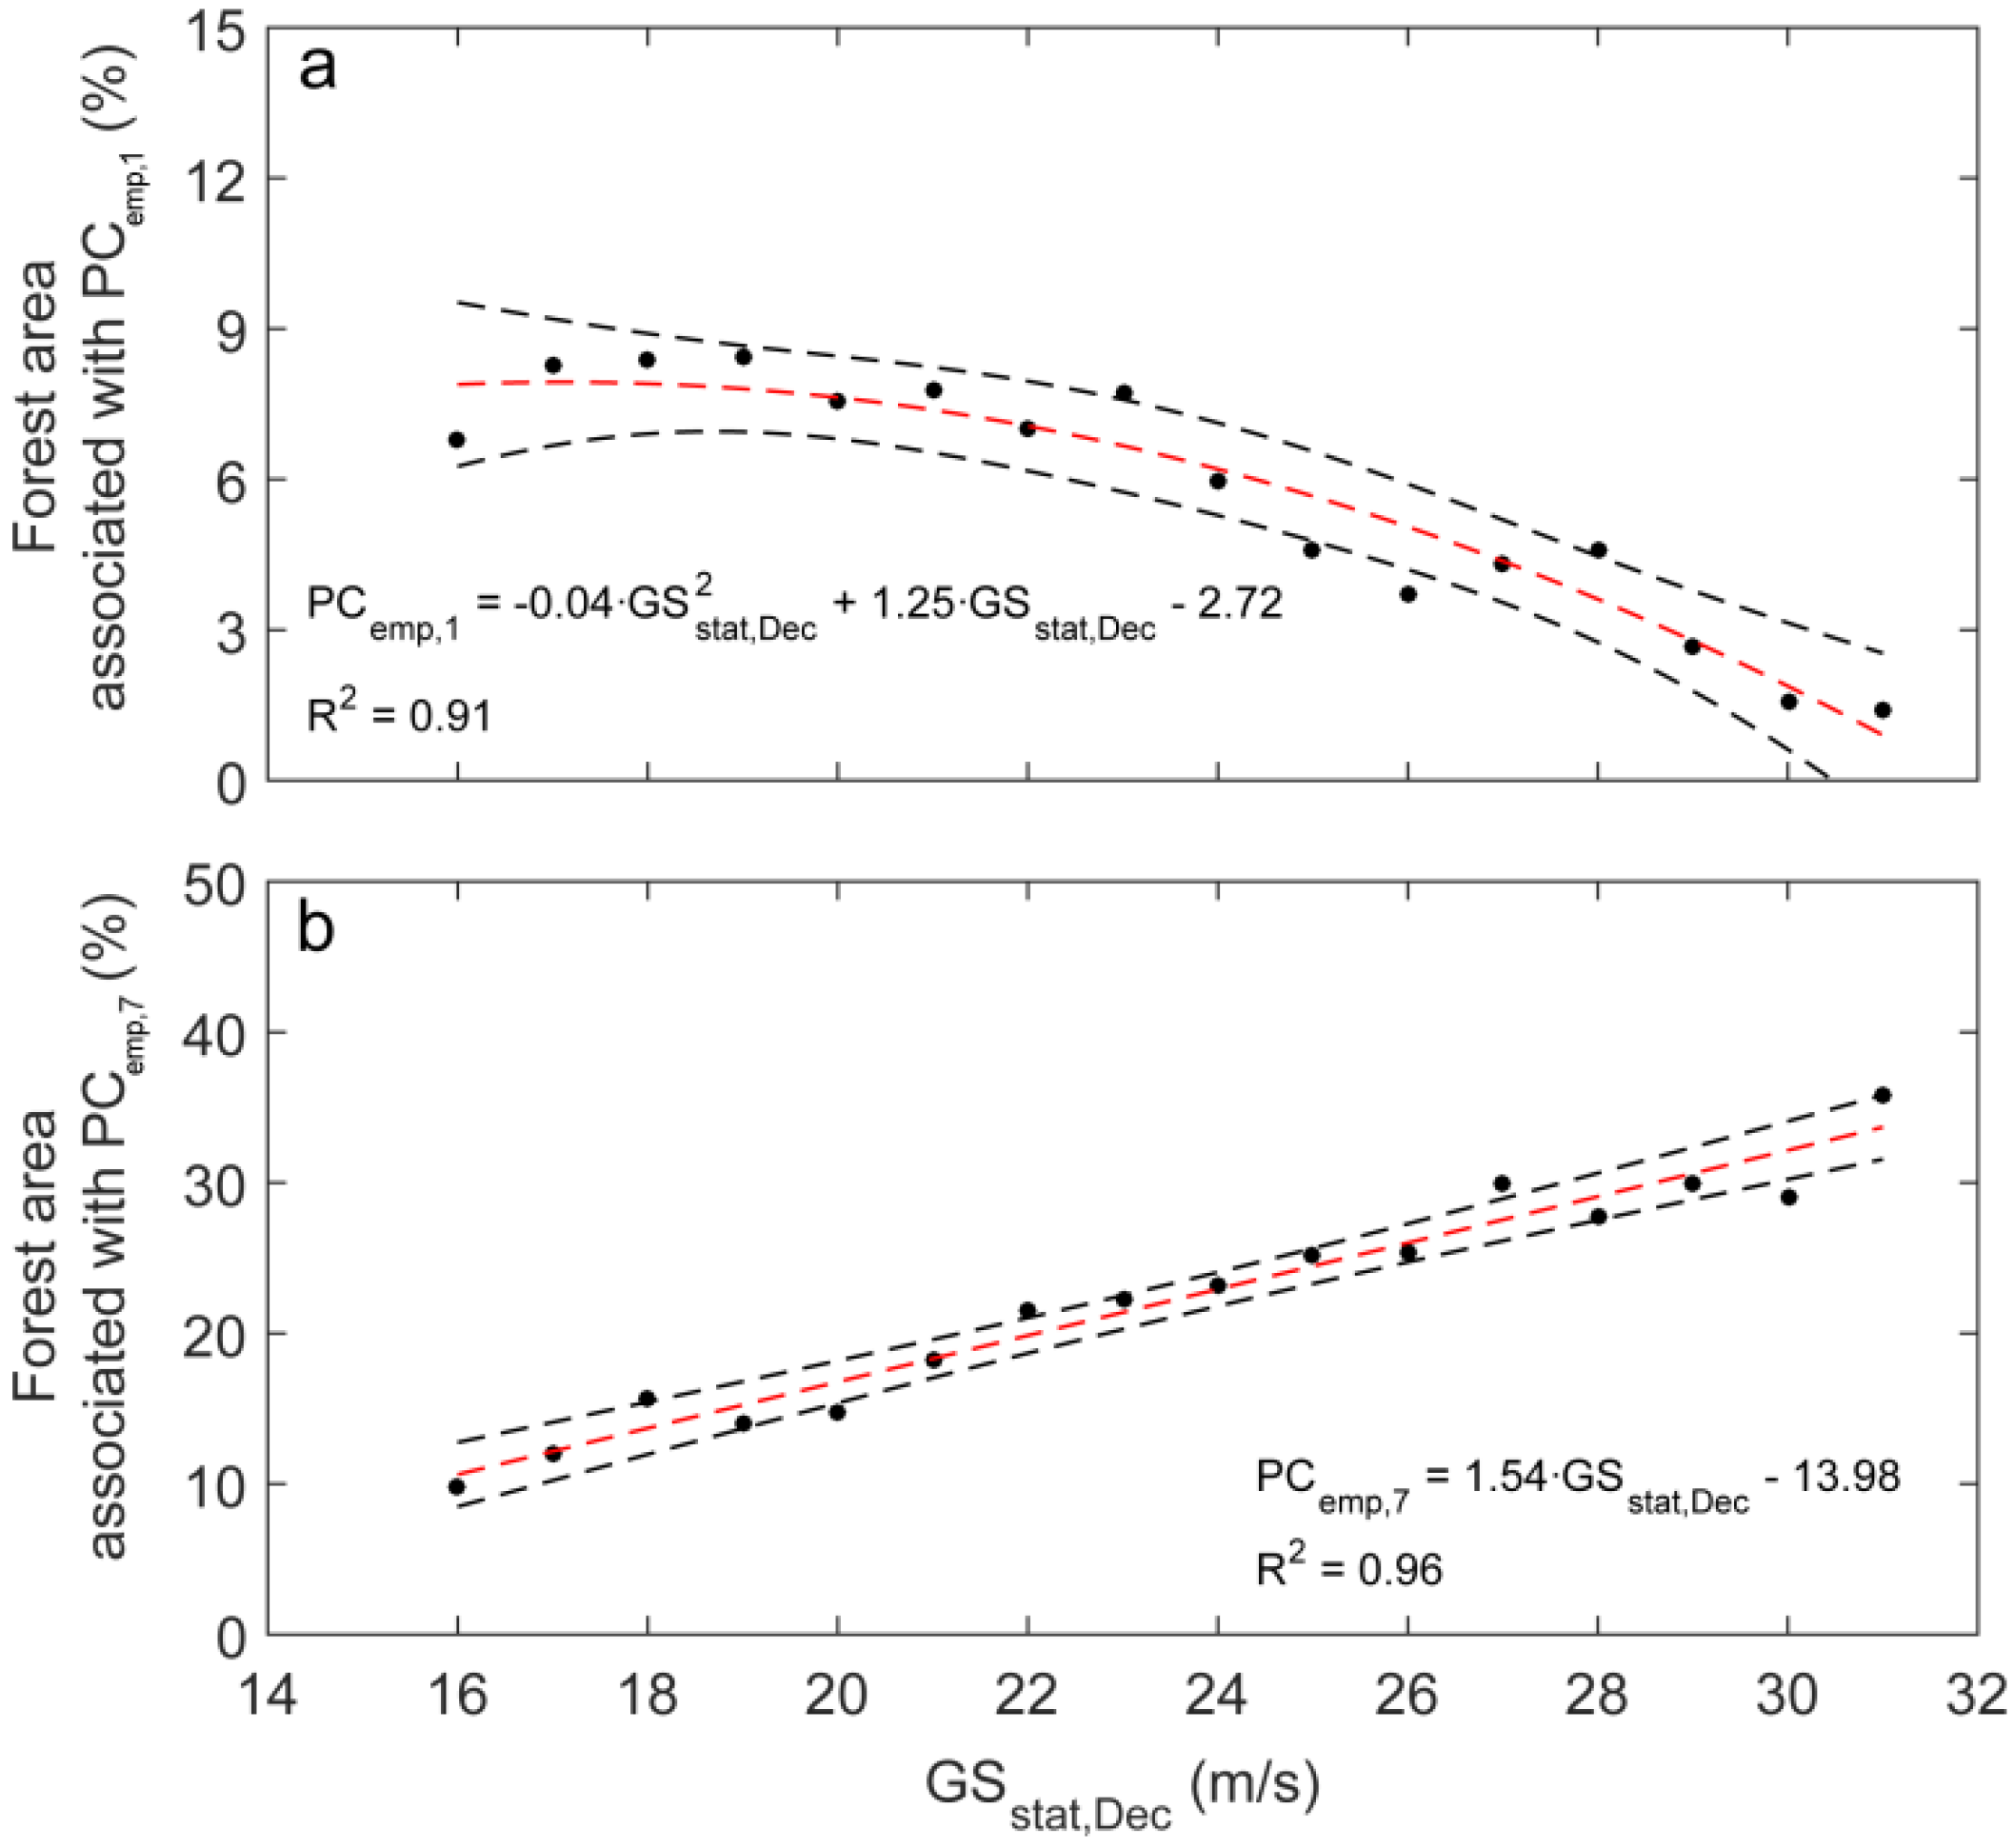
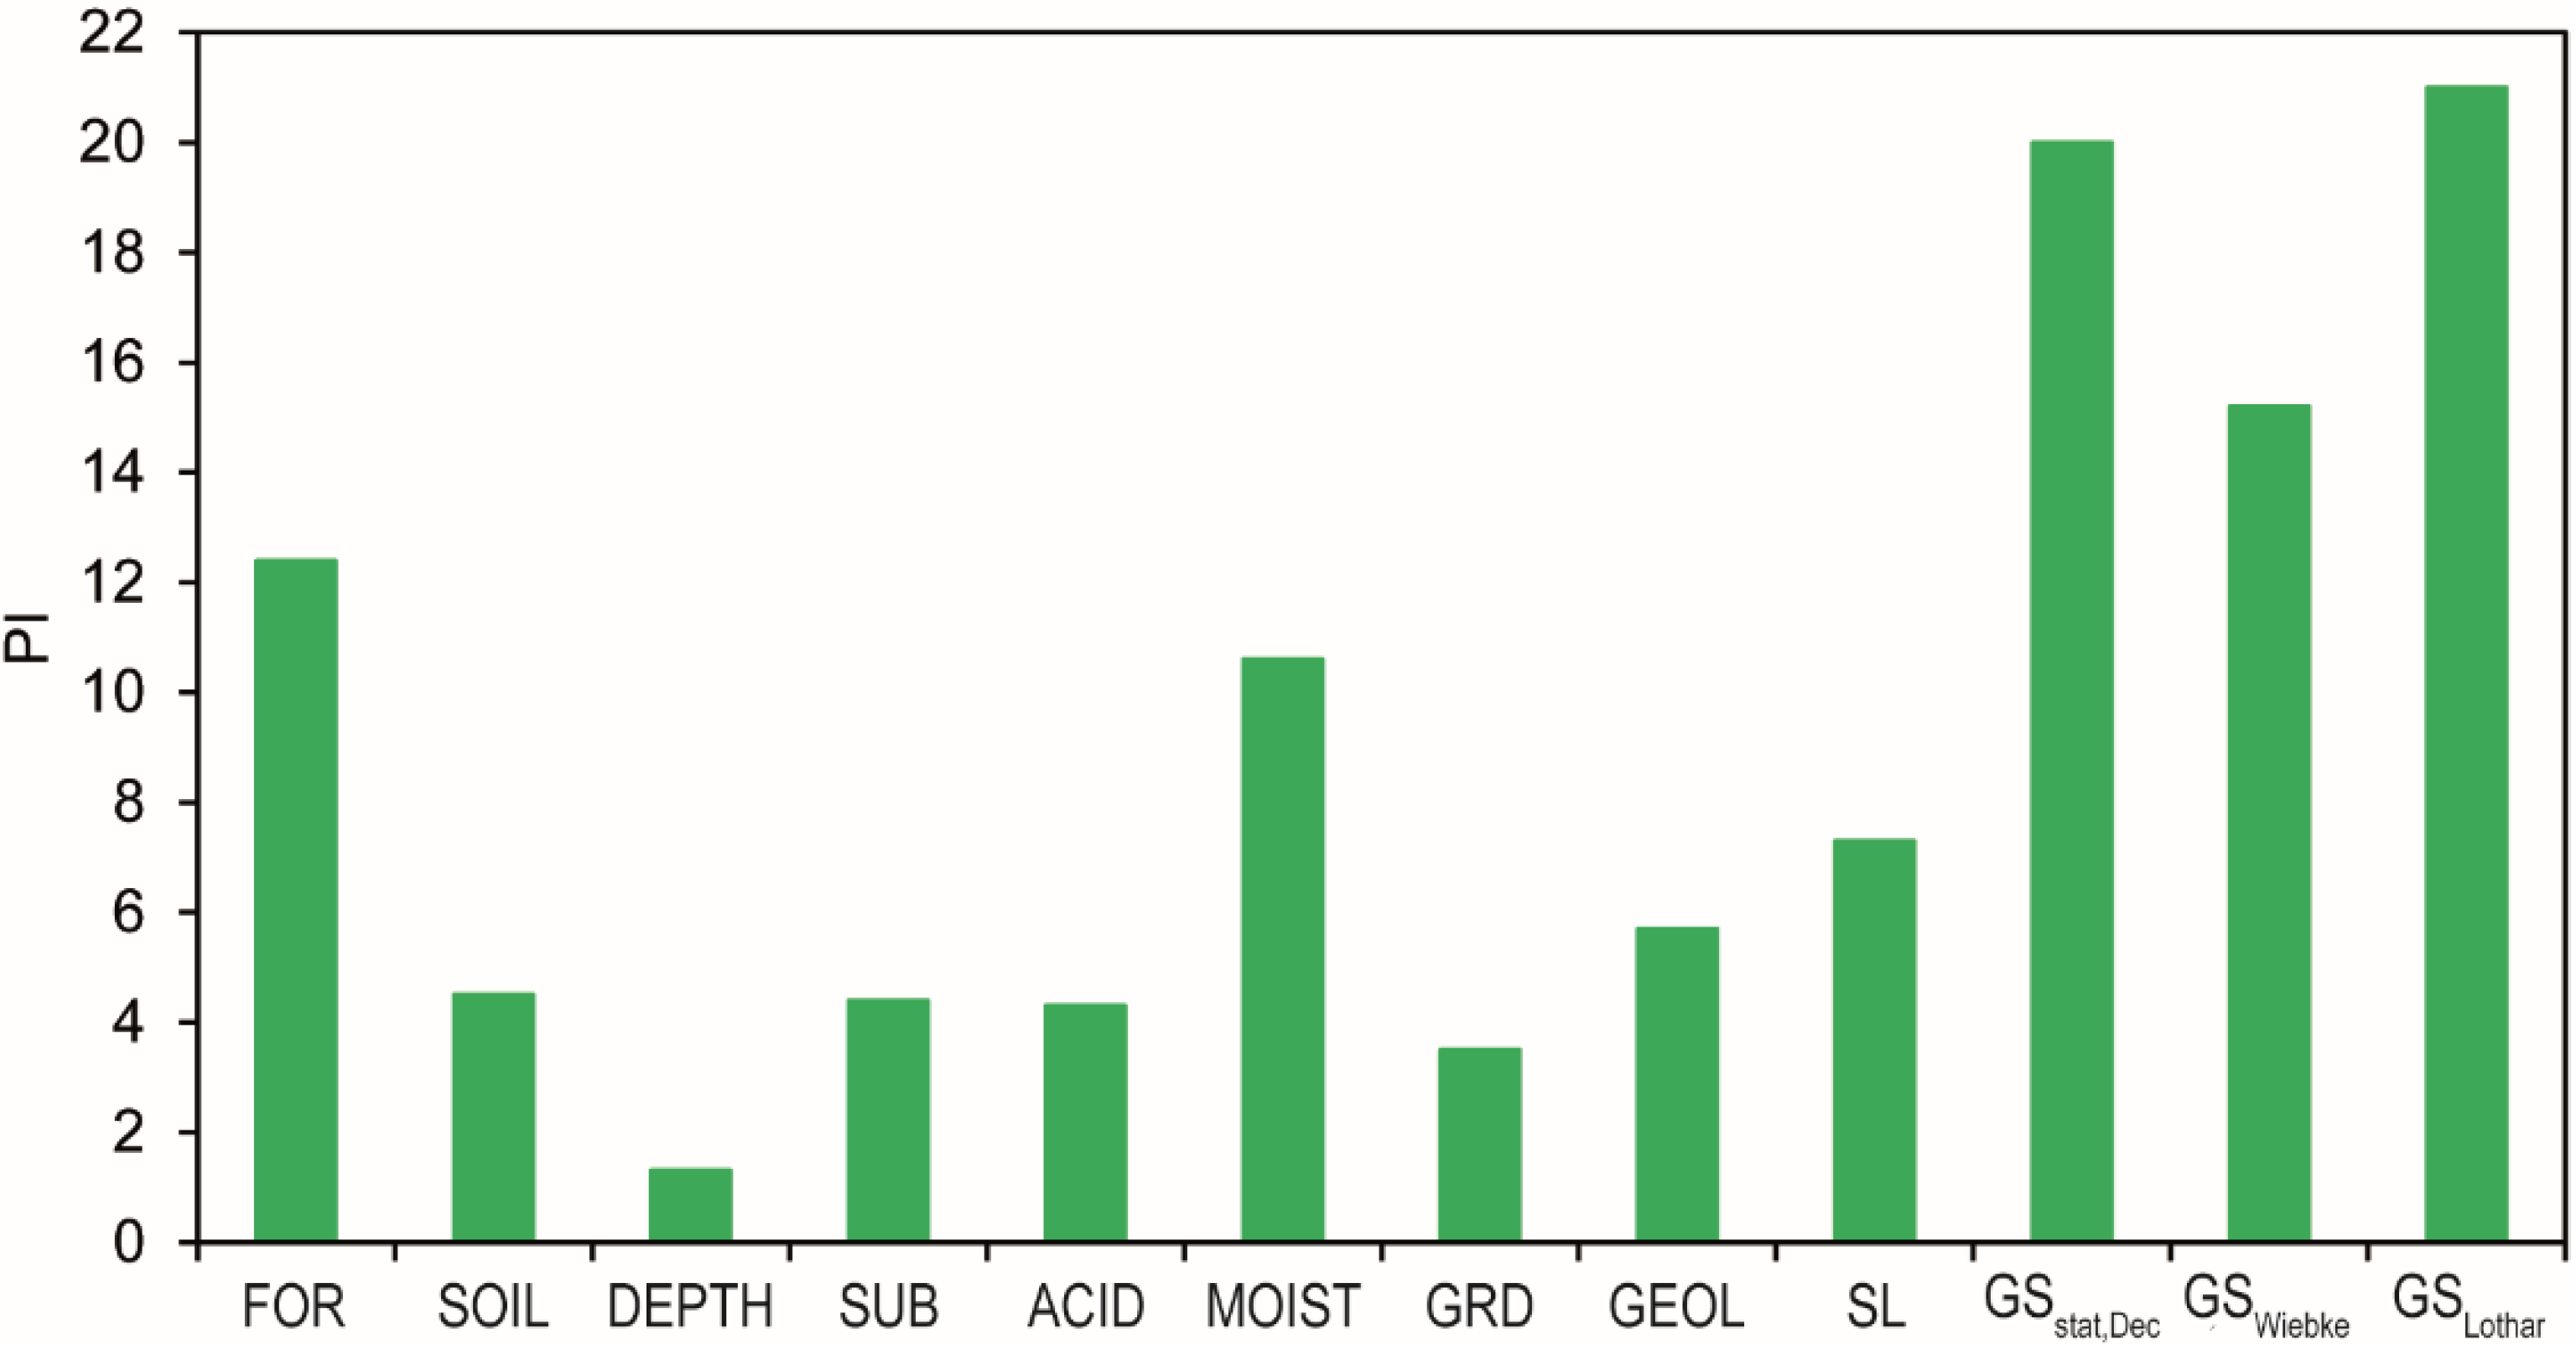
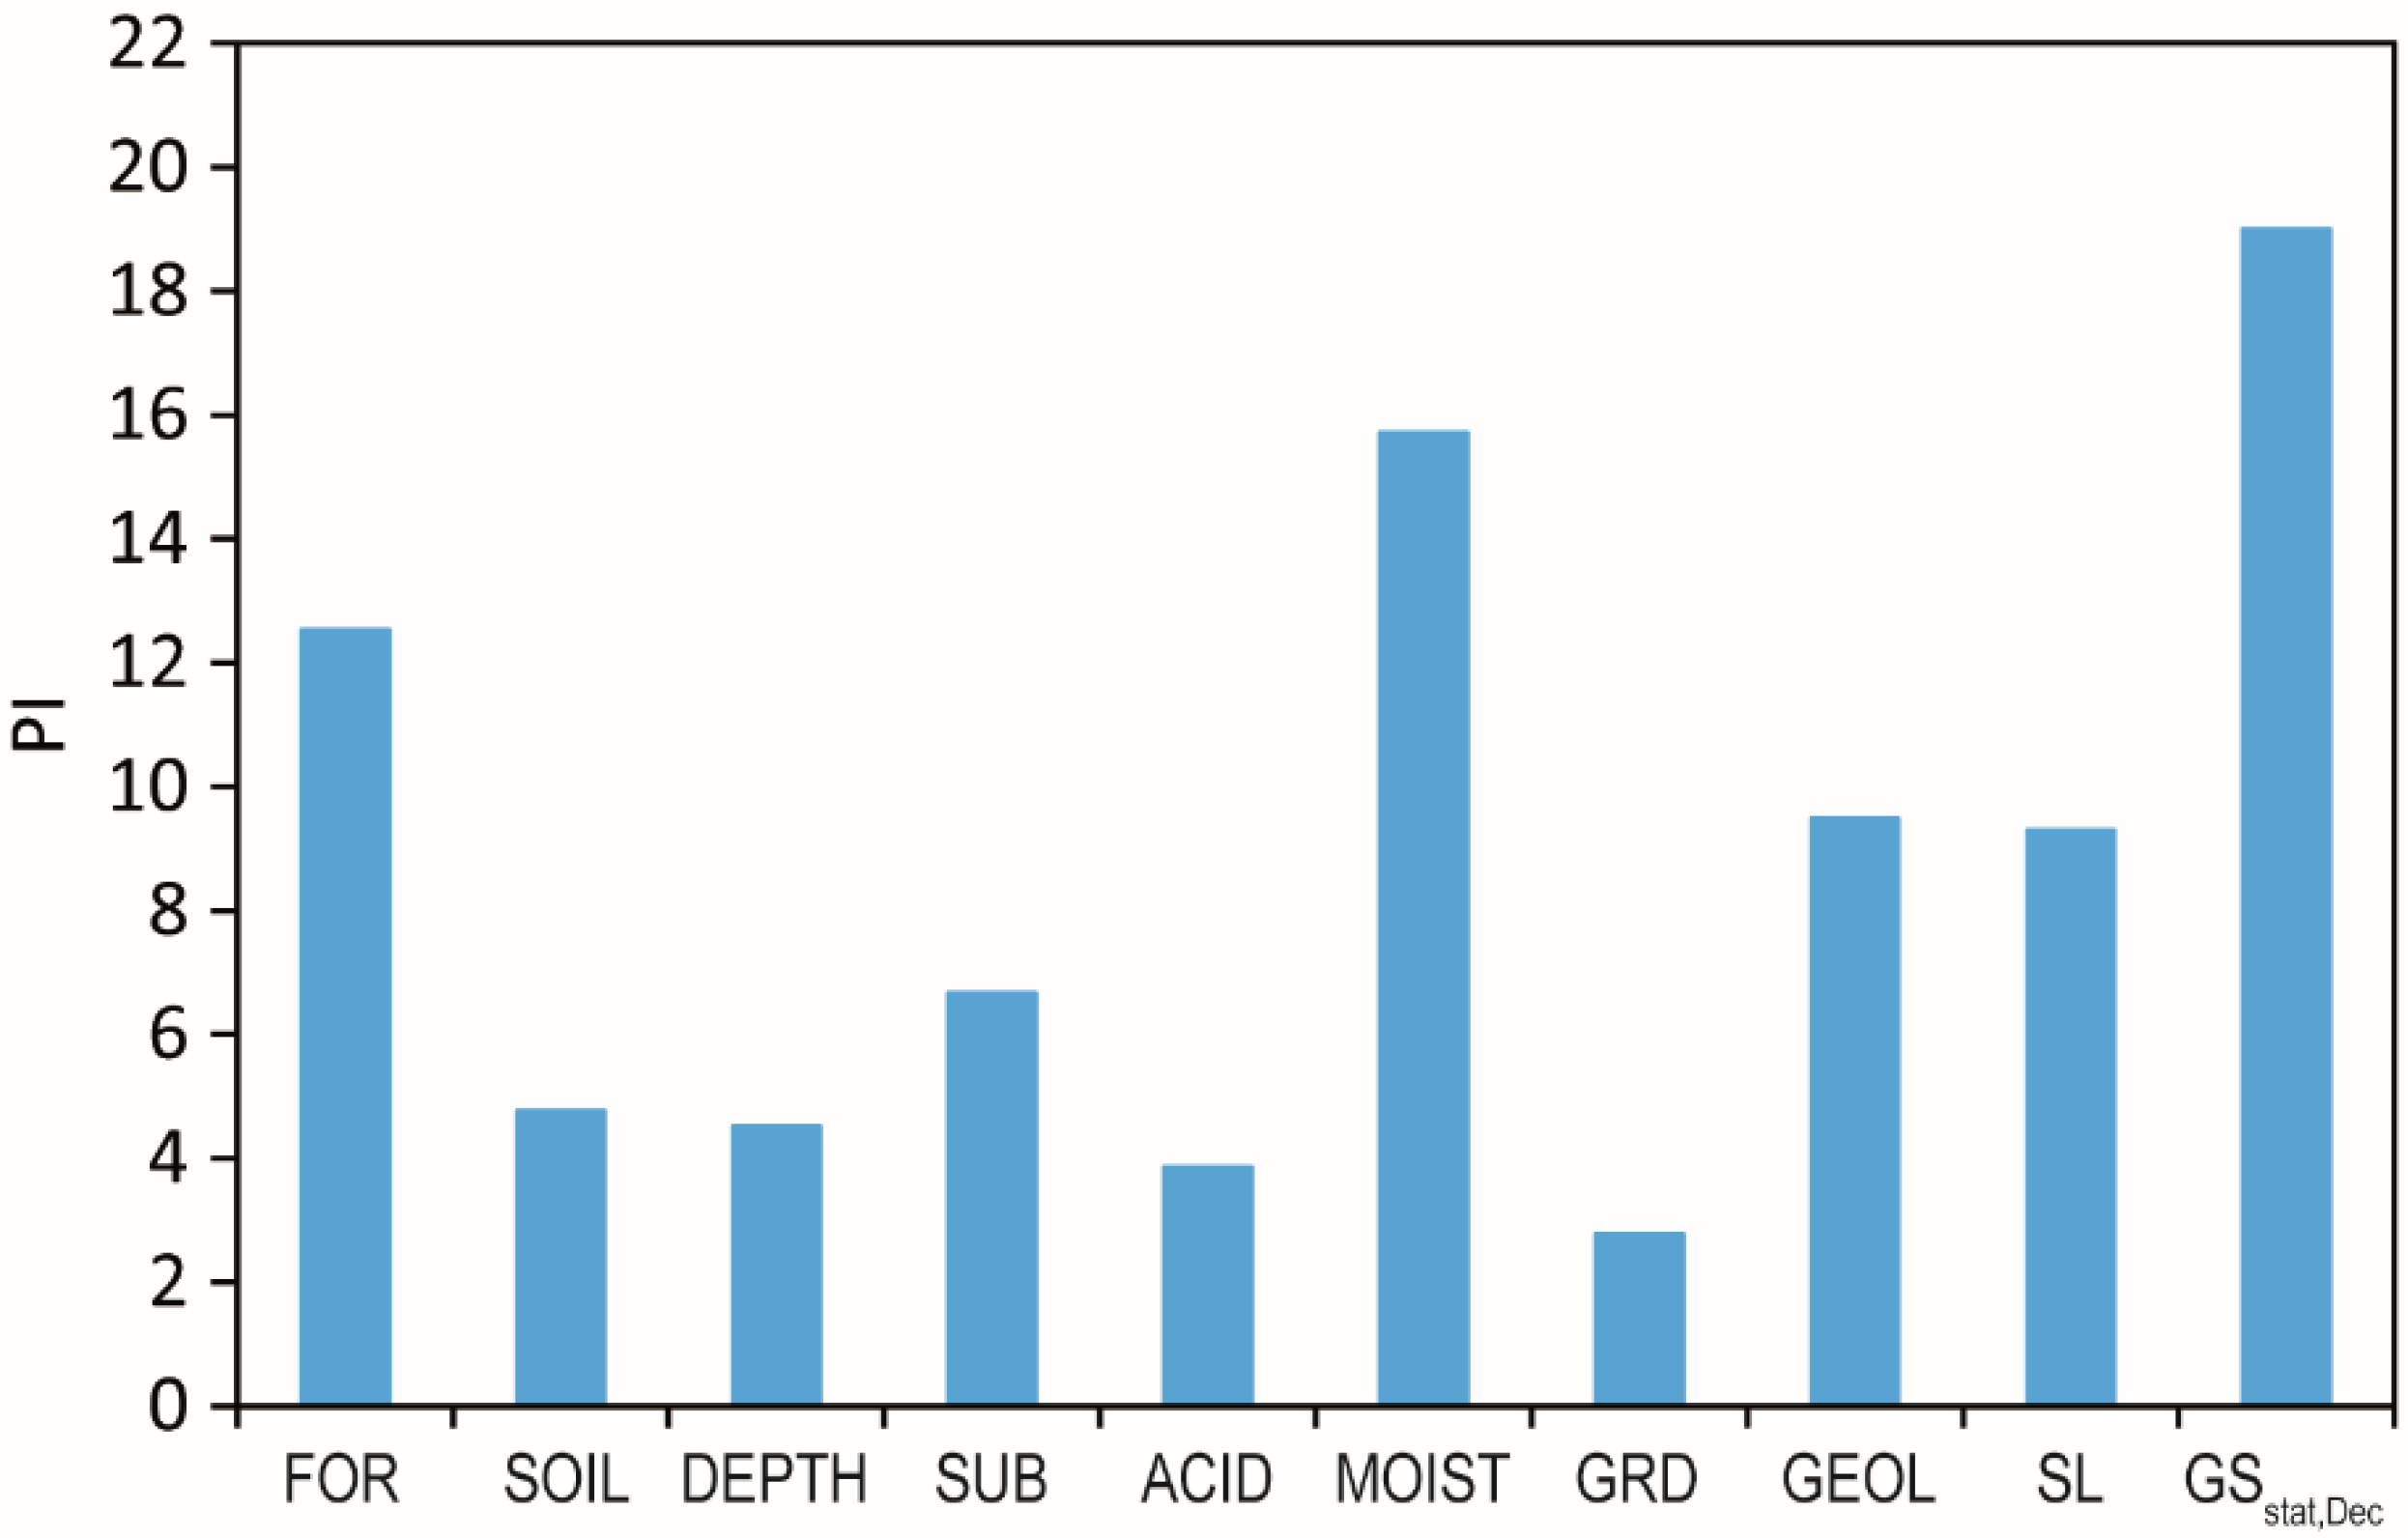
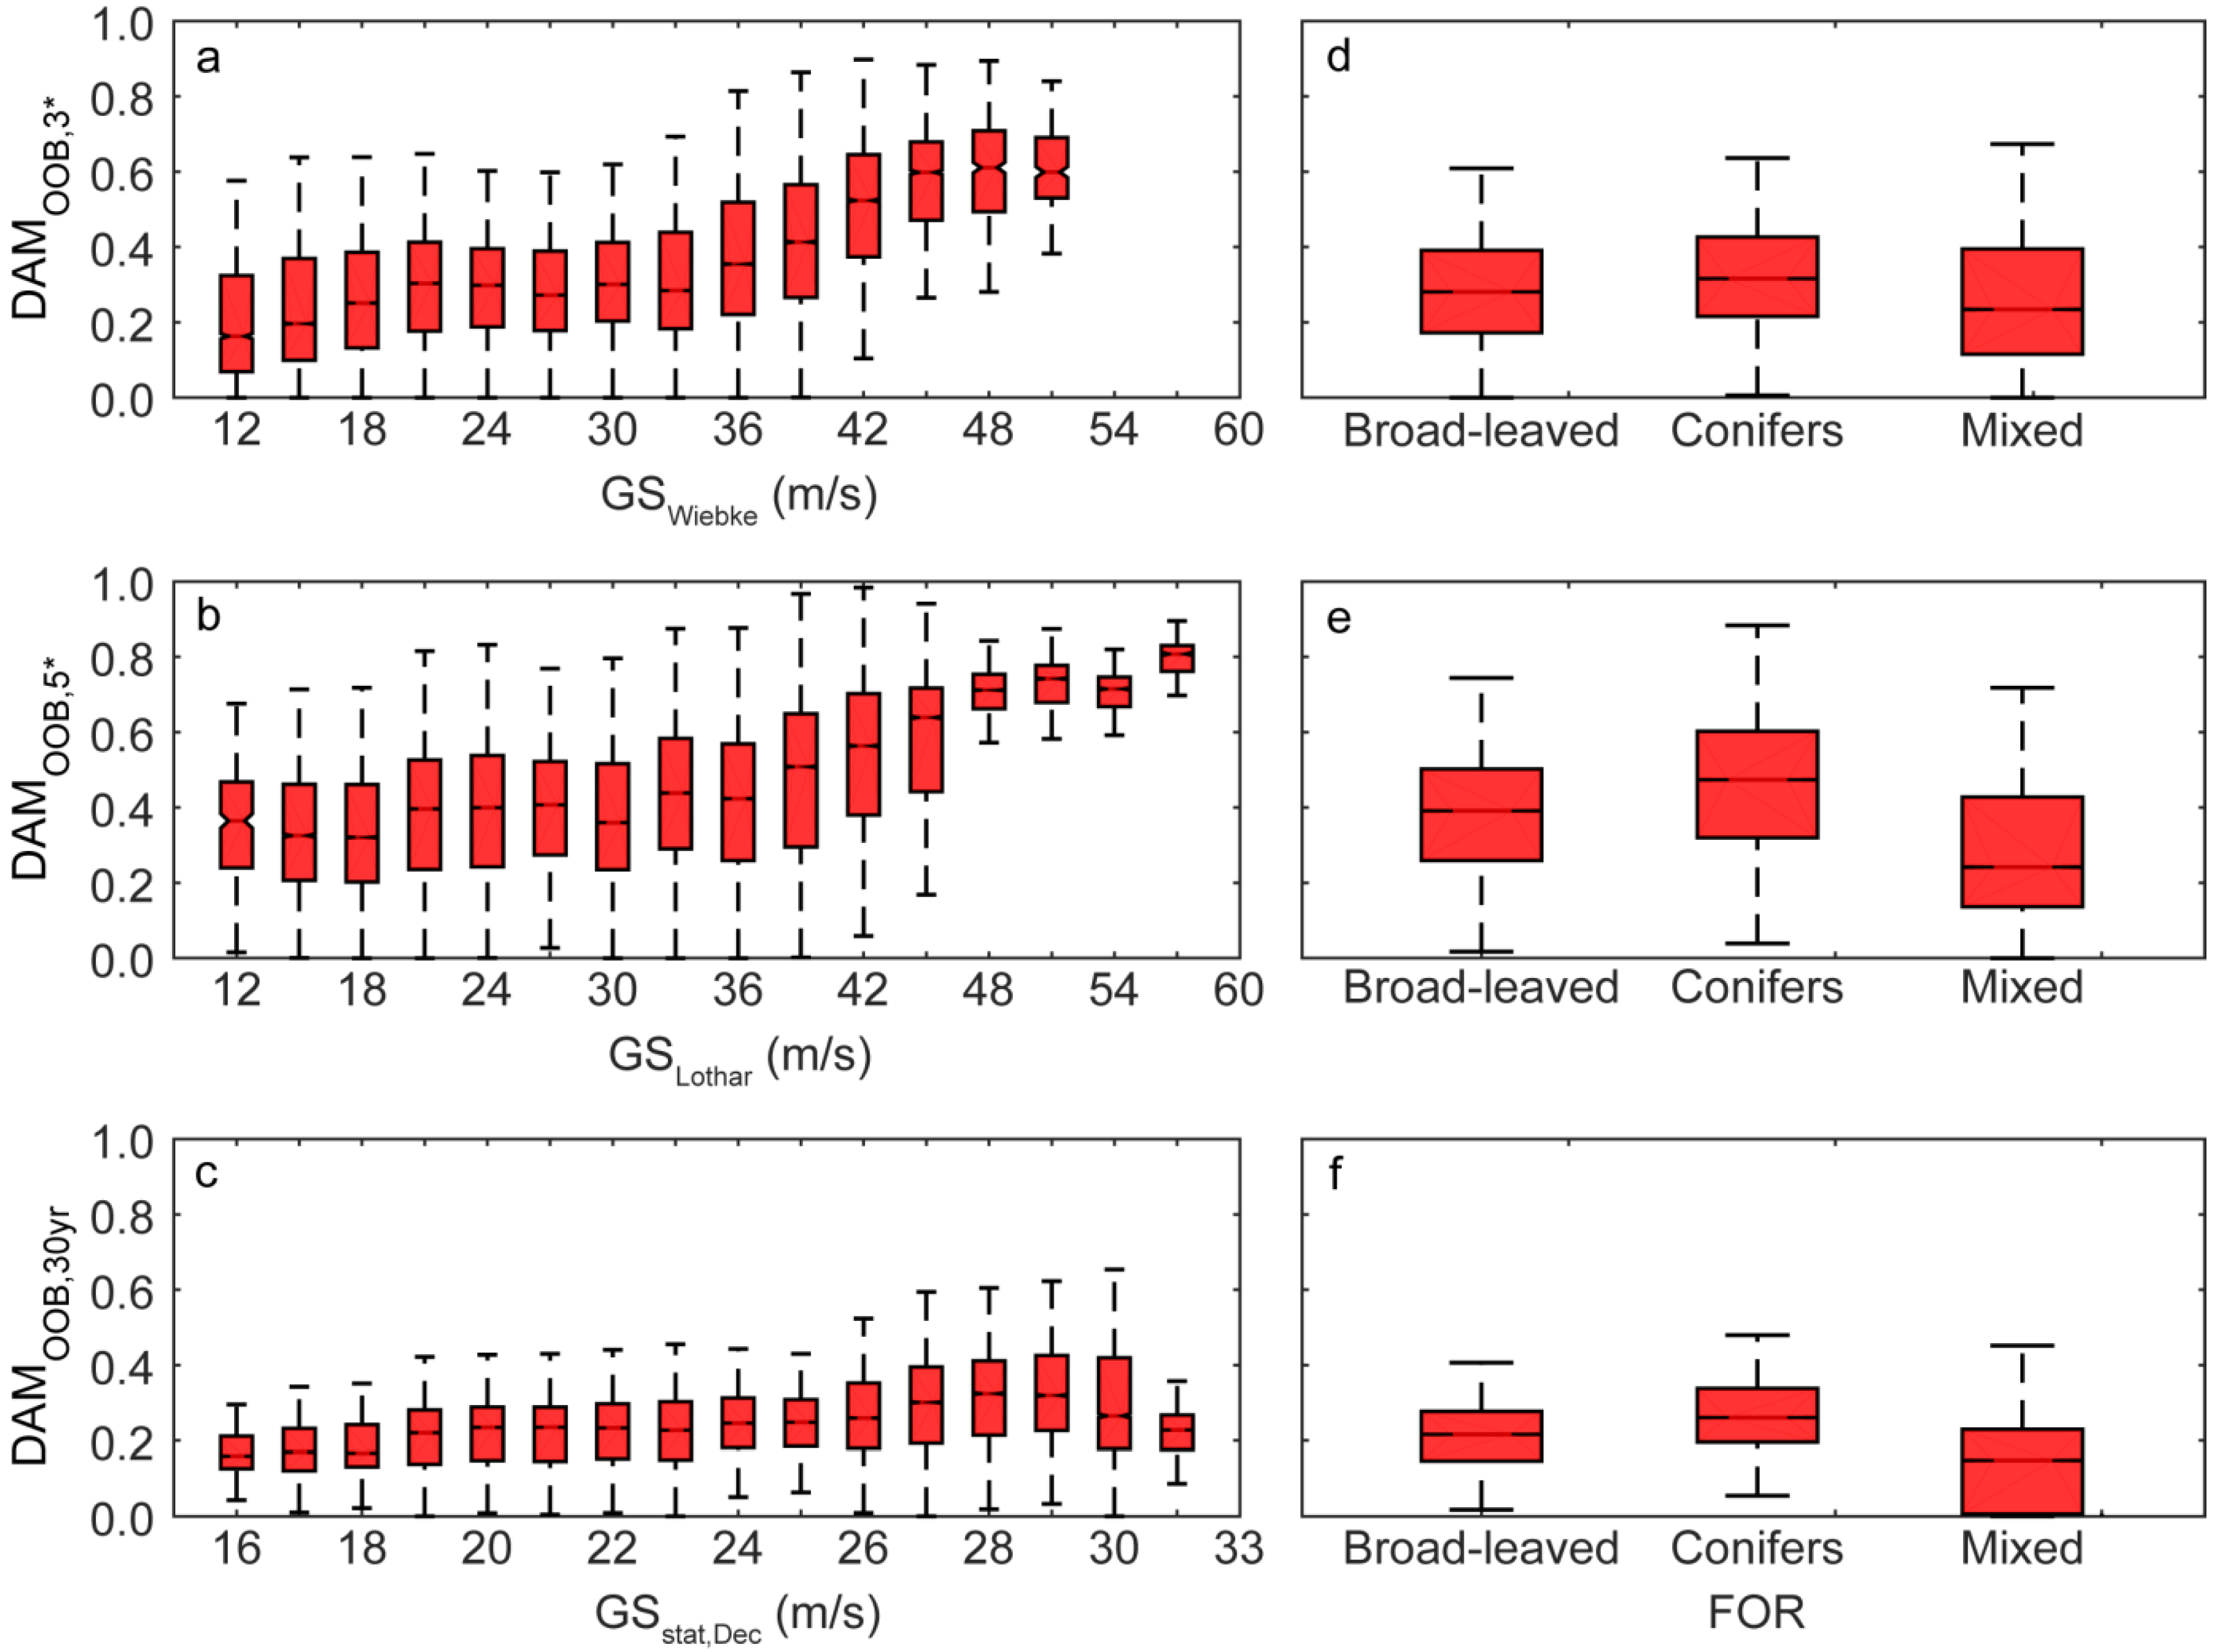
3.1.2. Damage Proportions
| DAMmod | ||||||||||
|---|---|---|---|---|---|---|---|---|---|---|
| Predictor | 1 | 2 | 3 | 4 | 5 | 6 | Endemic | 30 year | 3* | 5* |
| FOR | 14.2 | 12.0 | 11.9 | 12.3 | 12.2 | 11.3 | 8.6 | 14.9 | 11.9 | 14.3 |
| SOIL | 4.0 | 6.1 | 8.3 | 6.9 | 4.8 | 5.2 | 5.8 | 5.2 | 7.1 | 5.4 |
| DEPTH | 3.0 | 2.5 | 3.2 | 3.1 | 2.9 | 3.1 | 2.9 | 2.9 | 2.8 | 3.1 |
| SUB | 3.9 | 6.1 | 5.0 | 4.5 | 4.6 | 6.0 | 4.6 | 4.1 | 5.8 | 4.7 |
| ACID | 2.6 | 3.2 | 3.7 | 3.0 | 3.0 | 3.4 | 3.0 | 3.6 | 4.0 | 2.9 |
| MOIST | 9.1 | 14.0 | 13.1 | 12.6 | 12.5 | 8.5 | 11.4 | 13.3 | 15.1 | 12.1 |
| GRD | 1.7 | 2.1 | 2.5 | 1.4 | 2.4 | 1.7 | 2.1 | 3.0 | 2.0 | 2.1 |
| GEOL | 6.3 | 7.9 | 11.0 | 7.3 | 9.7 | 5.9 | 7.8 | 5.9 | 10.4 | 8.9 |
| SL | 11.1 | 11.4 | 12.7 | 13.5 | 18.6 | 13.1 | 12.1 | 10.3 | 13.1 | 12.8 |
| GSstat,Dec | 15.6 | 20.0 | 16.6 | 21.2 | 21.2 | 20.6 | 19.1 | |||
| GSstat,Jan | 21.8 | 15.6 | 19.7 | |||||||
| GSWiebke | 23.2 | |||||||||
| GSLothar | 20.1 | |||||||||

3.1.3. Damage Risk

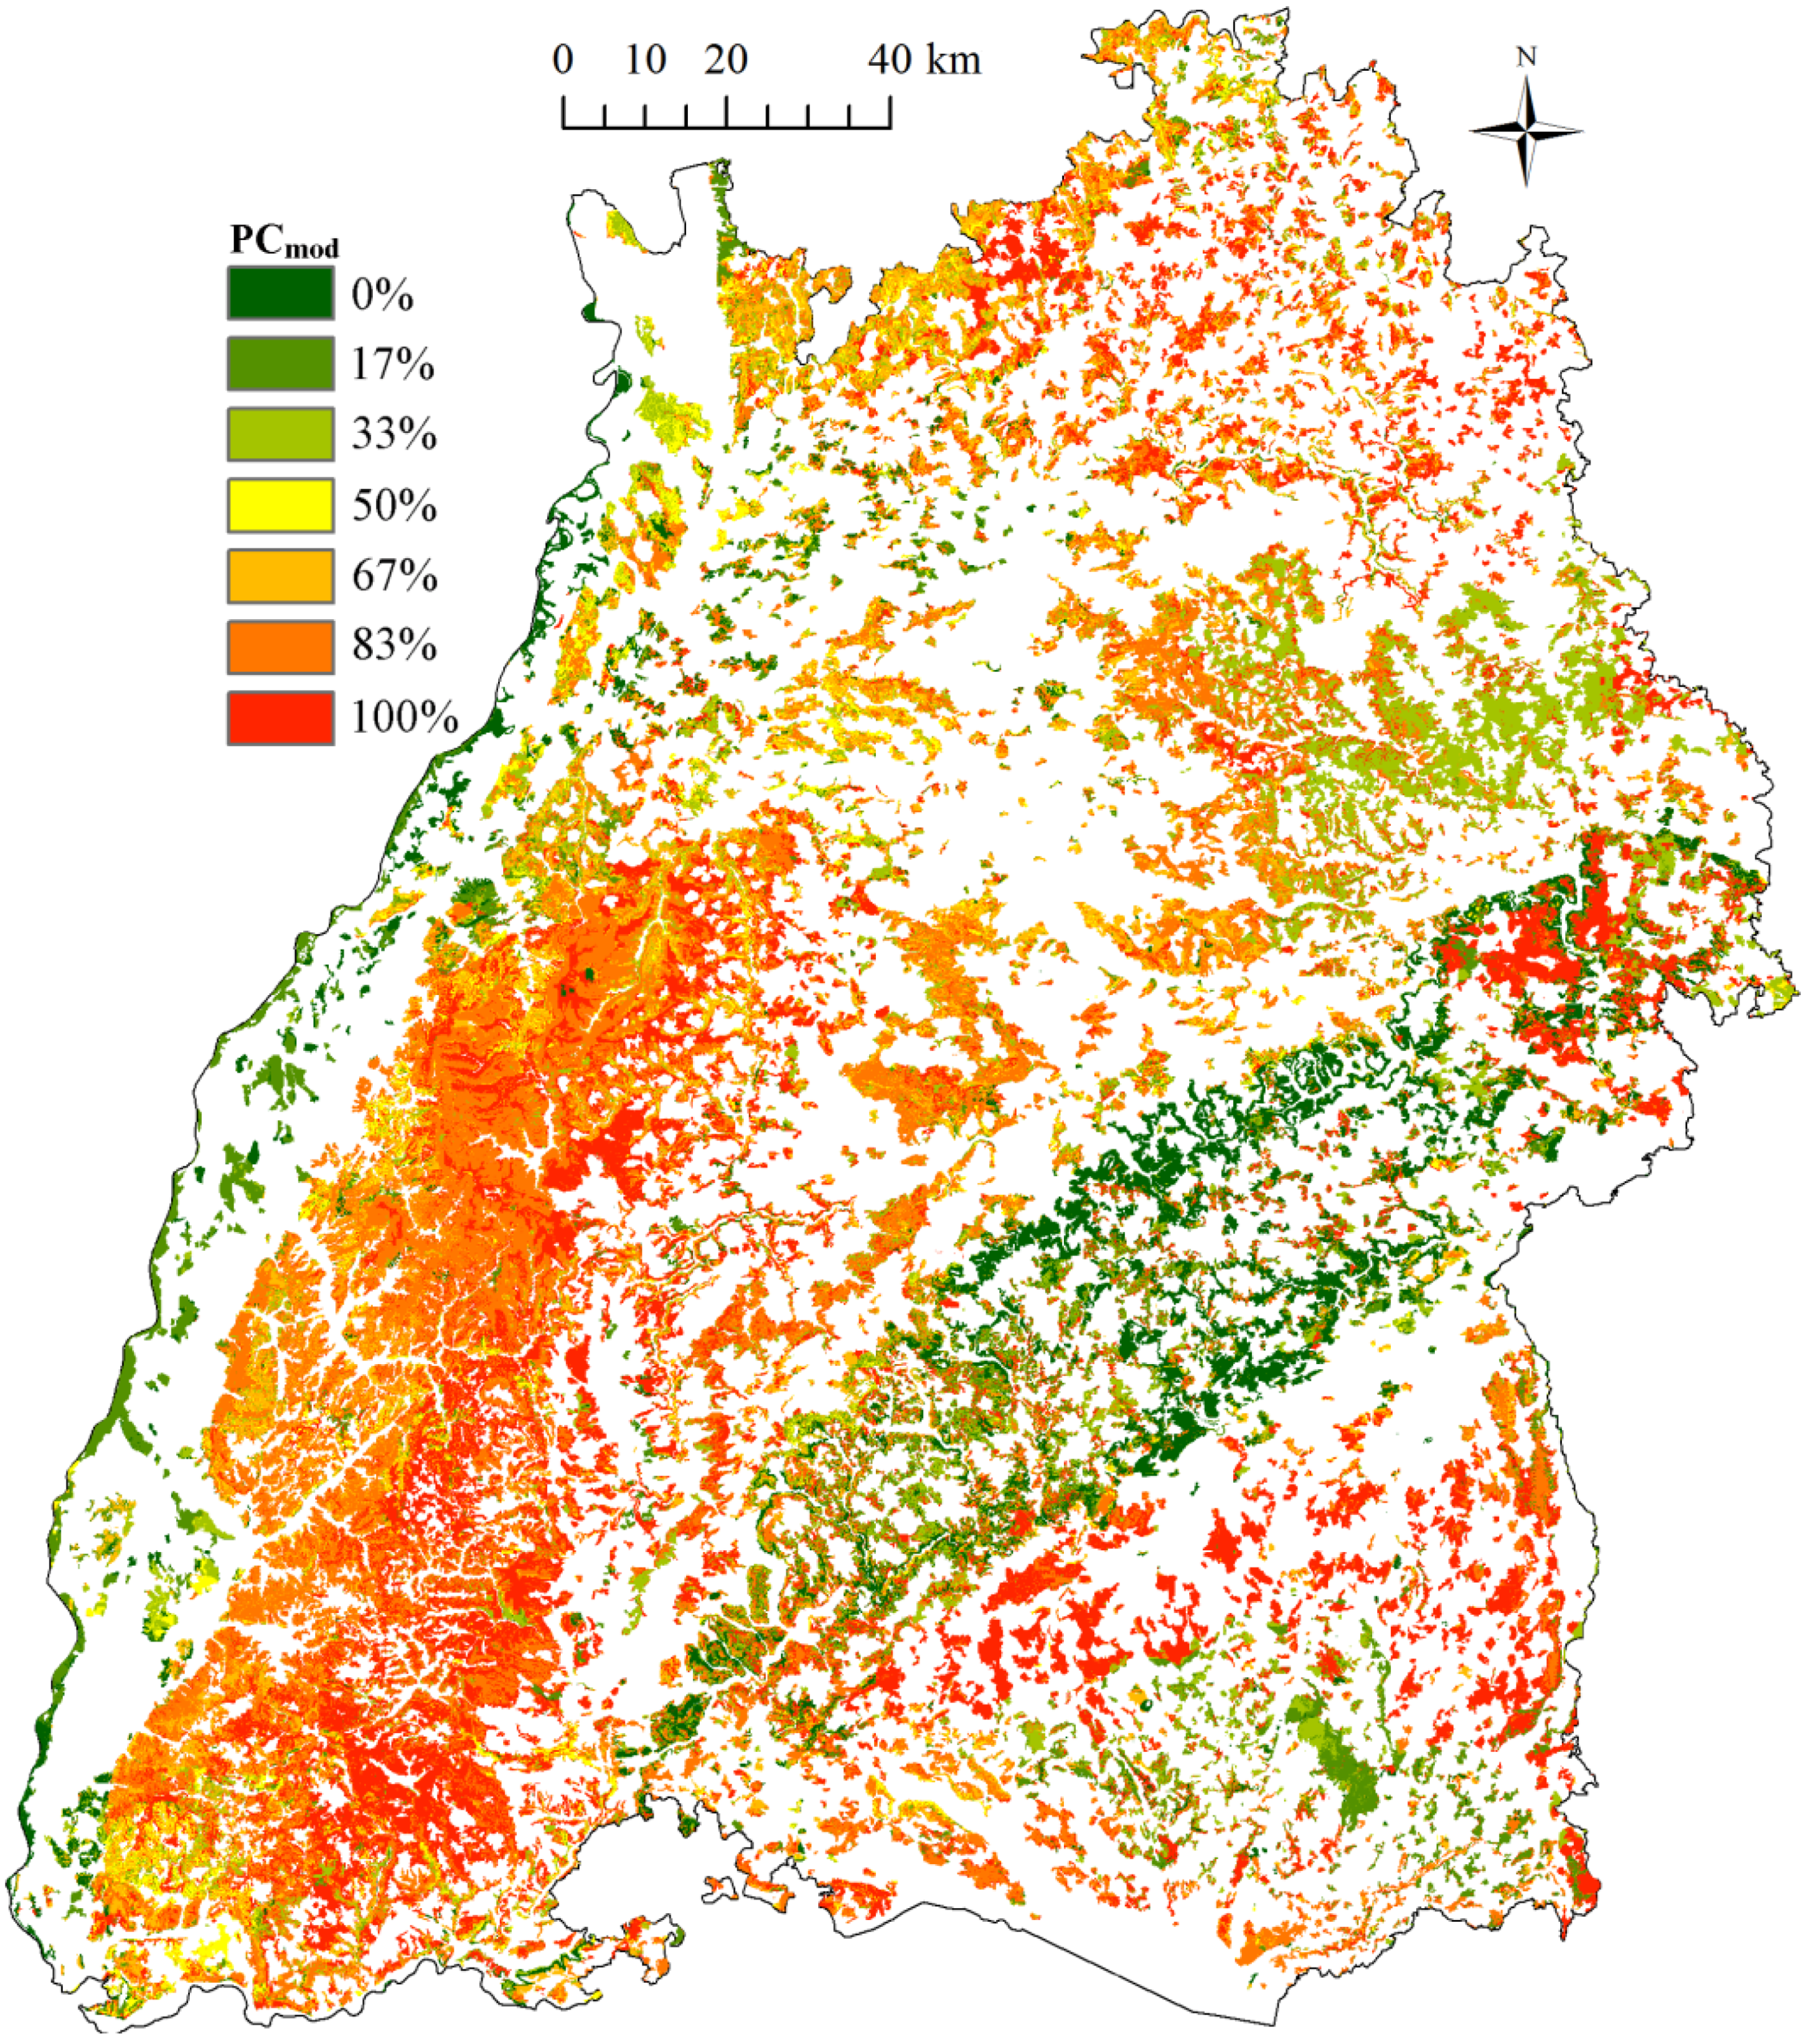
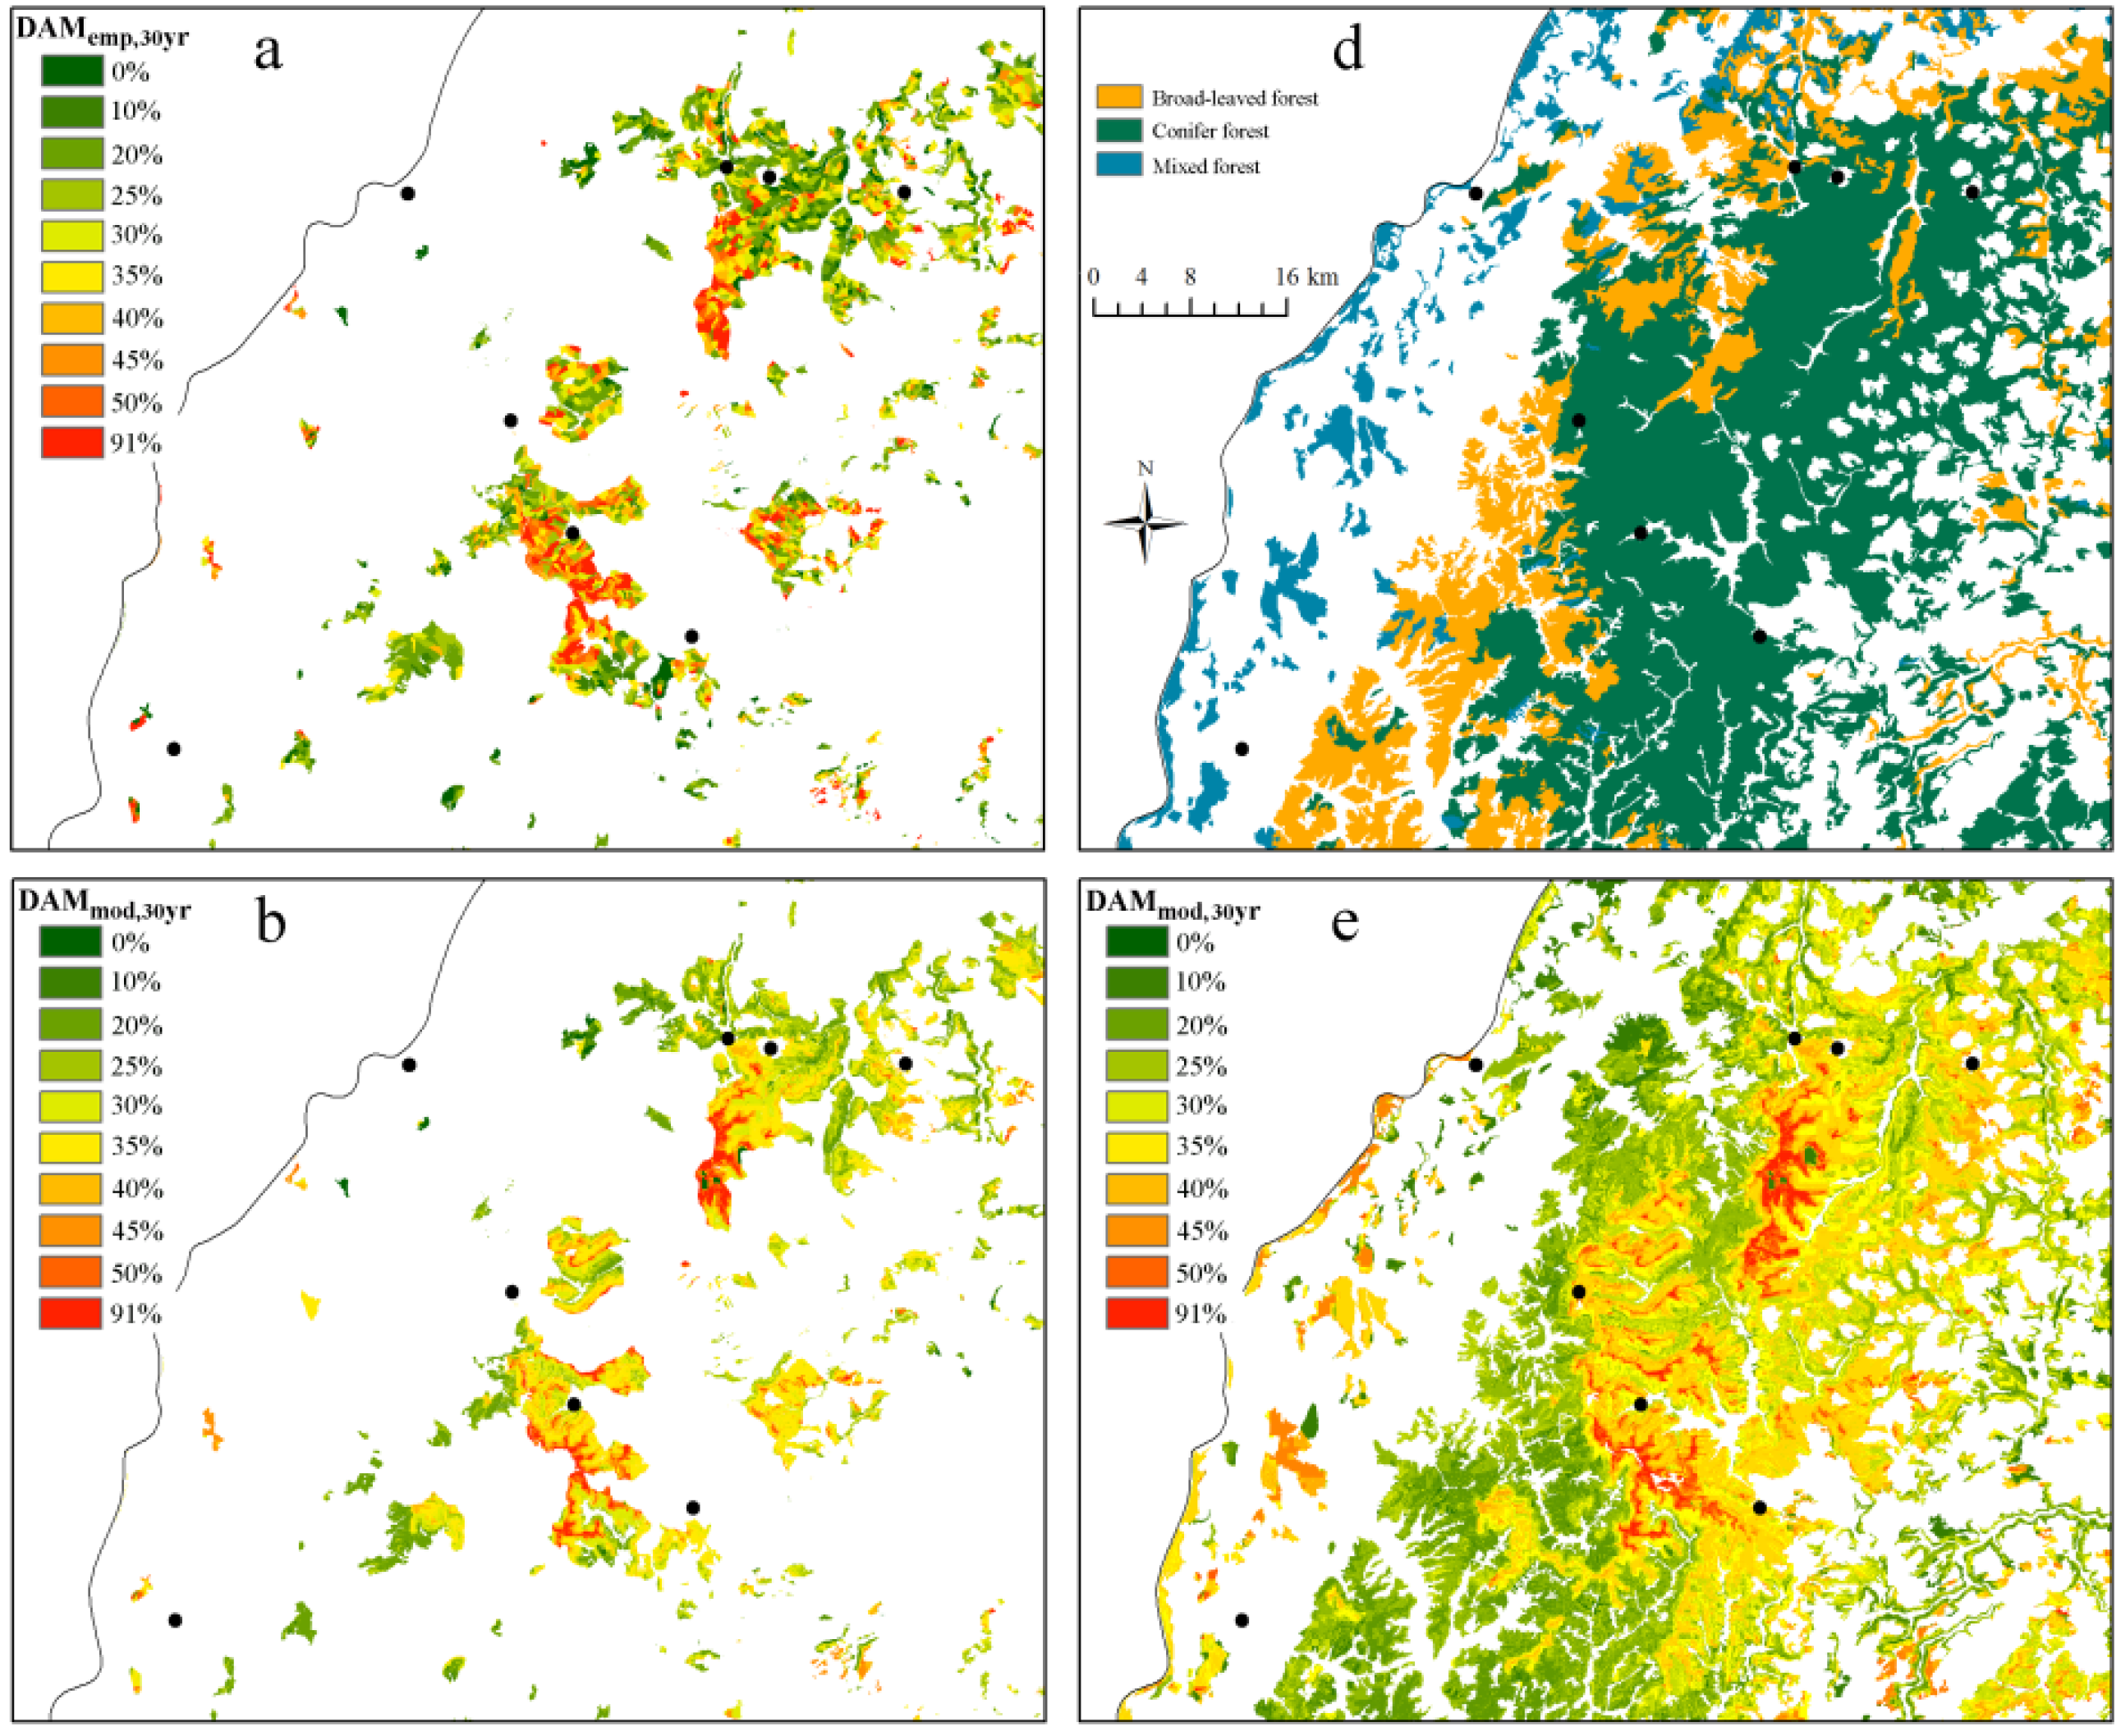
3.2. Mapping of Damage Probability

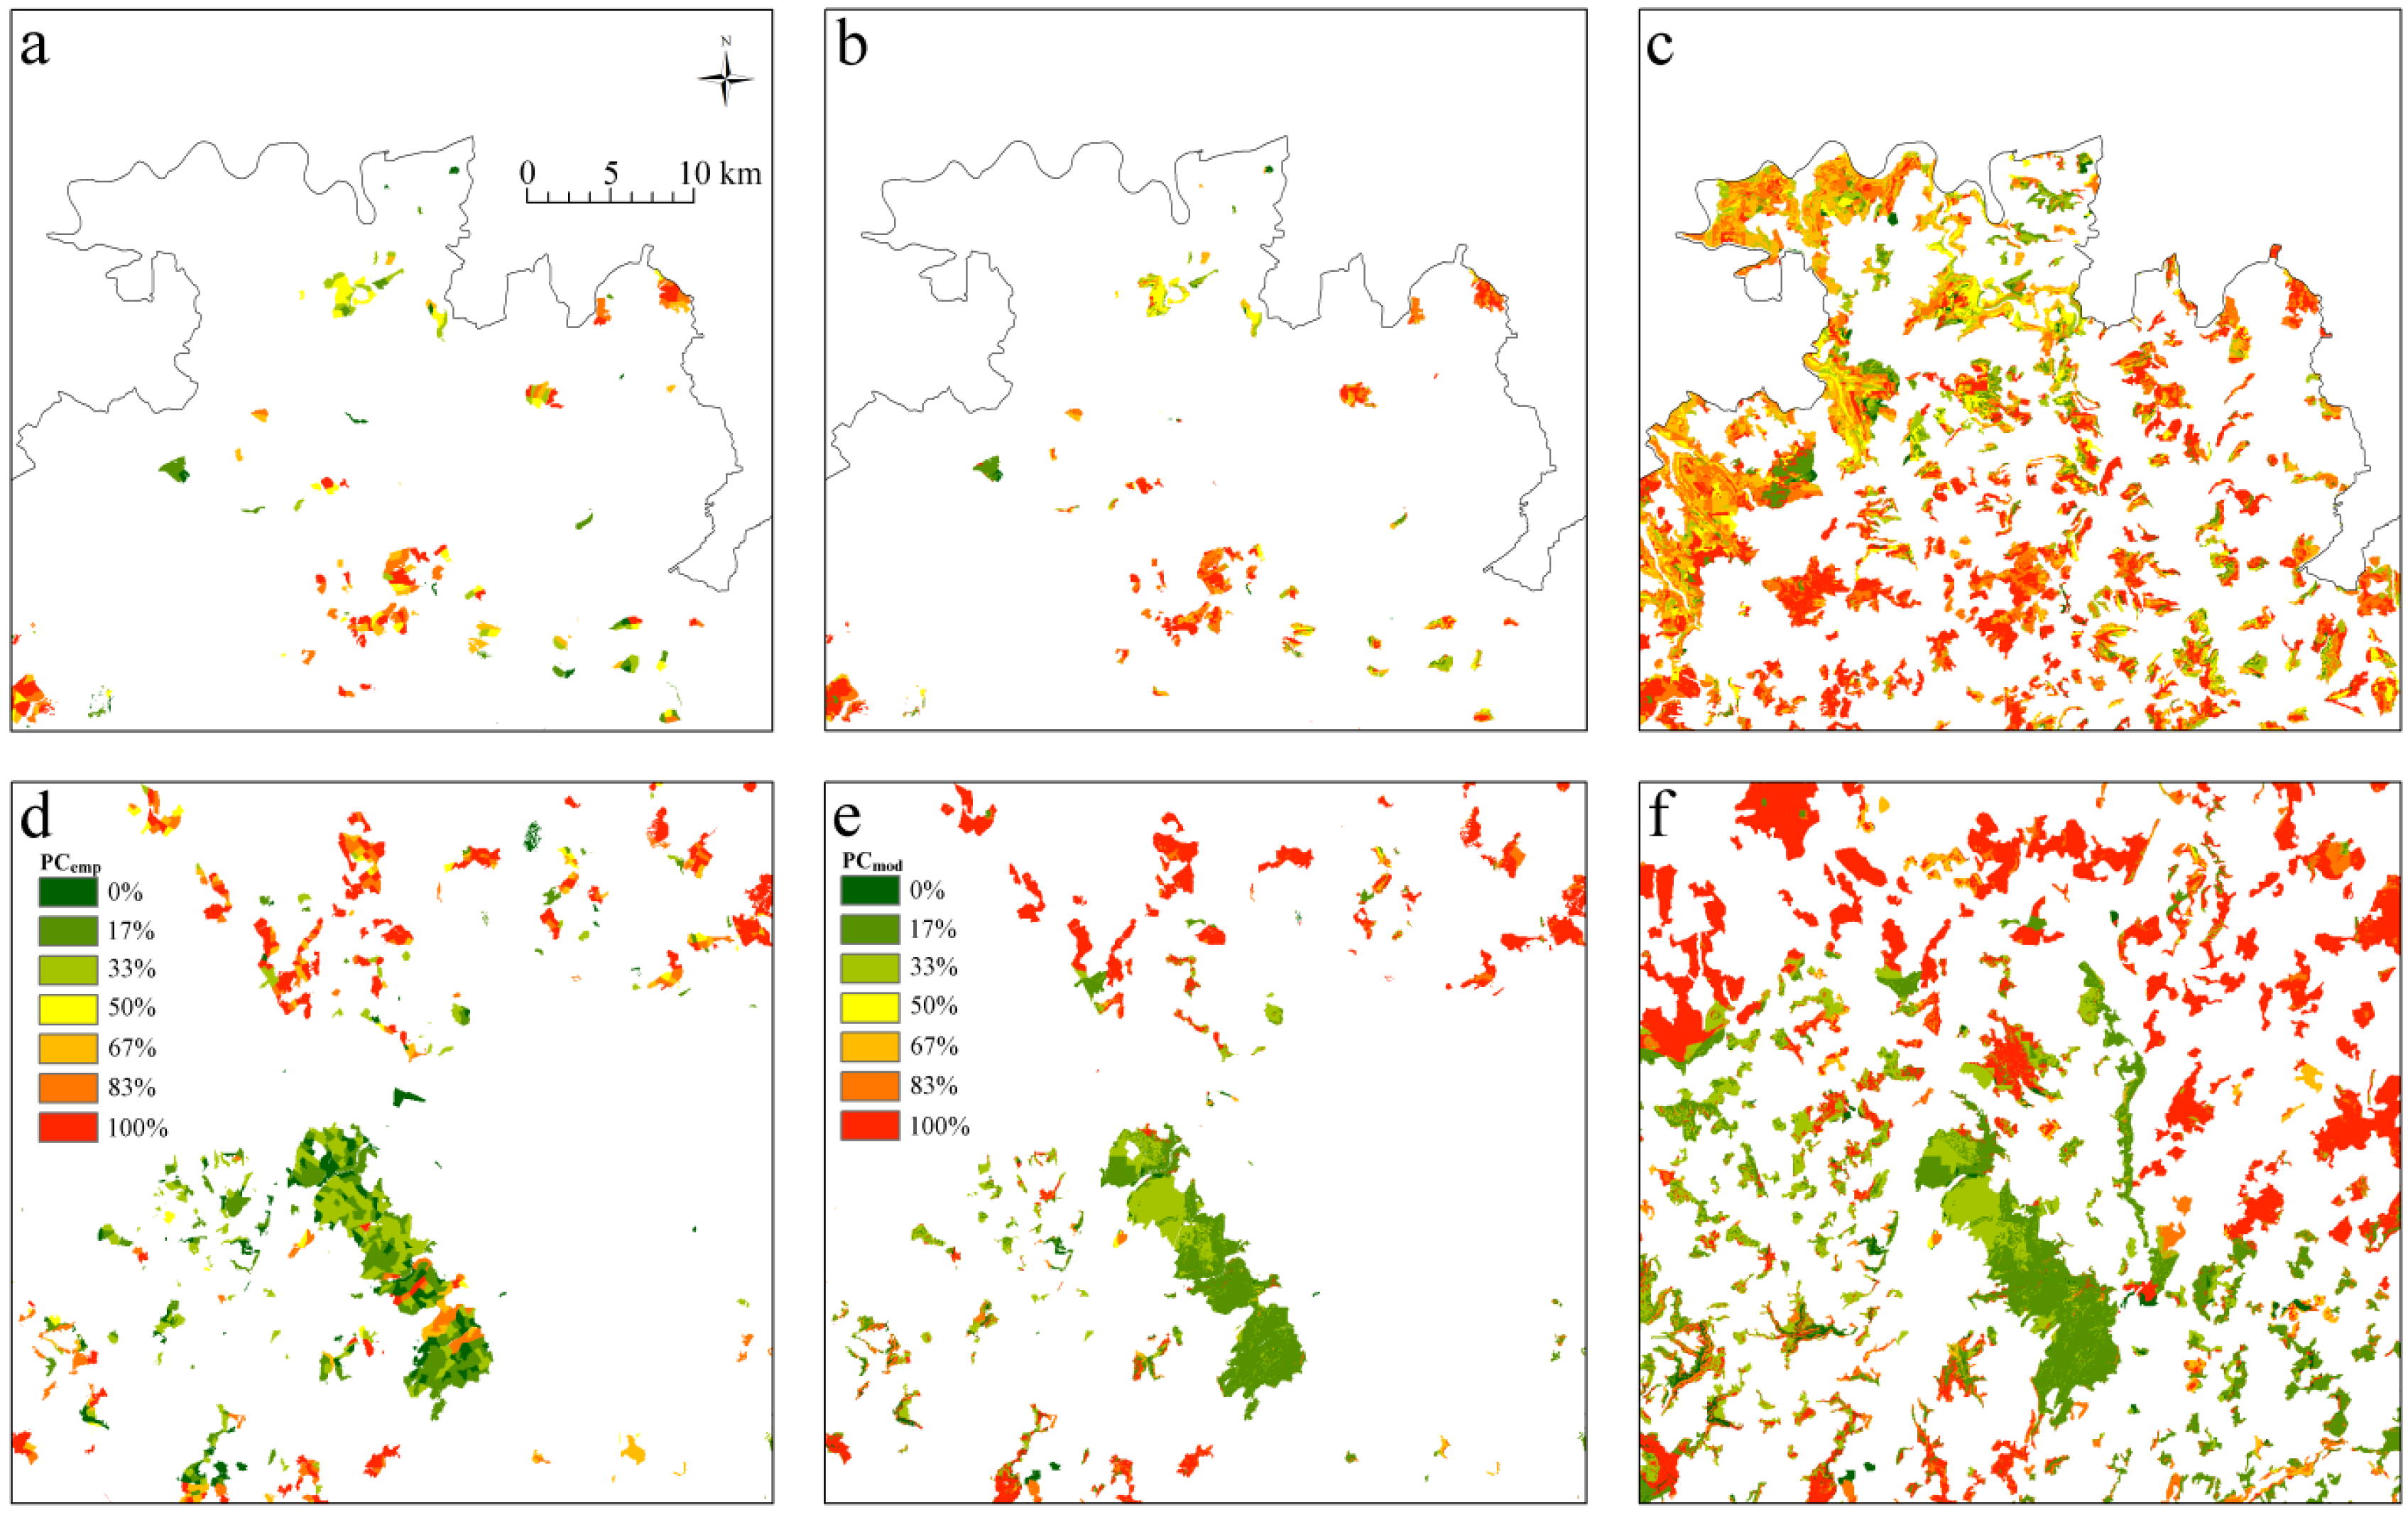

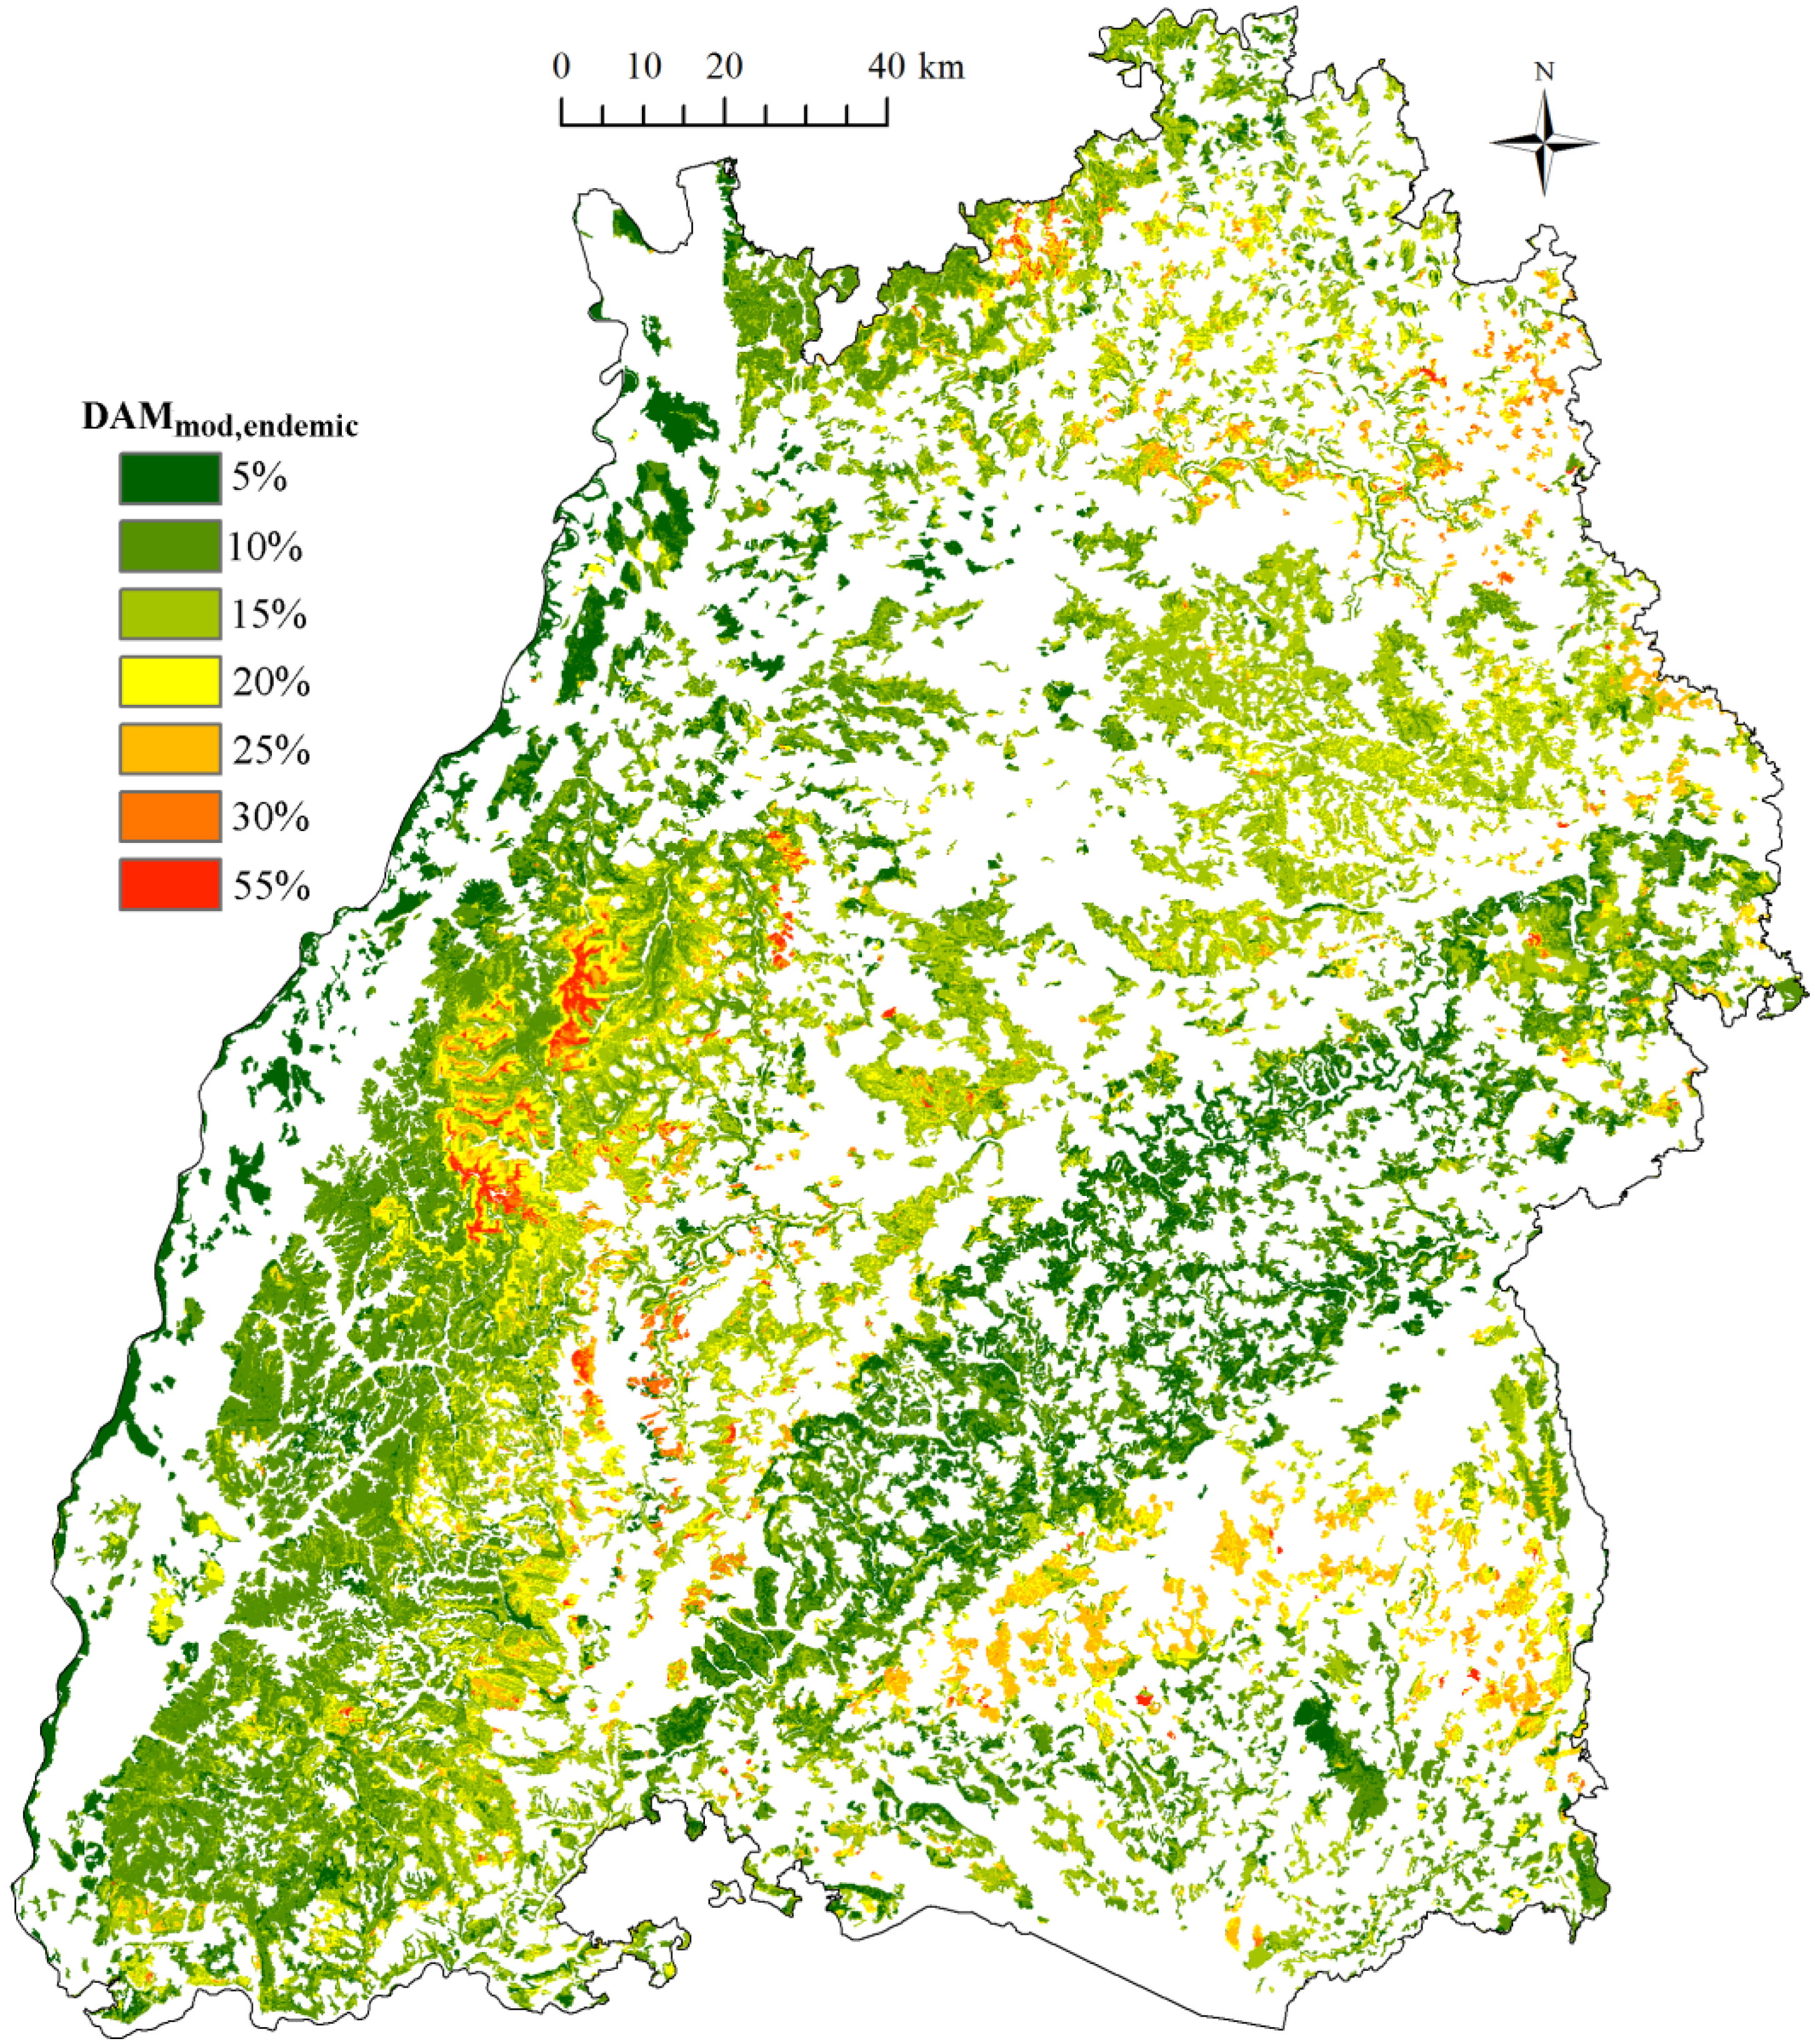
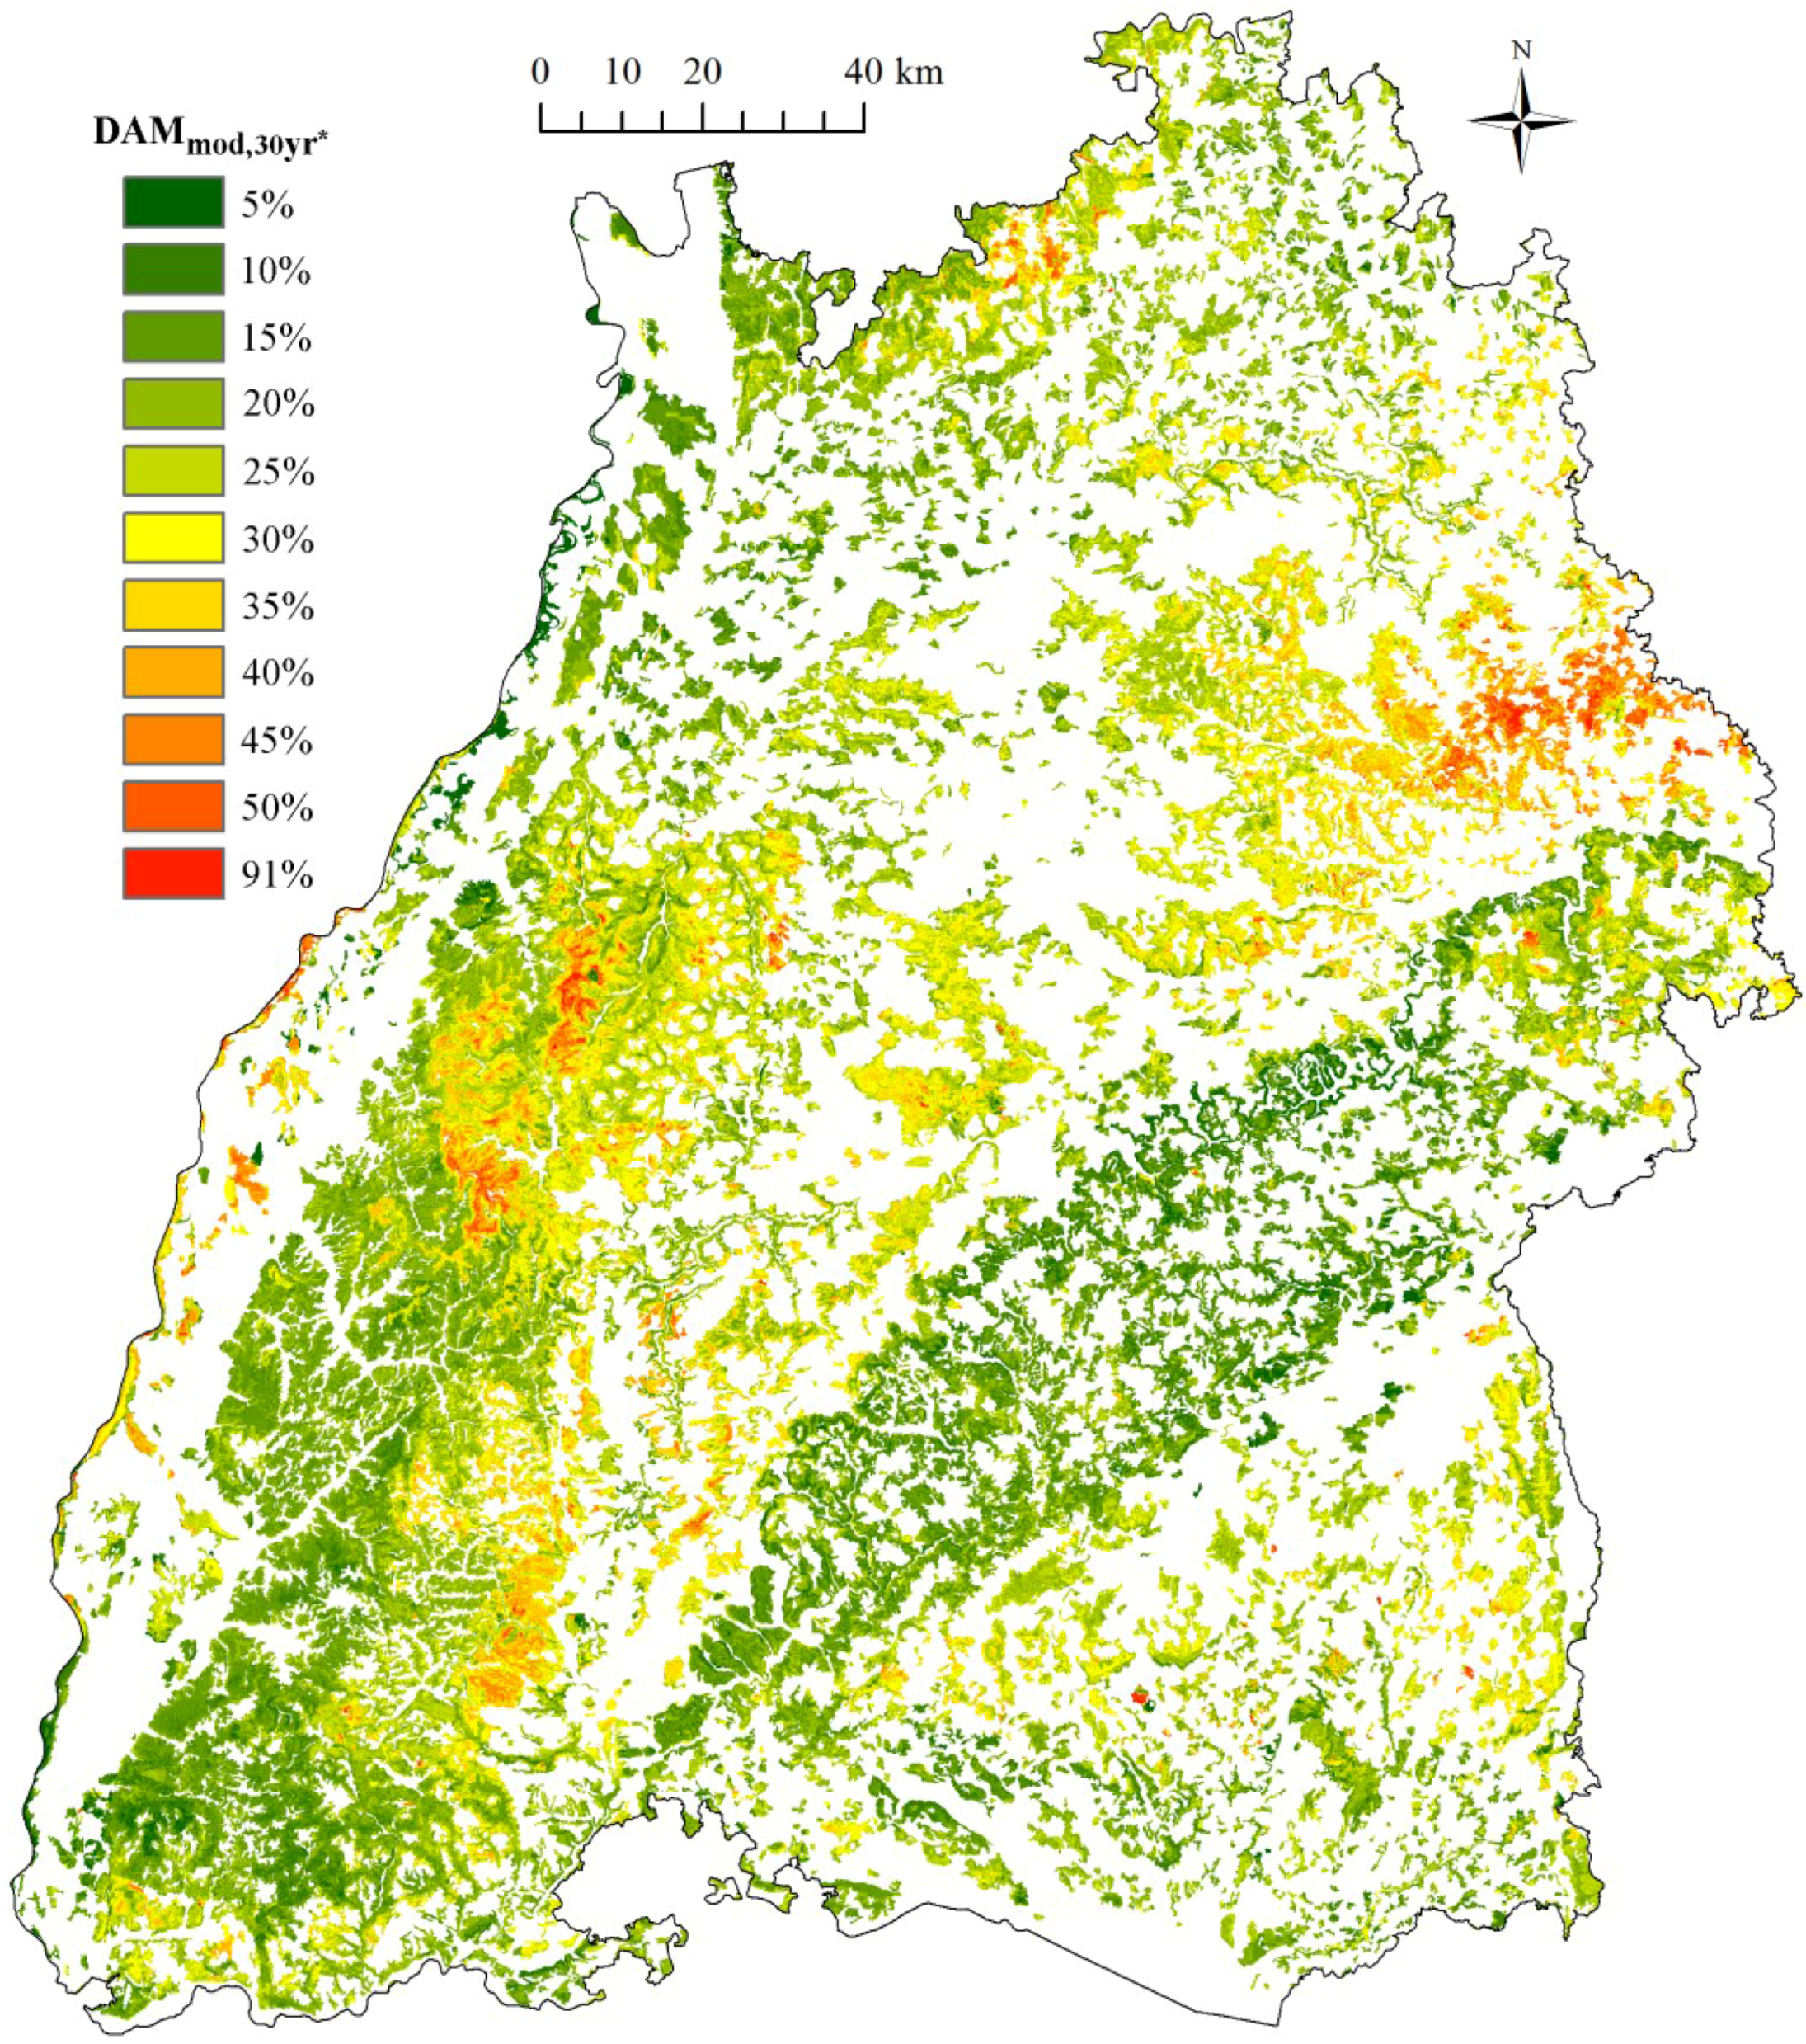
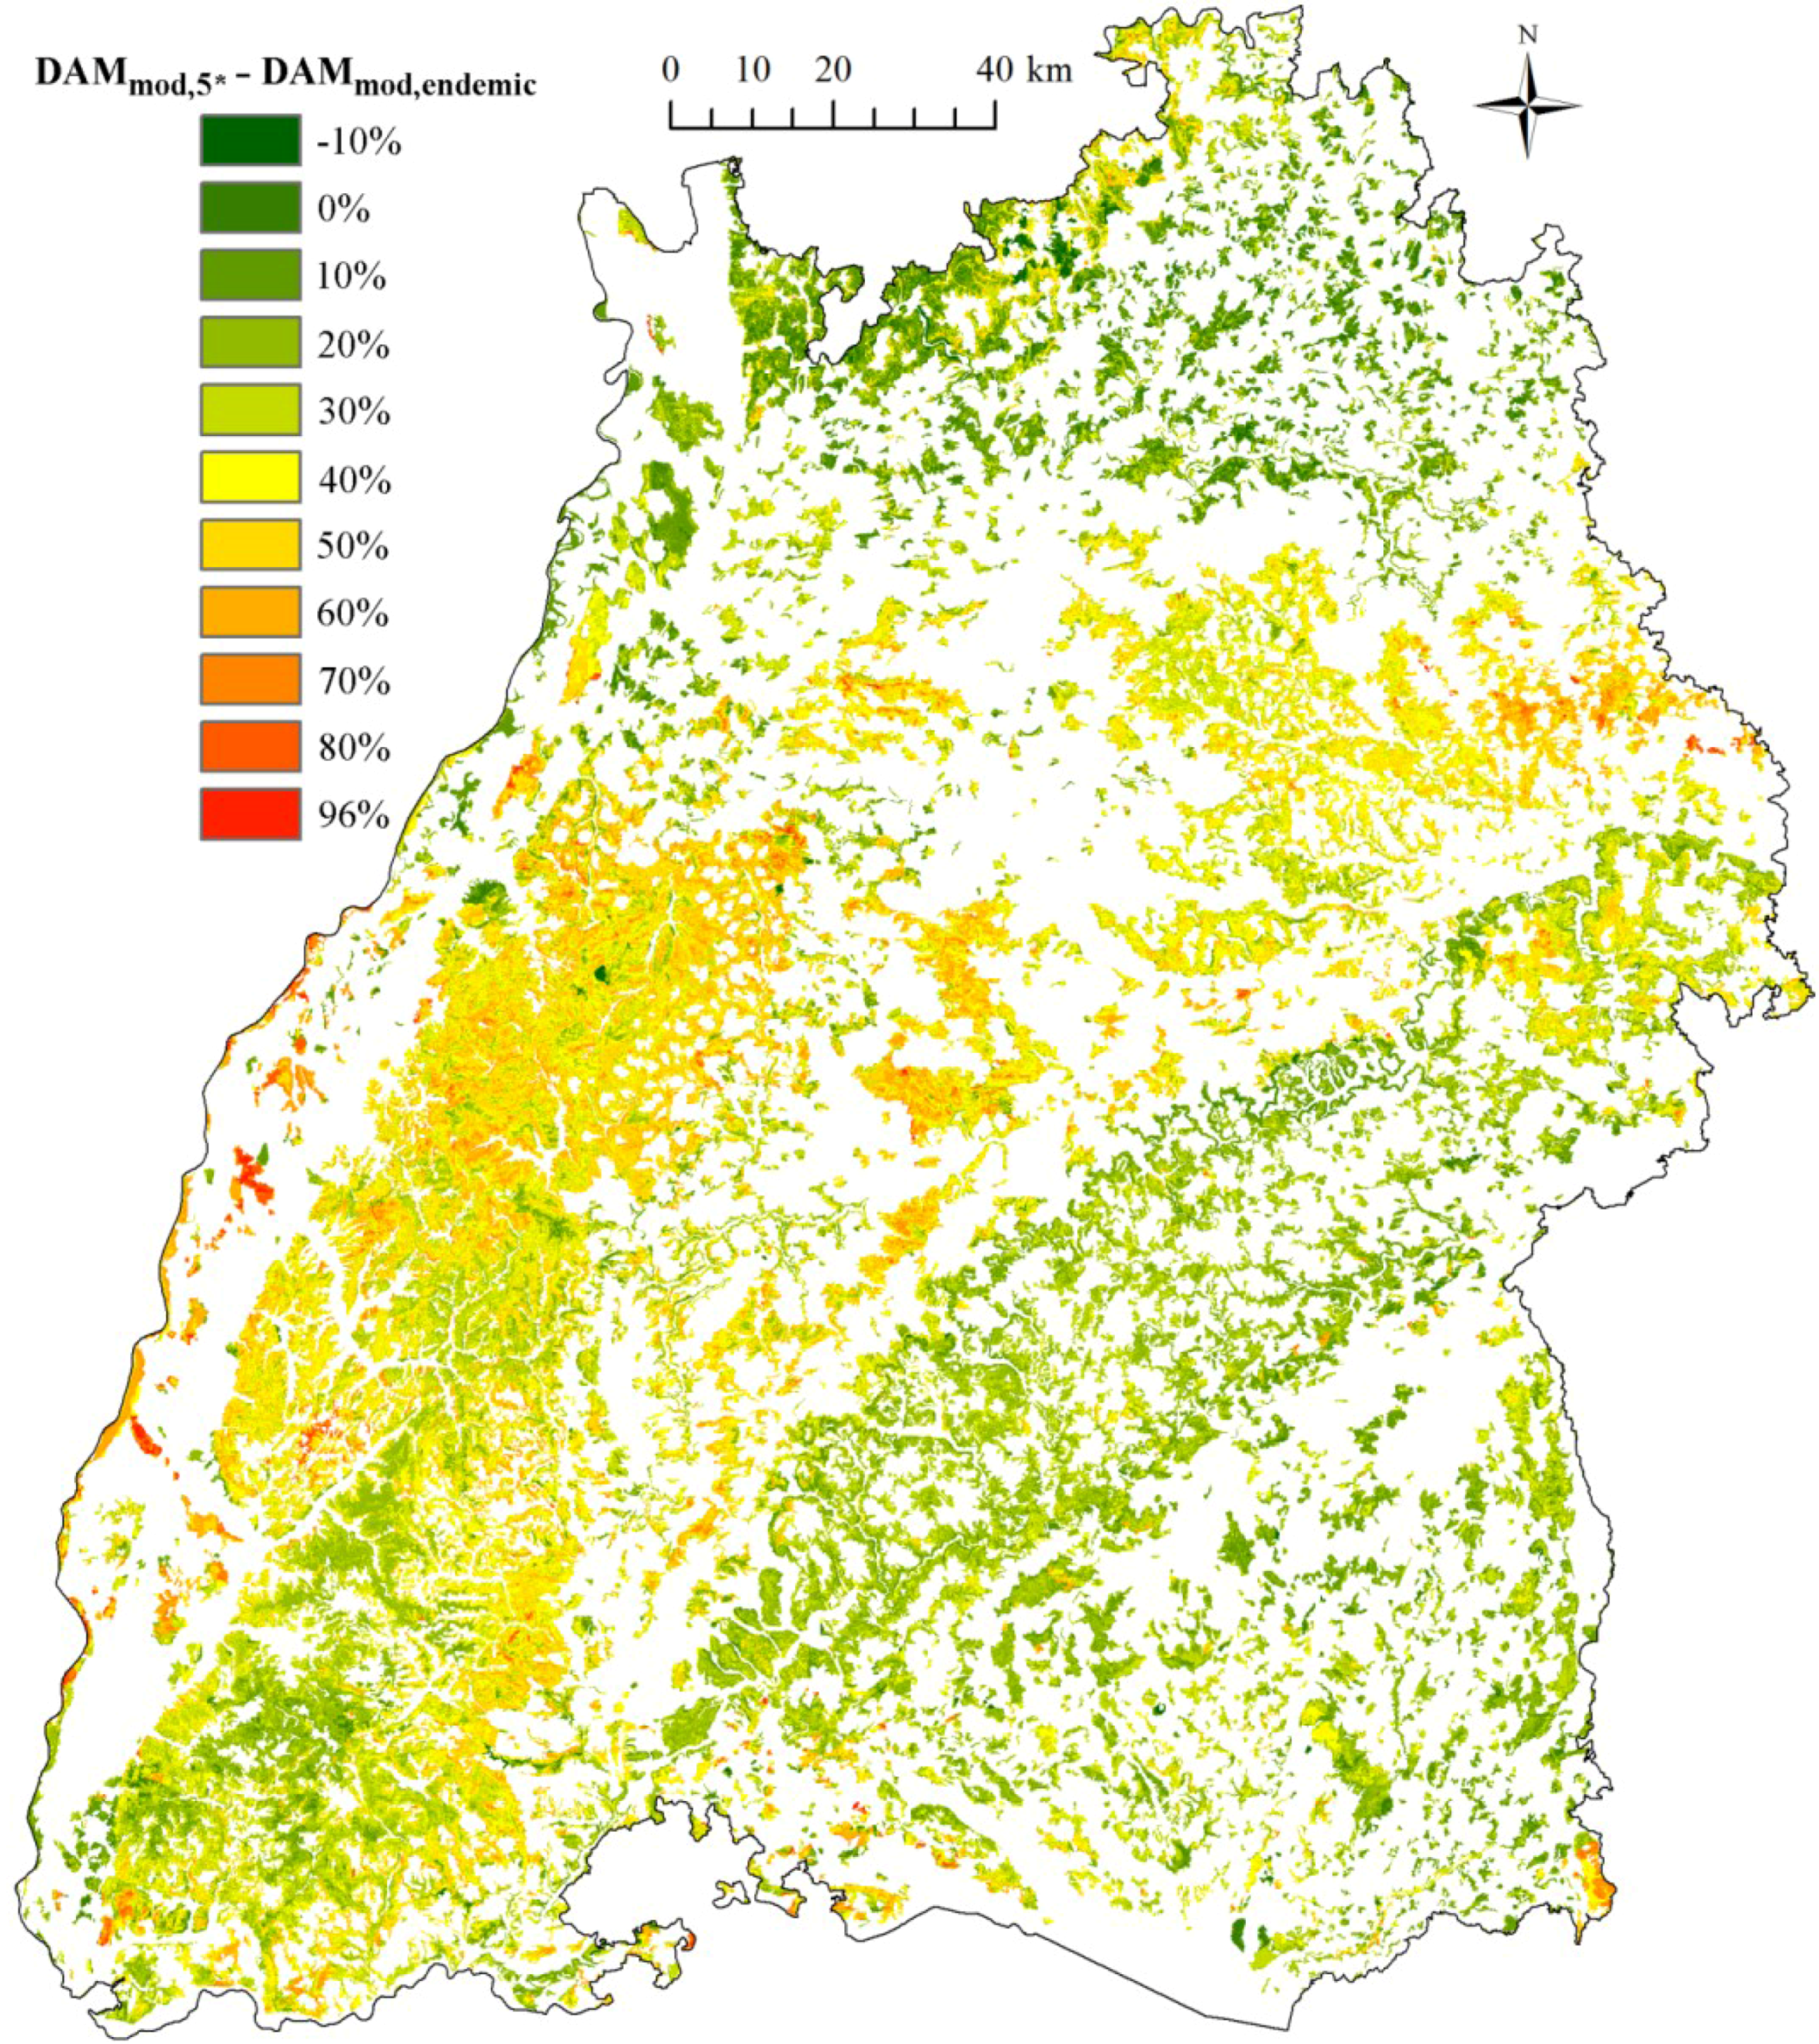
3.3. Mapping of Damage Proportions
| RF-Model Output | |||||||
|---|---|---|---|---|---|---|---|
| DAMOOB,3 | DAMOOB,5 | DAMOOB,endemic | DAMOOB,30yr | DAMOOB,3* | DAMOOB,5* | DAMOOB,30yr* | |
| MSE | 0.08 | 0.10 | 0.01 | 0.02 | 0.07 | 0.07 | 0.01 |
| R2 | 0.25 | 0.22 | 0.28 | 0.30 | 0.36 | 0.41 | 0.53 |


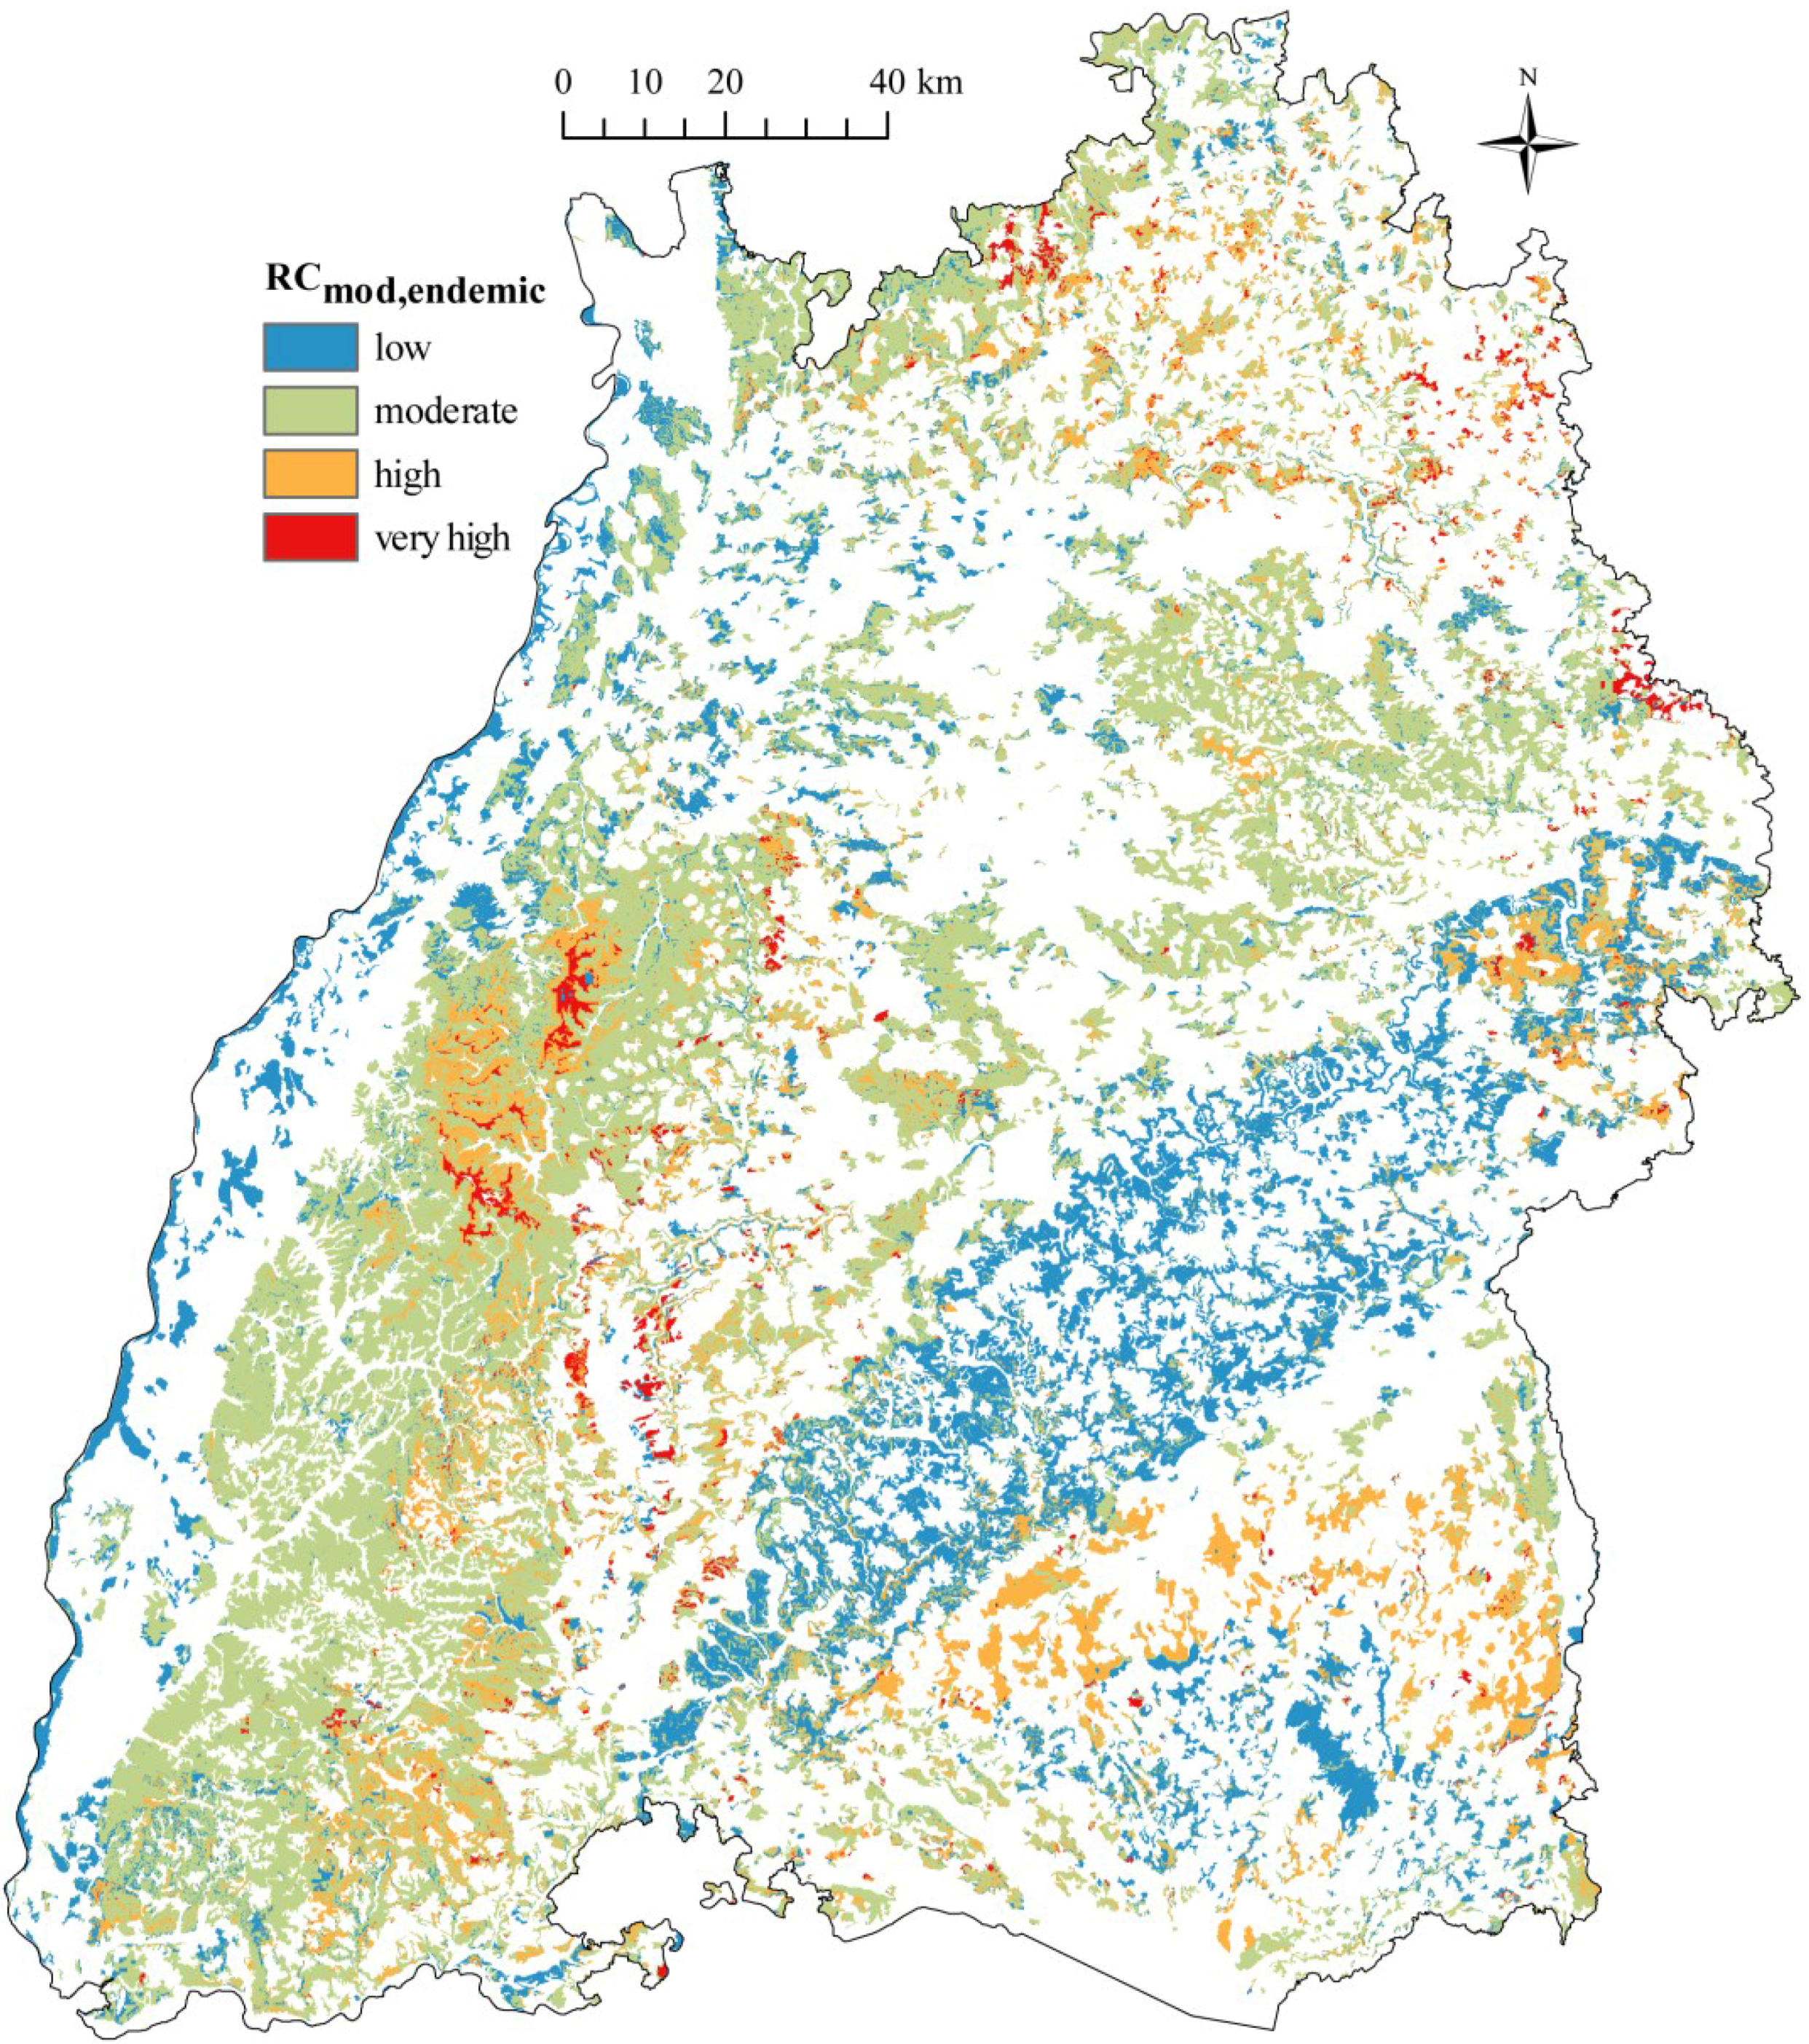
3.4. Mapping of Damage Risk
4. Conclusions
Author Contributions
Conflicts of Interest
Appendix
| Symbols, Acronyms | Description |
| ACID | Soil acidification |
| AUC | Area under curve |
| DAMemp | Empirical proportions of storm-damaged timber |
| DAMemp,30yr | Empirical proportions of storm-damaged timber in the period 1979–2008 |
| DAMemp,endemic | Empirical proportions of endemically storm-damaged timber |
| DAMemp,i | Empirical proportions of storm-damaged timber in Pi |
| DAMmod | Modeled proportions of storm-damaged timber |
| DAMmod,3* | Modeled proportions of storm-damaged timber in P3 with GSWiebke being included in model building |
| DAMmod,30yr | Modeled proportions of storm-damaged timber in the period 1979–2008 |
| DAMmod,30yr* | Modeled proportions of storm-damaged timber in the period 1979–2008 with GSWiebke and GSLothar being included in model building |
| DAMmod,5* | Modeled proportions of storm-damaged timber in P5 with GSLothar being included in model building |
| DAMmod,endemic | Modeled proportions of endemically storm-damaged timber |
| DAMmod,i | Modeled proportions of storm-damaged timber in Pi |
| DAMOOB | OOB samples of modeled proportions of storm-damaged timber |
| DAMOOB,i | OOB samples of modeled proportions of storm-damaged timber in Pi |
| DAMOOB,3* | OOB samples of modeled proportions of storm-damaged timber in P3 with GSWiebke being included in model building |
| DAMOOB,30yr | OOB samples of modeled proportions of storm-damaged timber in the period 1979–2008 |
| DAMmod,30yr* | OOB samples of modeled proportions of storm-damaged timber in the period 1979–2008 with GSWiebke and GSLothar being included in model building |
| DAMOOB,5* | OOB samples of modeled proportions of storm-damaged timber in P5 with GSLothar being included in model building |
| DAMOOB,endemic | OOB samples of modeled proportions of endemically storm-damaged timber |
| DEPTH | Soil depth |
| FOR | Forest type |
| GEOL | Geology |
| GRD | Groundwater affected soils |
| GSstat | Statistical gust speed for a return period of five years |
| GSstat,Dec | Statistical gust speed of December for a return period of five years |
| GSstat,Jan | Statistical gust speed of January for a return period of five years |
| GSLothar | Gust speed of 26 December 1999 |
| GSWiebke | Gust speed of 1 March 1990 |
| MOIST | Soil moisture regime |
| MSE | Mean squared error |
| PCemp,endemic | Empirical probability of endemic storm damage events |
| PCemp,j | Empirical classified storm damage probability: (j = 1, …, 7) |
| PCmod | Modeled storm damage probability in percentages |
| PCmod,j | Modeled classified storm damage probability: (j = 1, …, 7) |
| PCOOB,j | OOB samples of modeled classified storm damage probability: (j = 1, …, 7) |
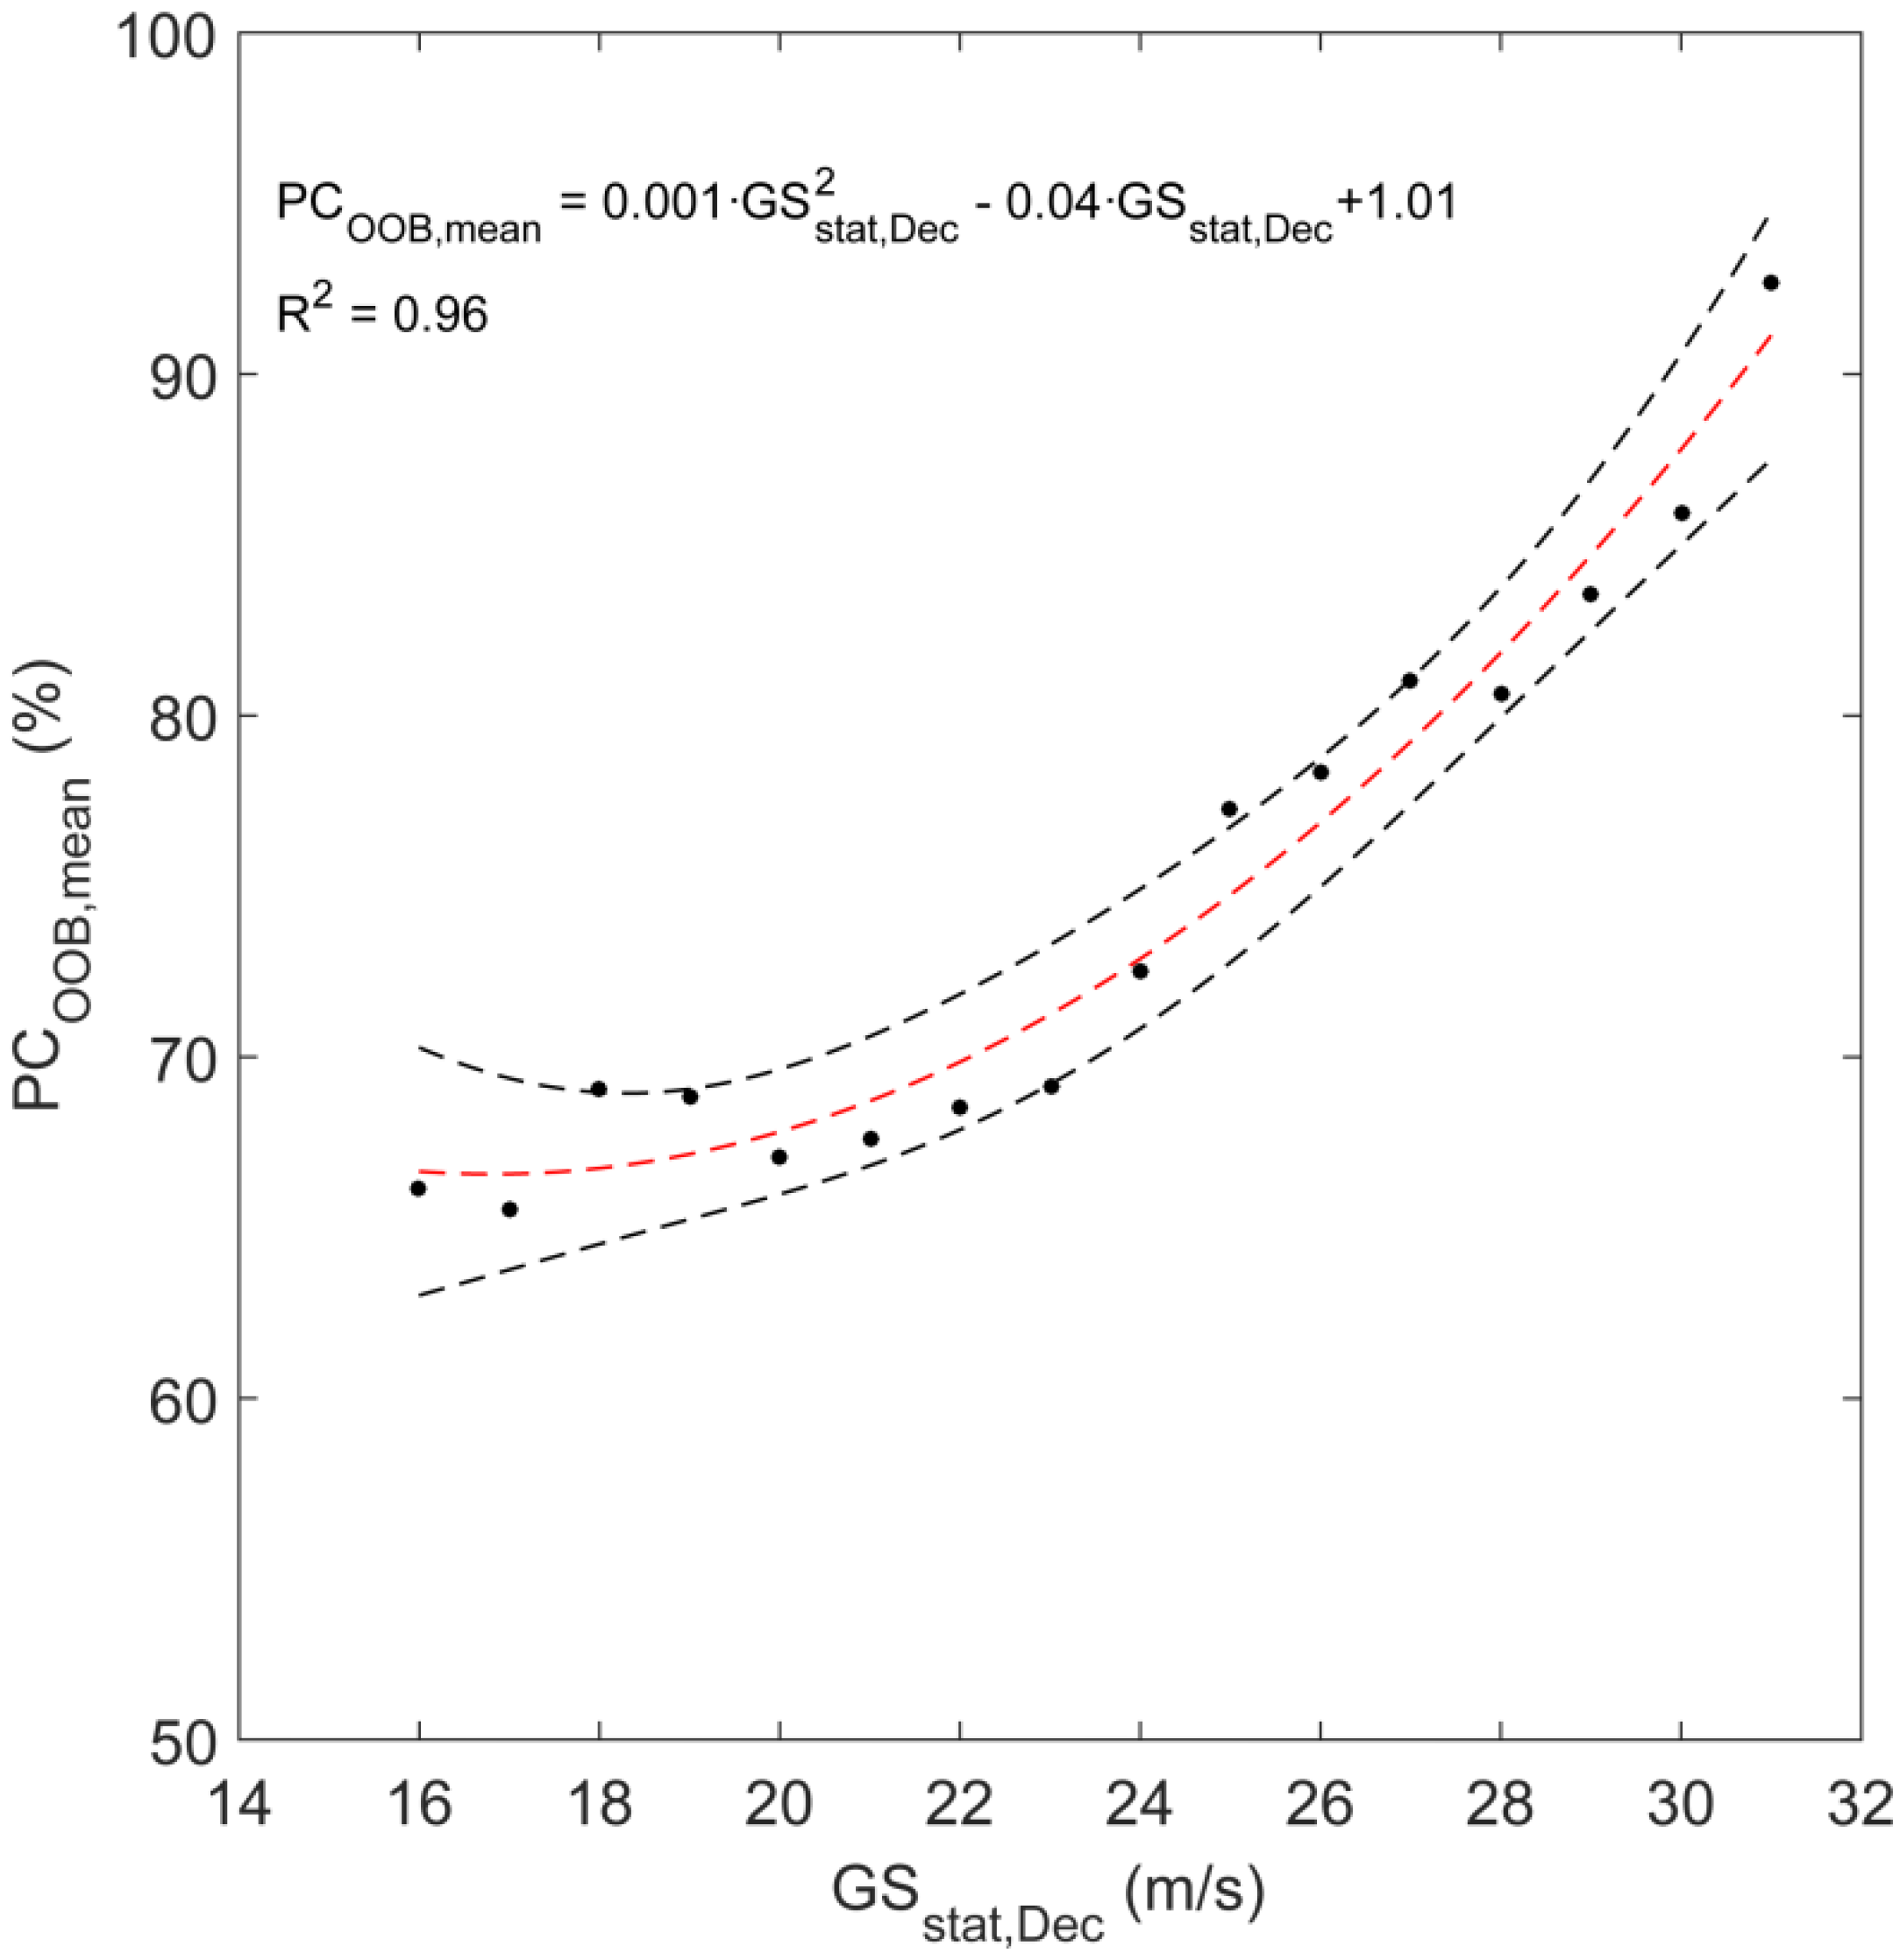
| PCOOB,mean | OOB samples of averaged modeled classified storm damage probability |
| PI | Predictor Importance |
| R2 | Coefficient of determination |
| RCemp,endemic | Empirical endemic storm damage risk |
| RCmod,endemic | Modeled endemic storm damage risk |
| RCOOB,endemic | OOB samples of modeled endemic storm damage risk |
| SL | Slope |
| SOIL | Soil type |
| SUB | Soil substrate |
| Abbreviations | Description |
| OOB | Out-of-bag |
| P30yr | Period from 1979–2008 |
| Pi | Five-year period i: 1979–1983 (P1), 1984–1988 (P2), …, 2004–2008 (P6) |
| RF | Random forests |
| ROC | Receiver operating curve |
References
- Franklin, J.F.; Spies, T.A.; van Pelt, R.; Carey, A.B.; Thornburgh, D.A.; Berg, D.R.; Lindenmayer, D.B.; Harmon, M.E.; Keeton, W.S.; Shaw, D.C.; et al. Disturbances and structural development of natural forest ecosystems with silvicultural implications, using Douglas-Fir forests as an example. For. Ecol. Manag. 2002, 155, 399–423. [Google Scholar] [CrossRef]
- Stueve, K.M.; Perry, C.H.; Nelson, M.D.; Healey, S.P.; Hill, A.D.; Moisen, G.G.; Cohen, W.B.; Gormanson, D.-D.; Huang, C. Ecological importance of intermediate windstorms rivals large, infrequent disturbances in the northern Great Lakes. Ecosphere 2011, 2, 2. [Google Scholar] [CrossRef]
- Albrecht, A.T.; Fortin, M.; Kohnle, U.; Ningre, F. Coupling a tree growth model with storm damage modeling—Conceptual approach and results of scenario simulations. Environ. Model. Softw. 2015, 69, 63–76. [Google Scholar] [CrossRef]
- Schelhaas, M.-J.; Nabuurs, G.-J.; Schuck, A. Natural disturbances in the European forests in the 19th and 20th centuries. Glob. Chang. Biol. 2003, 9, 1620–1633. [Google Scholar] [CrossRef]
- Gardiner, B.; Blennow, K.; Carbus, J.-M.; Fleischer, P.; Ingemarson, F.; Landmann, G.; Lindner, M.; Marzano, M.; Nicoll, B.; Orazio, C.; et al. Destructive Storms in European Forests: Past and Forthcoming Impacts; Final Report to European Commission—DG Environment; European Forest Institute: Joensuu, Finland, 2010; p. 138. [Google Scholar]
- Schüepp, M.; Schiesser, H.H.; Huntrieser, H.; Scherrer, H.U.; Schmidtke, H. The winterstorm “Vivian” of 27 February 1990: About the meteorological development, wind forces and damage situation in the forests of Switzerland. Theor. Appl. Climatol. 1994, 49, 183–200. [Google Scholar] [CrossRef]
- Mayer, H.; Schindler, D. Forstmeteorologische Grundlagen zur Auslösung von Sturmschäden im Wald im Zusammenhang mit dem Orkan “Lothar”. Allg For. Jgdztg 2002, 173, 200–208. (In German) [Google Scholar]
- Fink, A.H.; Brücher, T.; Ermert, V.; Krüger, A.; Pinto, J.G. The European storm Kyrill 2007: Synoptic evolution, meteorological impacts and some considerations with respect to climate change. Nat. Hazards Earth Syst. Sci. 2009, 9, 405–423. [Google Scholar] [CrossRef]
- Kohnle, U.; Gauckler, S.; Risse, F.-J.; Stahl, S. Orkan Lothar im Spiegel von Betriebsinventur und Einschlagsbuchführung: Auswirkungen auf einen Forstbezirk im Randbereich des Sturms. Allg Fors. Wald 2003, 58, 1203–1207. (In German) [Google Scholar]
- WSL (Eidg. Forschungsanstalt für Wald, Schnee und Landschaft), BUWAL (Bundesamt für Umwelt, Wald und Landschaft). Lothar. Der Orkan 1999. Ereignisanalyse. (eds. WSL, Birmensdorf; BUWAL, Bern), 2001. (In German)
- Hartebrodt, C. The impact of storm damage on small-scale forest enterprises in the southwest of Germany. Small Scale For. Econ. Manag. Policy 2004, 3, 203–222. [Google Scholar]
- Pasztor, F.; Matulla, C.; Zuvela-Aloise, M.; Rammer, W.; Lexer, M.J. Developing predictive models of wind damage in Austrian forests. Ann. For. Sci. 2015, 72, 289–301. [Google Scholar] [CrossRef]
- Klopcic, M.; Poljanec, A.; Gartner, A.; Boncina, A. Factors related to natural disturbances in mountain Norway spruce (Picea abies) forests in the Julian Alps. Ecoscience 2009, 16, 48–57. [Google Scholar] [CrossRef]
- Nagel, T.A.; Diaci, J. Intermediate wind disturbance in an old-growth beech-fir forest in southeastern Slovenia. Can. J. For. Res. 2006, 36, 629–638. [Google Scholar] [CrossRef]
- Schindler, D.; Bauhus, J.; Mayer, H. Wind effects on trees. Eur. J. For. Res. 2012, 131, 159–163. [Google Scholar] [CrossRef]
- Mayer, H. Wind-induced tree sway. Trees 1987, 1, 95–106. [Google Scholar] [CrossRef]
- Schindler, D.; Grebhan, K.; Albrecht, A.; Schönborn, J. Modelling the wind damage probability in forests in Southwestern Germany for the 1999 winter storm “Lothar”. Int. J. Biometeorol. 2009, 53, 543–554. [Google Scholar] [CrossRef] [PubMed]
- Albrecht, A.; Hanewinkel, M.; Bauhus, J.; Kohnle, U. How does silviculture affect storm damage in forests of south-western Germany? Results from empirical modeling based on long-term observations. Eur. J. For. Res. 2012, 131, 229–247. [Google Scholar] [CrossRef]
- Schindler, D.; Grebhan, K.; Albrecht, A.; Schönborn, J.; Kohnle, U. GIS-based estimation of the winter storm damage probability in forests: a case study from Baden-Wuerttemberg (Southwest Germany). Int. J. Biometeorol. 2012, 56, 57–69. [Google Scholar] [CrossRef] [PubMed]
- Albrecht, A.; Kohnle, U.; Hanewinkel, M.; Bauhus, J. Storm damage of Douglas fir unexpectedly high compared to Norway spruce. Ann. For. Sci. 2013, 70, 195–207. [Google Scholar] [CrossRef]
- Mitchell, S.J.; Lanquaye-Opoku, N.; Modzelewski, H.; Shen, Y.; Stull, R.; Jackson, P.; Murphy, B.; Ruel, J.-C. Comparison of wind speeds obtained using numerical weather models and topographic exposure indices for predicting windthrow in mountainous terrain. For. Ecol. Manag. 2008, 254, 193–204. [Google Scholar] [CrossRef]
- Mezei, P.; Grodzki, W.; Blaženec, M.; Jakuš, R. Factors influencing the wind-bark beetles’ disturbance system in the course of an Ips typographus outbreak in the Tatra Mountains. For. Ecol. Manag. 2014, 312, 67–77. [Google Scholar] [CrossRef]
- Nilsson, C.; Goyette, S.; Bärring, L. Relating forest damage data to the wind field from high-resolution RCM simulations: Case study of Anatol striking Sweden in December 1999. Glob. Planet. Chang 2007, 57, 161–176. [Google Scholar] [CrossRef]
- Schmidt, M.; Hanewinkel, M.; Kändler, G.; Kublin, E.; Kohnle, U. An inventory-based approach for modeling singletree storm damage—Experiences with the winter storm of 1999 in southwestern Germany. Can. J. For. Res. 2010, 40, 1636–1652. [Google Scholar] [CrossRef]
- Keil, M.; Kiefl, R.; Strunz, G. CORINE Land Cover 2000—Germany; Final Report; German Aerospace Center, German Remote Sensing Data Center: Wessling, Germany, 2005; p. 72. [Google Scholar]
- Jung, C.; Schindler, D. Statistical Modeling of near-surface wind speed: A case study from Baden-Wuerttemberg (Southwest Germany). Austin J. Earth Sci. 2015, 2, 1–11. [Google Scholar]
- Jung, C.; Schindler, D. Modelling monthly near-surface maximum daily gust speed distributions in Southwest Germany. Int. J. Climatol. 2016. accepted. [Google Scholar]
- Belsley, D.A.; Kuh, E.; Welsh, R.E. Regression Diagnostics; John Wiley & Sons: New York, NY, USA, 2001. [Google Scholar]
- Genuer, R.; Poggi, J.-M.; Tuleau-Malot, C. Variable selection using random forests. Pattern Recogn. Lett. 2010, 31, 2225–2236. [Google Scholar] [CrossRef]
- Breiman, L. Bagging predictors. Mach. Learn. 1996, 26, 123–140. [Google Scholar] [CrossRef]
- Prasad, A.-M.; Iverson, L.-R.; Liaw, A. Newer classification and regression tree techniques: Bagging and random forests for ecological prediction. Ecosystems 2006, 9, 181–199. [Google Scholar] [CrossRef]
- De’ath, G.; Fabricius, K.E. Classification and regression trees: a powerful yet simple technique for ecological data analysis. Ecology 2000, 81, 3178–3192. [Google Scholar] [CrossRef]
- Dietterich, T.G. An experimental comparison of three methods for constructing ensembles of decision trees: Bagging, boosting, and randomization. Mach. Learn. 2000, 40, 139–158. [Google Scholar] [CrossRef]
- Khoshgoftaar, T.M.; Xiao, Y.; Gao, K. Software quality assessment using a multi-strategy classifier. Inform. Sci. 2011, 41, 552–568. [Google Scholar] [CrossRef]
- Svetnik, V.; Liaw, A.; Tong, D.; Culberson, J.C.; Sheridan, R.P.; Feuston, B.P. Random Forest: A classification and regression tool for compound classification and QSAR modeling. J. Chem. Inf. Comput. Sci. 2003, 43, 1947–1958. [Google Scholar] [CrossRef] [PubMed]
- Zweig, M.H.; Campbell, G. Receiver-Operating Characteristic (ROC) plots: A fundamental evaluation tool in clinical medicine. Clin. Chem. 1993, 39, 561–577. [Google Scholar] [PubMed]
- Baker, S.G.; Kramer, B.S. Peirce, Youden, and Receiver Operating Characteristic curves. Am. Stat. 2007, 61, 343–346. [Google Scholar] [CrossRef]
- Breiman, L. Random forests. Mach. Learn. 2001, 45, 5–32. [Google Scholar] [CrossRef]
- Gislason, P.O.; Benediktsson, J.A.; Sveinsson, J.R. Random forests for land cover classification. Pattern Recogn. Lett. 2006, 27, 294–300. [Google Scholar] [CrossRef]
- Jiang, P.; Wu, H.; Wang, W.; Ma, W.; Sun, X.; Lu, Z. MiPred: classification of real and pseudo microRNA precursors using random forest prediction model with combined features. Nucleic Acids Res. 2007, 35, 339–344. [Google Scholar] [CrossRef] [PubMed]
- Ni, H.; Chen, A.; Chen, N. Some extensions on risk matrix approach. Saf. Sci. 2010, 48, 1269–1278. [Google Scholar] [CrossRef]
- Schmid-Haas, P.; Bachofen, H. Die Sturmgefährdung von Einzelbäumen und Beständen. Schweiz. Z. Forstwes. 1991, 6, 477–504. (In German) [Google Scholar]
- Aldinger, E.; Seemann, D.; Konnert, V. Wurzeluntersuchungen auf Sturmwurfflächen 1990 in Baden-Württemberg. Mitt. Ver. For. Standortskunde u. Forstpflanzenzüchtung 1996, 38, 11–24. (In German) [Google Scholar]
- Fuhrer, J.; Beniston, M.; Fischlin, A.; Frei, Ch.; Goyette, S.; Jasper, K.; Pfister, Ch. Climate risks and their impact on agriculture and forests in Switzerland. Clim. Chang. 2006, 79, 79–102. [Google Scholar] [CrossRef]
- Usbeck, T.; Wohlgemuth, T.; Dobbertin, M.; Pfister, C.; Bürgi, A.; Rebetez, M. Increasing storm damage to forests in Switzerland from 1858 to 2007. Agric. For. Meteorol. 2010, 150, 47–55. [Google Scholar] [CrossRef]
- Mayer, P.; Brang, P.; Dobbertin, M.; Hallenbarter, D.; Renaud, J.-P.; Walthert, L.; Zimmermann, S. Forest storm damage is more frequent on acidic soils. Annu. For. Sci. 2005, 62, 303–311. [Google Scholar] [CrossRef]
- Valinger, E.; Fridman, J. Factors affecting the probability of windthrow at stand level as a result of Gudrun winter storm in southern Sweden. For. Ecol. Manag. 2011, 262, 398–403. [Google Scholar] [CrossRef]
- Hanewinkel, M.; Albrecht, A.; Schmidt, M. Influence of Stand Characteristics and Landscape Structure on Wind Damage. In What Science Can Tell Us. Living with Storm Damage to Forests; Gardiner, B., Schuck, A., Schelhaas, M.-J., Orazio, C., Blennow, K., Nicoll, B., Eds.; European Forest Institute: Joensuu, Finland, 2013; pp. 39–45. [Google Scholar]
- Klaus, M.; Holsten, A.; Hostert, P.; Kropp, J. Integrated methodology to assess windthrow impacts on forest stands under climate change. For. Ecol. Manag. 2011, 261, 1799–1810. [Google Scholar] [CrossRef]
- De Langre, E. Effects of Wind on Plants. Annu. Rev. Fluid Mech. 2008, 40, 141–168. [Google Scholar] [CrossRef]
- Nicoll, B.; Ray, D. Adaptive growth of tree root systems in response to wind action and site conditions. Tree Physiol. 1996, 16, 891–898. [Google Scholar] [CrossRef] [PubMed]
- Wilson, J. Vulnerability to wind damage in managed landscapes of the coastal Pacific Northwest. For. Ecol. Manag. 2004, 191, 341–351. [Google Scholar] [CrossRef]
- Nicoll, B.; Gardiner, B.; Peace, A.J. Improvements in anchorage provided by the acclimation of forest trees to wind stress. Forestry 2008, 81, 389–398. [Google Scholar] [CrossRef]
- Mitchell, S.J. Wind as a natural disturbance agent in forests: a synthesis. Forestry 2013, 86, 147–157. [Google Scholar] [CrossRef]
- Heneka, P.; Hofherr, T.; Ruck, B.; Kottmeier, C. Winter storm risk of residential structures—Model development and application to the German state of Baden-Württemberg. Nat. Hazards Earth Syst. Sci. 2006, 6, 721–733. [Google Scholar] [CrossRef]
- Schütz, J.-P.; Götz, M.; Schmid, W.; Mandallaz, D. Vulnerability of spruce (Picea abies) and beech (Fagus sylvatica) forest stands to storms and consequences for silviculture. Eur. J. For. Res. 2006, 125, 291–302. [Google Scholar] [CrossRef]
- Hanewinkel, M.; Breidenbach, J.; Neef, T.; Kublin, E. 77 years of natural disturbances in a mountain forest area—The influence of storm, snow and insect damage analysed with a long-term time series. Can. J. For. Res. 2008, 38, 2249–2261. [Google Scholar] [CrossRef]
- Hagen, M.; Bartenschlager, B.; Finke, U. Motion characteristics of thunderstorms in southern Germany. Meteorol. Appl. 1999, 6, 227–239. [Google Scholar] [CrossRef]
- Kunz, M. The skill of convective parameters and indices to predict isolated and severe thunderstorms. Nat. Hazards Earth Syst. Sci. 2007, 7, 327–342. [Google Scholar] [CrossRef]
- Kunz, M.; Sander, J.; Kottmeier, C.-H. Recent trends of thunderstorm and hailstorm frequency and their relation to atmospheric characteristics in southwest Germany. Int. J. Climatol. 2009, 29, 2283–2297. [Google Scholar] [CrossRef]
© 2016 by the authors; licensee MDPI, Basel, Switzerland. This article is an open access article distributed under the terms and conditions of the Creative Commons by Attribution (CC-BY) license (http://creativecommons.org/licenses/by/4.0/).
Share and Cite
Jung, C.; Schindler, D.; Albrecht, A.T.; Buchholz, A. The Role of Highly-Resolved Gust Speed in Simulations of Storm Damage in Forests at the Landscape Scale: A Case Study from Southwest Germany. Atmosphere 2016, 7, 7. https://doi.org/10.3390/atmos7010007
Jung C, Schindler D, Albrecht AT, Buchholz A. The Role of Highly-Resolved Gust Speed in Simulations of Storm Damage in Forests at the Landscape Scale: A Case Study from Southwest Germany. Atmosphere. 2016; 7(1):7. https://doi.org/10.3390/atmos7010007
Chicago/Turabian StyleJung, Christopher, Dirk Schindler, Axel Tim Albrecht, and Alexander Buchholz. 2016. "The Role of Highly-Resolved Gust Speed in Simulations of Storm Damage in Forests at the Landscape Scale: A Case Study from Southwest Germany" Atmosphere 7, no. 1: 7. https://doi.org/10.3390/atmos7010007