Article

Variation Characteristics of Rainfall in the Pre-Flood Season of South China and Its Correlation with Sea Surface Temperature of Pacific

1
Key Laboratory of Meteorological Disaster of Ministry of Education, Nanjing University of Information Science and Technology, 219 Ningliu Road, Nanjing 210044, China
2
School of Atmospheric Science, Nanjing University of Information Science and Technology, 219 Ningliu Road, Nanjing 210044, China
3
School of Atmopshere Physics, Nanjing University of Information Science and Technology, 219 Ningliu Road, Nanjing 210044, China
*
Author to whom correspondence should be addressed.
Atmosphere 2016, 7(1), 5; https://doi.org/10.3390/atmos7010005
Submission received: 12 November 2015 / Revised: 13 December 2015 / Accepted: 25 December 2015 / Published: 31 December 2015

Abstract

:
The characteristics of rainfall variation in the pre-flood season of South China (PFSSC) and its correlation with the sea surface temperature (SST) of the Pacific are studied in this paper. The results show that in the last 50 years, rainfall in PFSSC clearly has interannual and interdecadal oscillations, primarily in the 4a and 8a cycles. Interannual correlation analysis indicate that the rainfall in PFSSC displays a significantly negative correlation with the SST of the warm pool region in January–March and April–June. The interdecadal correlation analysis reveals that the rainfall in PFSSC is negatively correlated to the SST of the warm pool region, but has a significant positive interdecadal correlation with the Middle Eastern Pacific Ocean. For NINO1 + 2 and NINO3 regions, when the background ocean temperature is warm, the SST is significantly positively correlated to the rainfall in PFSSC; however, when the background ocean temperature is cold, there is no significant correlation between the two, even the correlation coefficients are negative. For the warm pool region, the SST demonstrates a significantly negative correlation to the rainfall in PFSSC, which is not dependent on the background SST. It is a remarkable fact that under the different SST backgrounds, the interannual variation of SST will bring different atmospheric response, and it is the reason that under the warm SST background, the correlation is more significant between the SST in tropical Pacific and the rainfall in PFSSC. Under the background of global warming, more attention should be given to study the rainfall in PFSSC and its correlation with the SST in the eastern tropical Pacific.

1. Introduction

South China, which usually includes Guangdong, Guangxi, Fujian, and Hainan, is the most prolific area of precipitation in China [1]. The precipitation is concentrated from April to September every year, in which April to June is the first rainy season and named the pre-flood season. Rainfall in the pre-flood season in South China (PFSSC) is approximately 50% of the annual average or much higher [2]; this is the time when South China regions have frequent droughts and floods. Therefore, the study and analysis of the characteristics of floods and droughts in PFSSC are very significant. Herein, the variations of drought and rainfall characteristics in the South China pre-flood season have been studied and results have been obtained. Ding et al. [3] analyzed and determined that the rainfall and rainy days in PFSSC have significant interannual variation, in oscillation cycles of 2 years, 3 to 5 years and 6 to 8 years. Ma et al. [4] used the monthly precipitation data from 16 stations in South China from the National Climate Center in 1951–2000 to analyze the spatial characteristics of interannual and interdecadal changes for the pre-flood season rainfall in South China. Overall, the elements of the rainfall in PFSSC, i.e., the pre-flood season rainfall, start and end dates of the rainy season, among other factors, and the climate characteristics were studied in detail [5,6]. There are also many studies on the factors that affect the rainfall in PFSSC. Wu et al. [7] believed that the rainfall in PFSSC is primarily affected by large-scale, westerly frontal systems that provide four typical fields of precipitation and help to forecast the flooding trends in different regions. Xin et al. [8] analyzed the low-frequency characteristics of abnormal precipitation and atmospheric low-frequency oscillations in the flood season of South China in 1997. Huang et al. [9] suggested that the Western Pacific subtropical high pressure and the abnormal wind of Northeast of Lake Baikal as well as the central Southern Indian Ocean are important factors that affect early flooding in the pre-flood season. In addition, they established a tool for flood and drought forecasts in the pre-flood season. Chen et al. [10] suggested that frontals in mesoscale convective systems provide the triggering mechanism of convective motion and a complex interaction may be involved between them. The convective activity of the cold front in PFSSC has a unique vertical structure. Huang et al. [11] indicated that there is a close relationship between rainfall and geopotential height in PFSSC. Ma et al. [12] discovered that the rainfall in PFSSC is well correlated with the ocean temperature in analyses using the SVD (Singular Value Decomposition) method. Chen et al. [13] used numerical simulations to reveal the impact of ocean temperature anomalies in warm pool region on the rainfall in PFSSC.
This study, based on previous work, analyzes the variations in the characteristics of the interannual and interdecadal rainfall in PFSSC over the last 50 years. It explores the correlation between the pre-flood season rainfall in South China and the sea surface temperature of the Pacific Ocean in the early period (January–March) and in April–June, and the interdecadal variability of the relationships in different SST backgrounds. In addition, the impact of the SST variation compared to the rainfall in the pre-flood season is discussed for the key sea regions of the tropical Pacific Ocean in the January–March, and April–June.

2. Data and Methods

This study uses observation precipitation data from more than 700 stations, and selects precipitation data from 71 stations in South china, which have better continuity. These 71 stations are relatively even in distribution across South China (Figure 1). The time period is 1959–2008. The ocean temperature data utilized are from the GISST monthly average ocean temperature from January 1959 to December 2008.
Figure 1. Distribution of representative stations in South China (Fujian Province, Guangdong Province, Guangxi Autonomous Region, Hainan Province).
Atmosphere 07 00005 g001
In order to study the interdecadal variation, the moving average method is used to filter the interannual signal. The moving average is as follow:
x ¯ ( t 0 ) = 1 2 × N + 1 t 0 N t 0 + N x ( t )
where x ¯ ( t 0 ) is the moving average sequence of the original data x(t). Generally, N = 5, the size of the sliding window is 2 × N + 1 = 11, then the interannual signal can be filtered.
To consider the related decadal variation, this paper used a sliding correlation for analysis [14]. The formula for sliding correlation coefficient is as follow:
r x , y ( t 0 ) = t 0 N t 0 + N [ x ( t ) x ¯ ( t 0 ) ] [ y ( t ) y ¯ ( t 0 ) ] t 0 N t 0 + N [ x ( t ) x ¯ ( t 0 ) ] 2 t 0 N t 0 + N [ y ( t ) y ¯ ( t 0 ) ] 2
As for the correlation analysis, less samples mean larger random errors, and the results are not credible. Therefore, we set N = 10 for sliding correlation, the size of sliding window is 2 × N + 1 = 11, x(t), y(t) is the original data sequence and x ¯ ( t 0 ) , y ¯ ( t 0 ) are the moving average sequences of the original data.

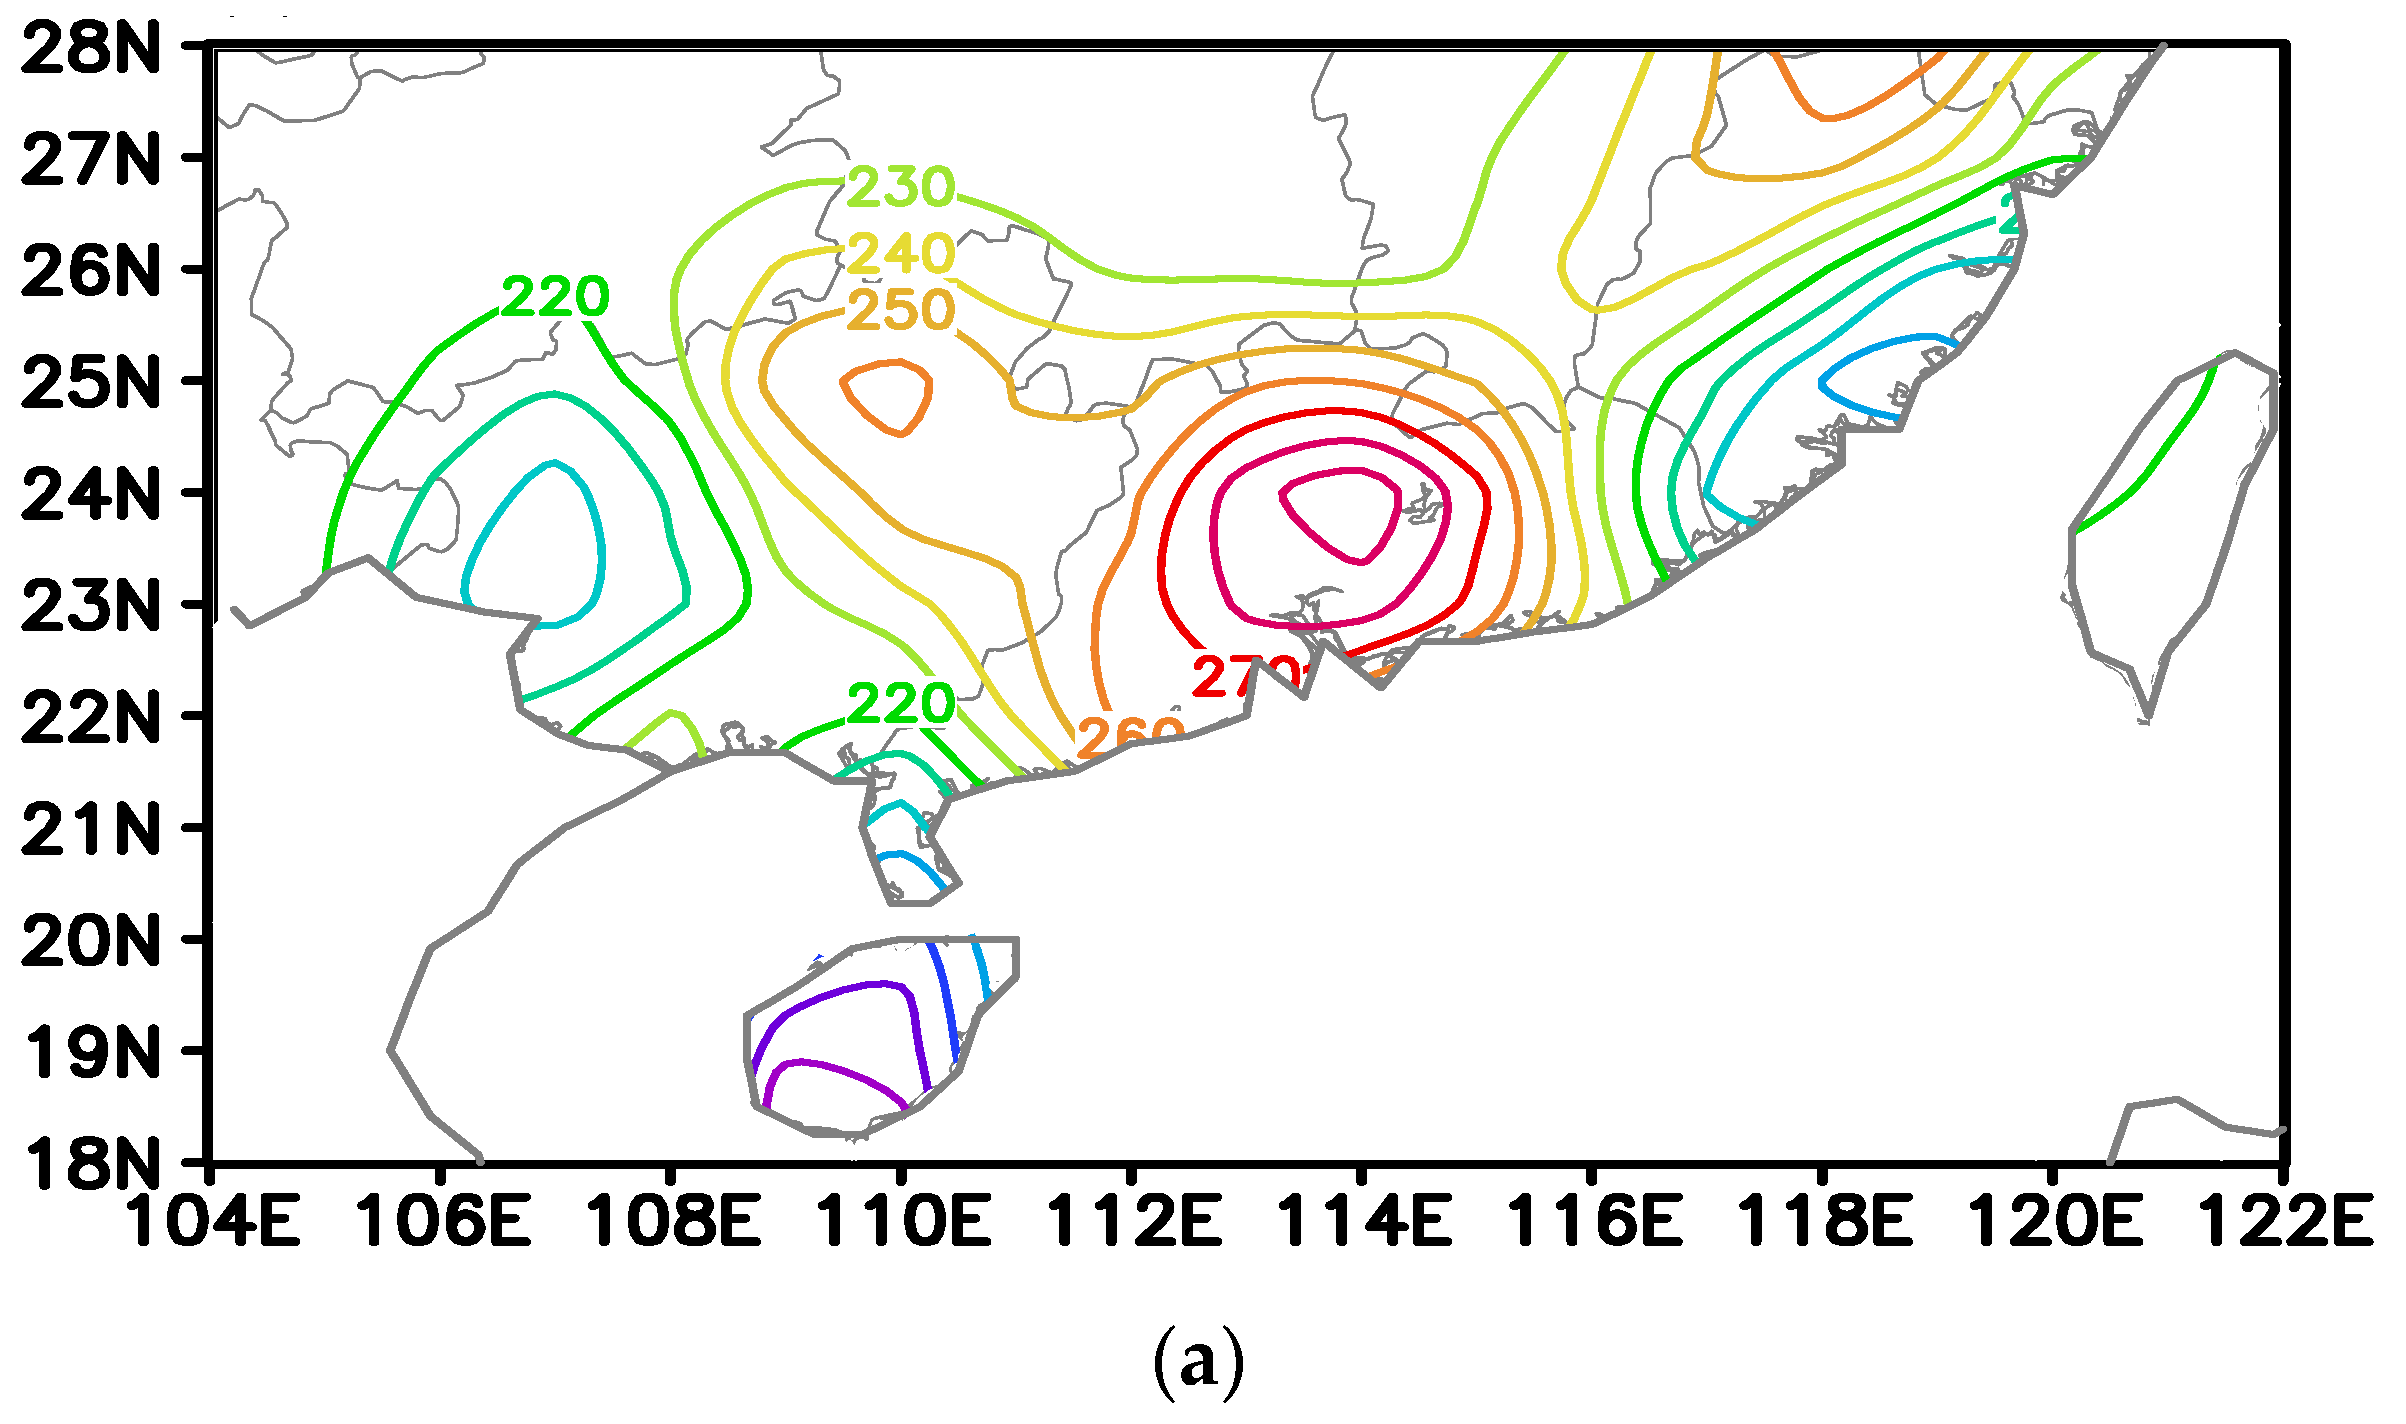
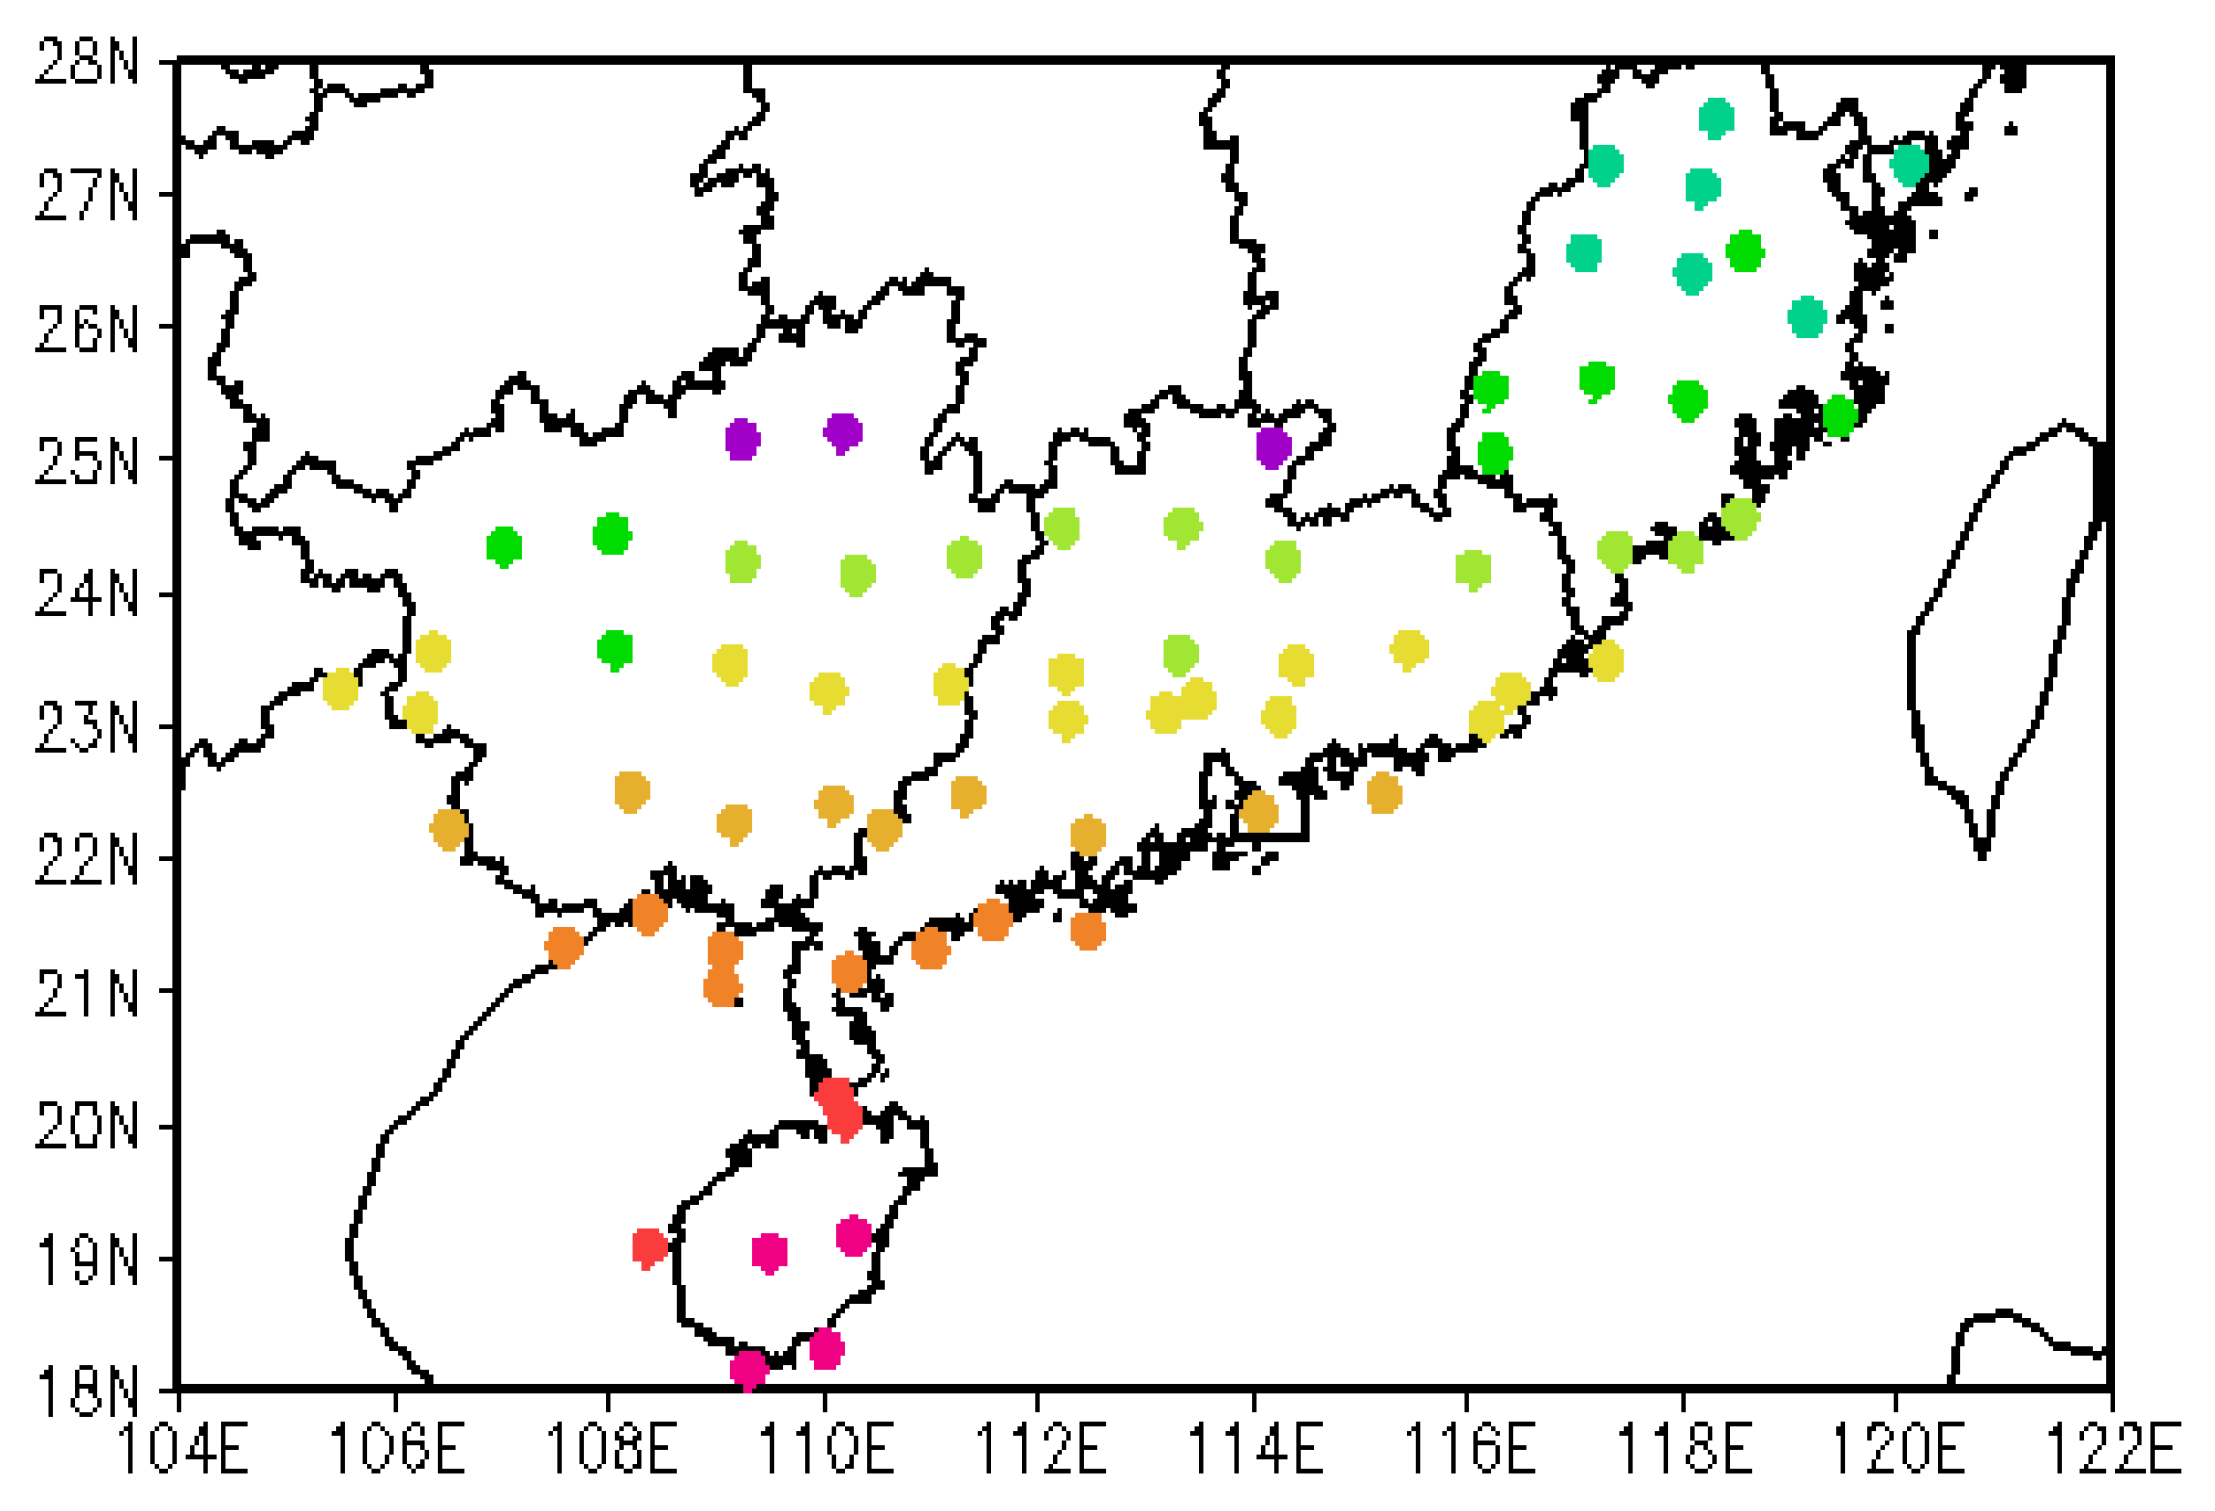
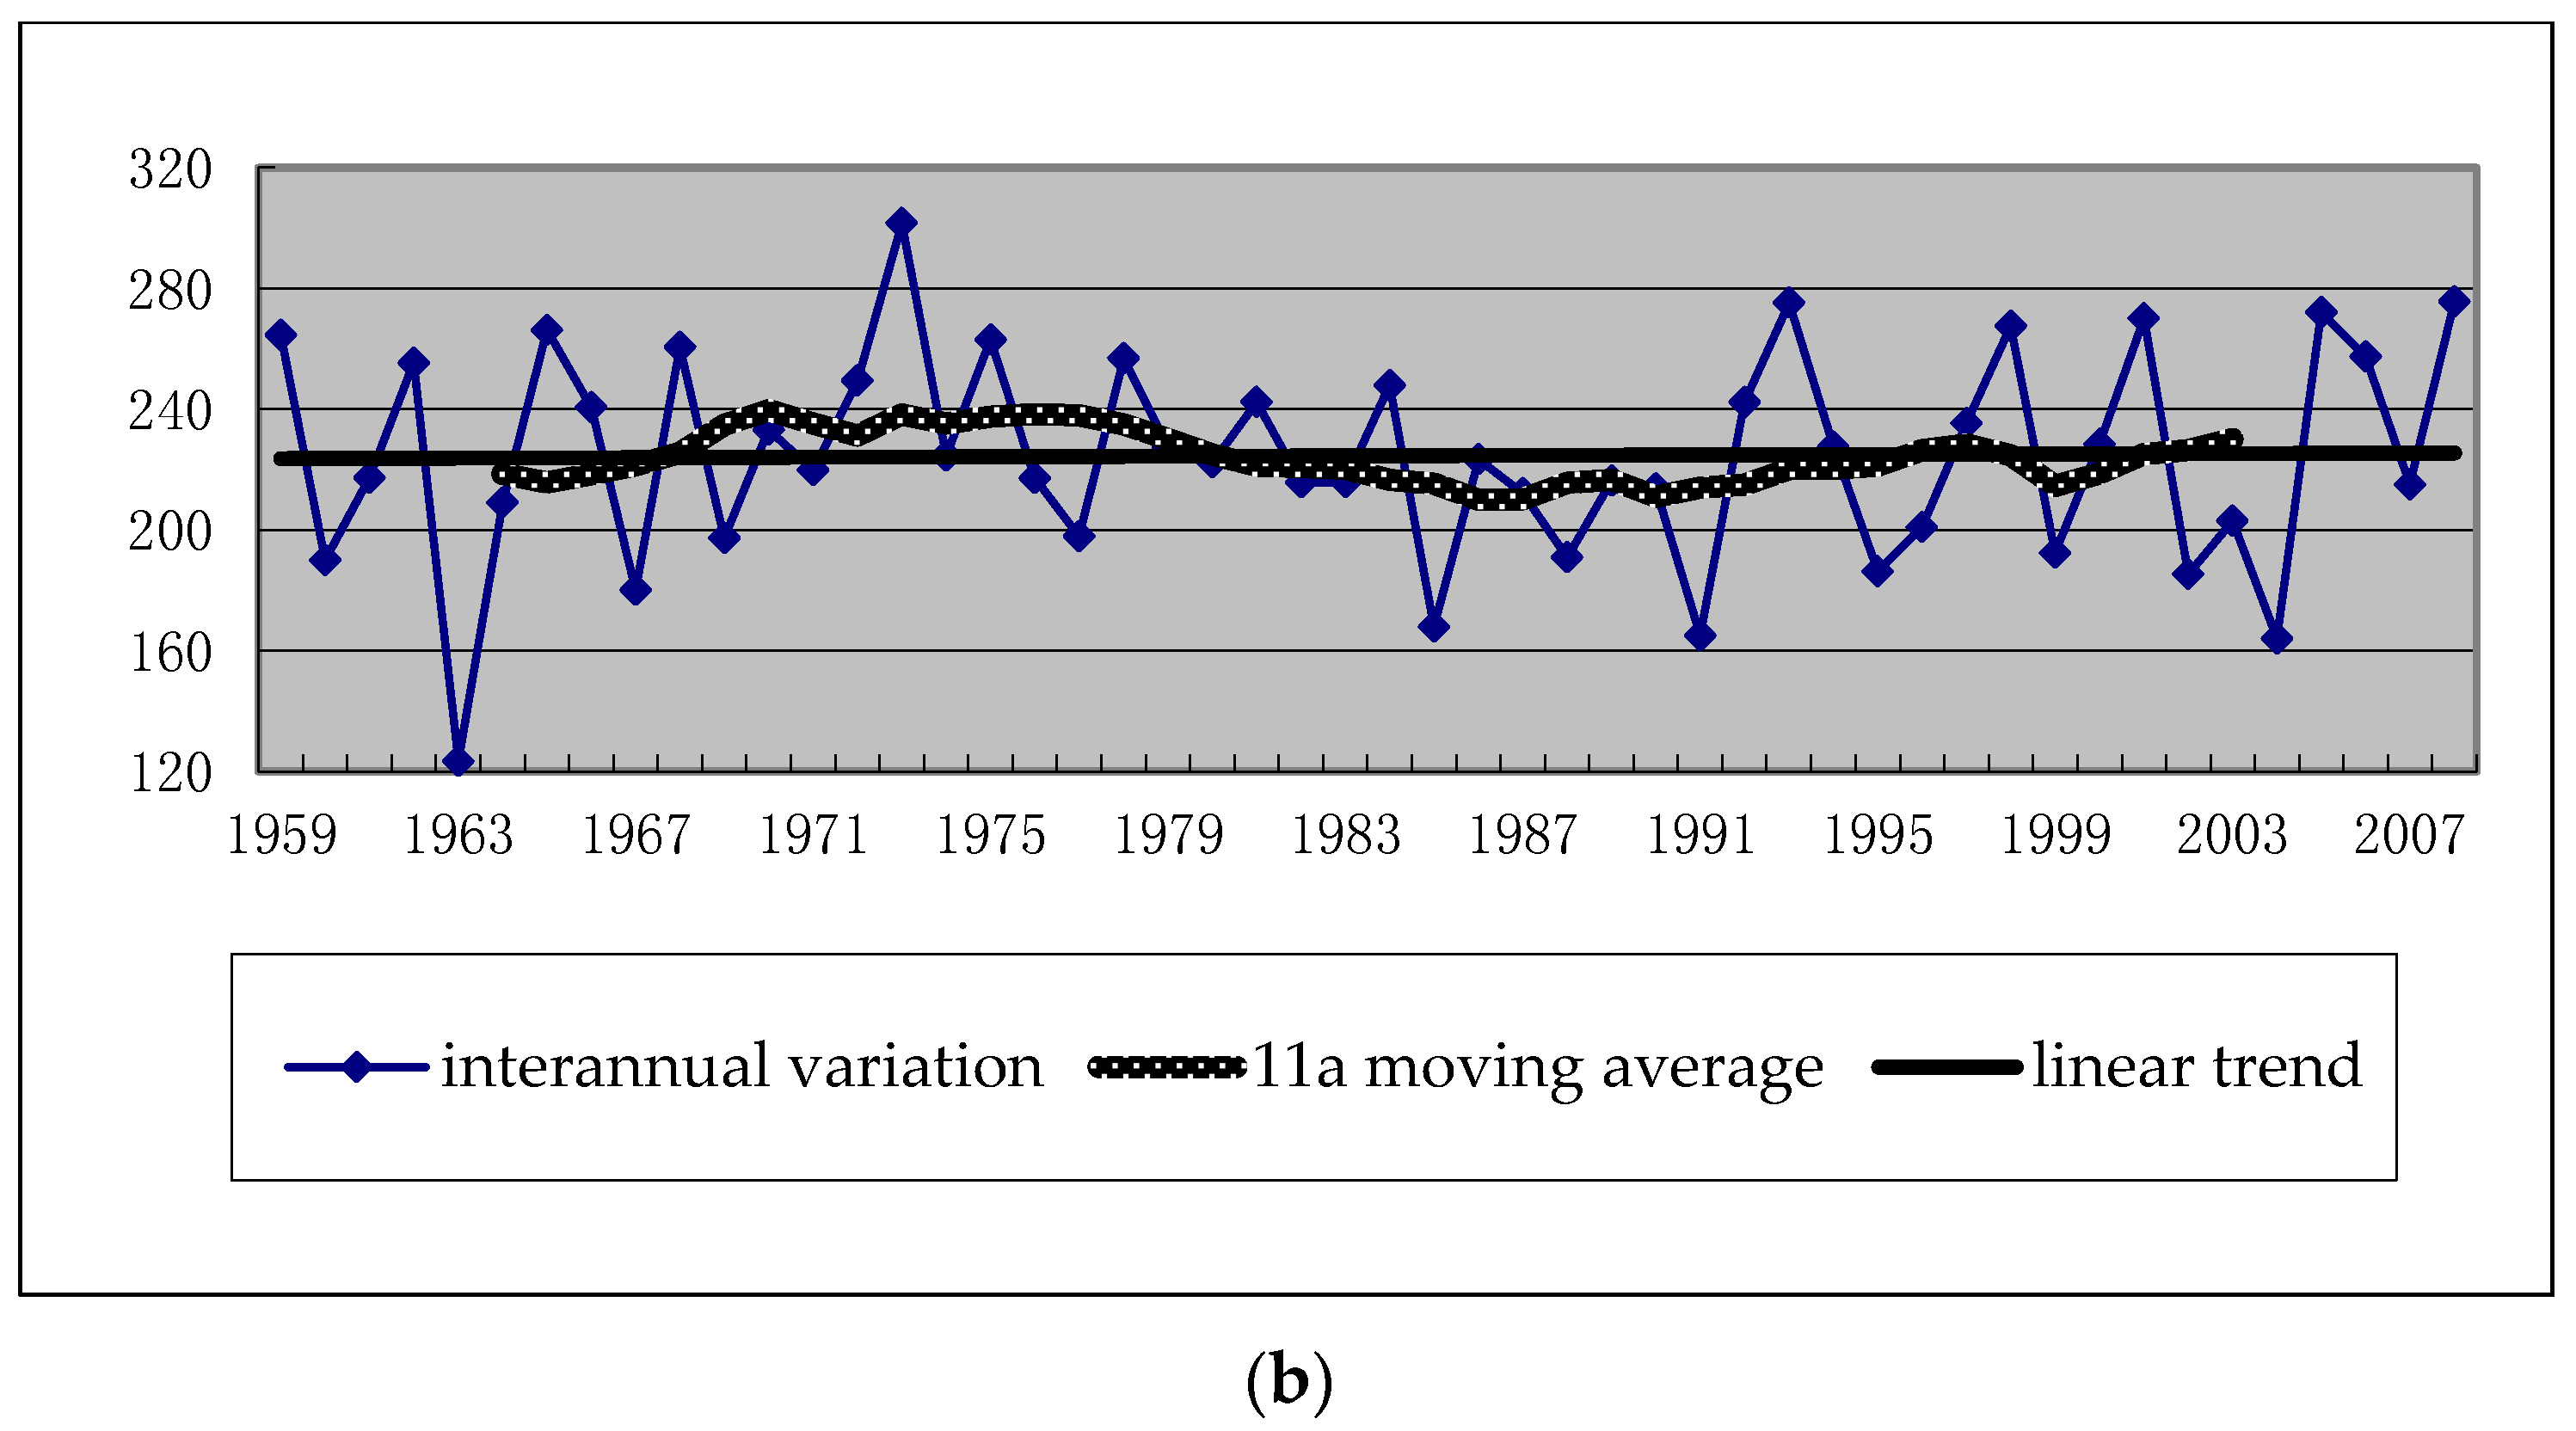
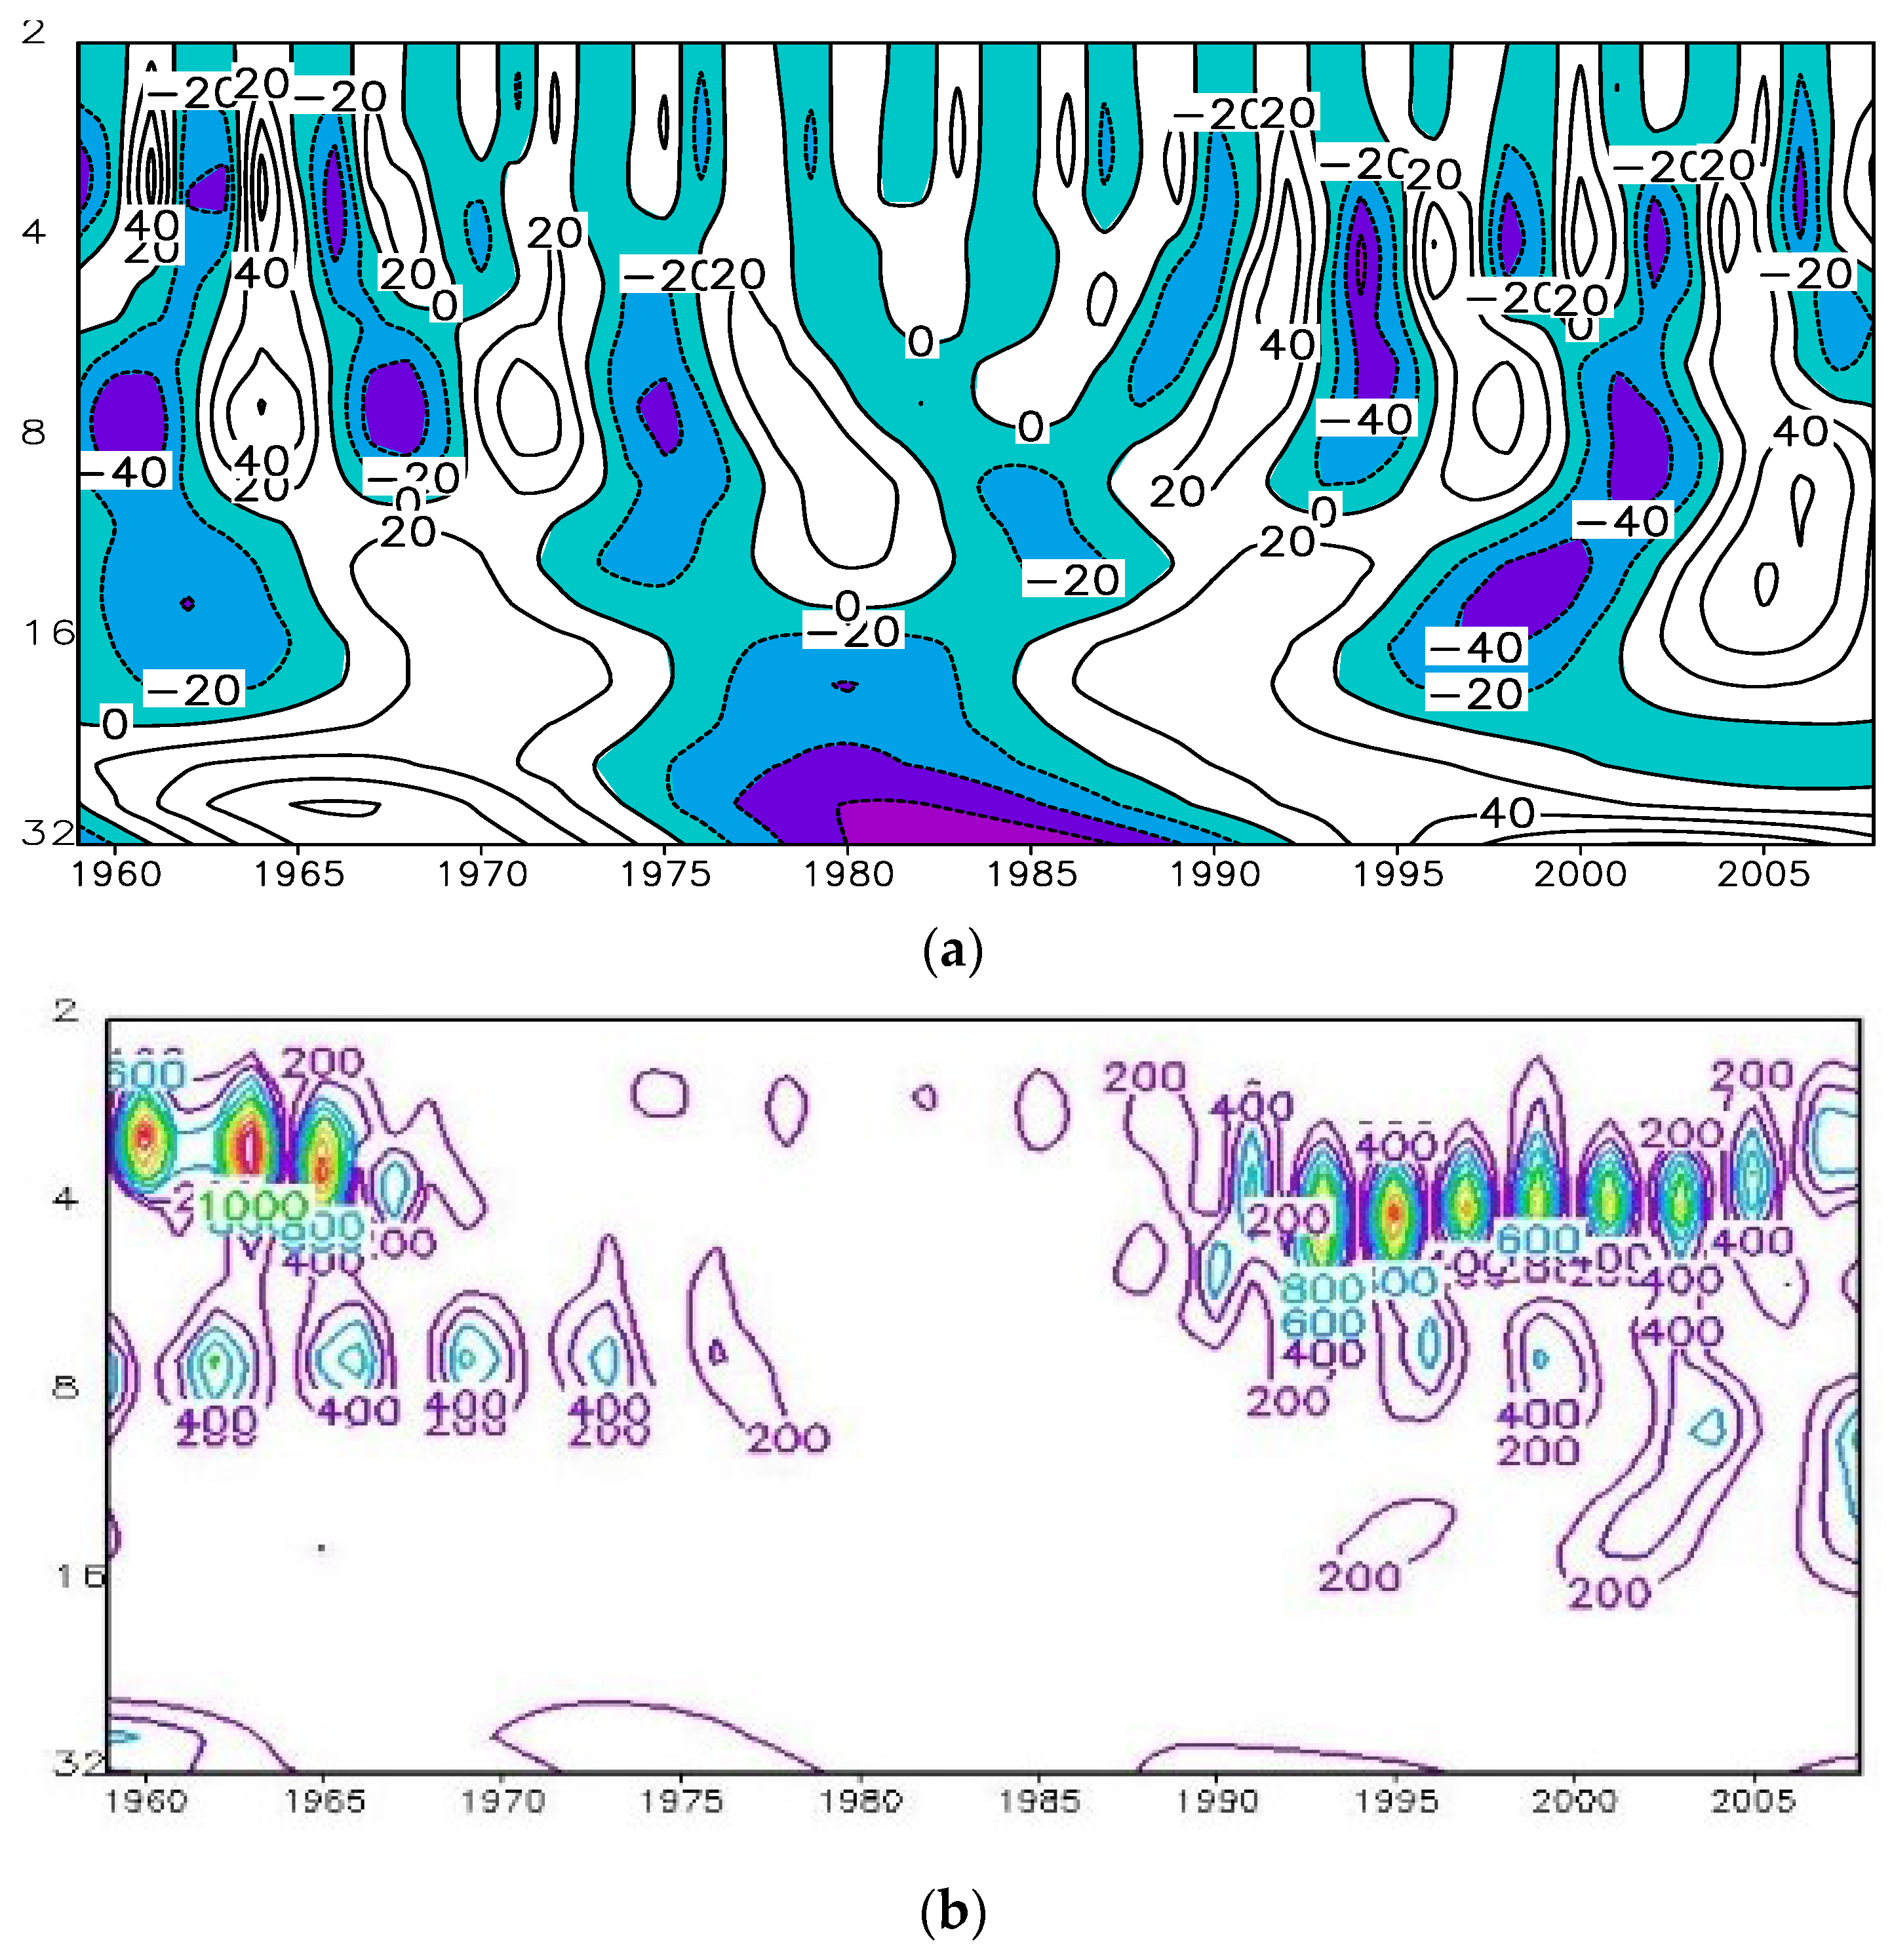
3. Rainfall Variation Characteristics in PFSSC

The distribution of the rainfall in PFSSC is shown in Figure 2a. The monthly rainfall is about 200–300 mm·mo−1. The rainfall center locates in Guangdong province. In order to study the interdecadal variation, the 11a moving average is analyzed. Figure 2b shows the interannual variation curve of the rainfall in PFSSC during 1959–2008, the 11a moving average curve and the trend line. The rainfall clearly shows interannual and interdecadal oscillations. From the interdecadal variation curves, above normal precipitation appeared in the 1970s, but the precipitation appeared to be below normal in the 1980s. The long-term developmental trend of the rainfall in PFSSC with the trend line shows that there is no significant variation in the total rainfall in the pre-flood season in the last 50 years.
Using the Wavelet analysis method to further analyze the rainfall variations and characteristics in the pre-flood season in South China, it is determined to have a clear four-year cycle and a period of 8 years (Figure 3a). The energy diagram (Figure 3b) shows that the 4-year cycles before the 1970s and after the 1990s are the most significant. The 8-year cycle before the 1980s and after the 1990s is also significant. In addition, after the 1990s, there is also a cycle of 12–16 years.
Figure 2. The mean rainfall in PFSSC (a), and the interannual variation curve of rainfall in PFSSC, 11a moving average curve and the trend line (b), the time series of rainfall, unit: mm·mo−1).
Atmosphere 07 00005 g002aAtmosphere 07 00005 g002b
Figure 3. Wavelet analysis of rainfall cycle in PFSSC (a) and energy diagram (b).
Atmosphere 07 00005 g003

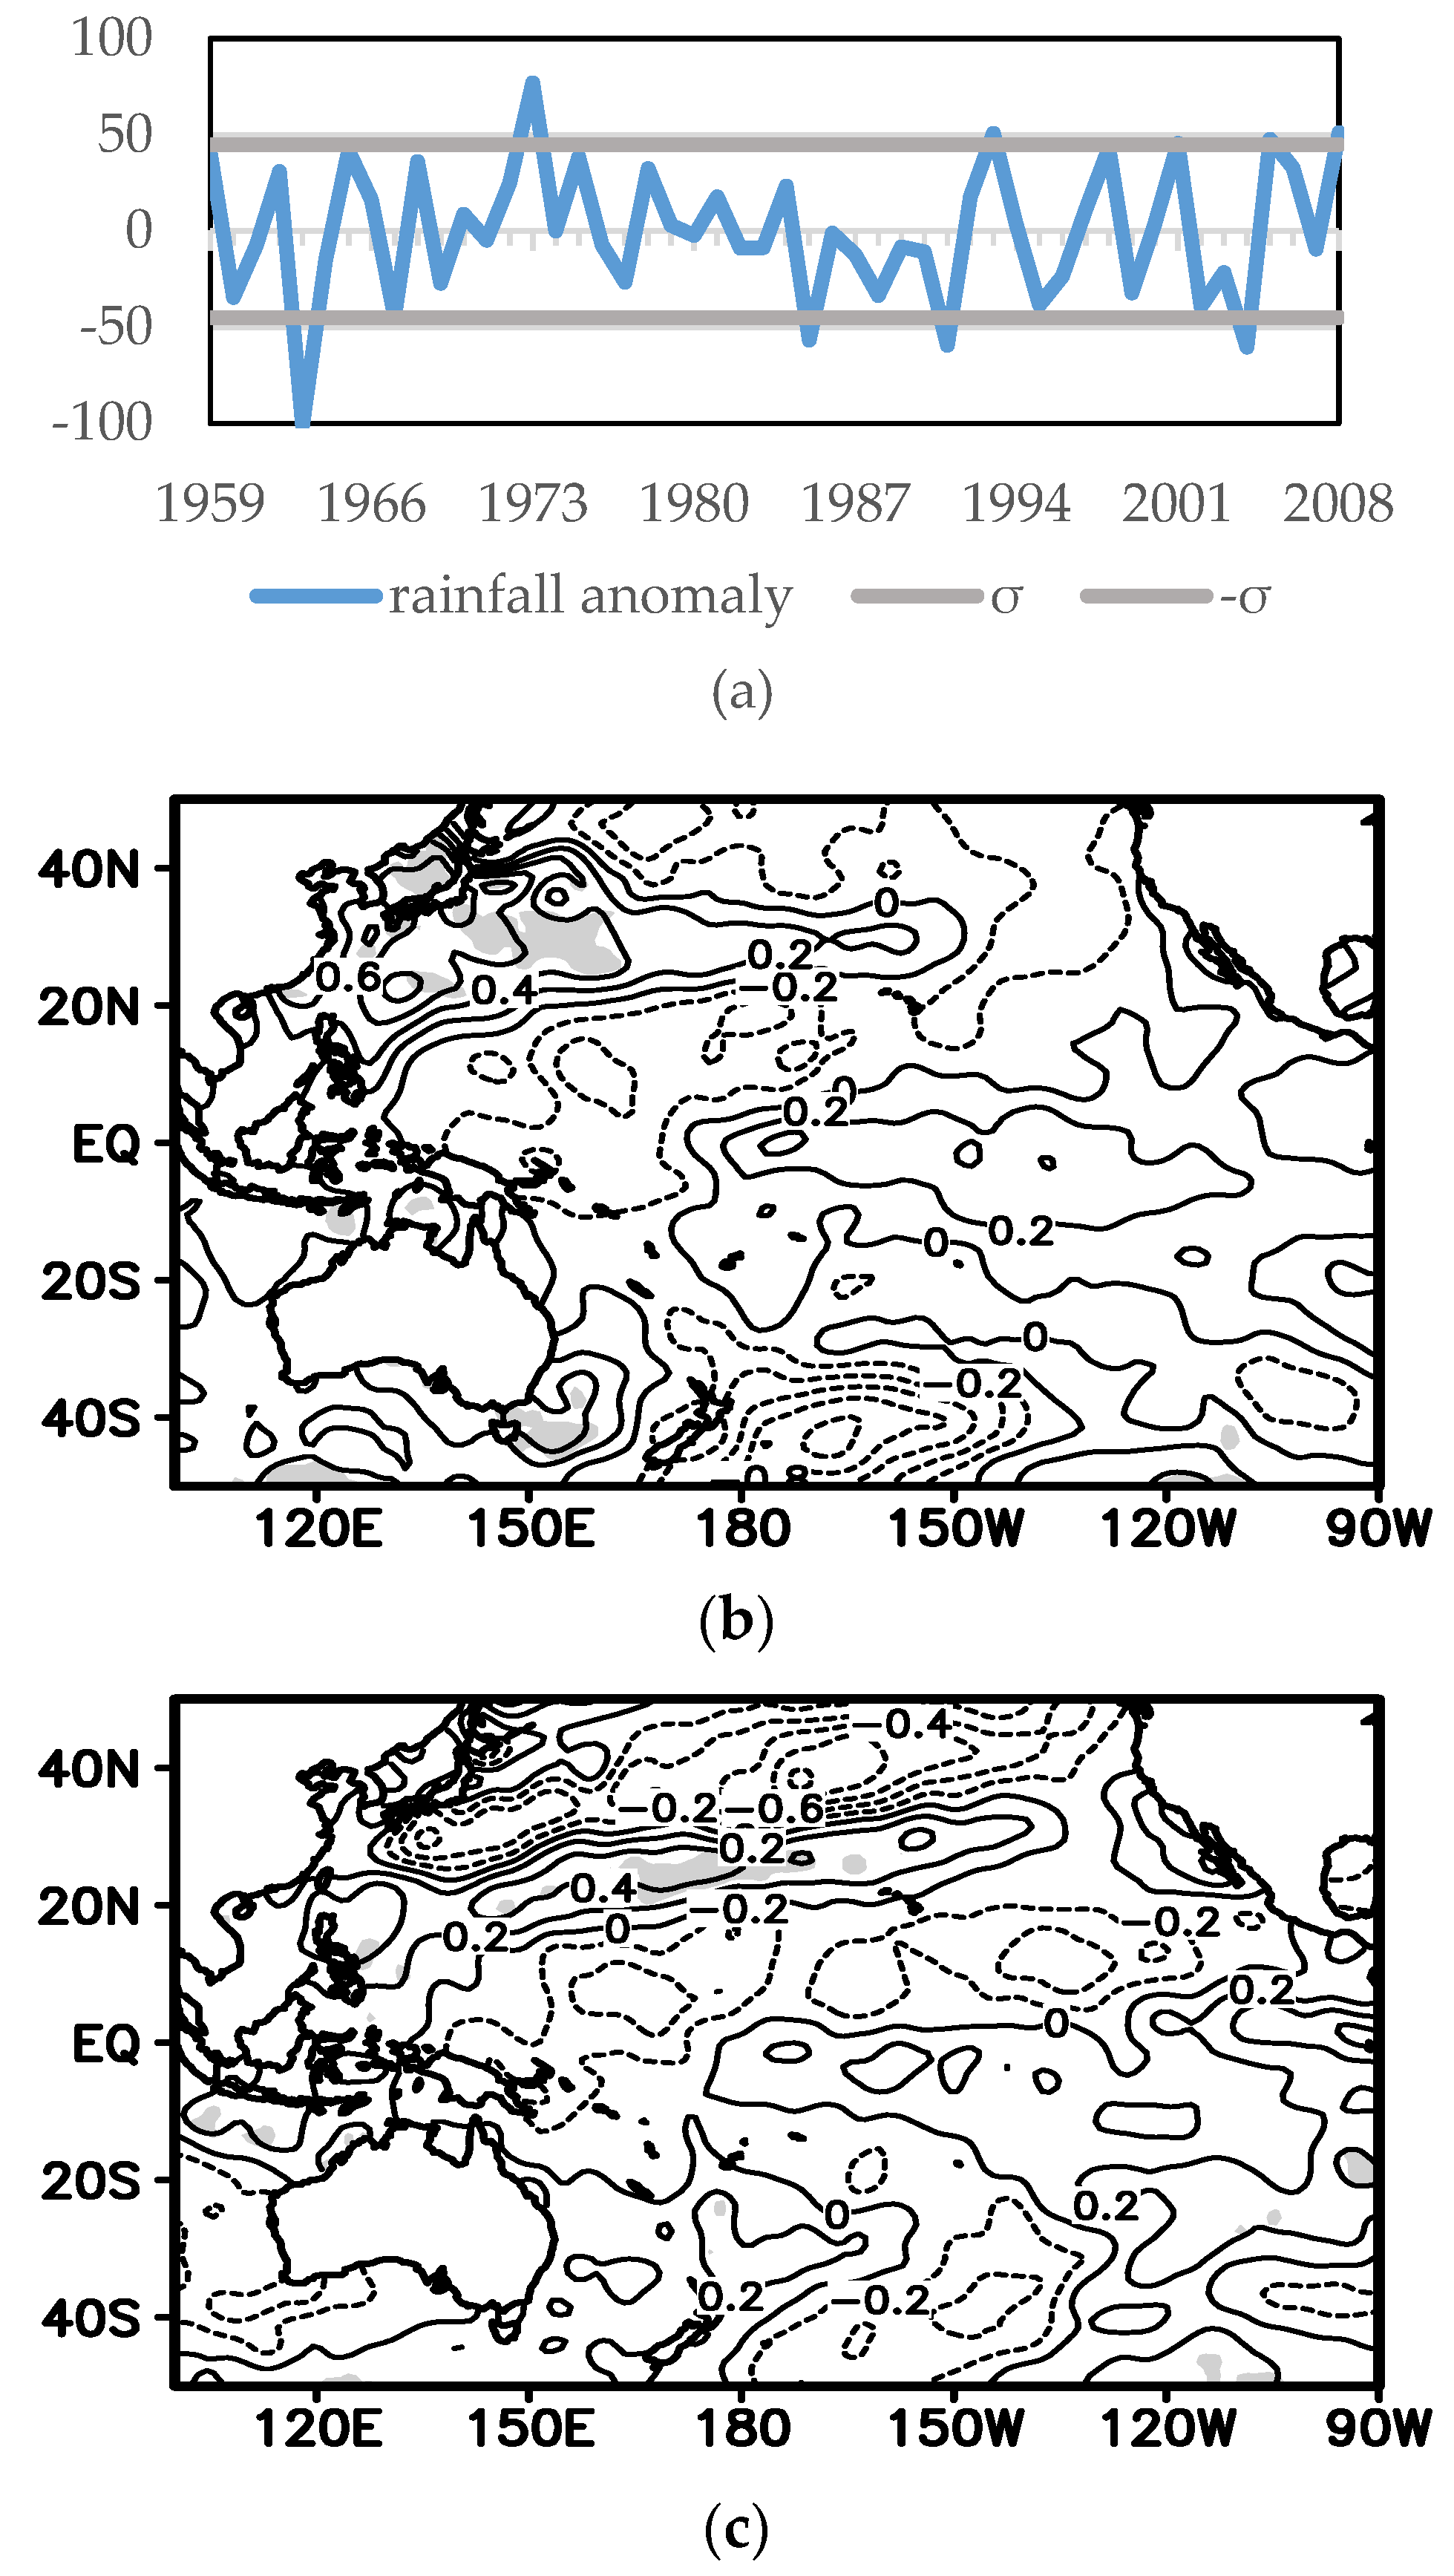
4. The Relationship between Rainfall in PFSSC and the SST of Pacific

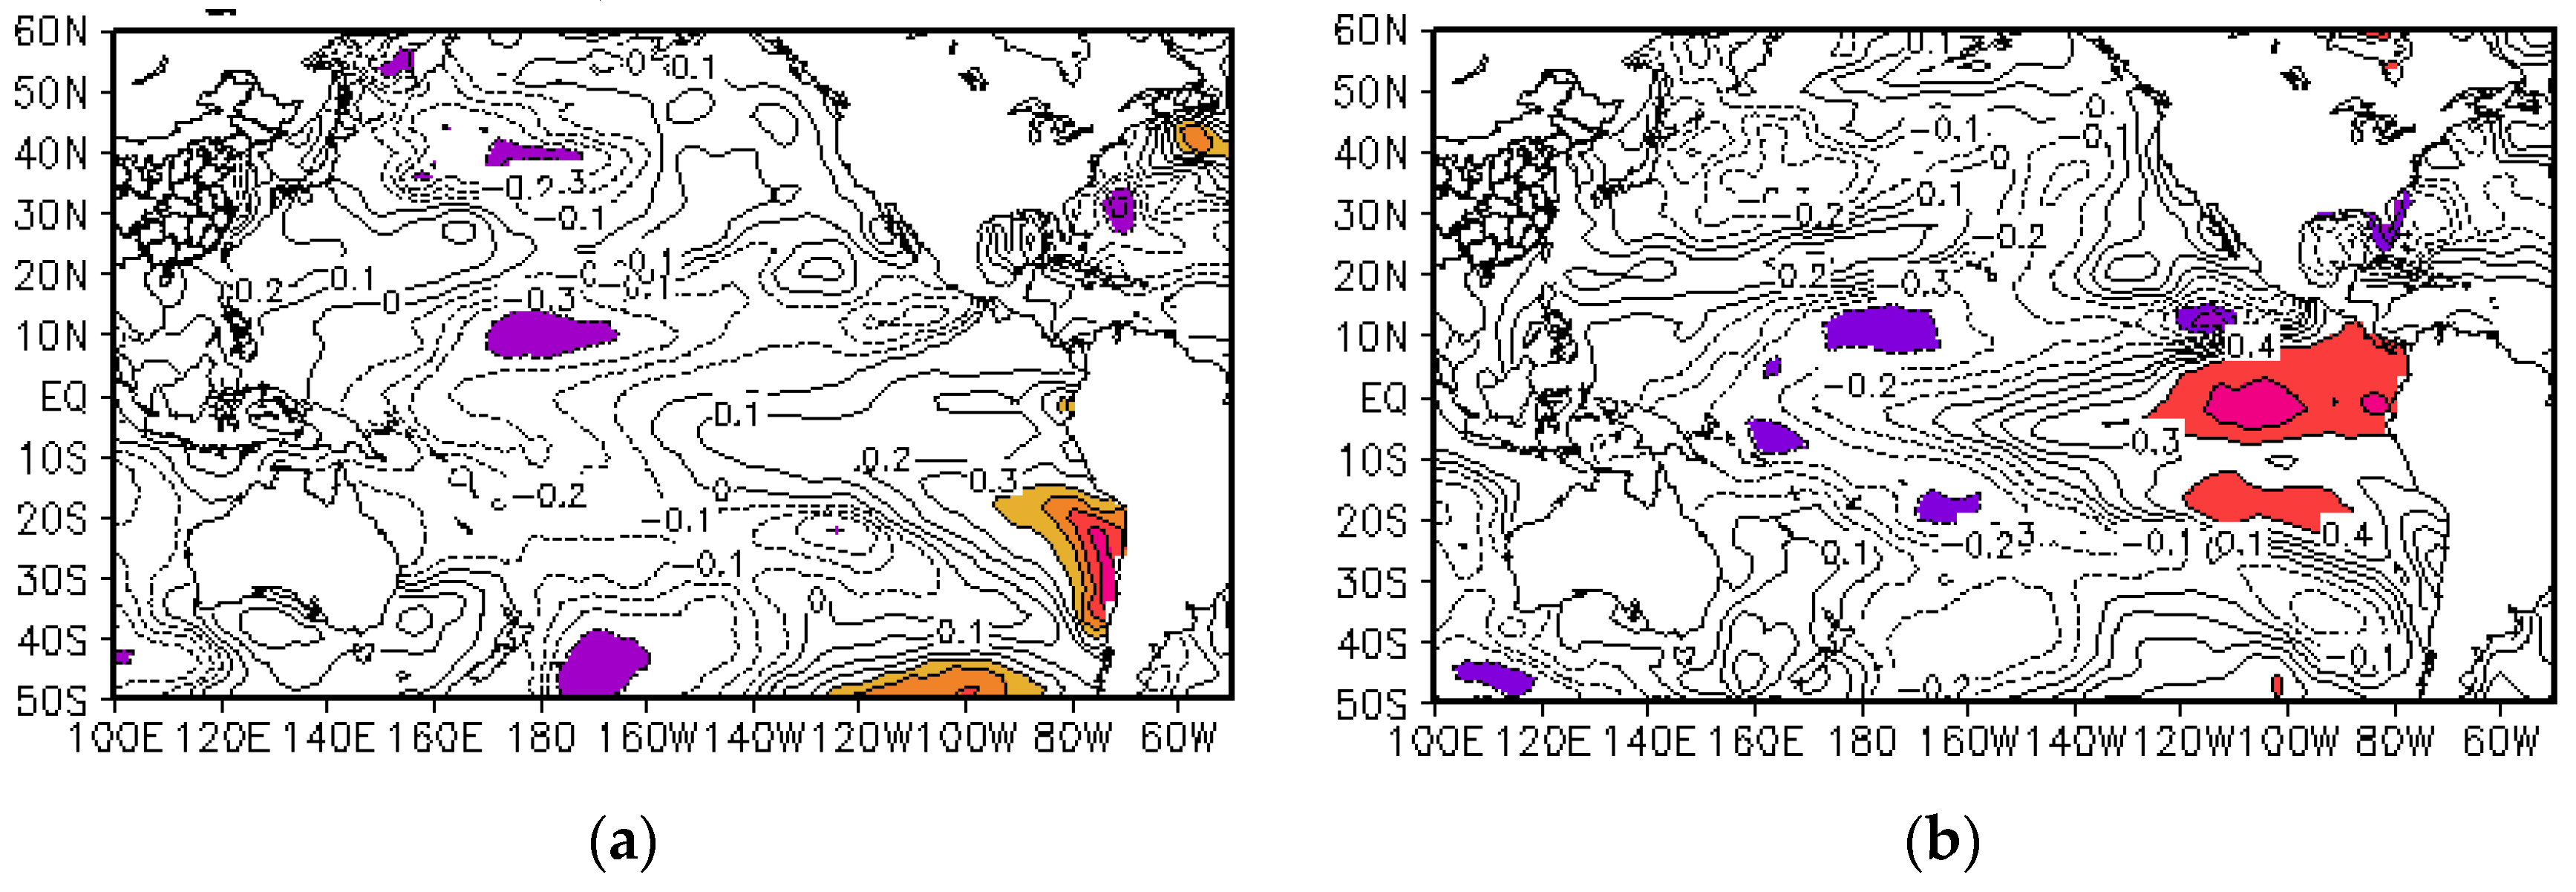
4.1. The Correlation between the Rainfall in PFSSC and the SST of Pacific

The ocean is a major factor that affects climate development on the planet. Because the ocean itself is the largest heat storage body on the surface of the earth, the ocean currents generated are the largest Earth’s surface transporting belt for heat energy. The sea surface temperature in January–March and in April–June indicates the preceding and the same period impact factors, respectively, and the possible impact of ocean temperature on the pre-flood season rainfall in South China is analyzed.
First, the typical dry and wet years are chosen based on the rainfall anomaly. Figure 4a shows that the high precipitation years are found in 1973, 1993, 2005 and 2008, whereas the low precipitation years are found in 1963, 1985, 1991 and 2004. In the typical years, the rainfall anomaly is bigger than 1 standard deviation (σ). The Pacific SST differences between the high and low precipitation years are shown in Figure 4b,c. From January to March (JFM), when the SSTs of the East coast and the Equatorial Eastern Pacific Ocean are positive anomaly, and the SSTs of the Pacific Ocean in the north of the Equator are negative anomaly, there is more rainfall in the PFSSC (Figure 4b). The results also show that in the same period, if the South China SST is positive anomaly and the SST at 20°N near the Pacific Ocean is positive anomaly, where 10°N is negative anomaly, there is more rainfall in the South China pre-flood season.
Figure 4. The rainfall anomaly (a, unit: mm·mo−1), the Pacific SST differences between high precipitation years and low precipitation years in PFSSC, January-March (b); April–June (c) (shaded area represent 0.1 reliability from t-test, unit: °C).
Atmosphere 07 00005 g004
The above composite analysis shows that there is a close relationship between the rainfall in PFSSC and the Pacific Ocean temperature; therefore, further analysis is conducted on the relationship between the two; as shown in Figure 5, the shaded area is tested at a 0.05 confidence level. The rainfall in PFSSC and warm pool region temperatures in January–March and April–June are significantly negatively correlated. The early period is significantly positively correlated with near 50°S region, indicating that there may be a correlation between the rainfall in PFSSC and the temperature of the more distal part of the South Pacific Ocean, but that there is no significant correlation with other regions. In the same period, the rainfall in PFSSC is positively correlated with the SST of the South China Sea. This is consistent with the above analysis, which shows that the temperature is abnormal in South China Sea when there is a higher level of rainfall in the pre-flood season.
Figure 5. The correlation distribution between the rainfall in PFSSC and the Pacific Ocean temperature, January–March (a); April–June (b) (shaded area indicates 0.05 confidence level, contour interval 0.1).
Atmosphere 07 00005 g005
The analysis of the characteristics of the rainfall in PFSSC indicates that the rainfall in PFSSC has a significant decadal variation; therefore, further analysis is done on the pre-flood season rainfall and the Pacific Ocean temperature related to the decadal characteristics. This is important to understand the relationship between the rainfall in PFSSC and the SST of the Pacific. The interdecadal correlations are analyzed. As shown in Figure 6a, the Western Pacific warm pool and the 160°W–180°W South Pacific Ocean are significant negatively correlated regions, whereas the positively correlated regions concentrate in the Southeast China Sea and along the coast of Peru and Argentina in the Pacific Ocean. There are no significantly correlated regions in China coast, and the maximum correlation coefficient along Argentina was 0.7, where it is within a 0.001 confidence level. In addition, there is a small area between South Pacific 80°W–120°W that is a positively correlated region, with a maximum correlation coefficient of 0.6 and a confidence level smaller than 0.01. Further analysis reveals the decadal correlation between Pacific Ocean temperature and the rainfall in PFSSC over the same period (Figure 6b). The negatively correlated regions of Pacific warm pool area extend to the east from the equatorial axis to form a discontinuous 'U' that exhibit a significant negatively correlated region with an opening towards the east. Significant positive correlation regions in Nino1 + 2 and Nino3 extend to the west, with a central maximum of 0.5 and a confidence level smaller than 0.02.
Figure 6. Decadal correlation between the rainfall in PFSSC and Pacific Ocean temperature, January–March (a), April–June (b) (shaded area indicates 0.05 confidence level, contour interval 0.1).
Atmosphere 07 00005 g006

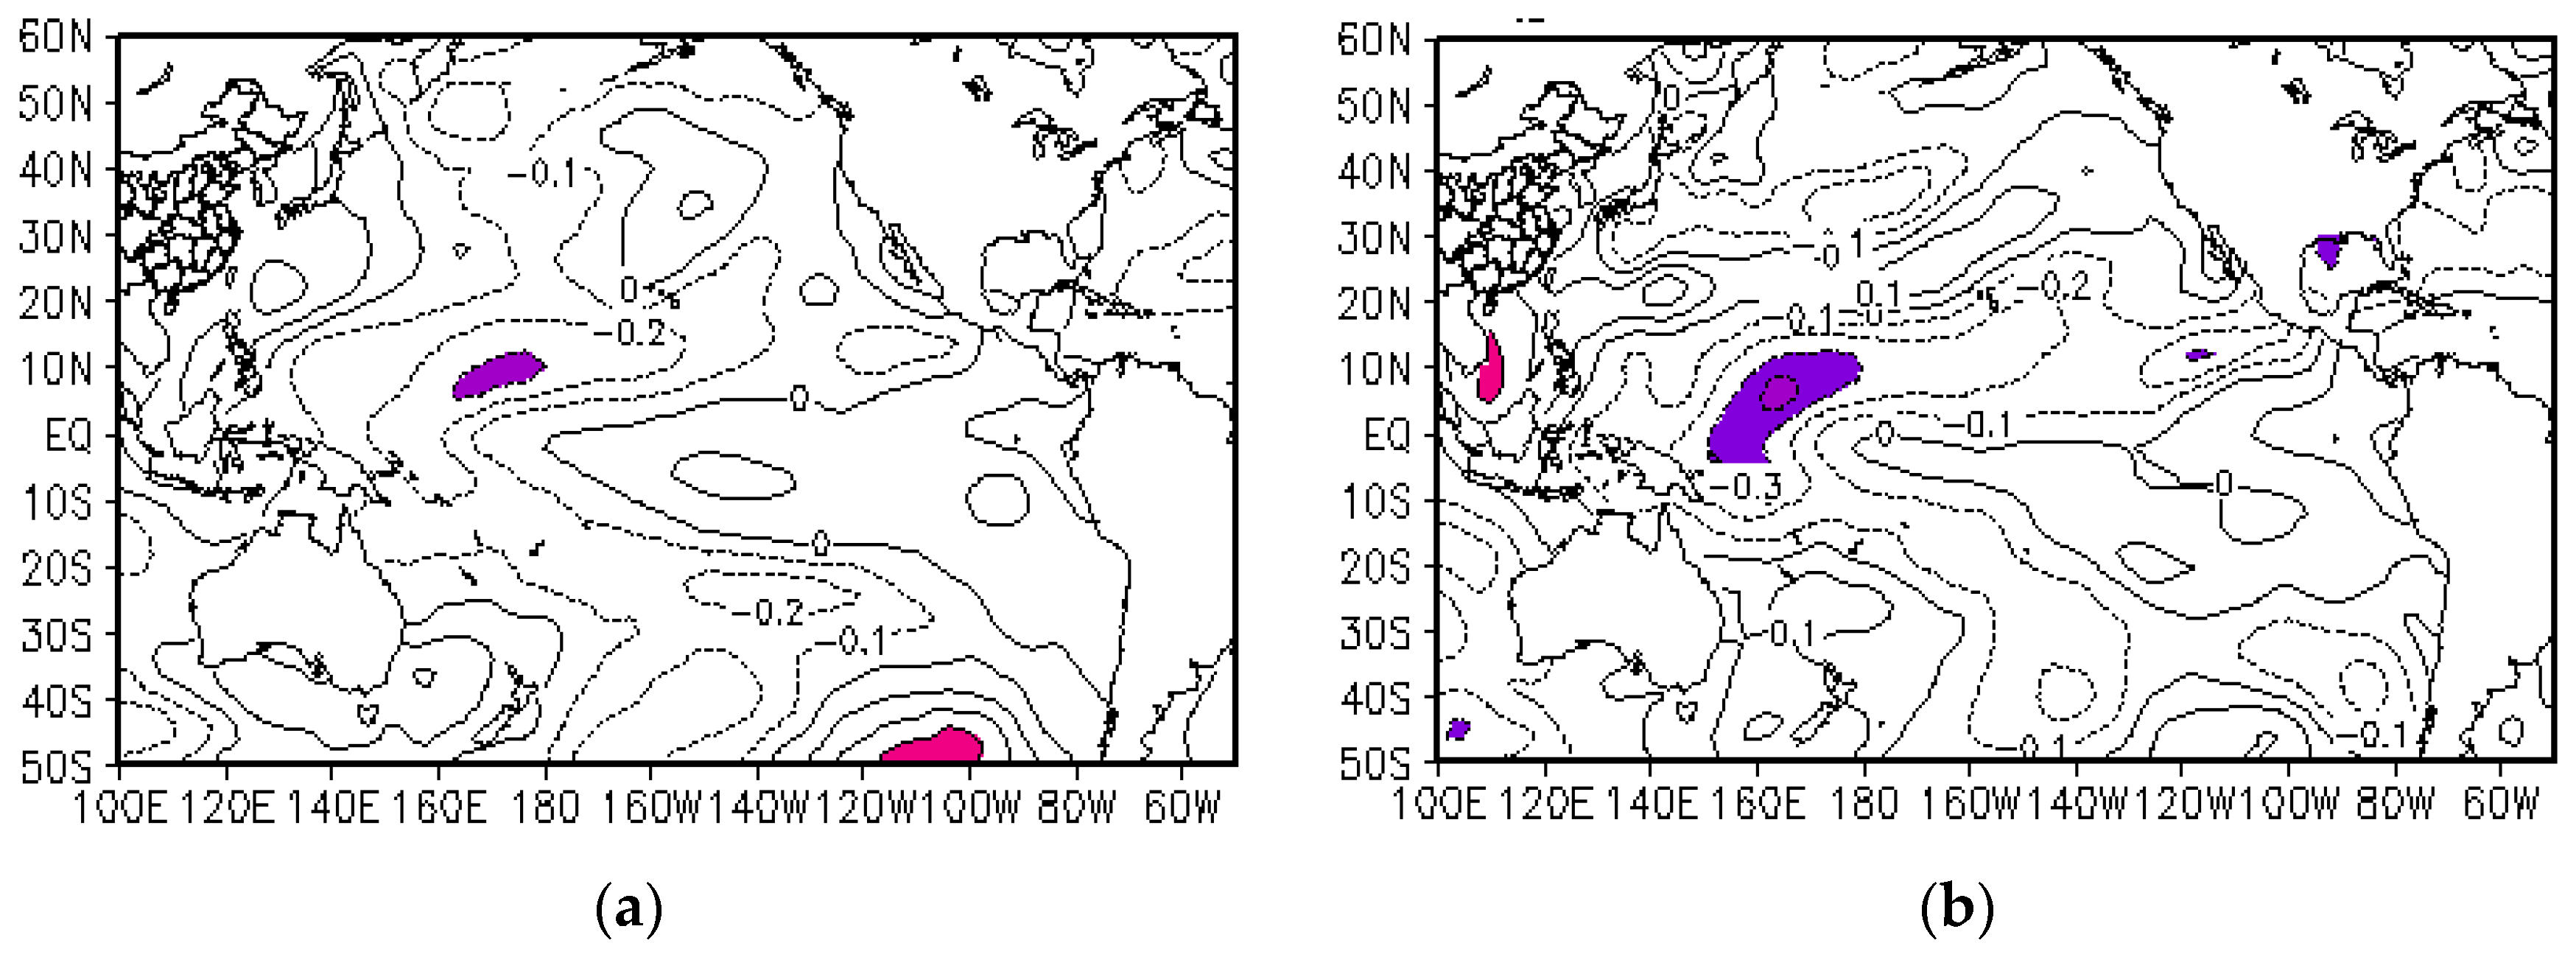
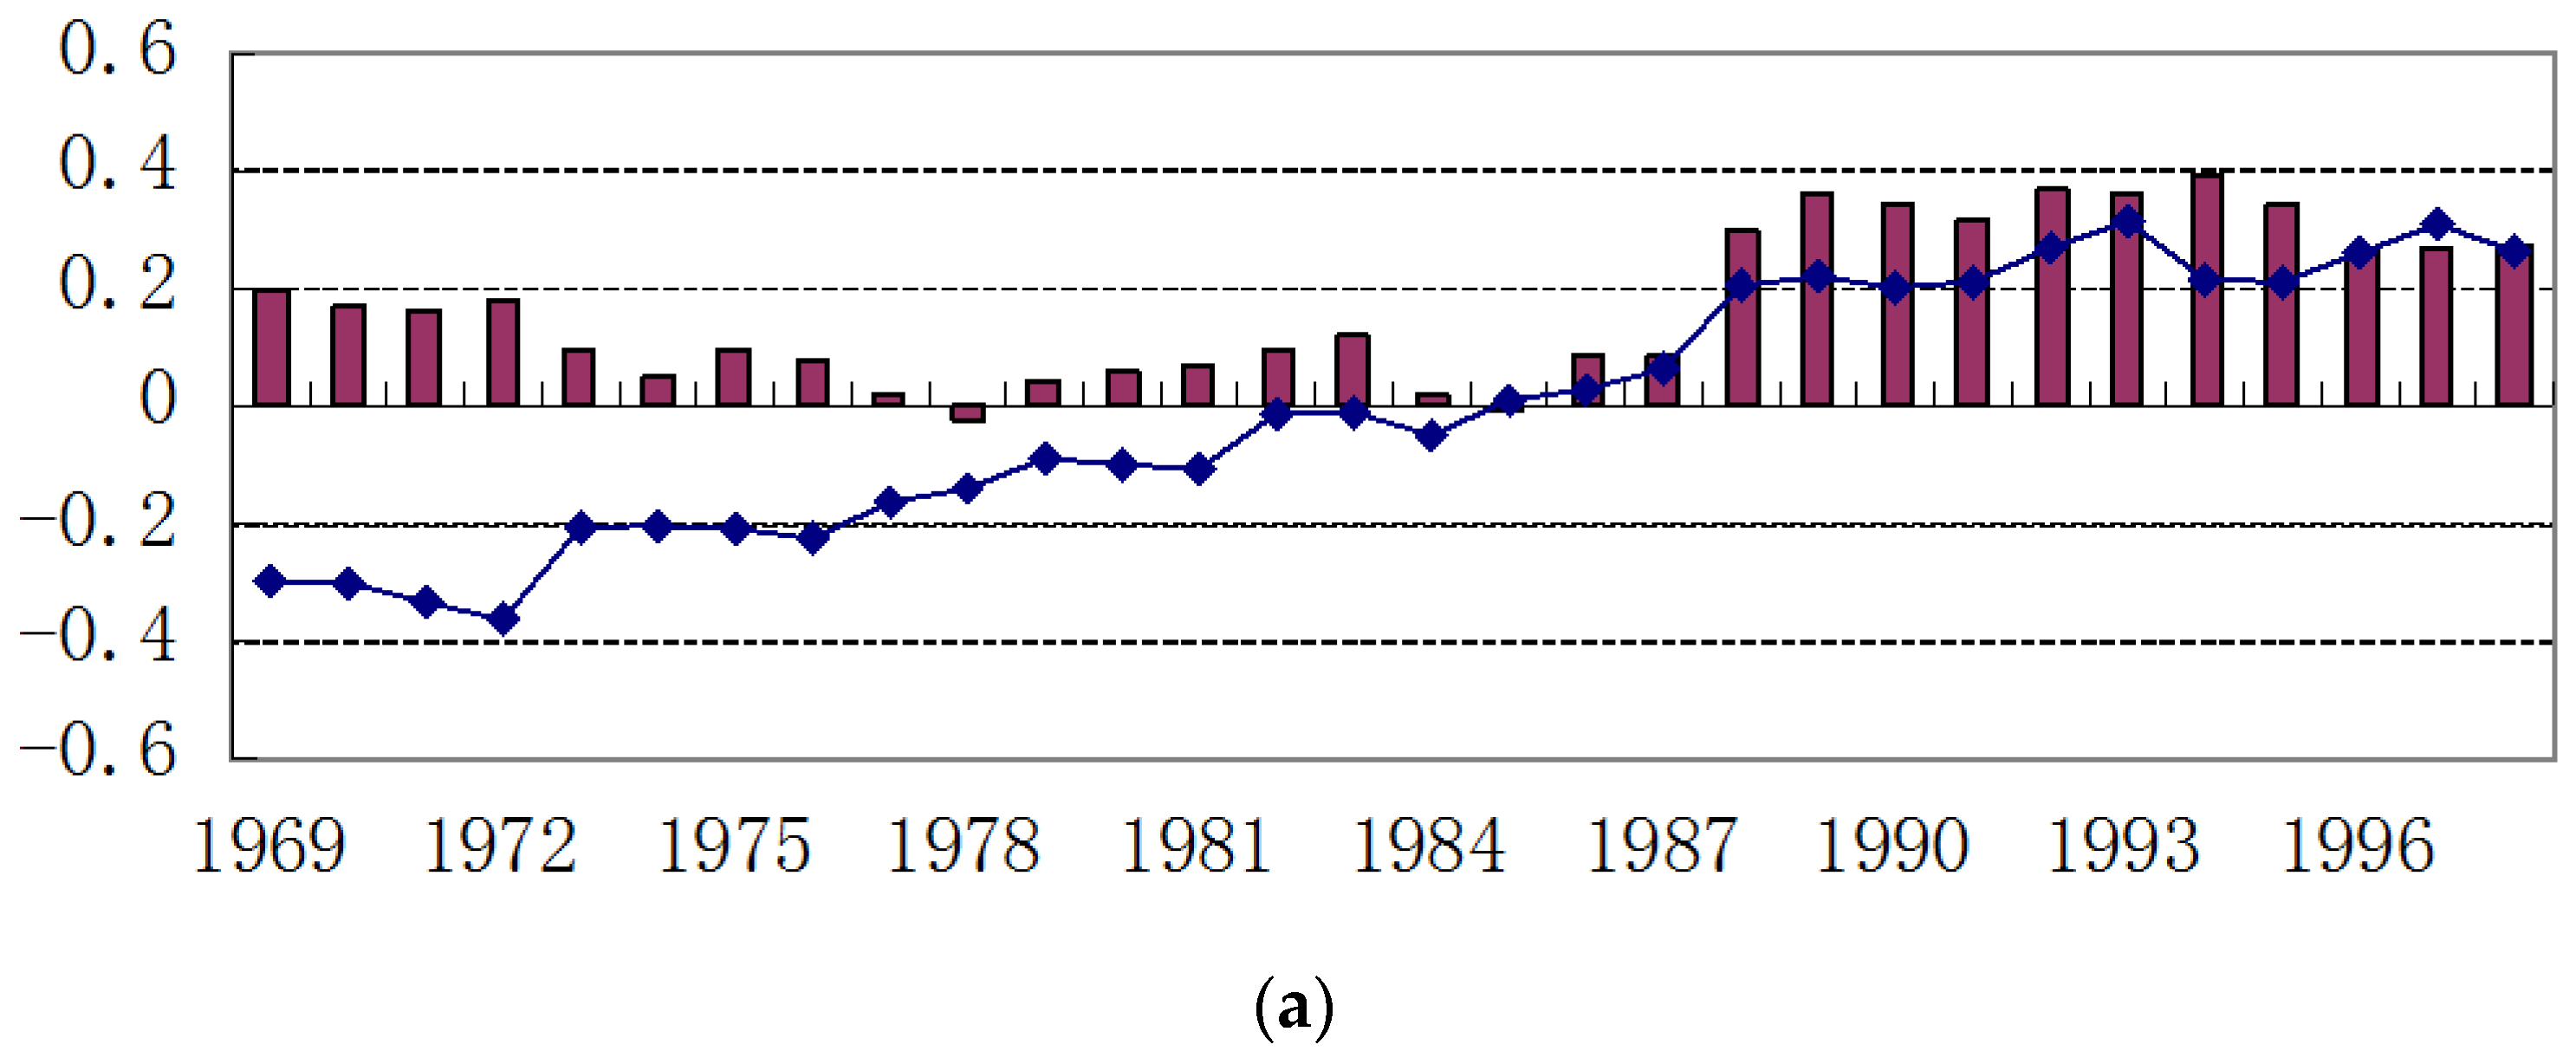
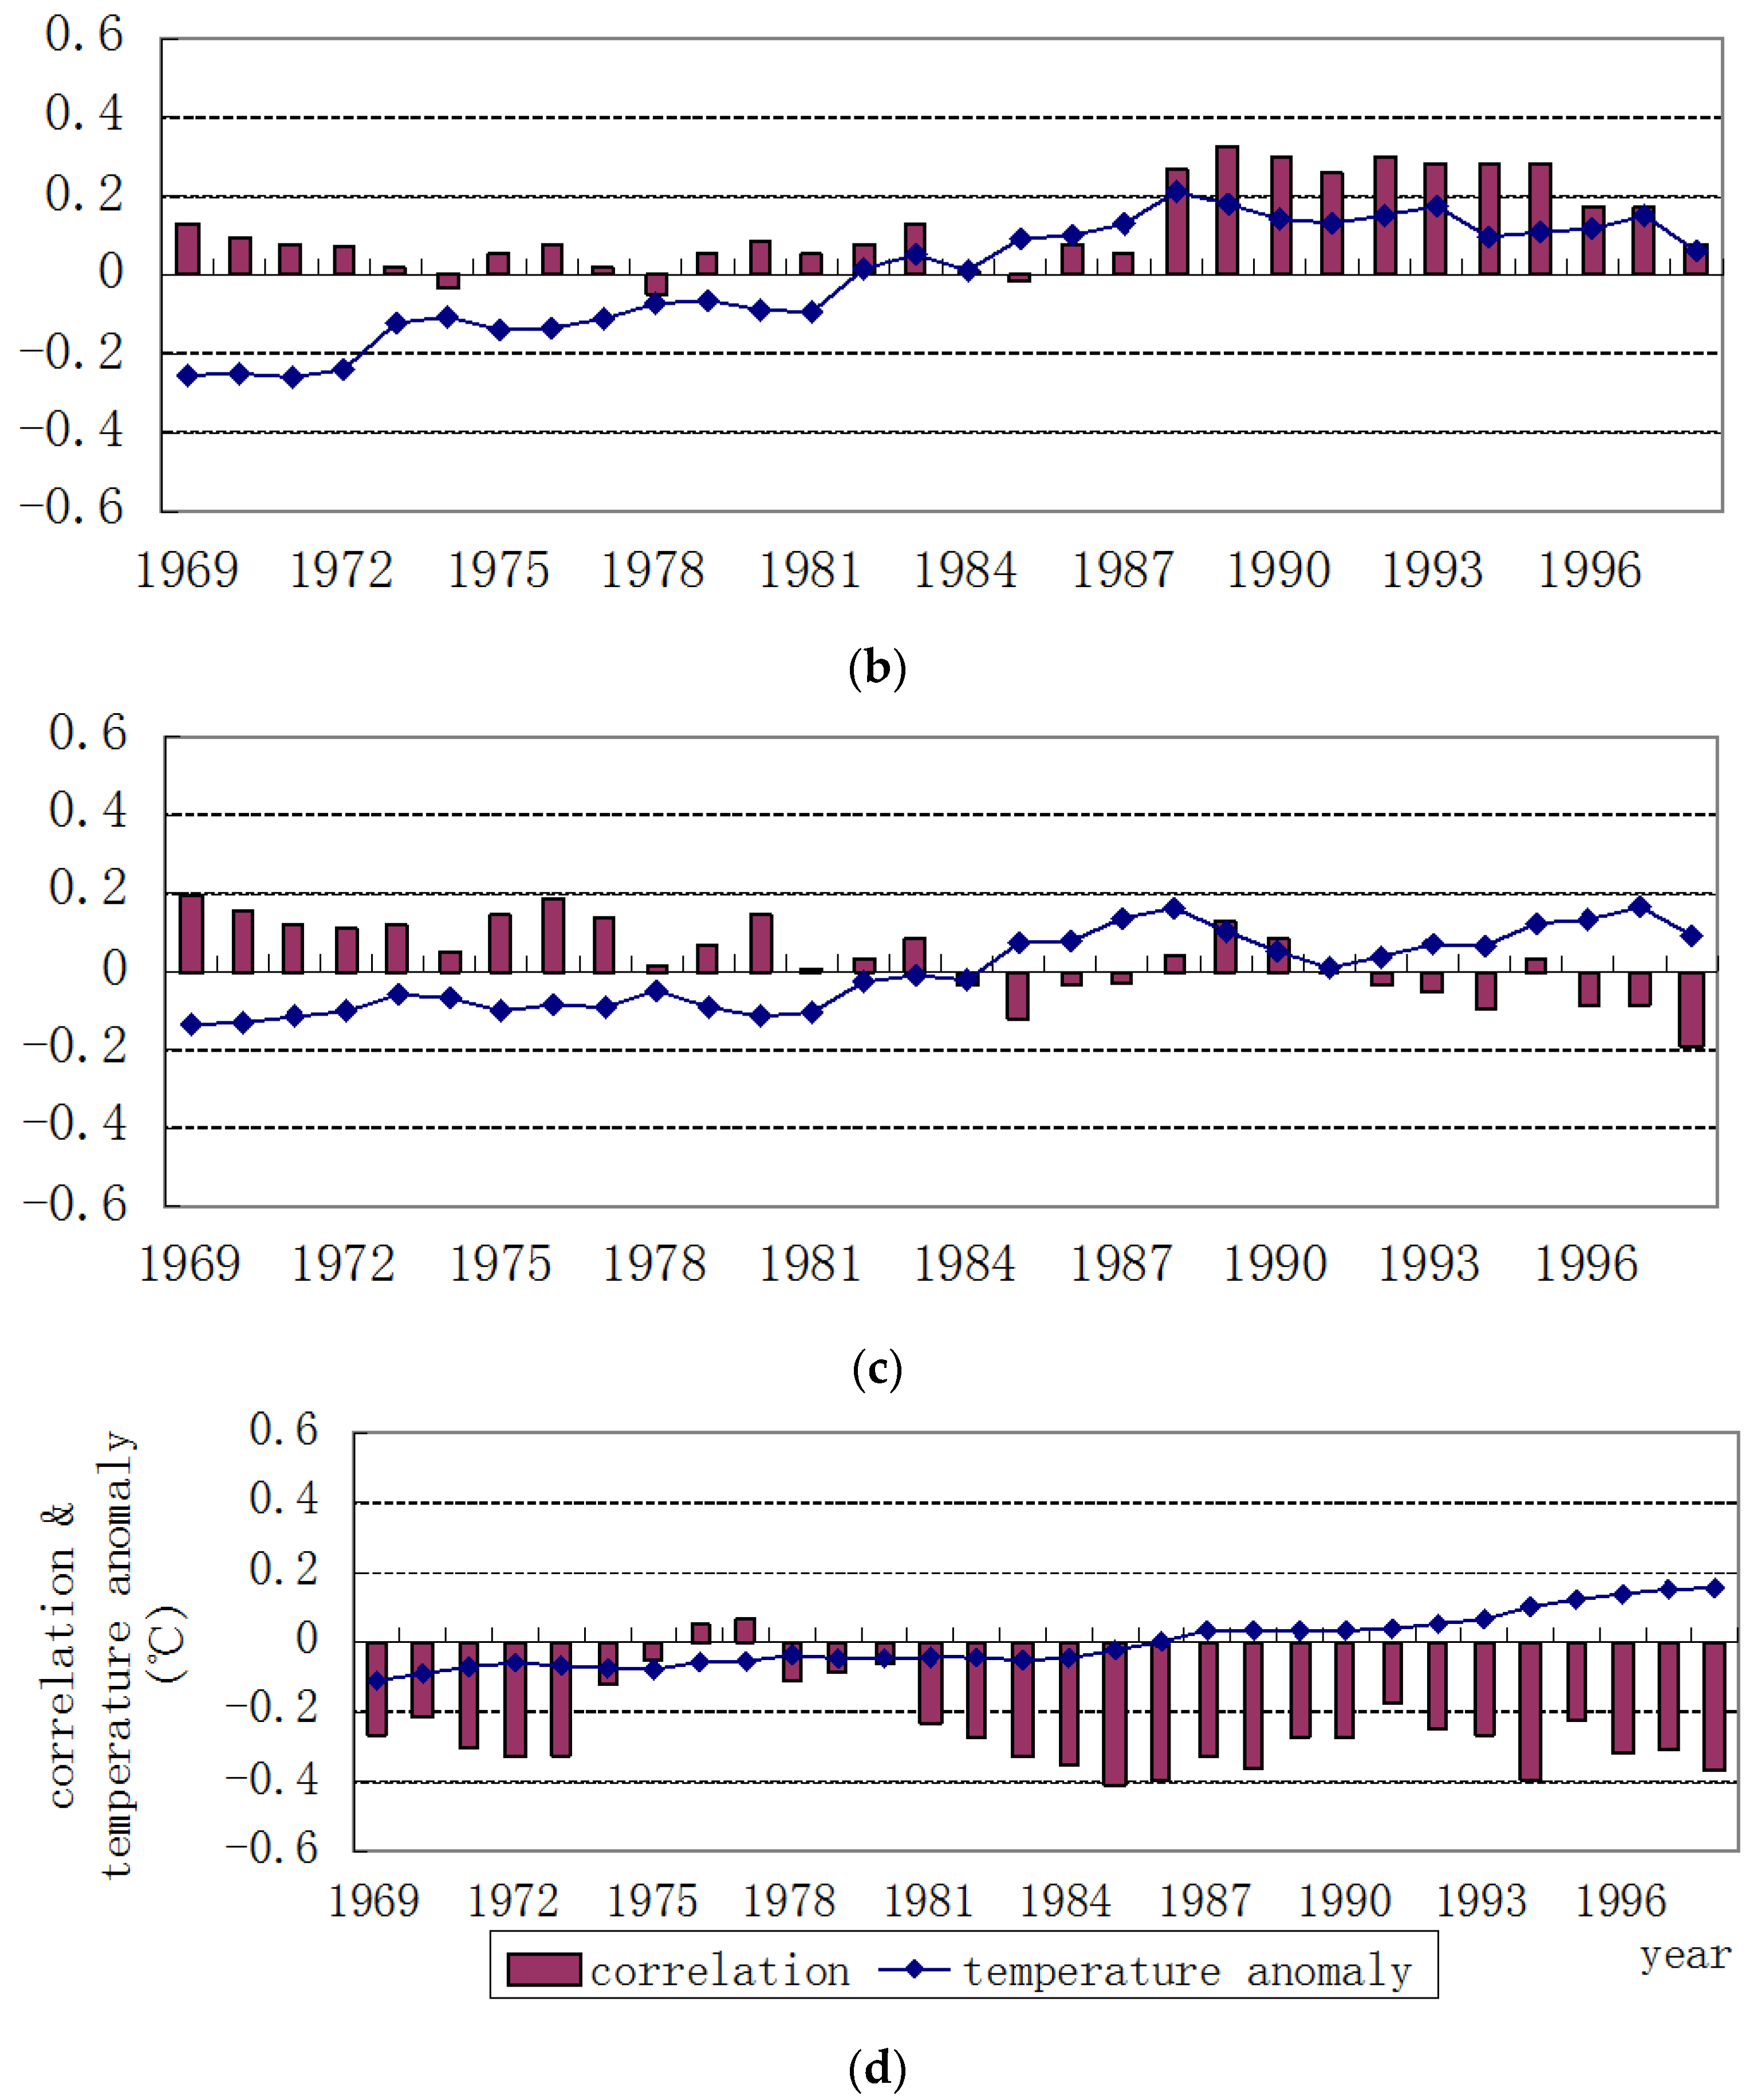
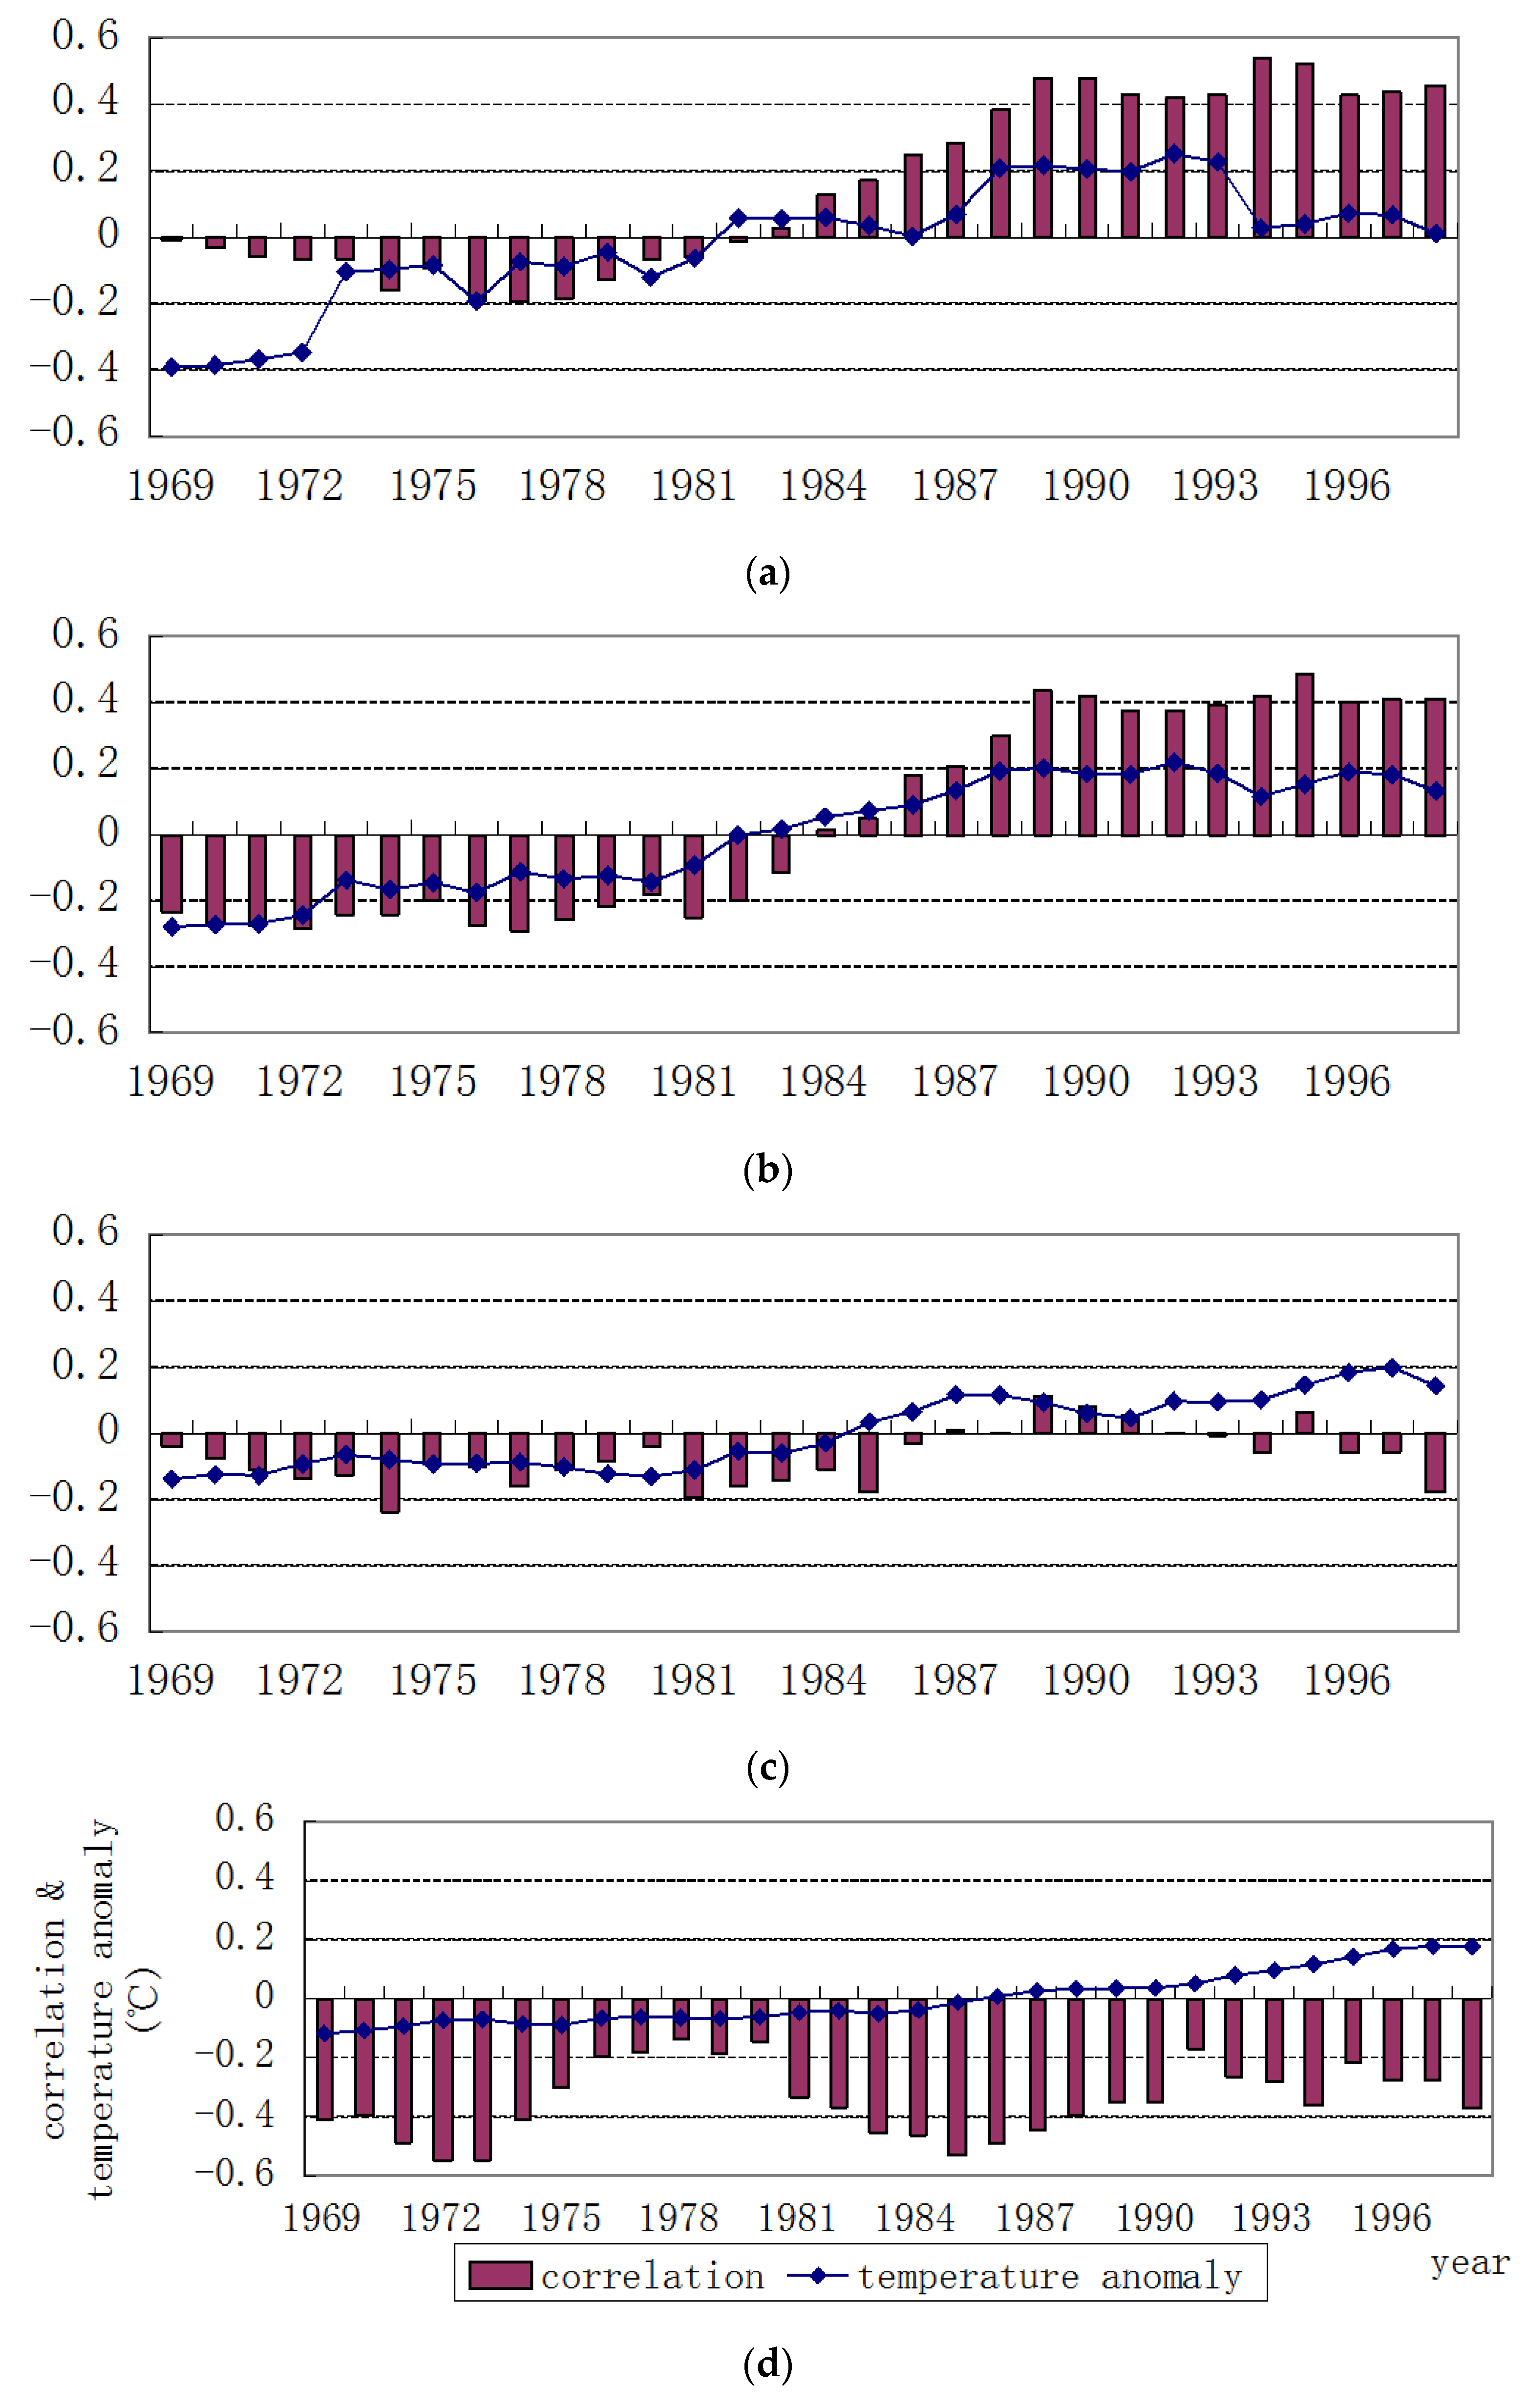
4.2. The Sliding Correlation Analysis of the Rainfall in PFSSC and Pacific Ocean Key Region Temperature

The different climatic backgrounds may affect the relationship between meteorological factors. For example, in certain climatic backgrounds, two meteorological factors are positively correlated, while when the climate background changes, two meteorological factors may not be related or even negatively correlated. The present study further analyzes the correlation between the rainfall in PFSSC and SST in Pacific in different context of decadal variations. Using the moving average and the sliding correlation method, the moving average of the SST is used as background, whereas sliding correlation reflects the relevant features of the two climate elements under different backgrounds. We calculate the 21-a moving average SST of Pacific in January–March and April–June as the SST background of decadal variation of pre-flood season rainfall. The 21-a sliding correlation is used to analyze the relationship of ocean temperature and pre-flood season rainfall in different SST backgrounds. The tropical Pacific Nino region and the warm pool region are selected for further analysis as the key regions. The ranges of the selected regions are listed in Table 1. Herein, 21 years was used as the length of sliding window; this length can be a better reflect decadal variation of meteorological elements.
Table 1. The key regions of tropical Pacific.
Key RegionLongitude RangeLatitude Range
Nino 1 + 280°W–90°W10°S–0°S
Nino 390°W–150°W5°S–5°N
Nino 4160°E–150°W5°S–5°N
Warm pool140°E–180°E10°S–10°N
Figure 7 shows the curve diagram of the correlation coefficient between SST and the rainfall in PFSSC and ocean temperature backgrounds of the key Pacific Ocean temperature region in the early period, January–March, in which the histogram exhibits a sliding correlation coefficient, where the line graph is the moving average distance background curve of key ocean temperature regions over 21 years. The figure shows that there is a significant trend that increases the equatorial Pacific Ocean temperature in January–March from the 1960s to 2000s; in particular, the NINO1 + 2 + 3 regions warm up significantly. As can be seen in the sliding correlation coefficient, for the NINO1 + 2 and NINO3 regions, when the ocean temperatures are negatively anomaly, the correlation between the SST and the rainfall in PFSSC is not significant. Since the 1990s, in the warm ocean background, the two are significantly positively correlated. The correlation of ocean temperature and the rainfall in PFSSC is not significant in NINO4 region, but in the context of the warm ocean, the two are negatively correlated; in the context of the cold ocean, the two are positively correlated. In the warm pool region, the relationship of ocean temperature and the rainfall in PFSSC has no significant differences for different SST backgrounds; regardless of whether the background is cold or warm, they show a significantly negative correlation.
Figure 7. The 21-a moving correlation (histograms) between the rainfall in PFSSC and the equatorial Pacific Ocean temperature in January-March and the 21-a moving average anomaly of the Pacific Ocean temperature (line, unit: °C). The NINO1 + 2 region as (a); NINO3 region as (b); NINO4 region as (c) and the warm pool region as (d).
Atmosphere 07 00005 g007aAtmosphere 07 00005 g007b
Figure 8 shows the curve diagram of the sliding correlation coefficient and the SST background for the key Pacific regions in the same period, April–June. Similar to the ocean temperature variation in January–March, the equatorial Pacific Ocean temperature from April–June in the last 50 years has had a significant warming trend. In the cold background, the ocean temperature in the NINO1 + 2 region and the NINO3 region exhibit a significant negative correlation to the South China pre-flood season, whereas in warm background, they display a significantly positive correlation. The ocean temperature in the NINO4 region is negatively correlated to the rainfall in PFSSC, especially in the cold ocean temperature background. The ocean temperature in the warm pool region is negatively correlated to the rainfall in PFSSC, with no significant relationship with ocean temperature background.
Figure 8. The 21-a moving correlation (histograms) between the rainfall in PFSSC and the equatorial Pacific Ocean temperature in April–June and the 21-a moving average anomaly of the Pacific Ocean temperature (line, unit: °C). The NINO1 + 2 region as (a); NINO3 region as (b); NINO4 region as (c) and the warm pool region as (d).
Atmosphere 07 00005 g008
Since the correlation between the rainfall in PFSSC and the SST is related with the SST background, the differences between the warm background and the cold back ground are further analyzed. Based on Figure 7 and Figure 8, the cold period is before the year 1980, and the warm period is after the year of 1990, and the ten years from 1981 to 1990 are not chosen because the ten years are the decade of transition. In the warm period and the cold period, the typical warm (cold) years are chosen separately (Table 2).
Table 2. The typical years.
Warm YearCold Year
Warm ground1992, 1993, 1997, 19981995, 1996, 1999, 2003
Cold ground1965, 1969, 1972, 19761962, 1964, 1971, 1978
The circulation in the low troposphere is shown in Figure 9. In PFSSC, the ridge of the west Pacific subtropical high is at about 18°N. It is south wind in South China. The southwest wind brings the water vapor from the Indian Ocean, and the southeast wind brings the wet air from the Pacific Ocean to the South China (Figure 9a). The warm year difference results between the warm background and cold background show that, there is a cyclone in South China, and anomalous southeast wind bring the wet air to the key region from the Pacific (Figure 9b). In contrast, under the warm back ground, in the cold years, anomalous north wind control the South China, corresponding to less precipitation (Figure 9c).
Figure 9. The wind at 850 hPa averaged from April to June (a); the wind difference between the warm years during 1991 to 2008 and the warm years during 1958 to 1980 (b); and the wind difference between the cold years during 1991 to 2008 and the cold years during 1958 to 1980 (c) (unit: m·s−1).
Atmosphere 07 00005 g009

5. Conclusions

The rainfall in the South China pre-flood season in the last 50 years has exhibited significant interannual and interdecadal oscillations. The rainfall in PFSSC displays a cycle of 4a and 8a. The 8a cycle is primarily in 1959–1978 and 1990–2008 and the 4a cycle is primarily found between 1990 and 2008.
In the high precipitation years of PFSSC, the SST of the Eastern China ocean in January–March is positive, and the temperature of the South China Sea in April–June is positive anomaly, and the warm pool temperature is negative anomaly in January–March and April–June. Interannual correlation analysis reveals that rainfall in PFSSC exhibits a significantly negative correlation to the warm pool temperature in the early period and the same period, which also displays a significantly positive correlation with the South China Sea temperature in April–June. The decadal correlation analysis reveals that rainfall in PFSSC demonstrates a significantly negative correlation to the warm pool temperature in both the early and the same period, which shows a significantly positive correlation with the Middle East Pacific Ocean.
The relationship between the rainfall in PFSSC and the ocean temperature is different when the ocean temperature backgrounds are different. In the warm background, the ocean temperature of the NINO1 + 2 and NINO3 regions from January–March displays a significantly positive correlation to rainfall during the South China pre-flood season; in the cold background, the correlation between the two is not significant. The correlation in the same period indicates that the ocean temperature and rainfall in PFSSC for the NINO1 + 2 and NINO3 regions are significantly negatively correlated in the cold background; in the warm background, a significant positive correlation is found. For the NINO4 region in the cold background, the ocean temperature and rainfall in PFSSC displays a significantly negative correlation. For the warm pool region, the correlation between the rainfall in PFSSC and the SST in January–March and April–June appeares to show a significantly negative correlation, which is not related to the ocean temperature backgrounds. Under the different SST backgrounds, the interannual variation of SST will bring different atmospheric response. When the SST background is warm, the increase of SST causes the anomalous south wind in the South China compared to that under the cold SST background. Thus, under the background of global warming, more attention should be given to study the rainfall in PFSSC and its correlation with the SST in the east tropical Pacific.

Acknowledgments

This work was supported by the program of KLME1308, the Scientific Research Foundation for the Returned Overseas Chinese Scholars, State Education Ministry 2015s009, and the 973 project 2015CB4532.

Author Contributions

All authors were involved in designing and discussing the study. Suxiang Yao undertook the data analysis and drafted the manuscript. Qian Huang and Chen Zhao collected required data, and drew some of the maps. In addition, Qian Huang revised the manuscript. All authors have read and approved the final manuscript.

Conflicts of Interest

The authors declare no conflict of interest.

References

  1. Ma, H.; Chen, Z.H.; Mao, W.S.; Wang, Q.Q. Analysis of precipitation in the annually in the annually first rainy period and general circulation in the south of China. J. Trop. Meteor. 2009, 25, 89–96. [Google Scholar]
  2. Qiang, X.M.; Yang, X.Q. Onset and end of the first rainy season in south China. Chin. J. Geophys. 2008, 51, 1333–1345. [Google Scholar] [CrossRef]
  3. Ding, J.L.; Xu, Z.S.; Fei, J.F.; Qiang, X.M. Analysis of the definition of the onset and ending dates of the annually first rainy season in south China and its interannual variation characteristics. J. Trop. Meteor. 2009, 25, 59–65. [Google Scholar]
  4. Ma, H.; Wang, Q.Q.; Chen, Z.H. Spatial and temporal variations in pre-summer flood period precipitation of South China. Plateau Meteor. 2006, 25, 326–329. [Google Scholar]
  5. Wu, Z.; Jiang, W.Z.H.; He, J.H. The summer drought-flood coexistence in the middle and lower reaches of the Yantze River and analysis of its air-sea background feathers in anomalous years. Chin. J. Atmos. Sci. 2006, 30, 391–401. [Google Scholar]
  6. Zhang, Y.; Sun, Z.B.; Bai, Y.Y. Drought/flood characteristics of pre-flood season in South China in recent 47 years. J. Nanjing Inst. Meteor. 2008, 31, 176–182. [Google Scholar]
  7. Wu, S.S.; Liang, J.Y. Temporal and spatial characteristics of the drought and flood during the rainy season in South China. J. Trop. Meteor. 1992, 8, 87–92. [Google Scholar]
  8. Xin, F.; Xiao, Z.N.; Li, Z.C. Relation between flood season precipitation anomalies in South China and East Asian atmospheric low frequency oscillation in 1997. Meteor. Mon. 2007, 33, 22–30. [Google Scholar]
  9. Huang, X.X.; Yan, L.J.; Shi, N. Influence factors and precidition method on flood/drought during the first rainy season in South China. J. Trop. Meteor. 2006, 22, 431–438. [Google Scholar]
  10. Chen, M.; Tao, Z.Y.; Zheng, Y.G. The front-related vertical circulation occurring in the pre-flooding season in South China and its interaction with MCS. Acta Meteor. Sin. 2007, 65, 785–791. [Google Scholar]
  11. Huang, X.D.; Zheng, W.J. Mutiple temporal scale feature of coupled relationship between rainfall in first flood season of South China and 500 hPa height. Meteor. Mon. 2005, 31, 35–38. [Google Scholar]
  12. Ma, H.; Chen, Z.H.; Jiang, L.P.; Wang, Q.Q. SVD analysis between the annually first raining period precipitation in the south if China and the SST over offshore waters in China. J. Trop. Meteor. 2009, 25, 242–245. [Google Scholar]
  13. Chen, Y.M.; Qian, Y.F. Numerical study of influence of the SSTA in western pacific warm pool on precipitation in the first flood period in South China. J. Trop. Meteor. 2005, 21, 13–23. [Google Scholar]
  14. Yao, S.X.; Zhang, Y.C. Correlation between precipitation in the Yangtze-Huaihe River valley during Meiyu period and sea surface temperature in the Pacific Ocean and their interdecadal variations. J. Nanjing Univ. 2006, 42, 298–308. [Google Scholar]

