
Multi-Scale Observations of Atmosphere Environment and Aerosol Properties over North China during APEC Meeting Periods

 , ,
, ,
Abstract
:1. Introduction
2. Experimental Section
2.1. Ground Observations and Meteorological Data
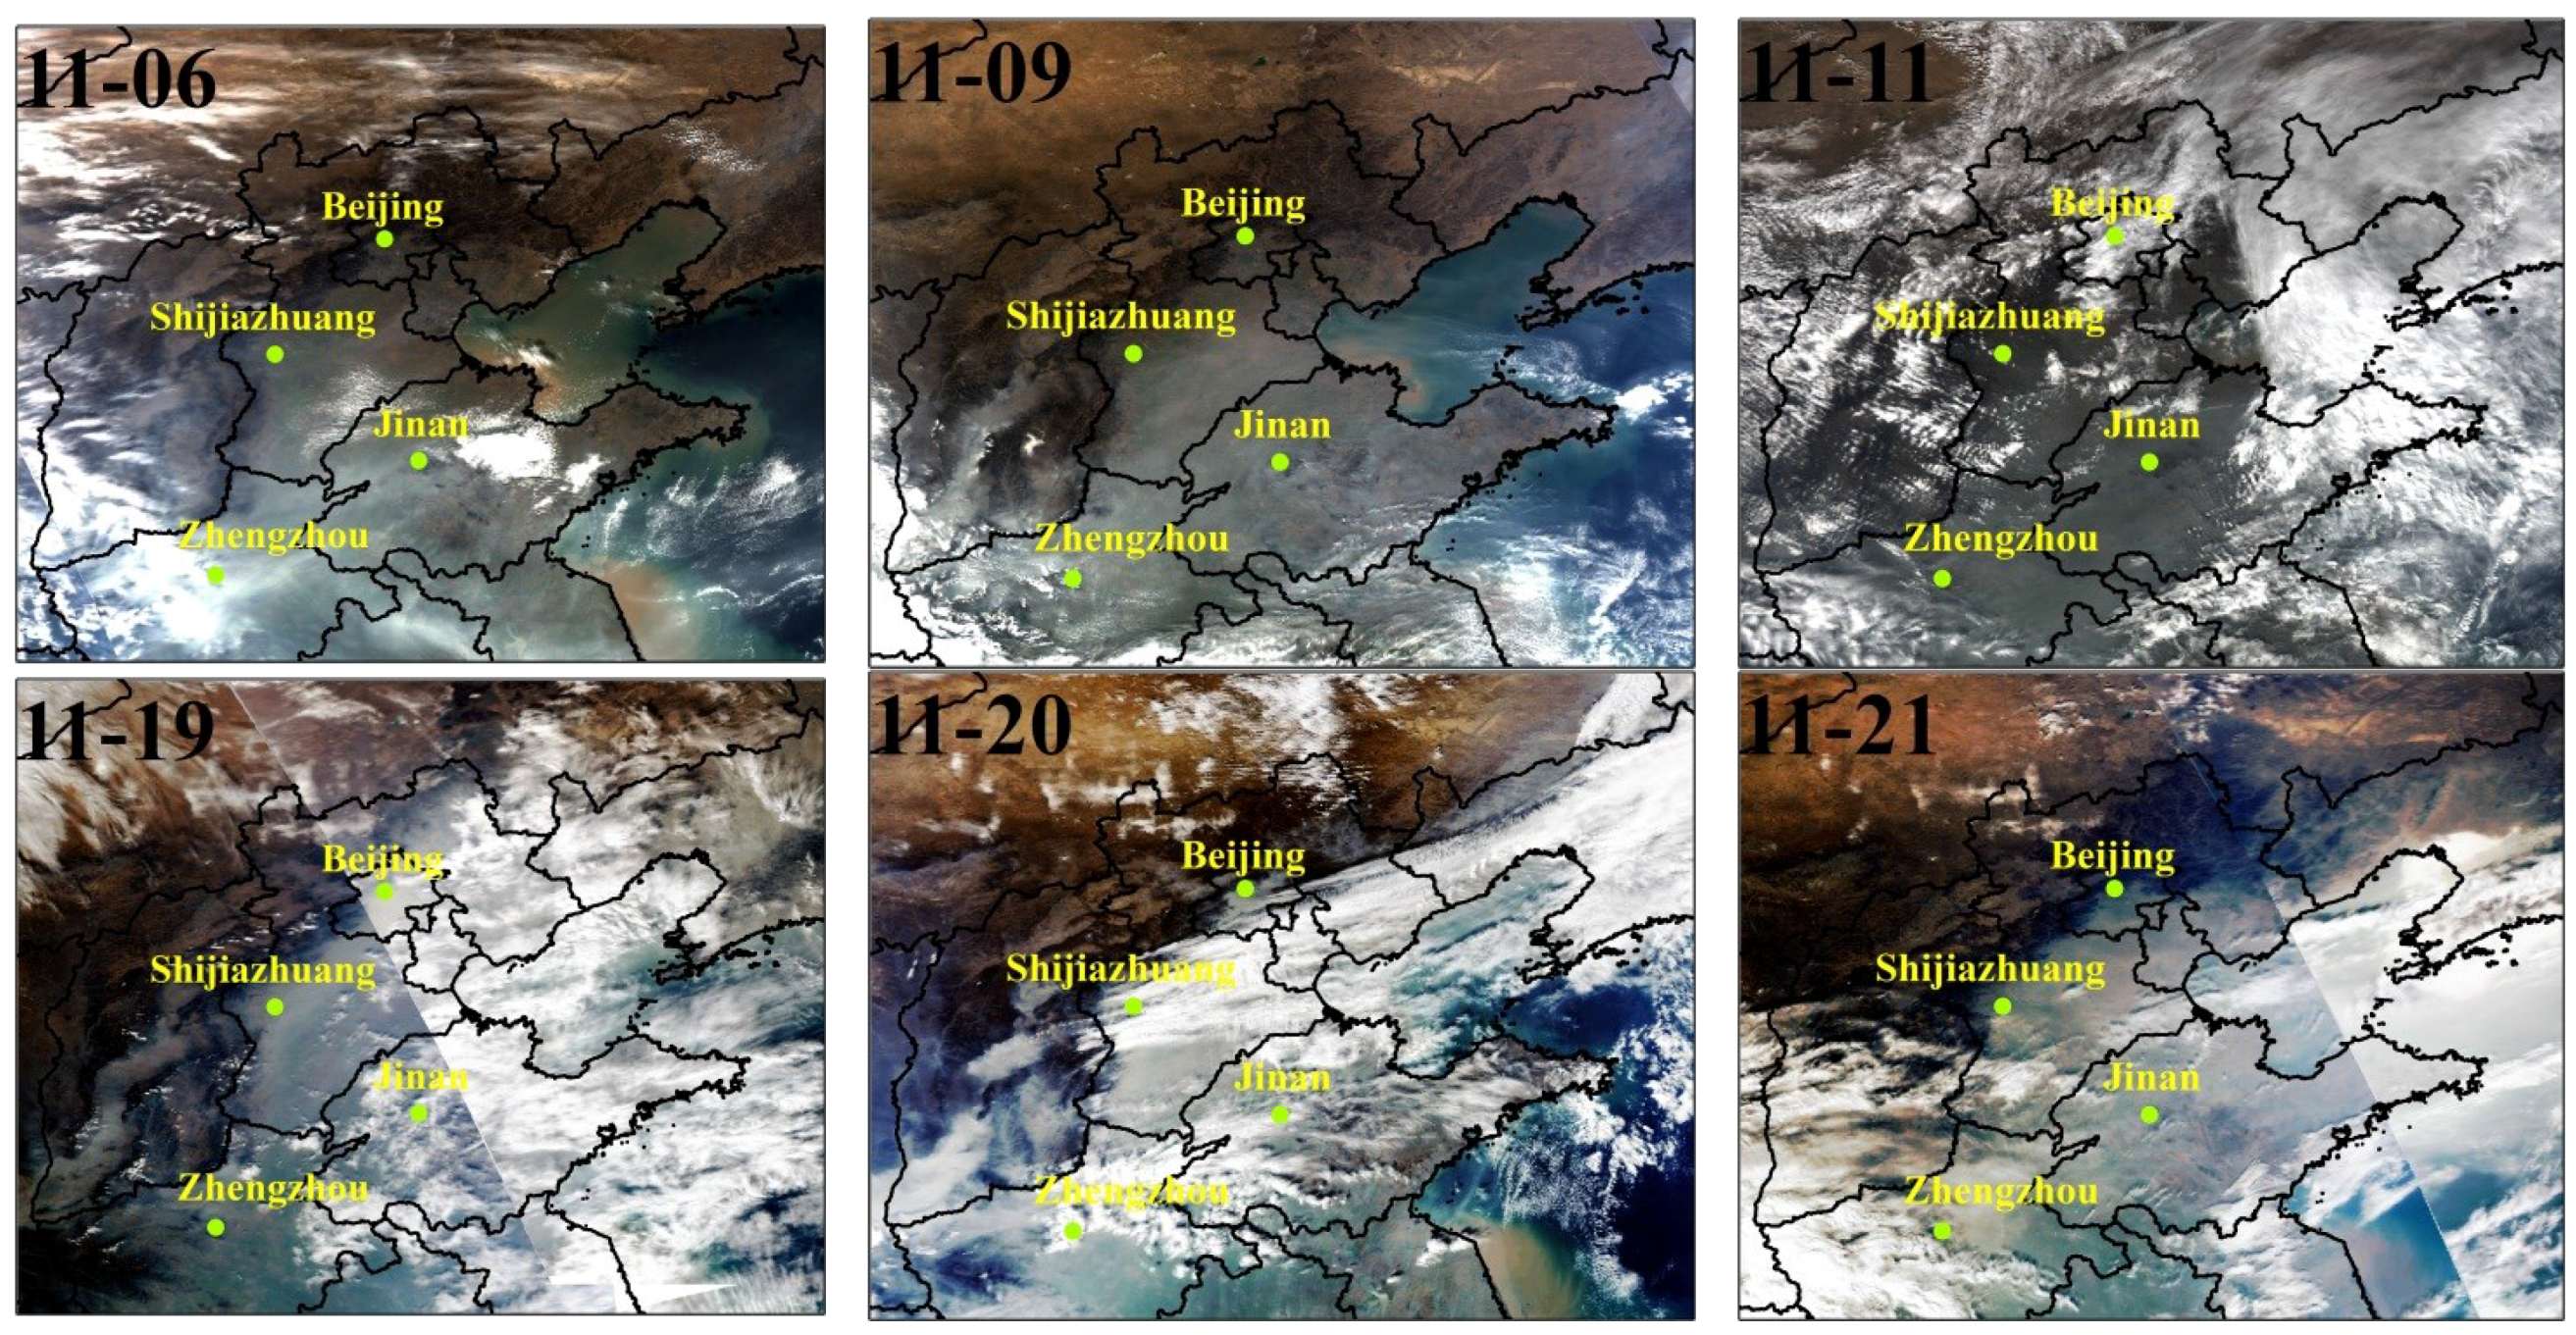
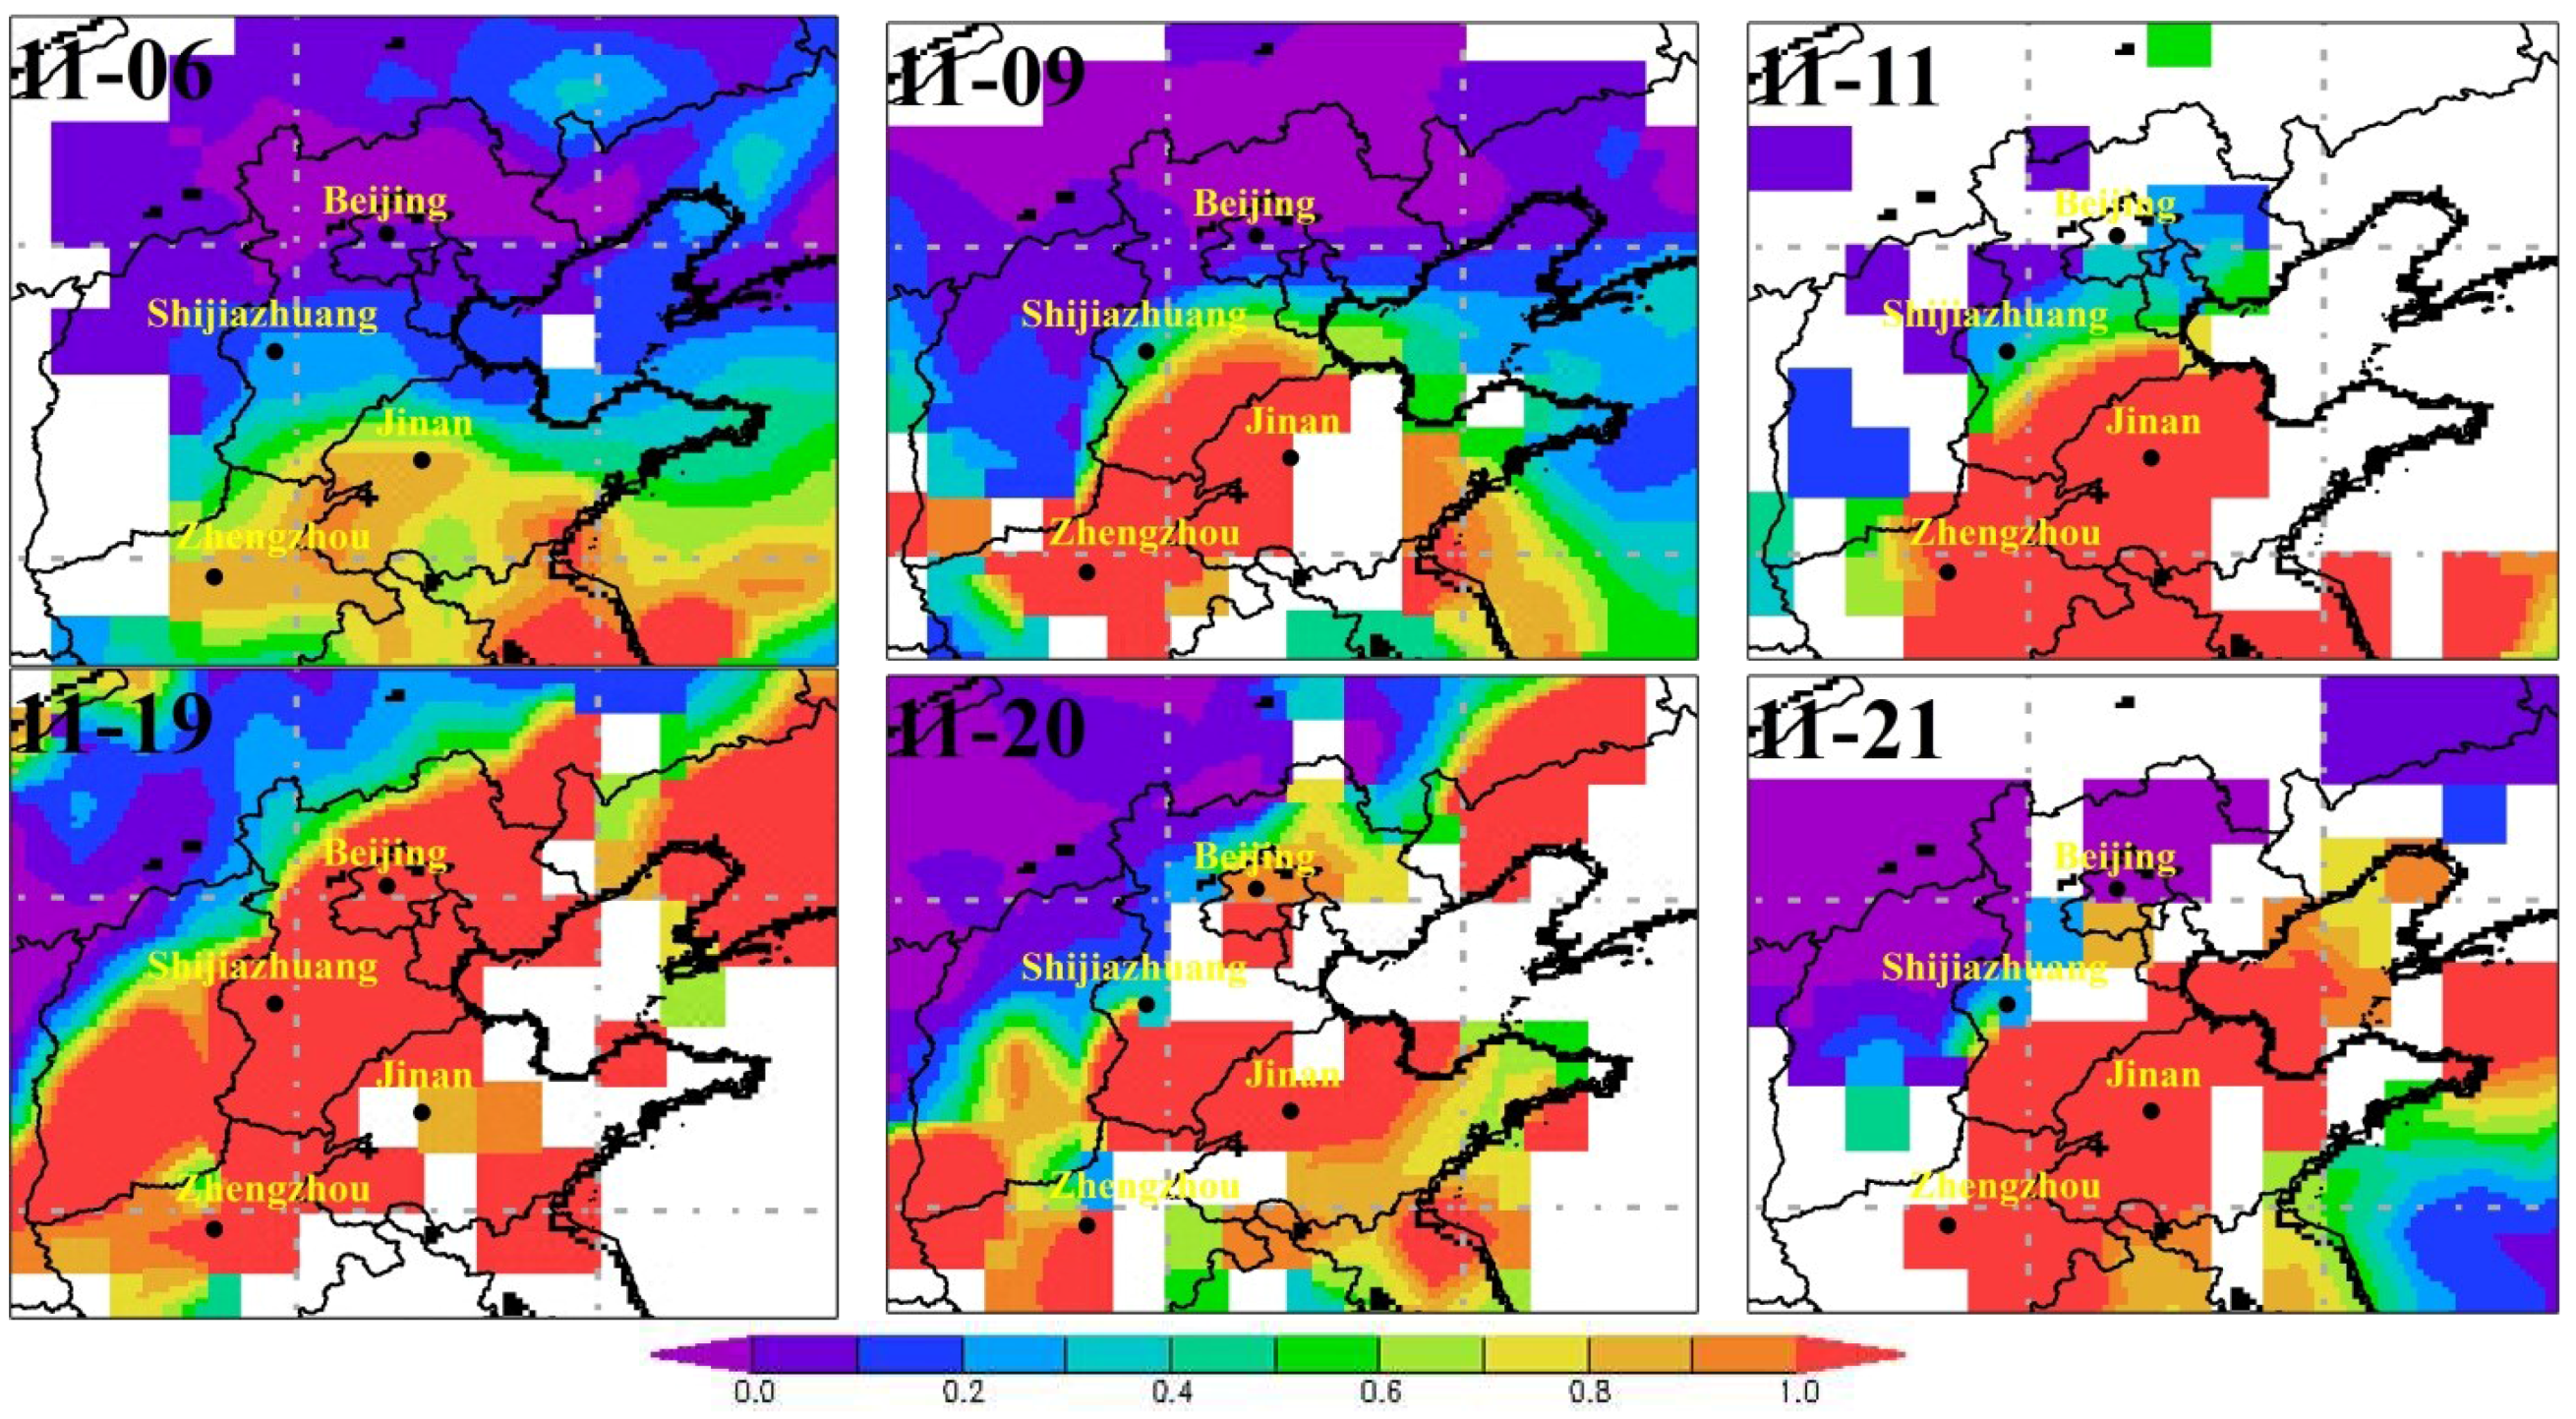
2.2. Satellite Data Sets

| Datasets | Parameters | Spatial Resolution | Band | Date |
|---|---|---|---|---|
| MODIS | true color | 0.01° | 0.459–0.479 nm 0.545–0.565 nm 0.620–0.670 nm | 11/6, 9, 11, 19–21 |
| AOD | 1° | 550 nm | ||
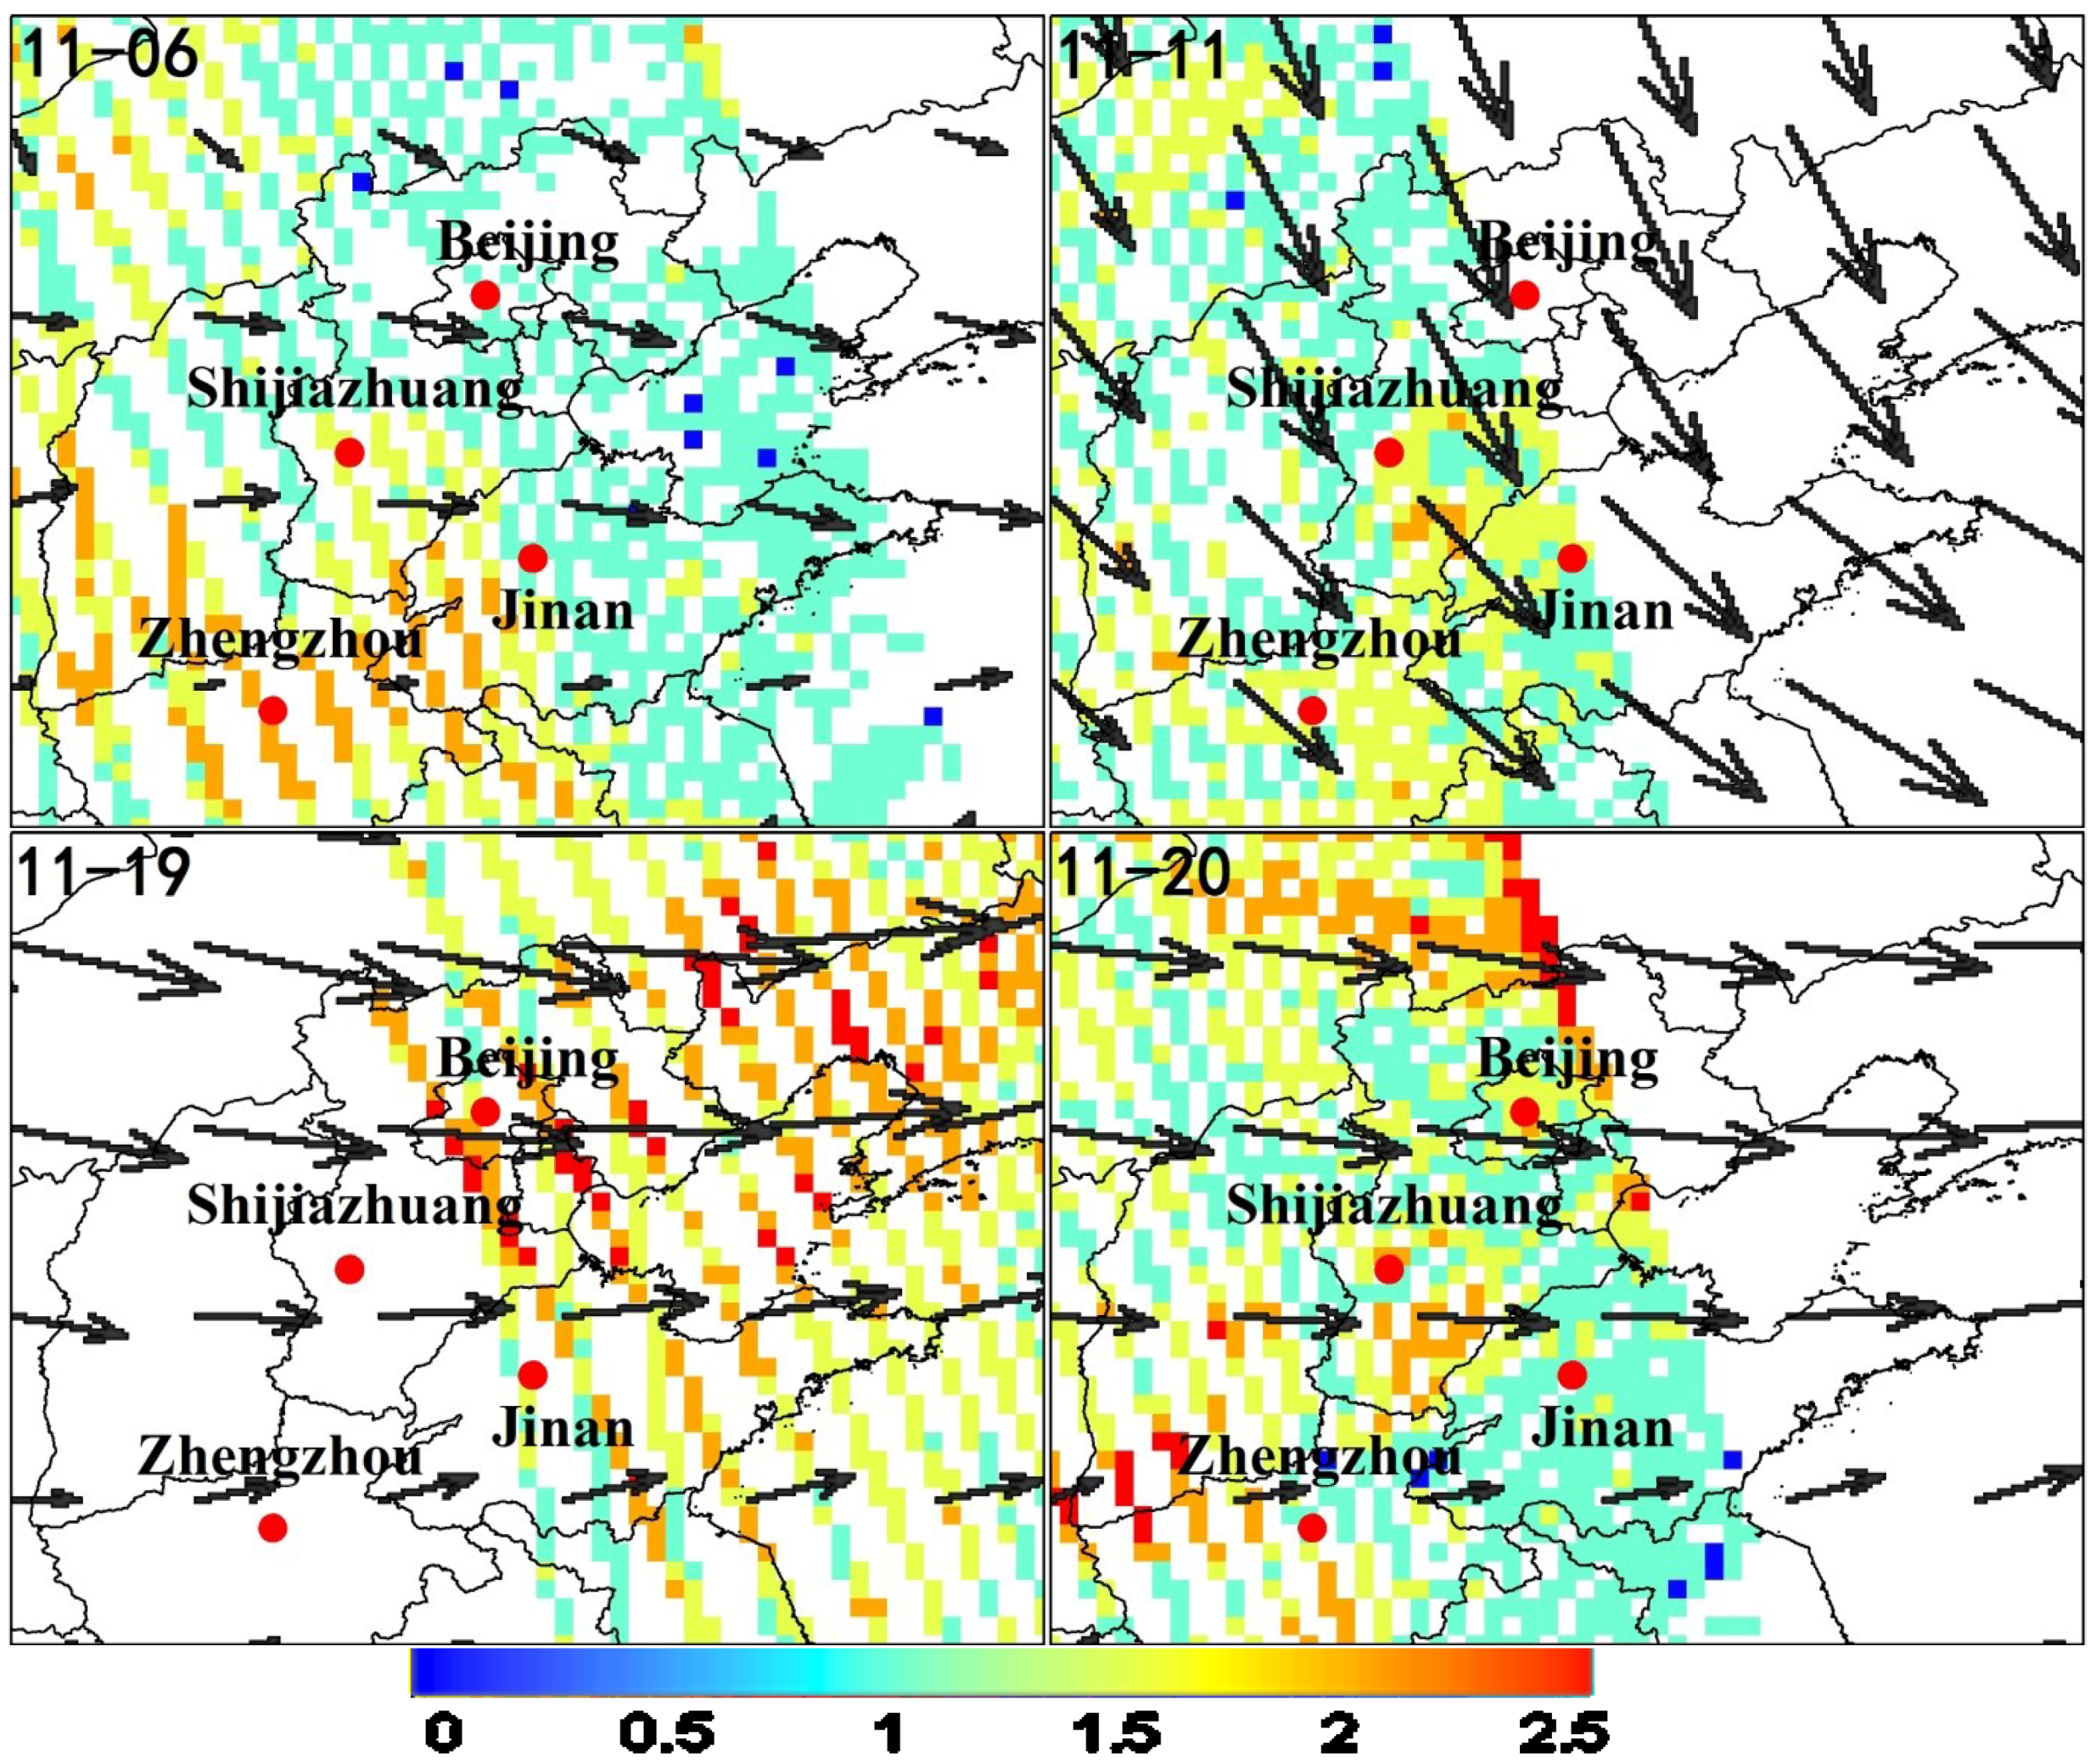
| OMI | UVAI | 0.25° | Near-UV | 11/6, 11, 19, 20 |
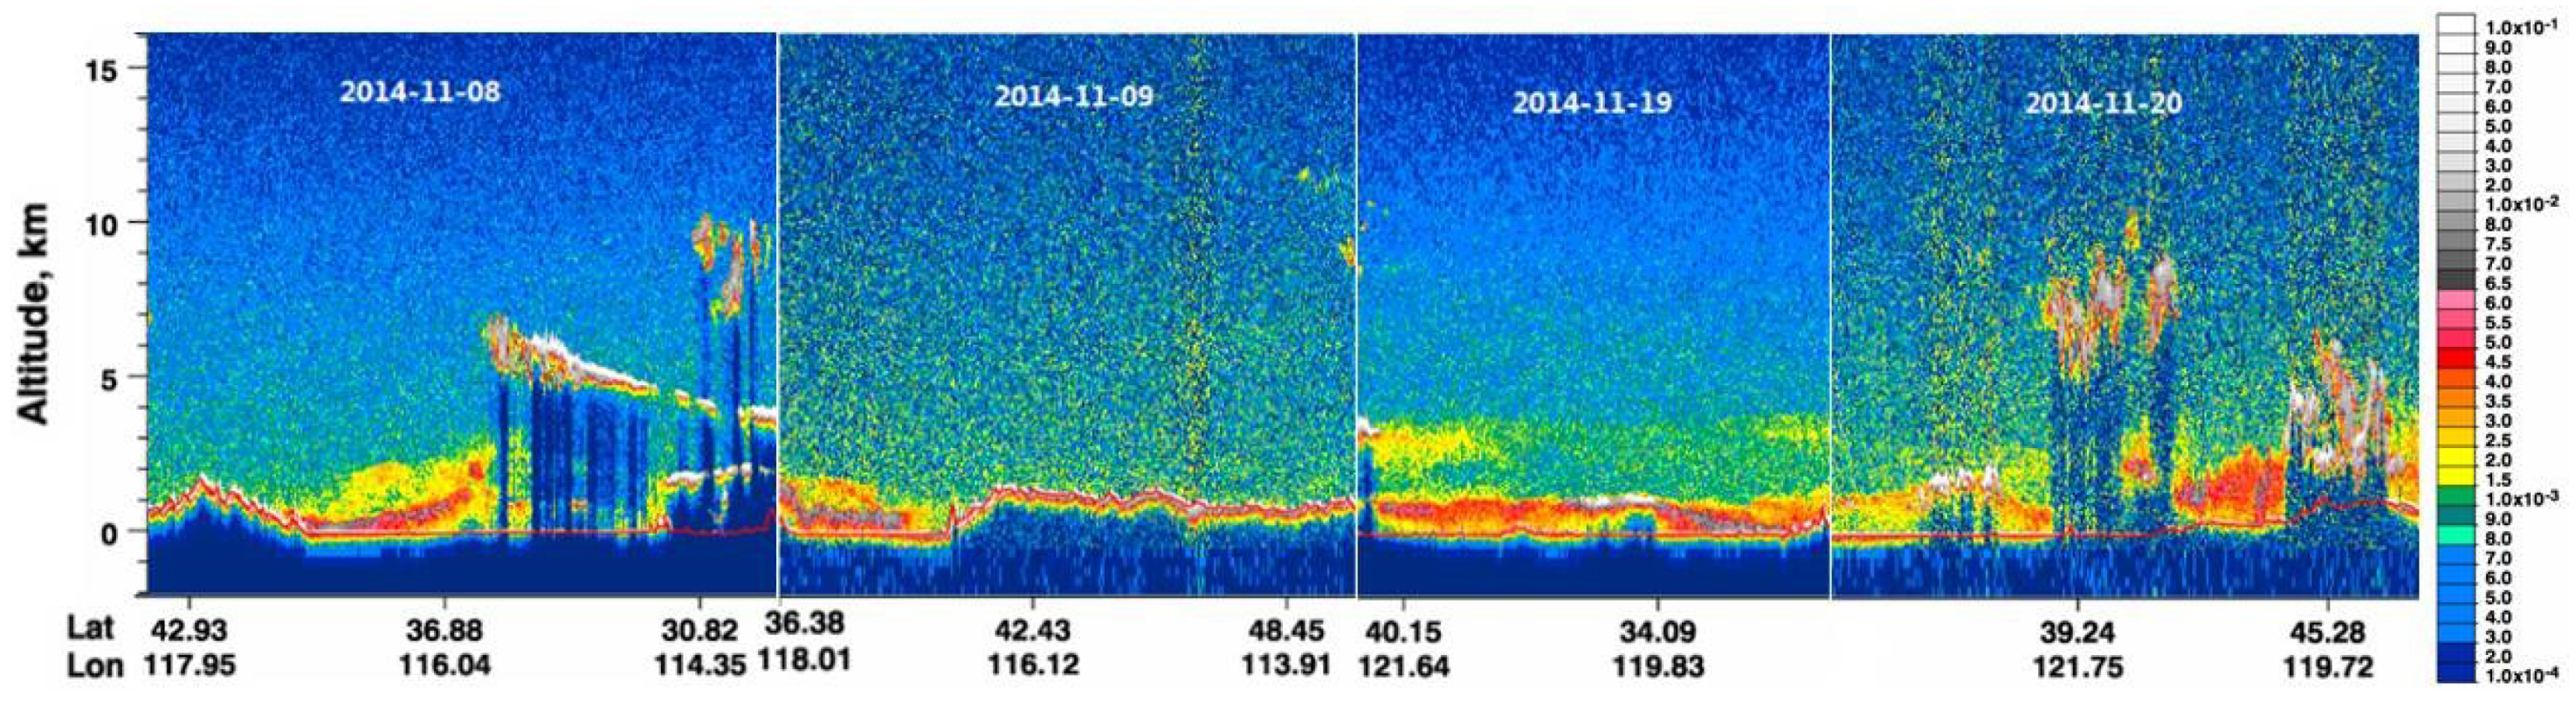
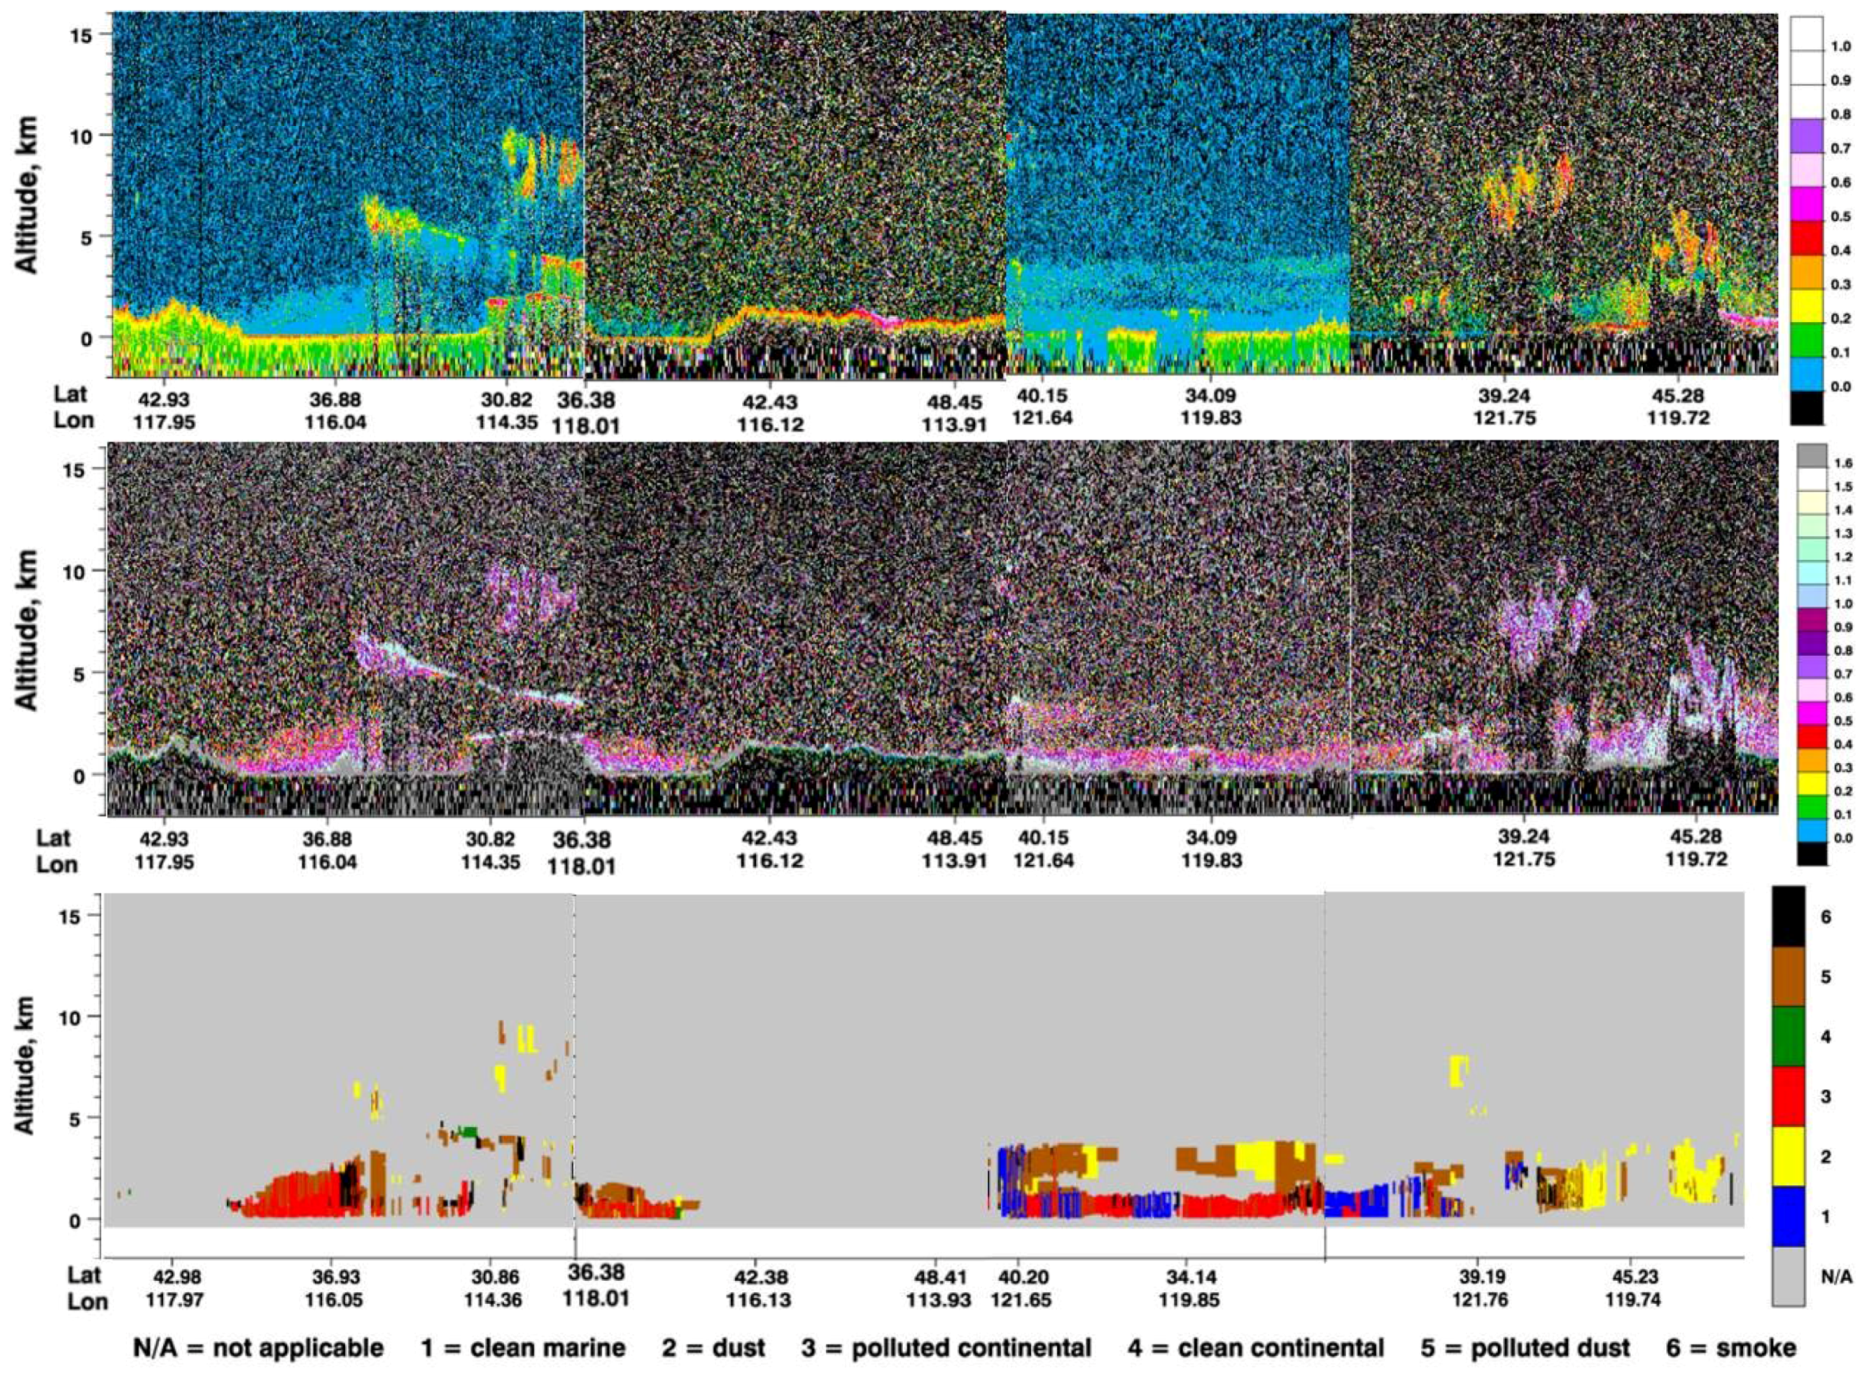
| CALIPSO | Aerosol Subtype | 2.5° | 11/8, 9, 19, 20 | |
| Total Attenuated Backscatter | 2.5° | 532 nm | ||
| AERONET NCEP Meteorological stations Air condition | Depolarization Ratio Attenuated Color Ratio SSA Size distribution Wind fields RH(Relative Humidity) Vertical temperature PM2.5, PM10, SO2, NO2 | 2.5° 2.5° | 1064 nm/532 nm 441/674/870/1020 nm | 11/6, 9, 18–21 11/6, 9, 11, 19–21 11/6, 9, 11, 19–21 11/1–23 |
3. Results and Discussion
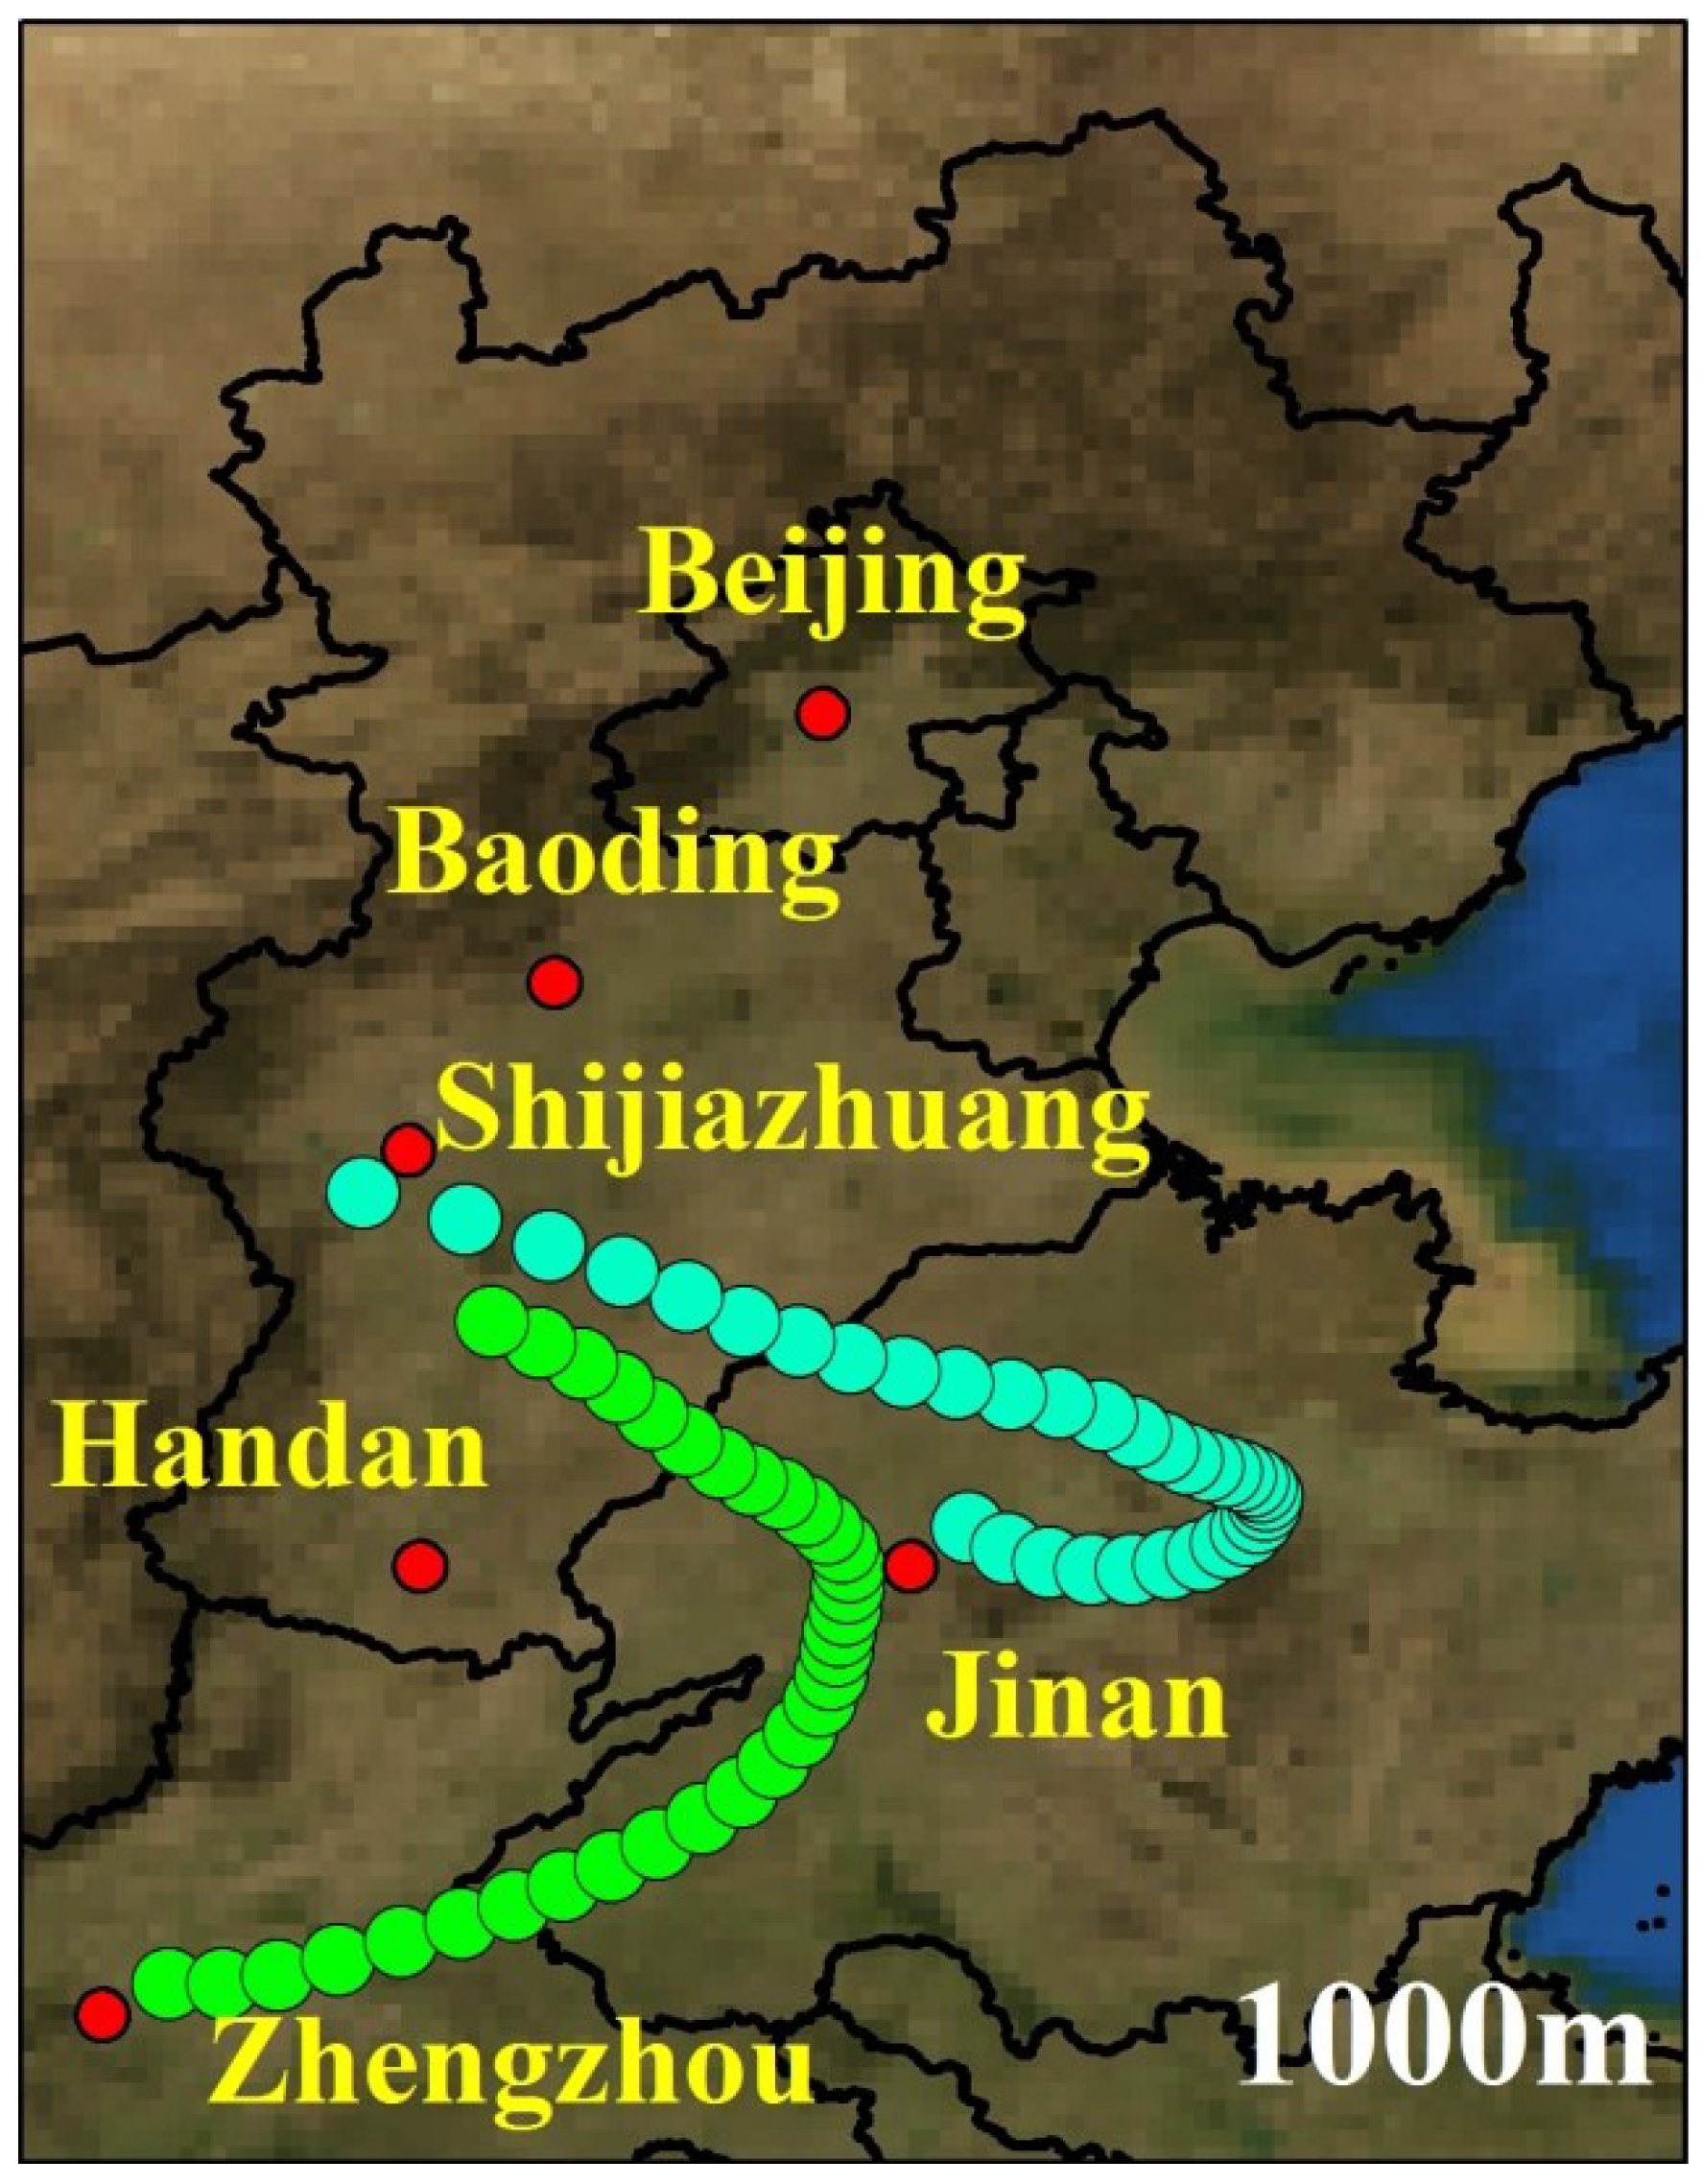
3.1. Variations of Aerosol Pollution Particles over North China around the APEC Periods
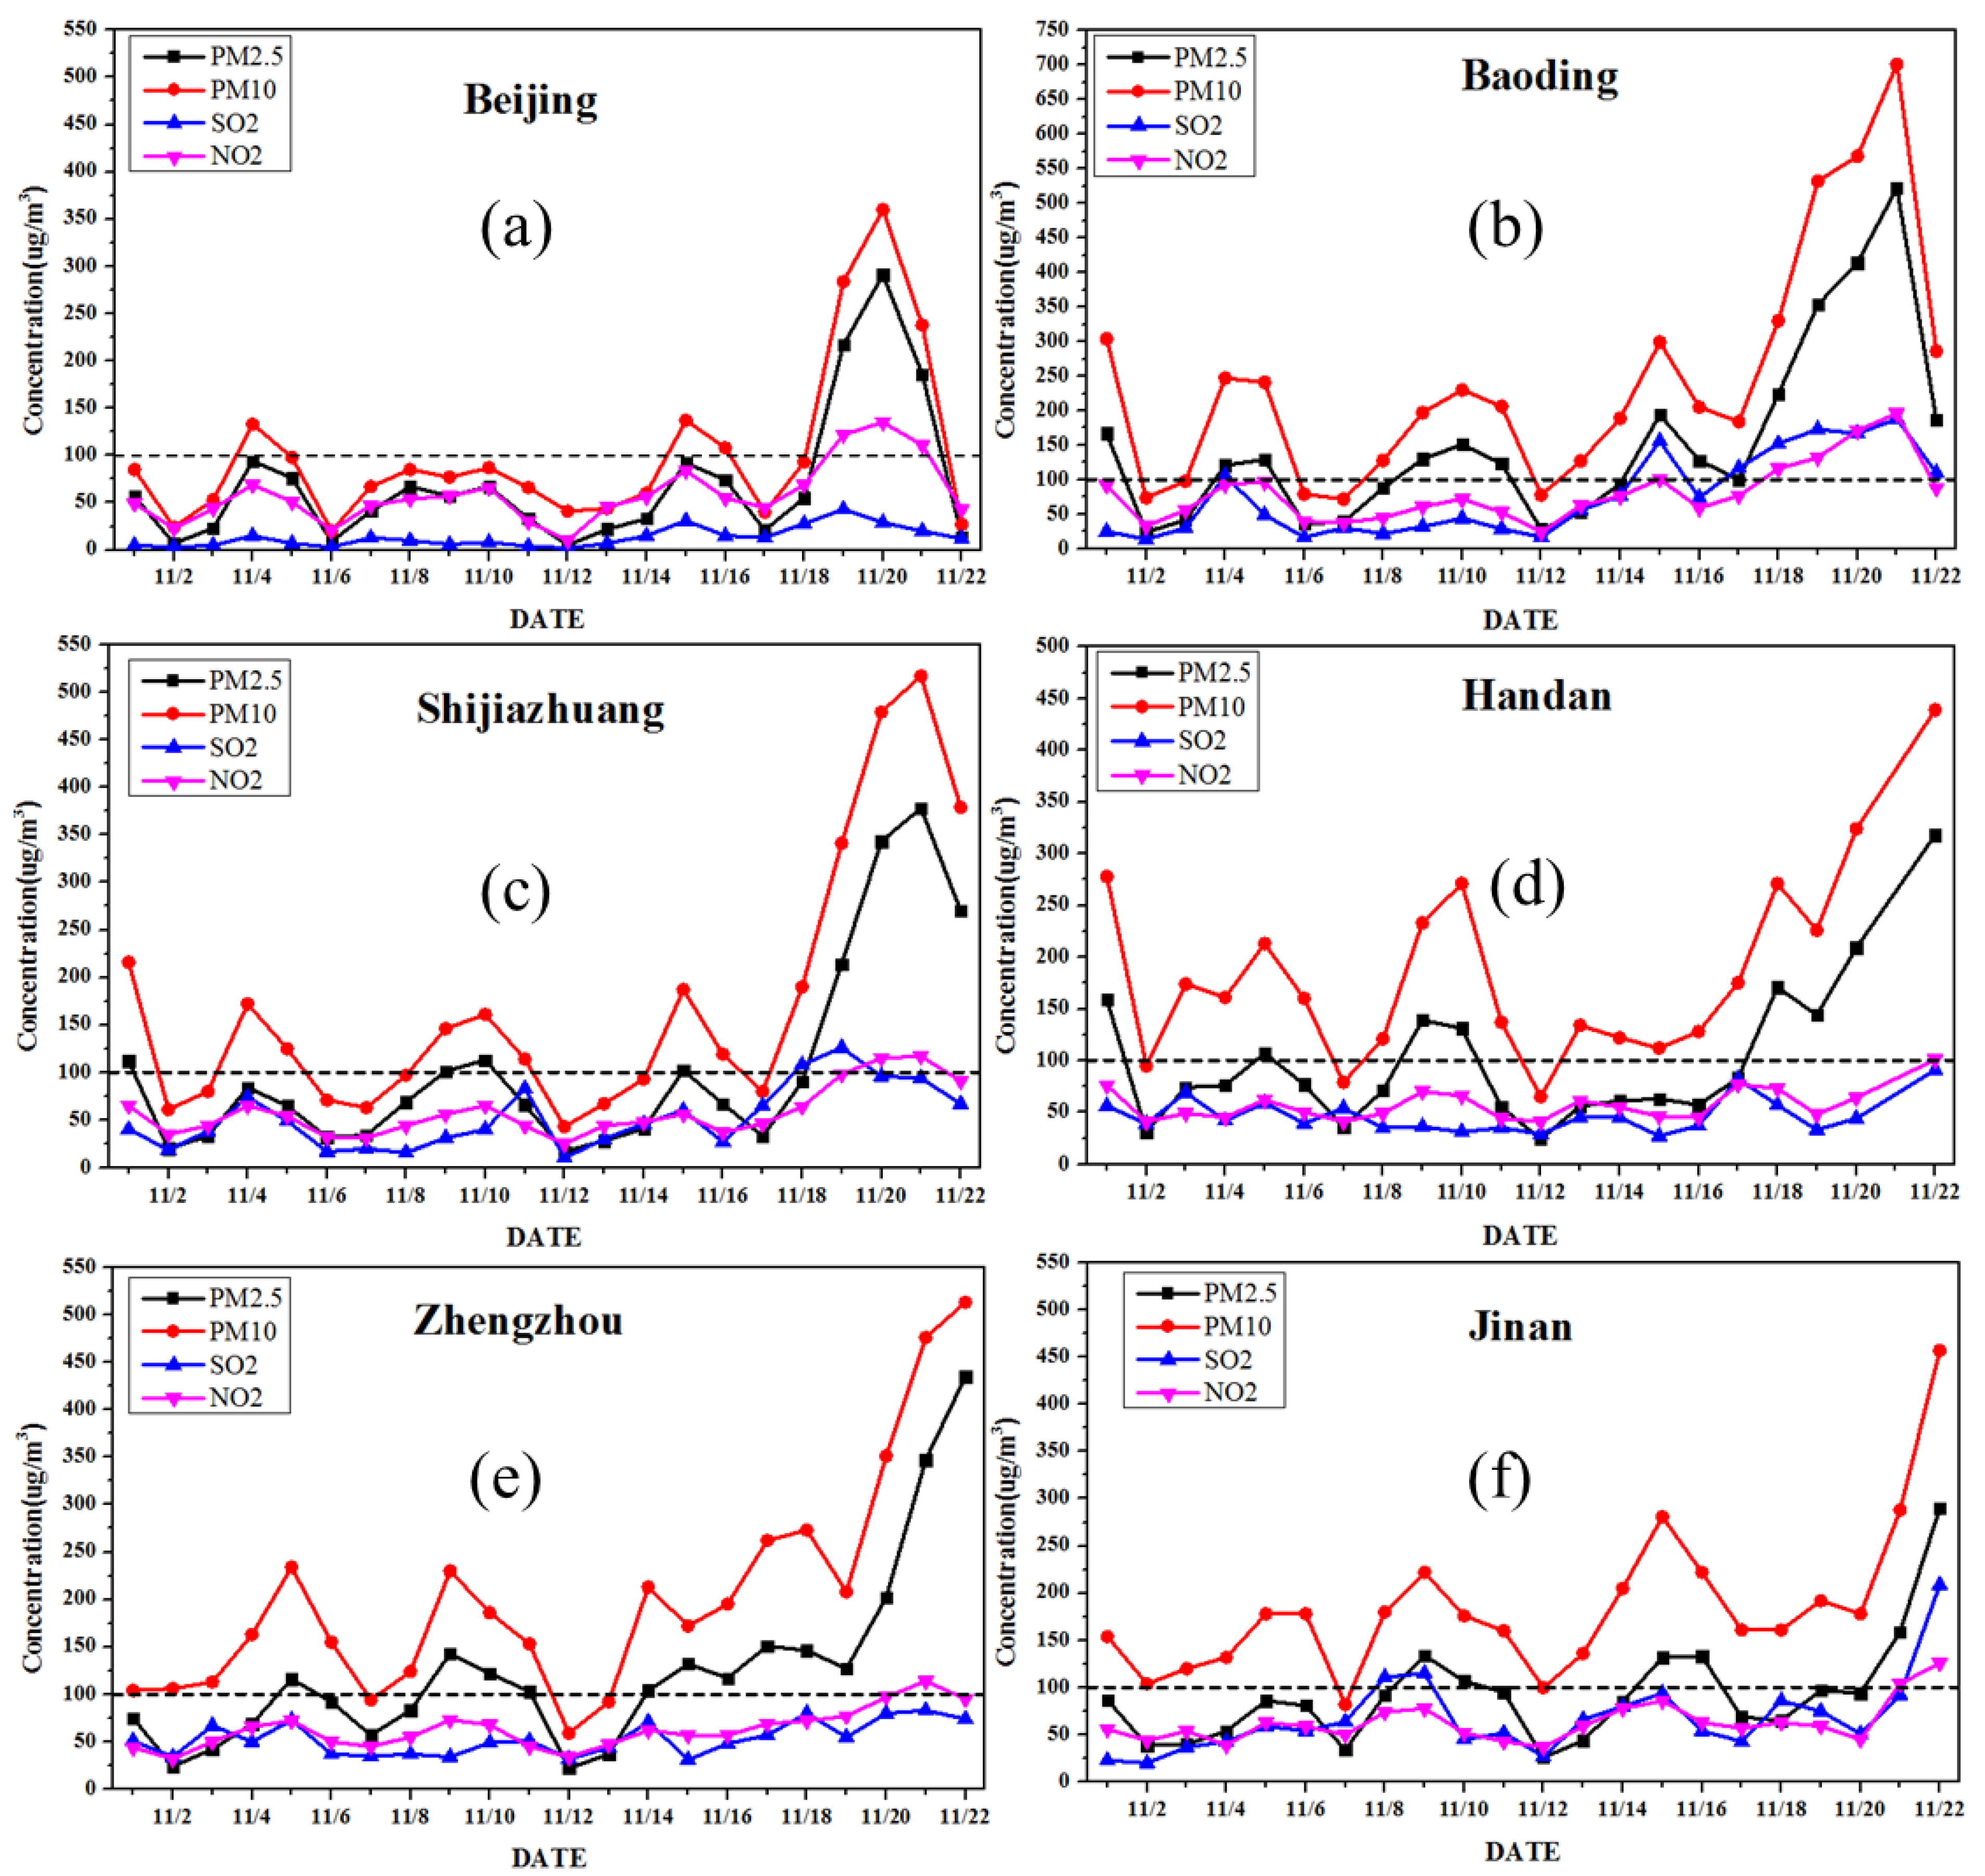
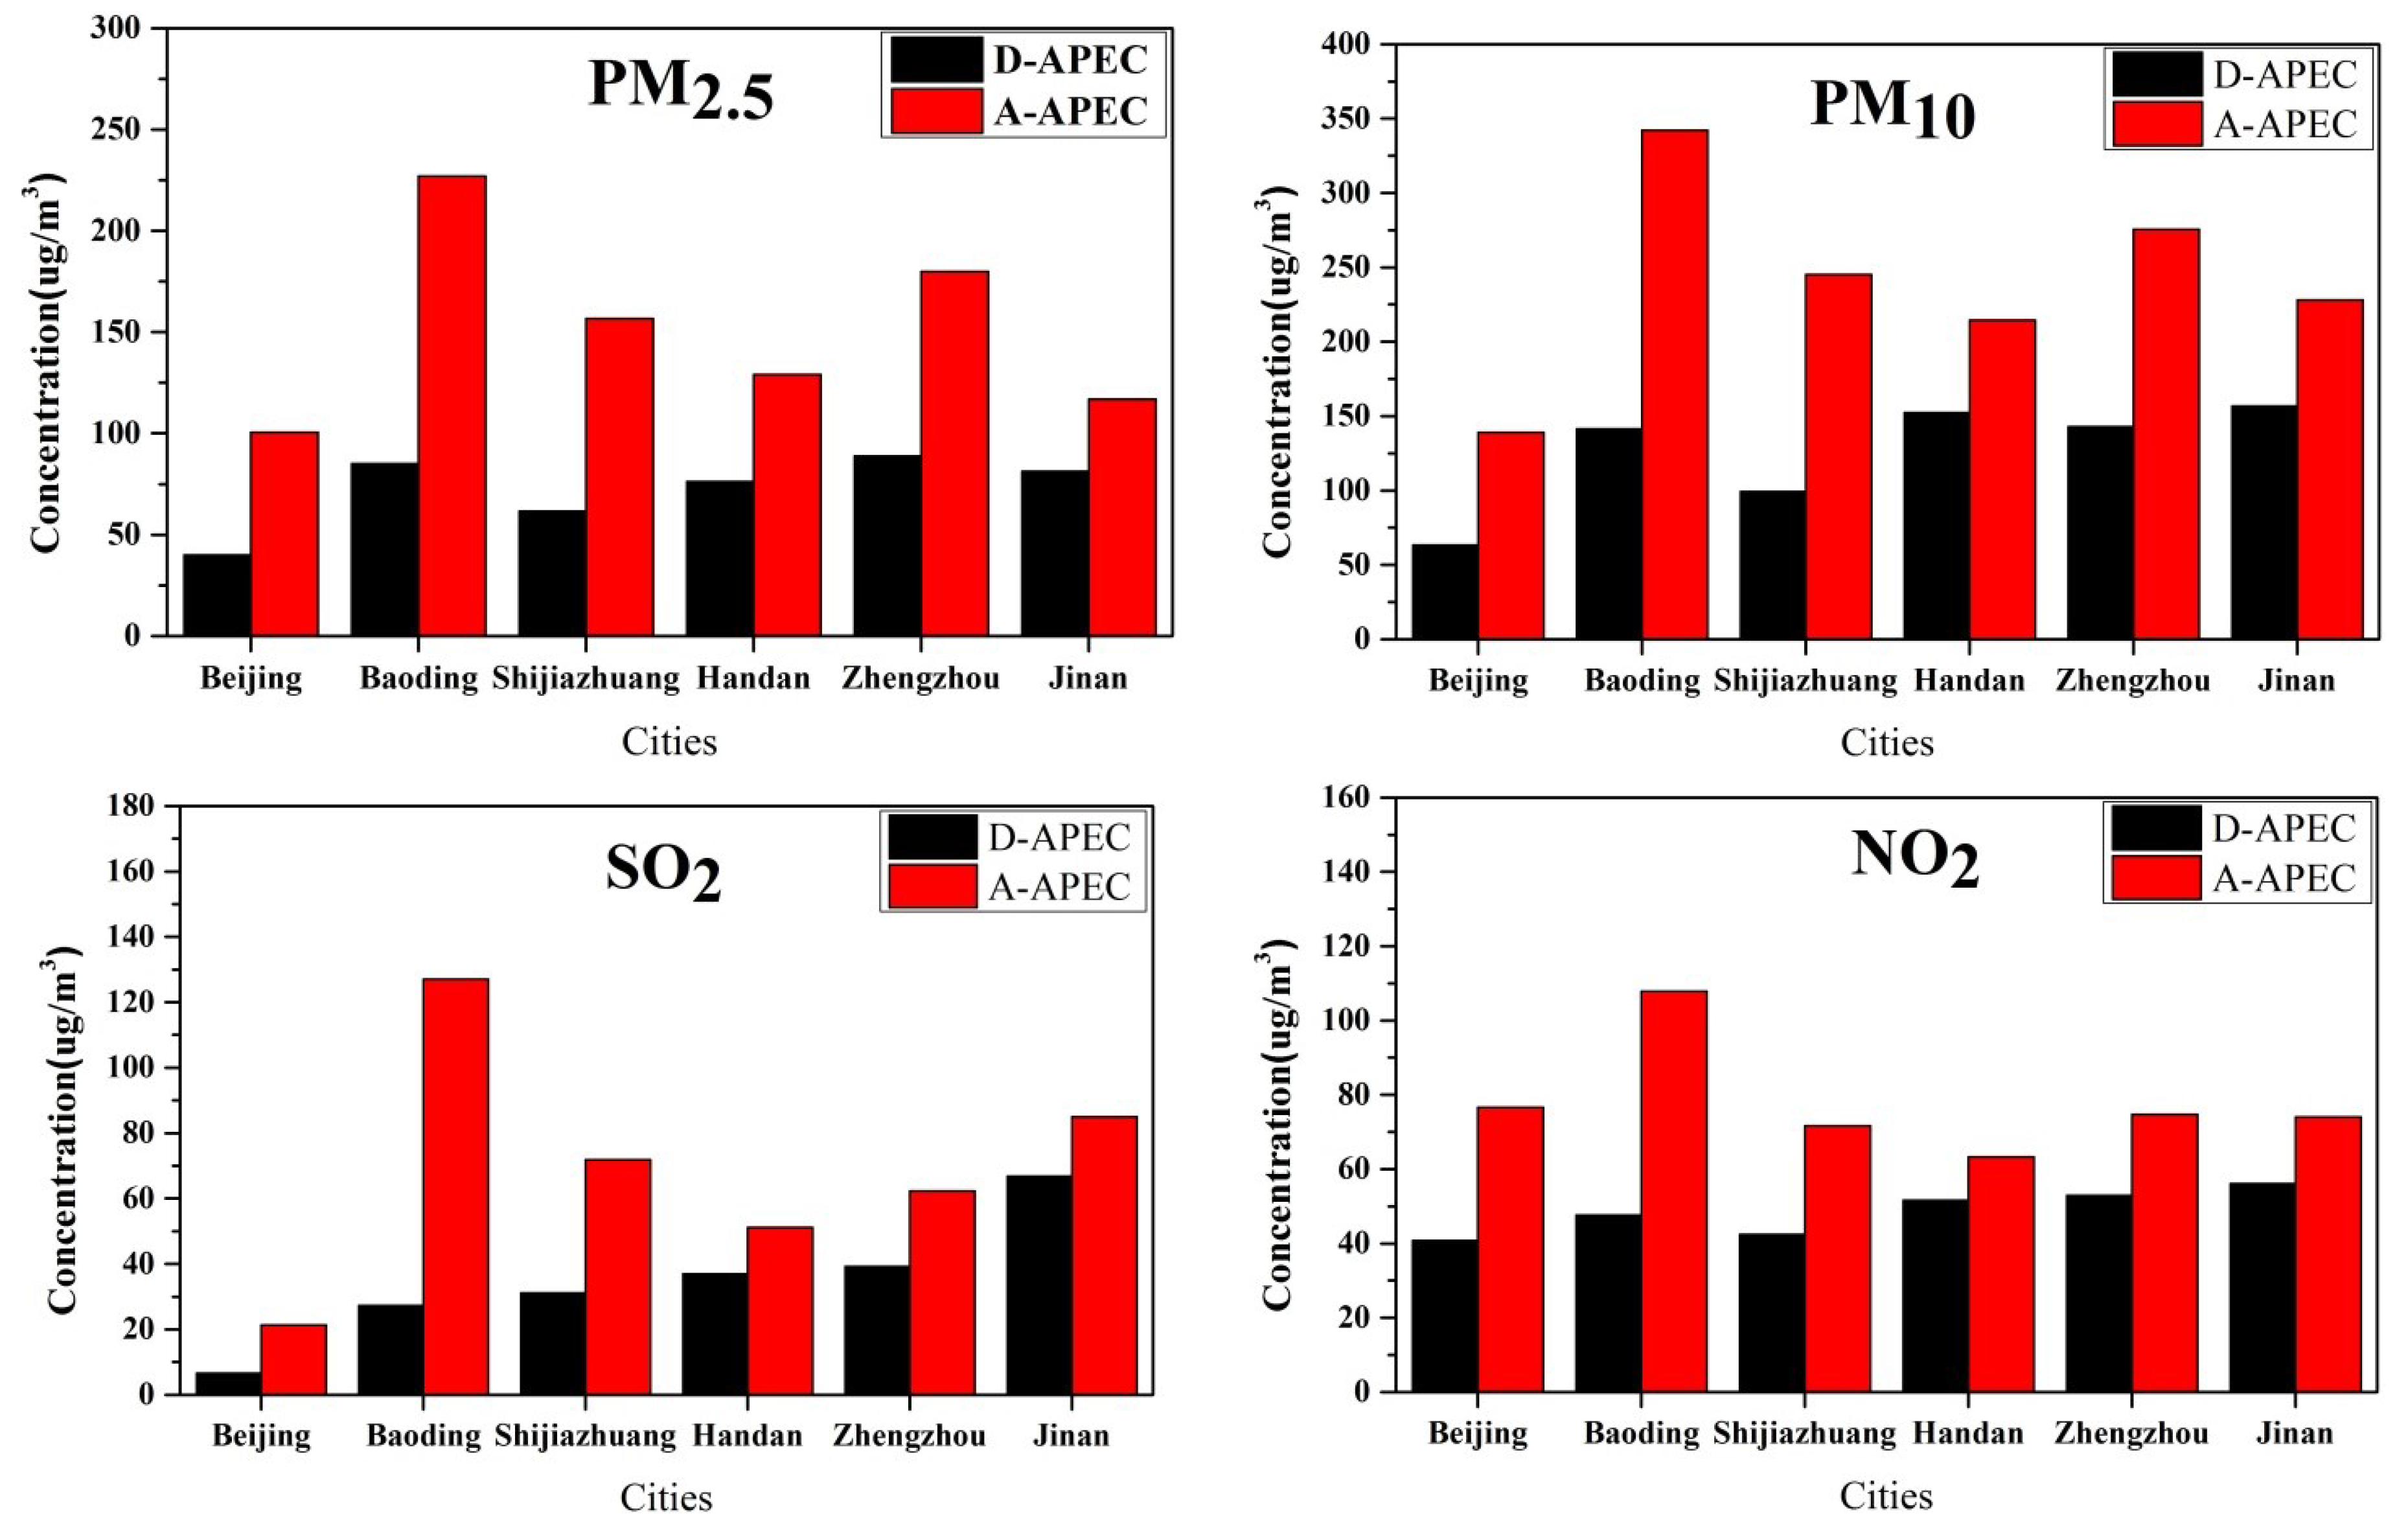
3.1.1. Concentrations of Pollution Particles in Several Major Cities

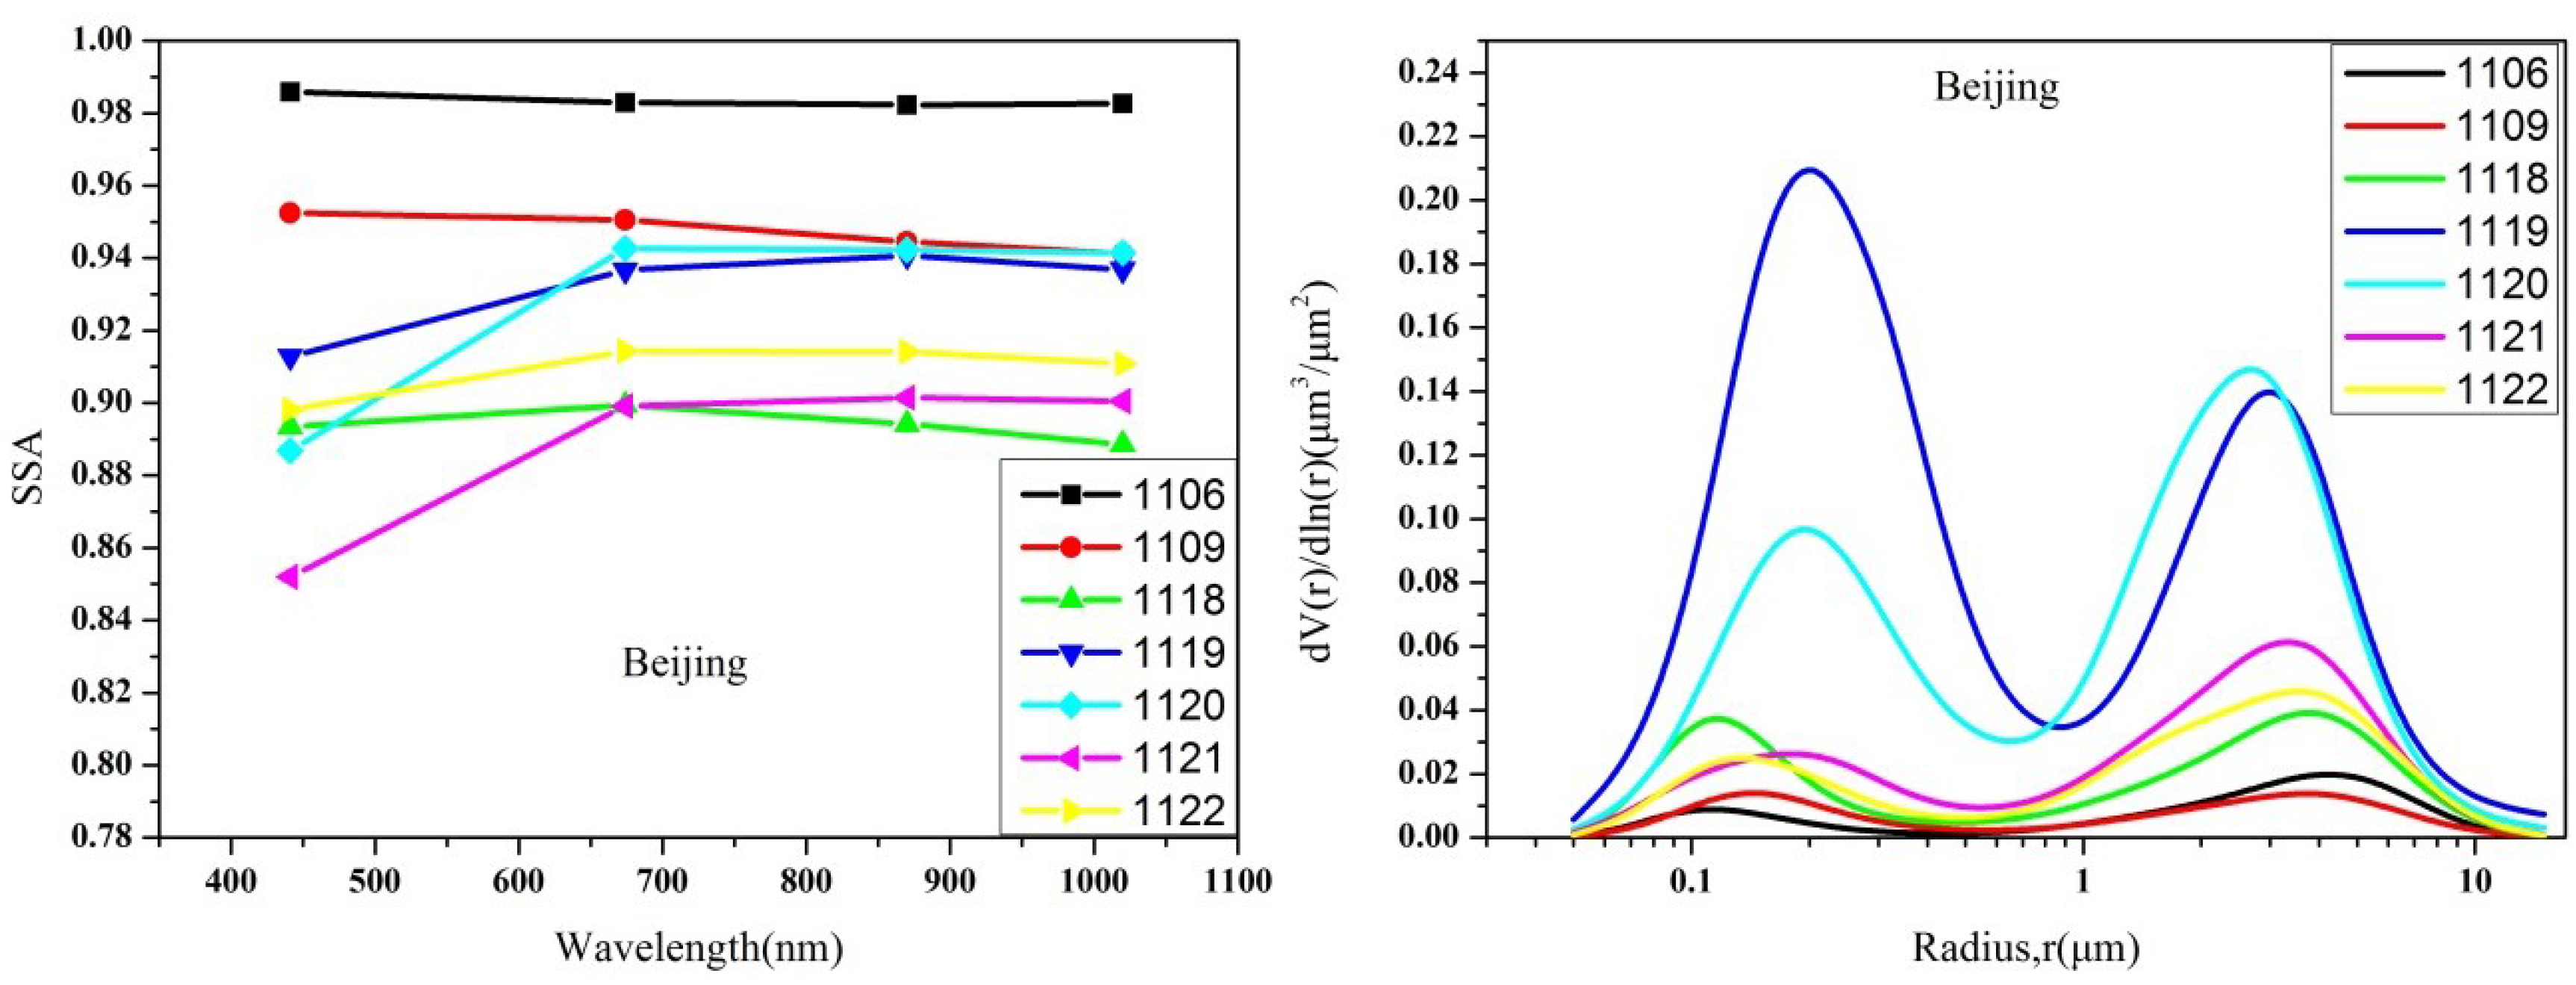
3.1.2. Variations of Optical and Physical Properties over North China

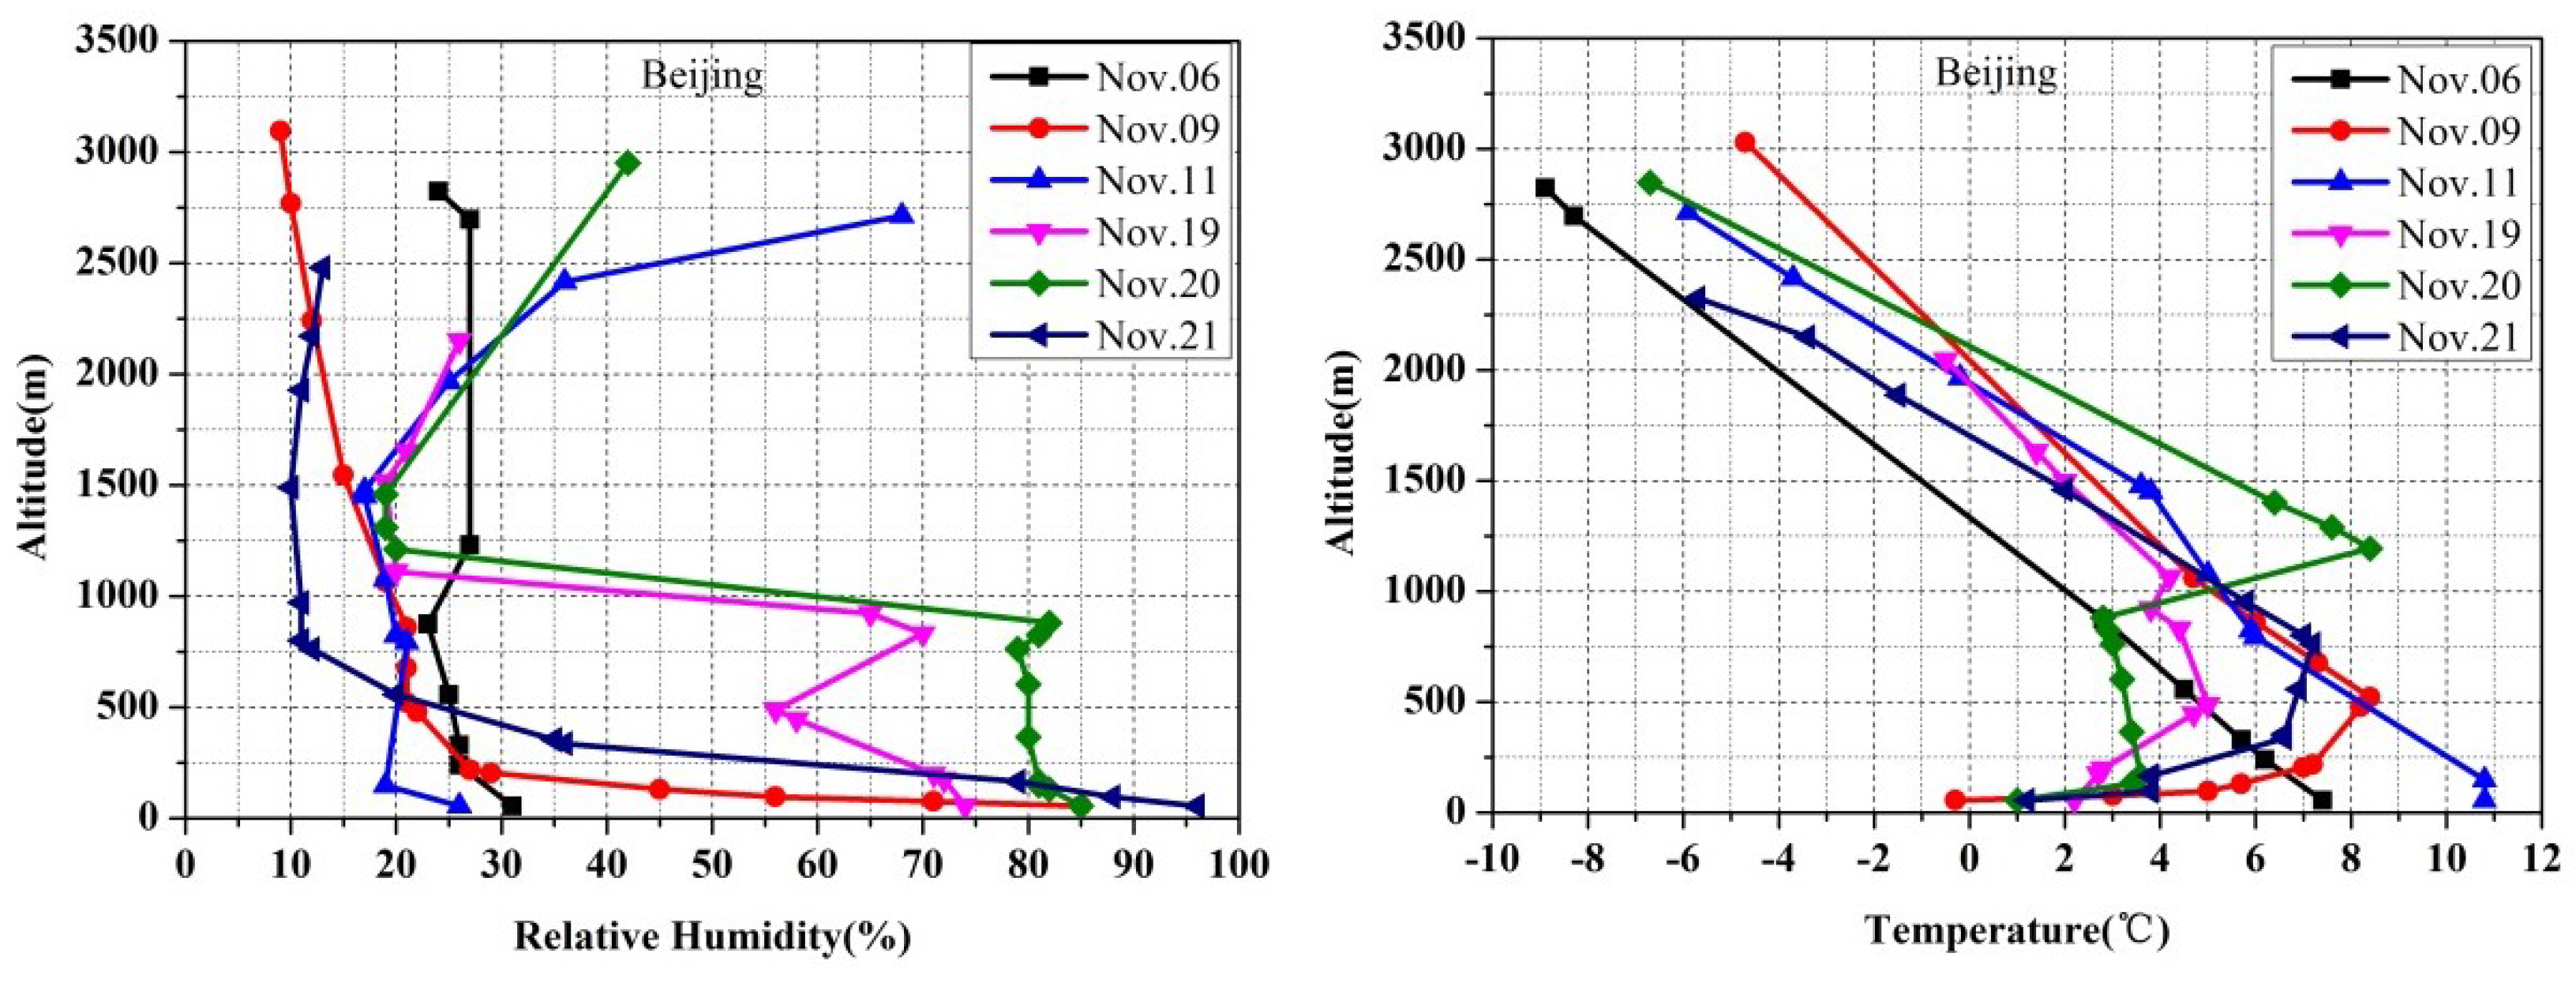
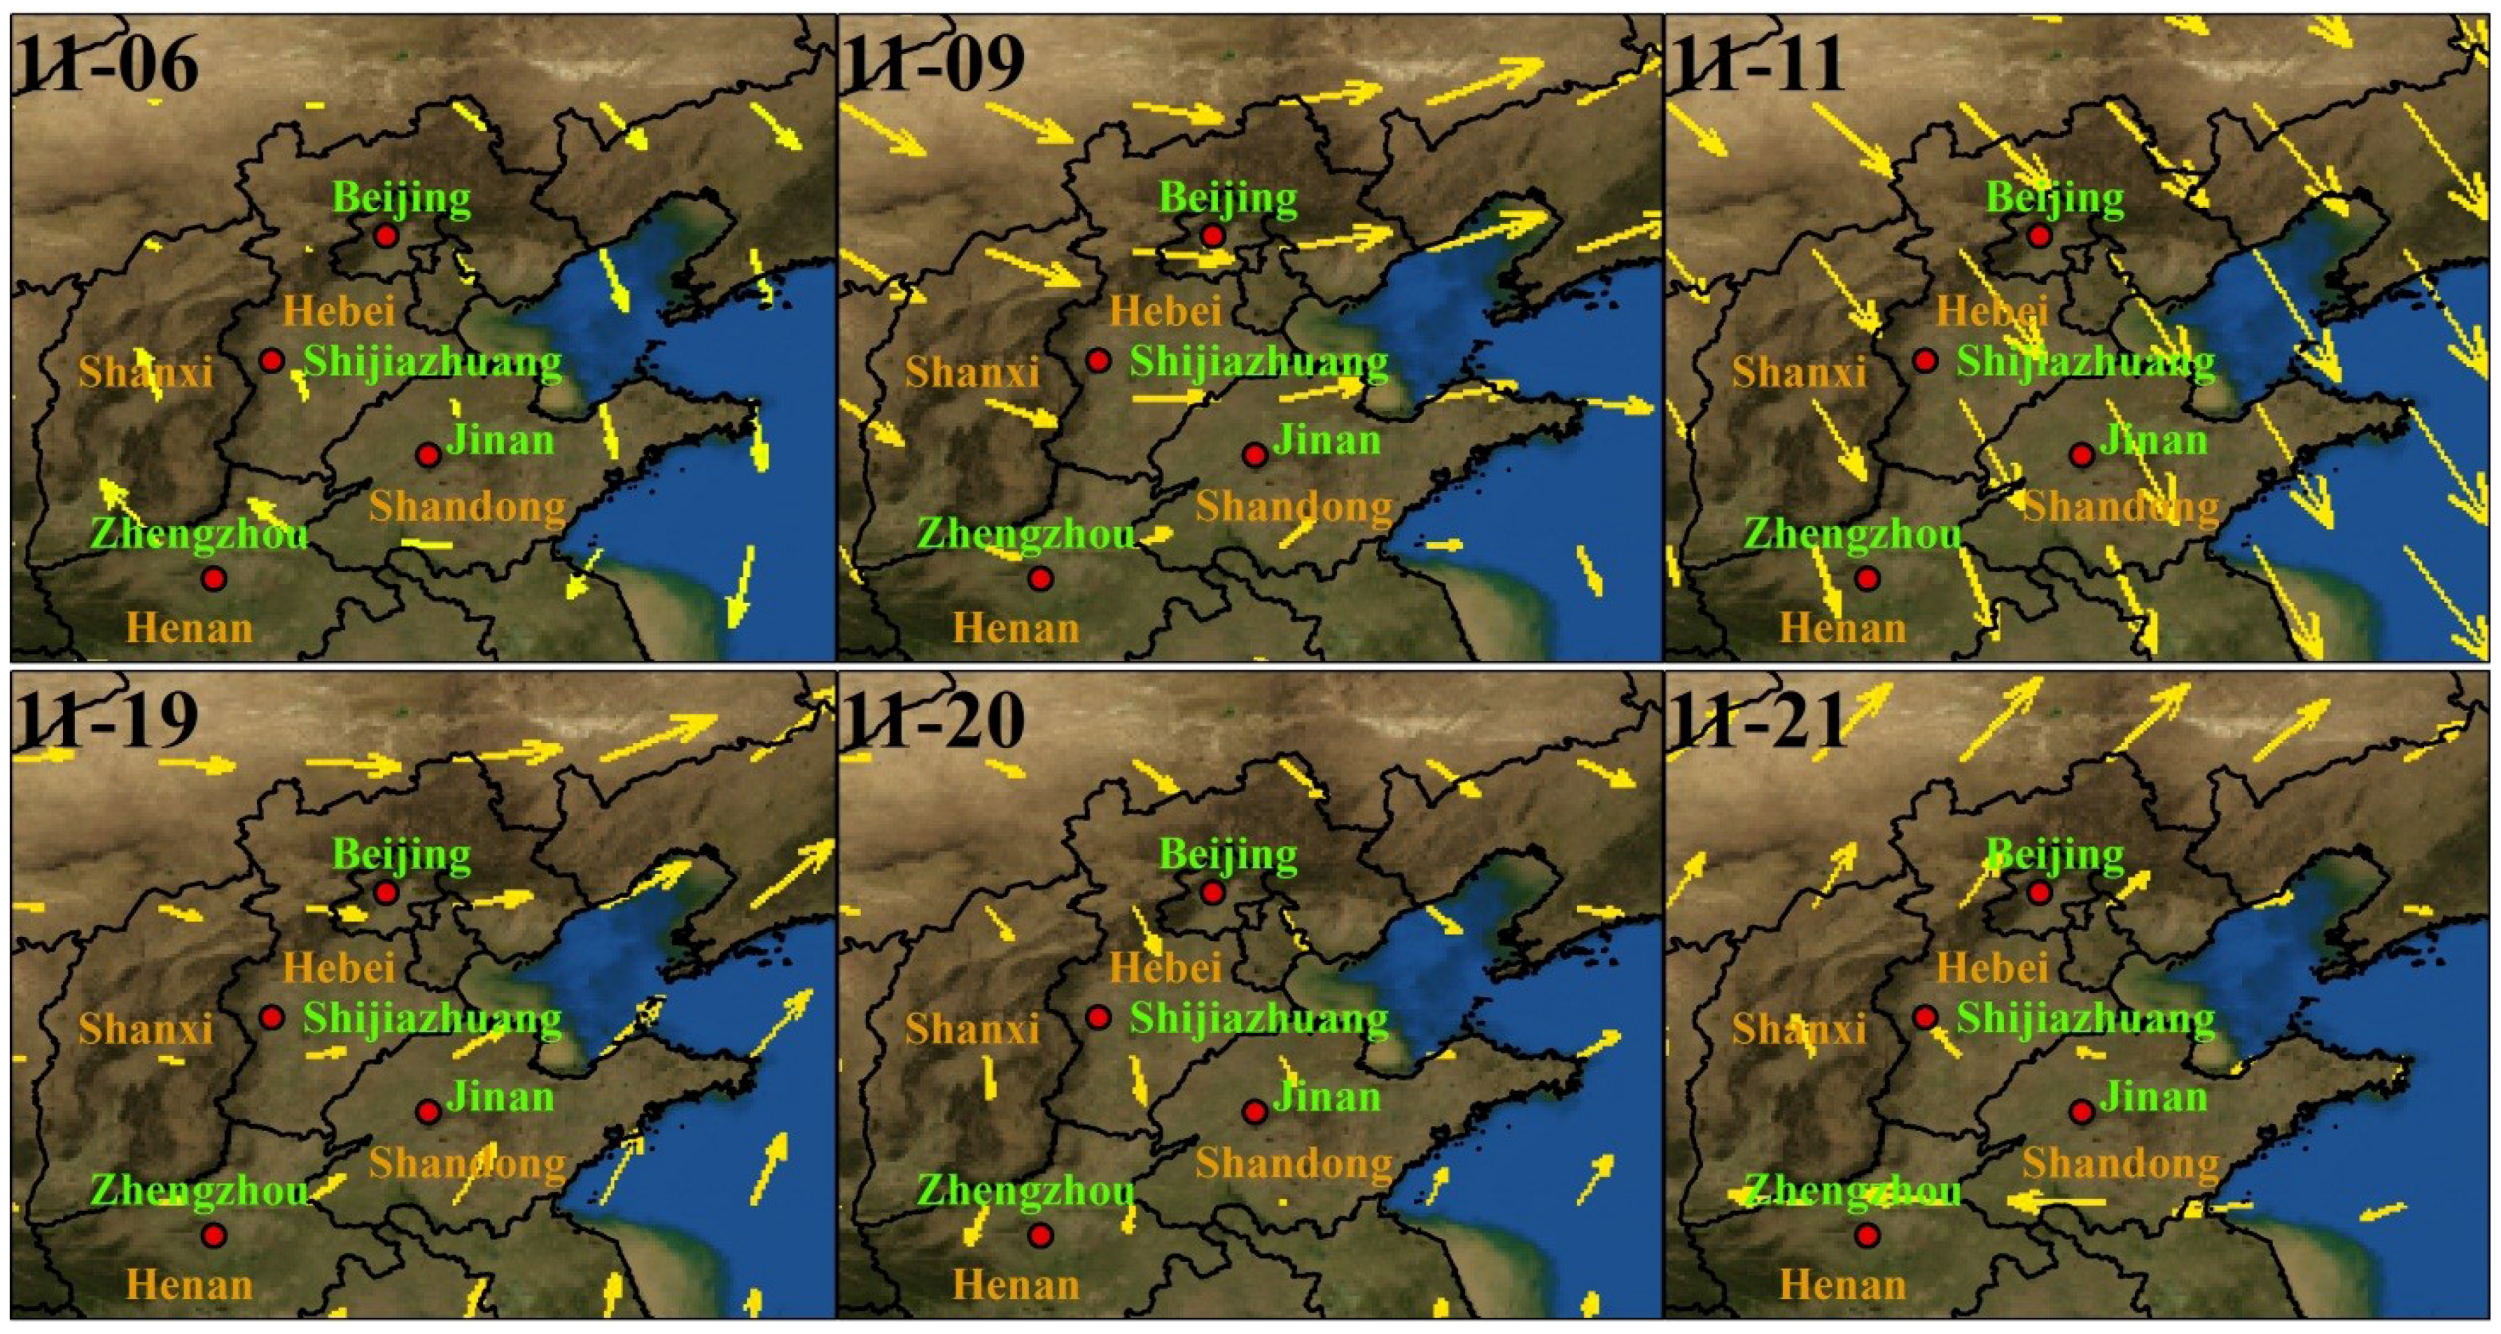
3.2. The Relevant Factors Leading to the Atmosphere Variations during Study Periods


4. Conclusions
Acknowledgments
Author Contributions
Conflicts of Interest
References
- Li, Z.Q.; Li, C.; Chen, H.; Tsay, S.C.; Holben, B.; Huang, J.; Li, B.; Maring, H.; Qian, Y.; Shi, G.; et al. East Asian Studies of Tropospheric Aerosols and their Impact on Regional Climate (EAST-AIRC): An overview. J. Geophys. Res. Atmos. 2011, 116. [Google Scholar] [CrossRef]
- Zhang, X.Y.; Wang, Y.Q.; Niu, T.; Zhang, X.C.; Gong, S.L.; Zhang, Y.M.; Sun, J.Y. Atmospheric aerosol compositions in China: Spatial/temporal variability, chemical signature, regional haze distribution and comparisons with global aerosols. Atmos. Chem. Phys. 2012, 12, 779–799. [Google Scholar] [CrossRef]
- Sun, Y.L.; Zhuang, G.S.; Tang, A.H.; Wang, Y.; An, Z.S. Chemical characteristics of PM2.5 and PM10 in haze-fog episodes in Beijing. Environ. Sci. Technol. 2006, 40, 3148–3155. [Google Scholar] [CrossRef] [PubMed]
- Tan, J.H.; Duan, J.C.; He, K.B.; Ma, Y.L.; Duan, F.K.; Chen, Y.; Fu, J. Chemical characteristics of PM2.5 during a typical haze episode in Guangzhou. J. Environ. Sci.-China 2009, 21, 774–781. [Google Scholar] [CrossRef]
- Tian, S.L.; Pan, Y.P.; Liu, Z.R.; Wen, T.X.; Wang, Y.S. Size-resolved aerosol chemical analysis of extreme haze pollution events during early 2013 in urban Beijing, China. J. Hazard. Mater. 2014, 279, 452–460. [Google Scholar] [CrossRef] [PubMed]
- Chen, Y.Y.; Ebenstein, A.; Greenstone, M.; Li, H.B. Evidence on the impact of sustained exposure to air pollution on life expectancy from China’s Huai River policy. Proc. Natl. Acad. Sci. USA 2013, 110, 12936–12941. [Google Scholar] [CrossRef] [PubMed]
- Tao, M.H.; Chen, L.F.; Su, L.; Tao, J.H. Satellite observation of regional haze pollution over the North China Plain. J. Geophys. Res.-Atmos. 2012, 117. [Google Scholar] [CrossRef]
- Guo, S.; Hu, M.; Zamora, M.L.; Peng, J.F.; Shang, D.J.; Zheng, J.; Du, Z.; Wu, Z.; Shao, M.; Zeng, L.; et al. Elucidating severe urban haze formation in China. Proc. Natl. Acad. Sci. USA 2014, 111, 17373–17378. [Google Scholar] [CrossRef] [PubMed]
- Holben, B.N.; Eck, T.F.; Slutsker, I.; Tanre, D.; Buis, J.P.; Setzer, A.; Vermote, E.; Reagan, J.A.; Kaufman, Y.J.; Nakajima, T.; et al. AERONET—A federated instrument network and data archive for aerosol characterization. Remote Sens. Environ. 1998, 66, 1–16. [Google Scholar] [CrossRef]
- ODubovik, O.; Holben, B.; Eck, T.F.; Smirnov, A.; Kaufman, Y.J.; King, M.D.; Tanré, D.; Slutsker, I. Variability of absorption and optical properties of key aerosol types observed in worldwide locations. J. Atmos. Sci. 2002, 59, 590–608. [Google Scholar] [CrossRef]
- Kalnay, E.; Kanamitsu, M.; Kistler, R.; Collins, W.; Deaven, D.; Gandin, L.; Iredell, M.; Saha, S.; White, G.; Woollen, J.; et al. The NCEP/NCAR 40-year reanalysis project. Bull. Am. Meteorol. Soc. 1996, 77, 437–471. [Google Scholar] [CrossRef]
- Hsu, N.C.; Tsay, S.C.; King, M.D.; Herman, J.R. Deep blue retrievals of Asian aerosol properties during ACE-Asia. IEEE Trans. Geosci. Remote Sens. 2006, 44, 3180–3195. [Google Scholar] [CrossRef]
- Levy, R.C.; Remer, L.A.; Kleidman, R.G.; Mattoo, S.; Ichoku, C.; Kahn, R.; Eck, T.F. Global evaluation of the Collection 5 MODIS dark-target aerosol products over land. Atmos. Chem. Phys. 2010, 10, 10399–10420. [Google Scholar] [CrossRef] [Green Version]
- Torres, O.; Tanskanen, A.; Veihelmann, B.; Ahn, C.; Braak, R.; Bhartia, P.K.; Veefkind, P.; Levelt, P. Aerosols and surface UV products from Ozone Monitoring Instrument observations: An overview. J. Geophys. Res.-Atmos. 2007, 112. [Google Scholar] [CrossRef]
- Omar, A.H.; Winker, D.M.; Kittaka, C.; Vaughan, M.A.; Liu, Z.Y.; Hu, Y.X.; Trepte, C.R.; Ferrare, R.A.; Lee, K.; Hostetler, C.A. The CALIPSO Automated Aerosol Classification and Lidar Ratio Selection Algorithm. J. Atmos. Ocean. Technol. 2009, 26, 1994–2014. [Google Scholar] [CrossRef]
- Mielonen, T.; Arola, A.; Komppula, M.; Kukkonen, J.; Koskinen, J.; de Leeuw, G.; Lehtinen, K. Comparison of CALIOP level 2 aerosol subtypes to aerosol types derived from AERONET inversion data. Geophys. Res. Lett. 2009, 36, 18. [Google Scholar] [CrossRef]
- Liu, Z.; Liu, D.; Huang, J.; Vaughan, M.; Uno, I.; Sugimoto, N.; Kittaka, C.; Trepte, C.; Wang, Z.; Hostetler, C.; et al. Airborne dust distributions over the Tibetan Plateau and surrounding areas derived from the first year of CALIPSO lidar observations. Atmos. Chem. Phys. 2008, 8, 5045–5060. [Google Scholar] [CrossRef]
- Zhang, M.; Ma, Y.Y.; Gong, W.; Zhu, Z.M. Aerosol Optical Properties of a Haze Episode in Wuhan Based on Ground-Based and Satellite Observations. Atmosphere 2014, 5, 699–719. [Google Scholar] [CrossRef]
- Zhang, Q.; Quan, J.N.; Tie, X.X.; Li, X.; Liu, Q.; Gao, Y.; Zhao, D. Effects of meteorology and secondary particle formation on visibility during heavy haze events in Beijing, China. Sci. Total Environ. 2015, 502, 578–584. [Google Scholar] [CrossRef] [PubMed]
- Sun, Y.L.; Wang, Z.F.; Fu, P.Q.; Yang, T.; Jiang, Q.; Dong, H.B.; Li, J.; Jia, J. Aerosol composition, sources and processes during wintertime in Beijing, China. Atmos. Chem. Phys. 2013, 13, 4577–4592. [Google Scholar] [CrossRef]
- Liu, X.G.; Li, J.; Qu, Y.; Han, T.; Hou, L.; Gu, J.; Chen, C.; Yang, Y.; Liu, X.; Yang, T.; et al. Formation and evolution mechanism of regional haze: A case study in the megacity Beijing, China. Atmos. Chem. Phys. 2013, 13, 4501–4514. [Google Scholar] [CrossRef]
- Zhao, X.J.; Zhao, P.S.; Xu, J.; Meng, W.; Pu, W.W.; Dong, F.; He, D.; Shi, Q.F. Analysis of a winter regional haze event and its formation mechanism in the North China Plain. Atmos. Chem. Phys. 2013, 13, 5685–5696. [Google Scholar] [CrossRef]
- Liu, J.J.; Zheng, Y.F.; Li, Z.Q.; Flynn, C.; Welton, E.J.; Cribb, M. Transport, vertical structure and radiative properties of dust events in southeast China determined from ground and space sensors. Atmos. Environ. 2011, 45, 6469–6480. [Google Scholar] [CrossRef]
© 2015 by the authors; licensee MDPI, Basel, Switzerland. This article is an open access article distributed under the terms and conditions of the Creative Commons Attribution license (http://creativecommons.org/licenses/by/4.0/).
Share and Cite
Wei, X.; Gu, X.; Chen, H.; Cheng, T.; Wang, Y.; Guo, H.; Bao, F.; Xiang, K. Multi-Scale Observations of Atmosphere Environment and Aerosol Properties over North China during APEC Meeting Periods. Atmosphere 2016, 7, 4. https://doi.org/10.3390/atmos7010004
Wei X, Gu X, Chen H, Cheng T, Wang Y, Guo H, Bao F, Xiang K. Multi-Scale Observations of Atmosphere Environment and Aerosol Properties over North China during APEC Meeting Periods. Atmosphere. 2016; 7(1):4. https://doi.org/10.3390/atmos7010004
Chicago/Turabian StyleWei, Xi, Xingfa Gu, Hao Chen, Tianhai Cheng, Ying Wang, Hong Guo, Fangwen Bao, and Kunsheng Xiang. 2016. "Multi-Scale Observations of Atmosphere Environment and Aerosol Properties over North China during APEC Meeting Periods" Atmosphere 7, no. 1: 4. https://doi.org/10.3390/atmos7010004