
An Observational Study of Entrainment Rate in Deep Convection

Abstract
:
1. Introduction
2. Method and Data
2.1 Method
2.2. Data


3. Results
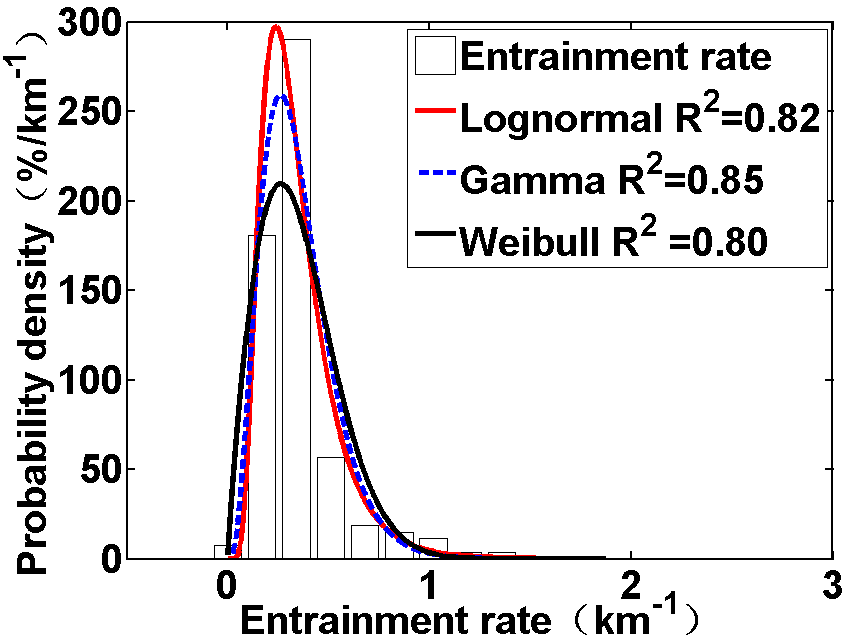
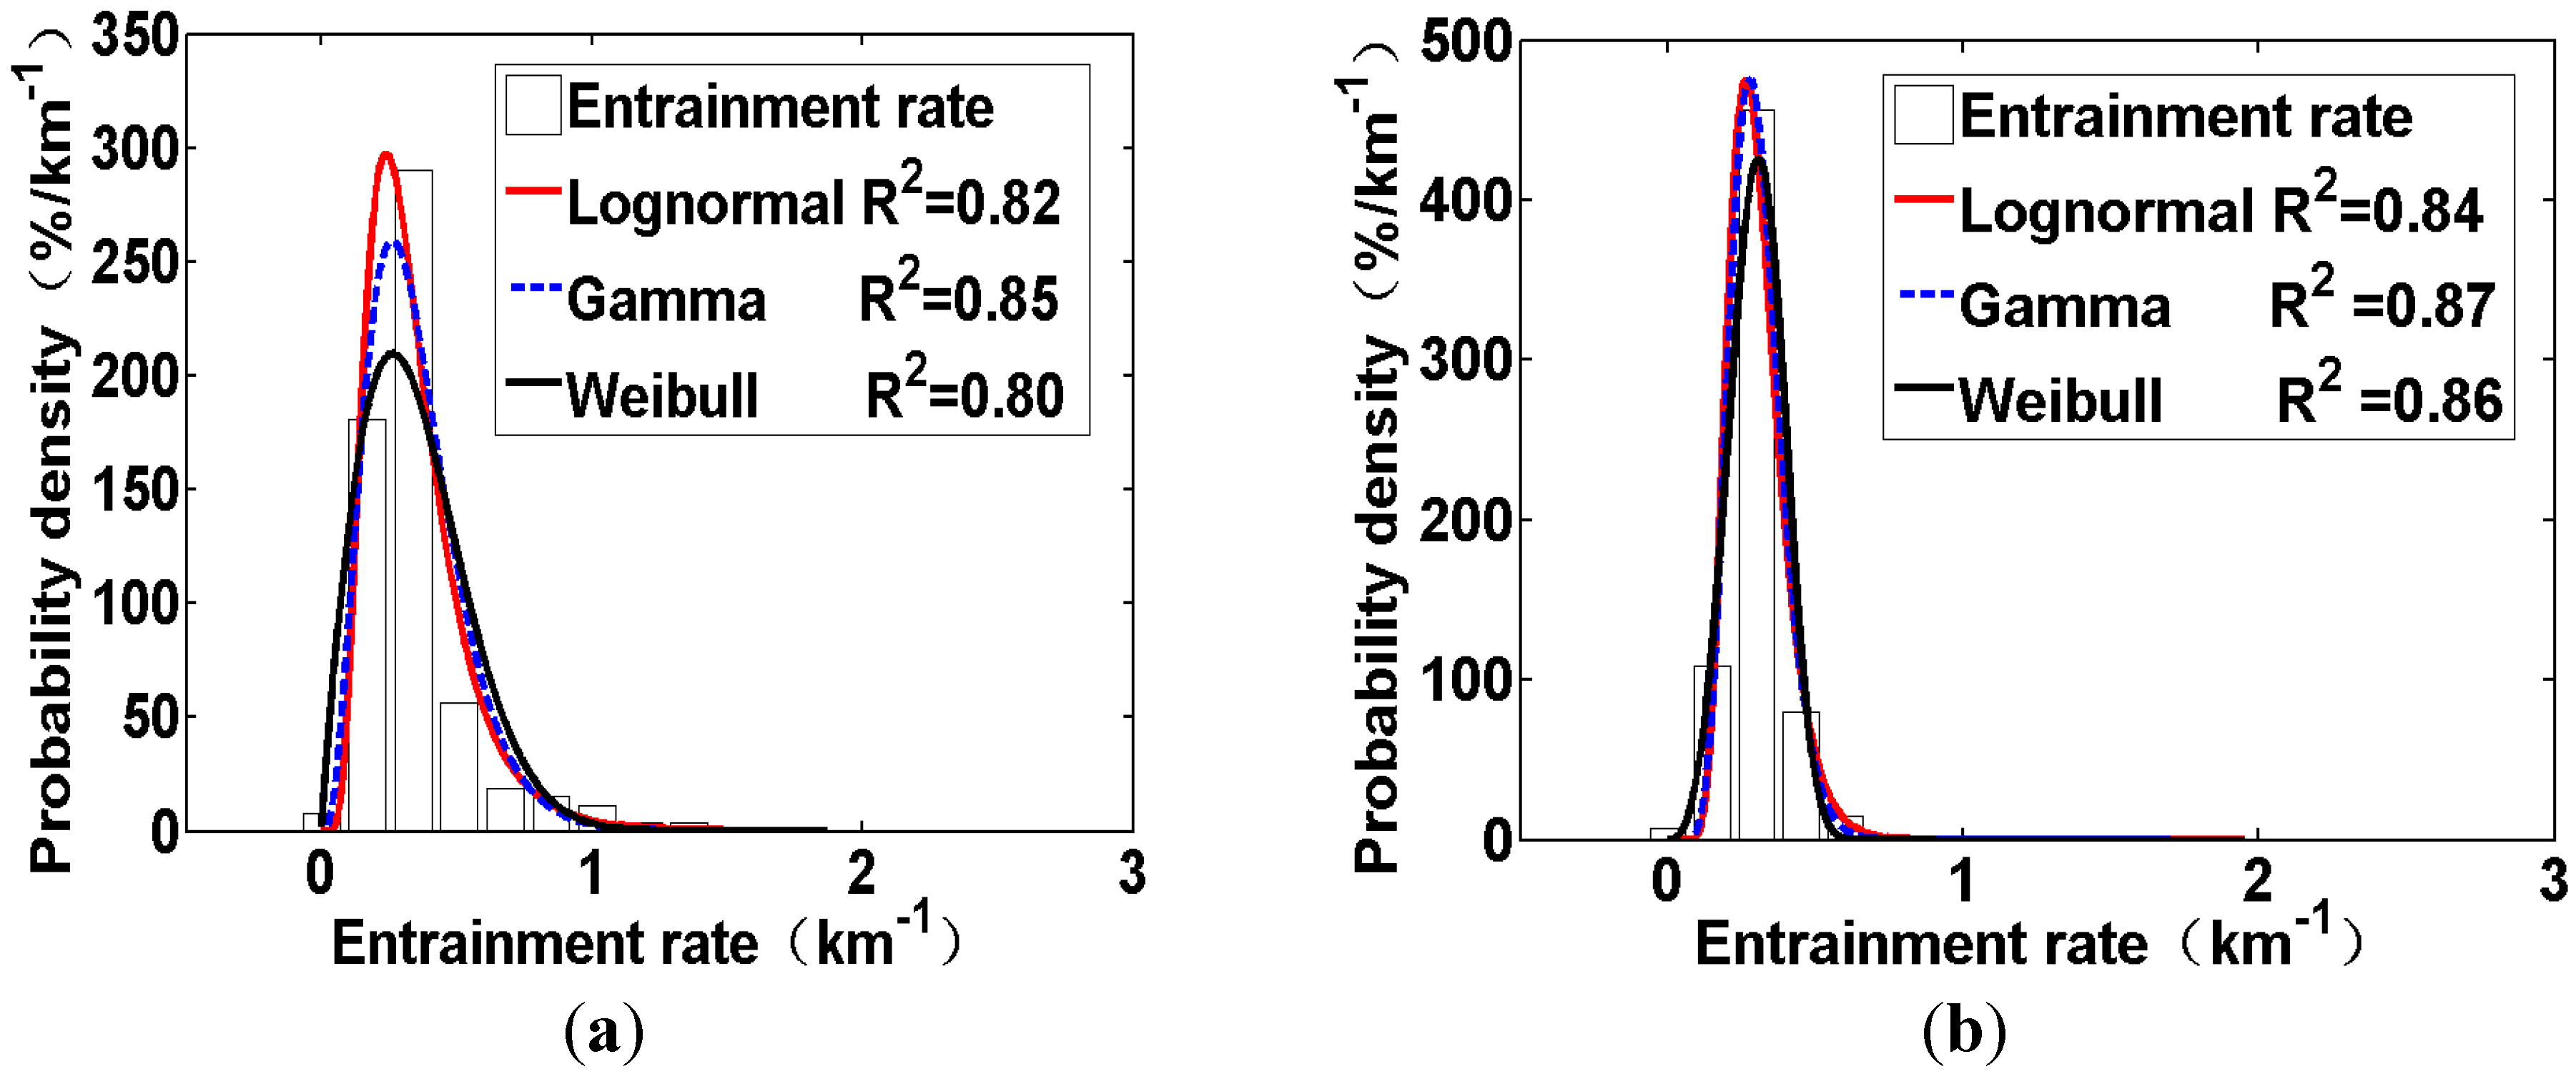
3.1. PDF of λ

| Function | Form | Meaning of Parameters |
|---|---|---|
| μ and σ are mean value and standard deviation of ln(λ), respectively. | ||
| Lognormal | ||
| a and b are shape and scale parameters, respectively. | ||
| Gamma | ||
| c and q are scale and shape parameters, respectively. | ||
| Weibull |

| μ | σ | a | b | c | q | |
| 156 clouds | −1.19 | 0.49 | 4.04 | 0.09 | 0.39 | 1.88 |
| 92 clouds | −1.24 | 0.31 | 12.02 | 0.03 | 0.33 | 3.69 |
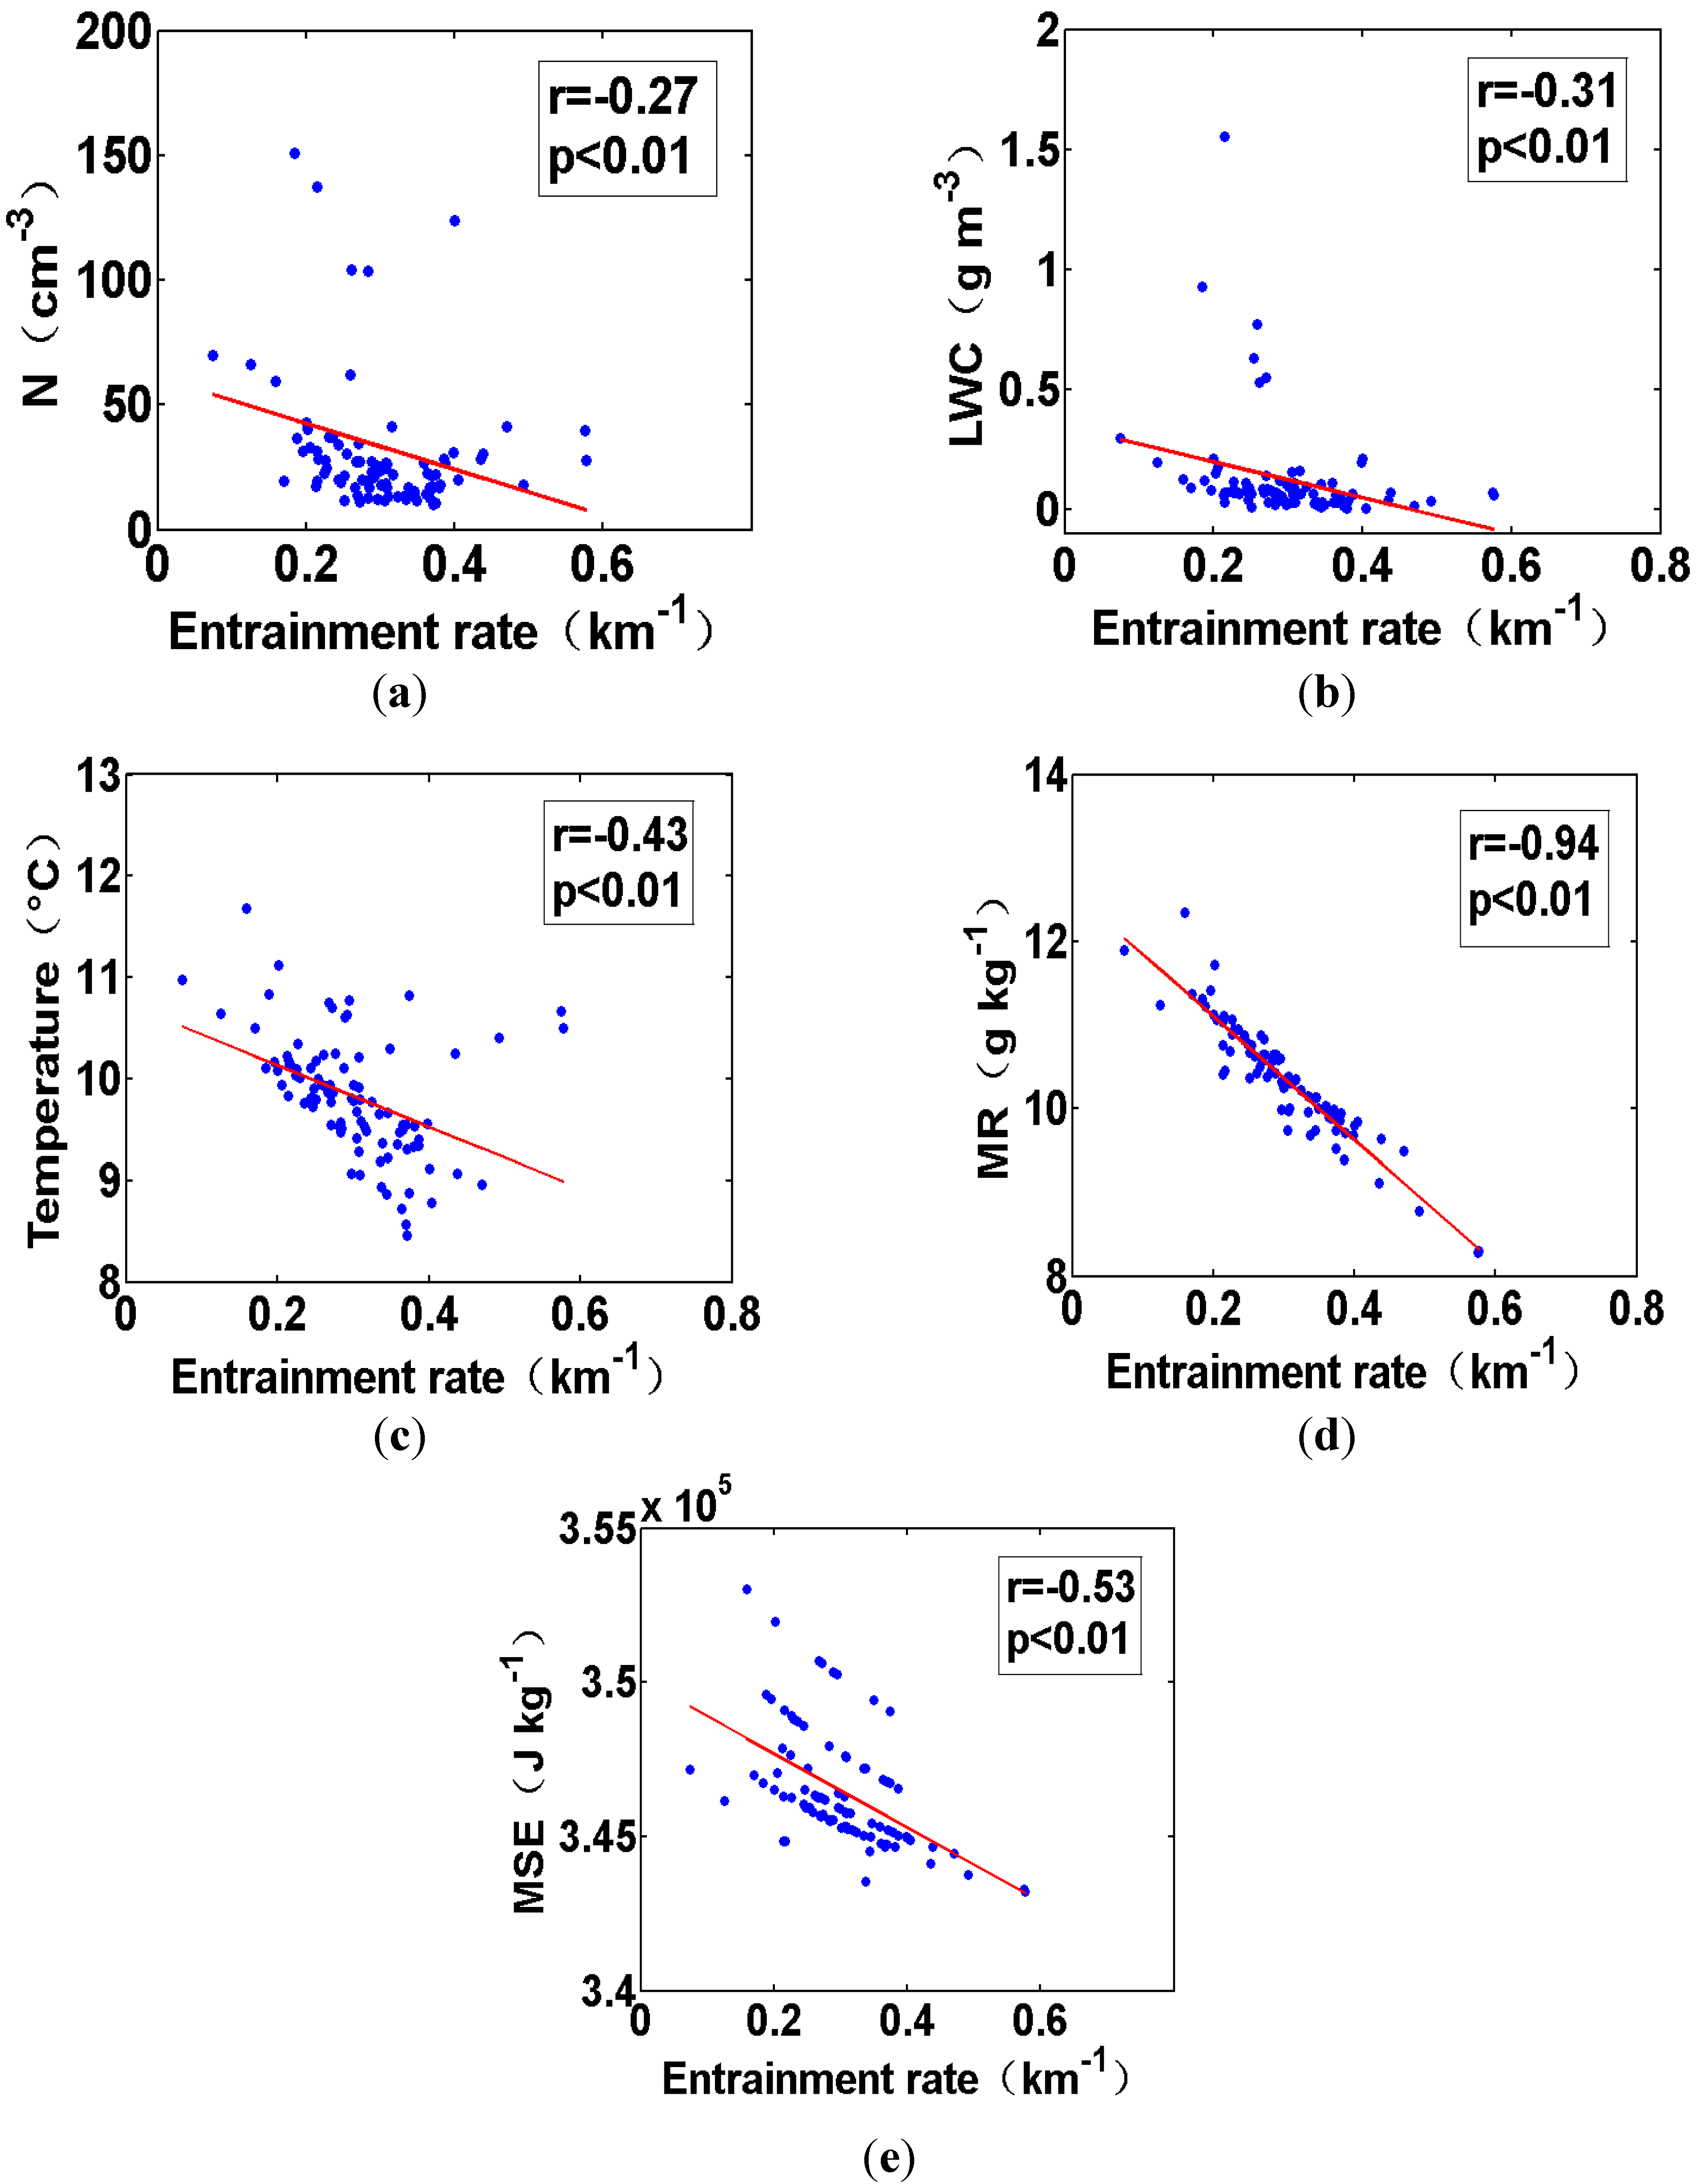
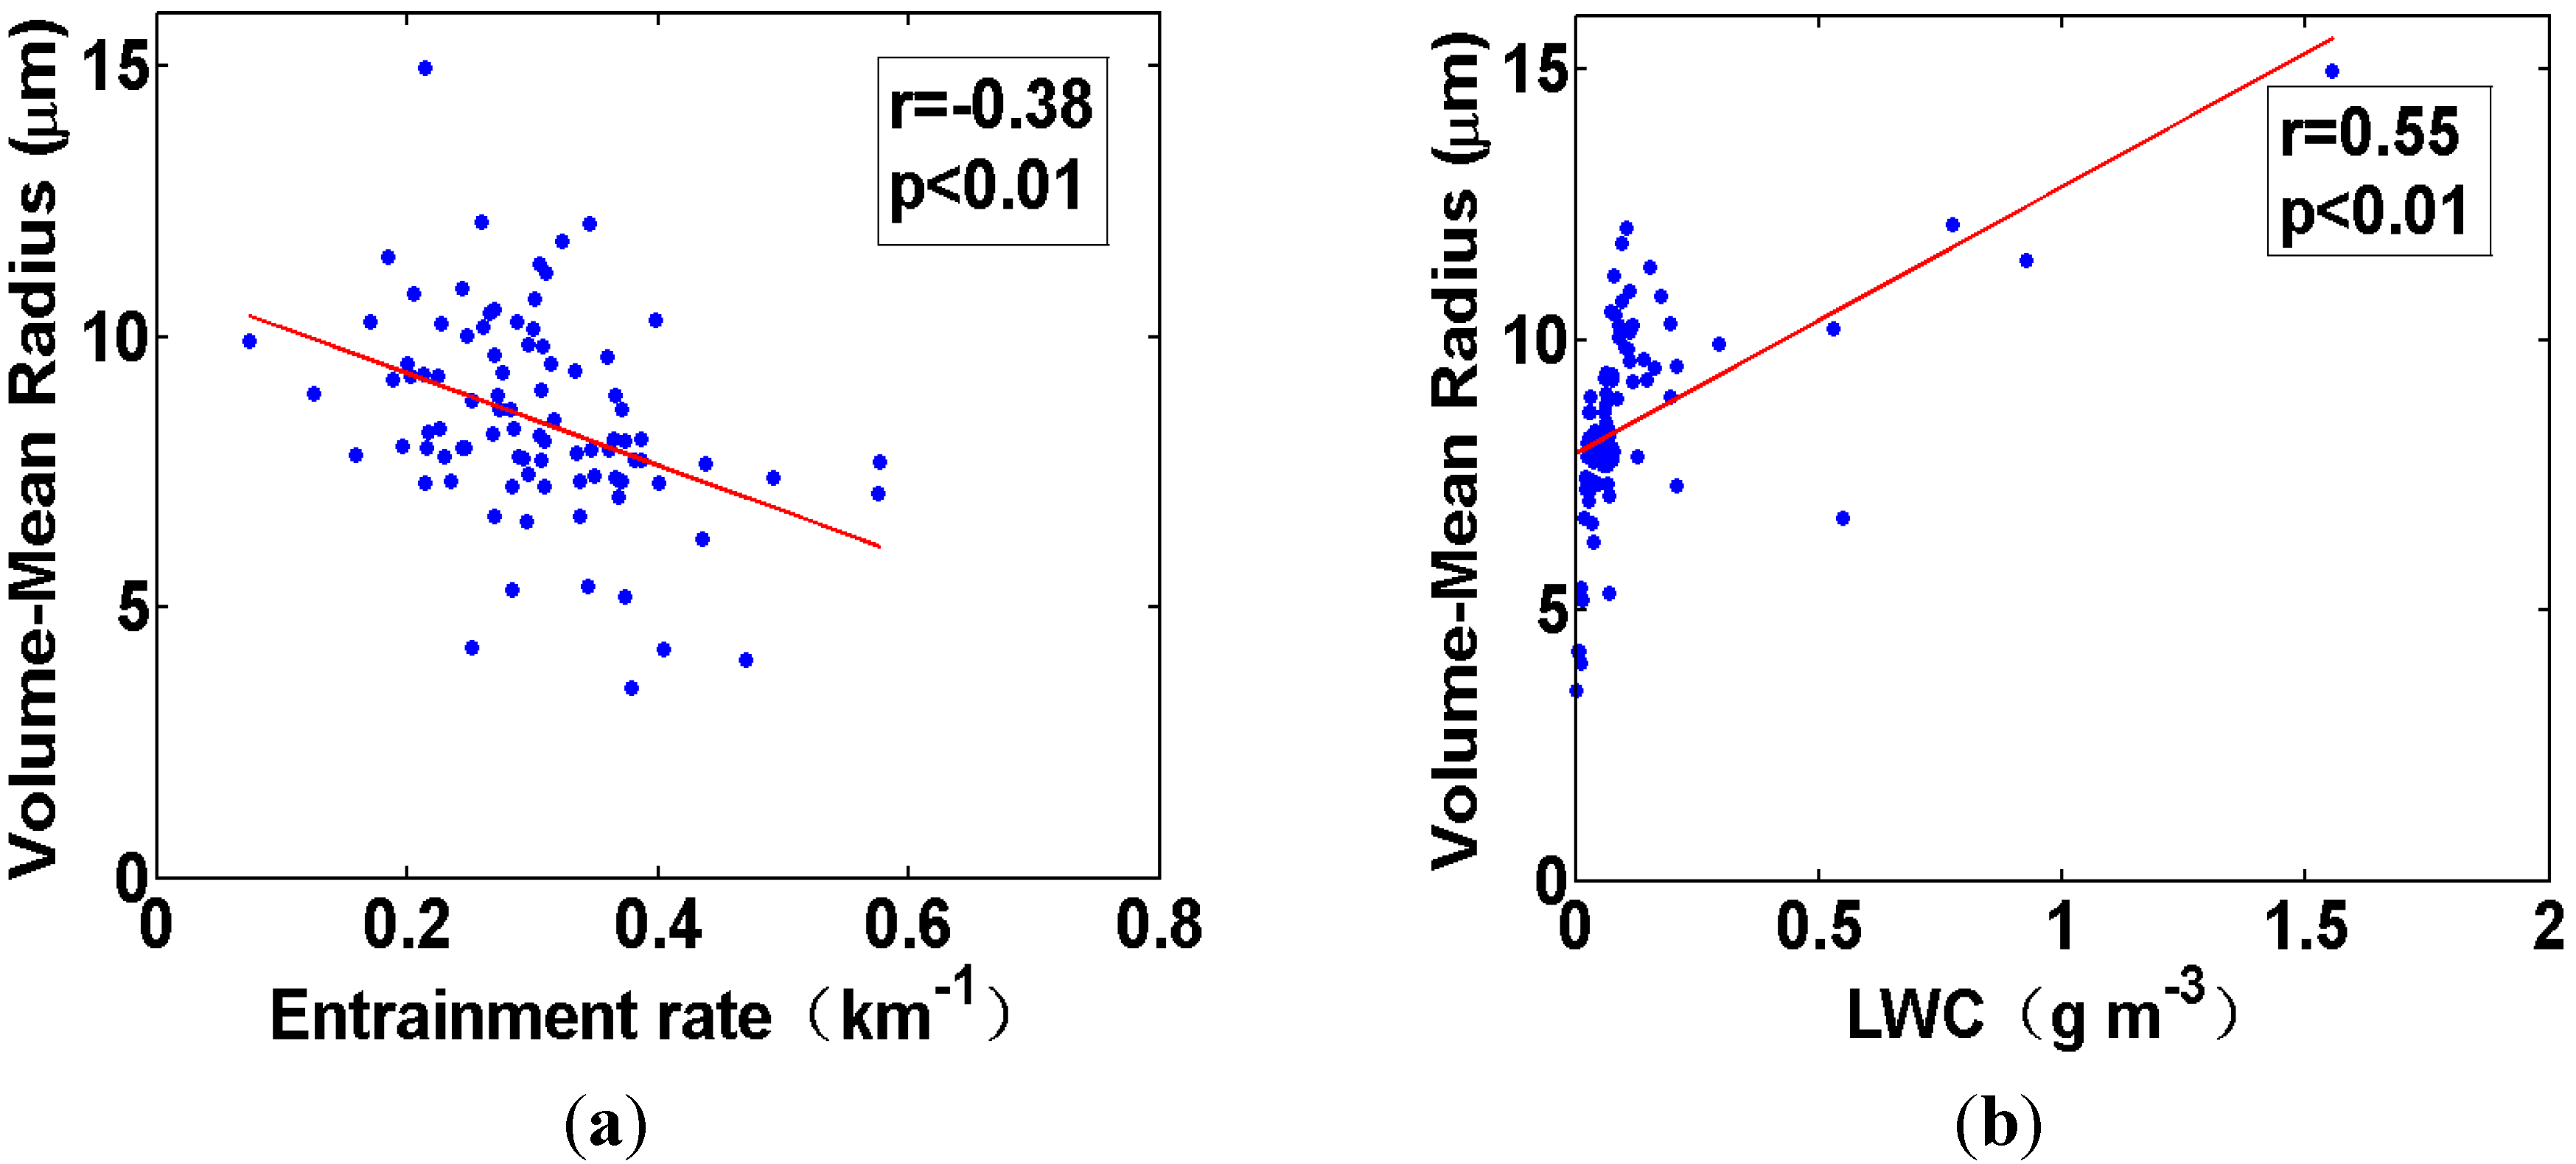
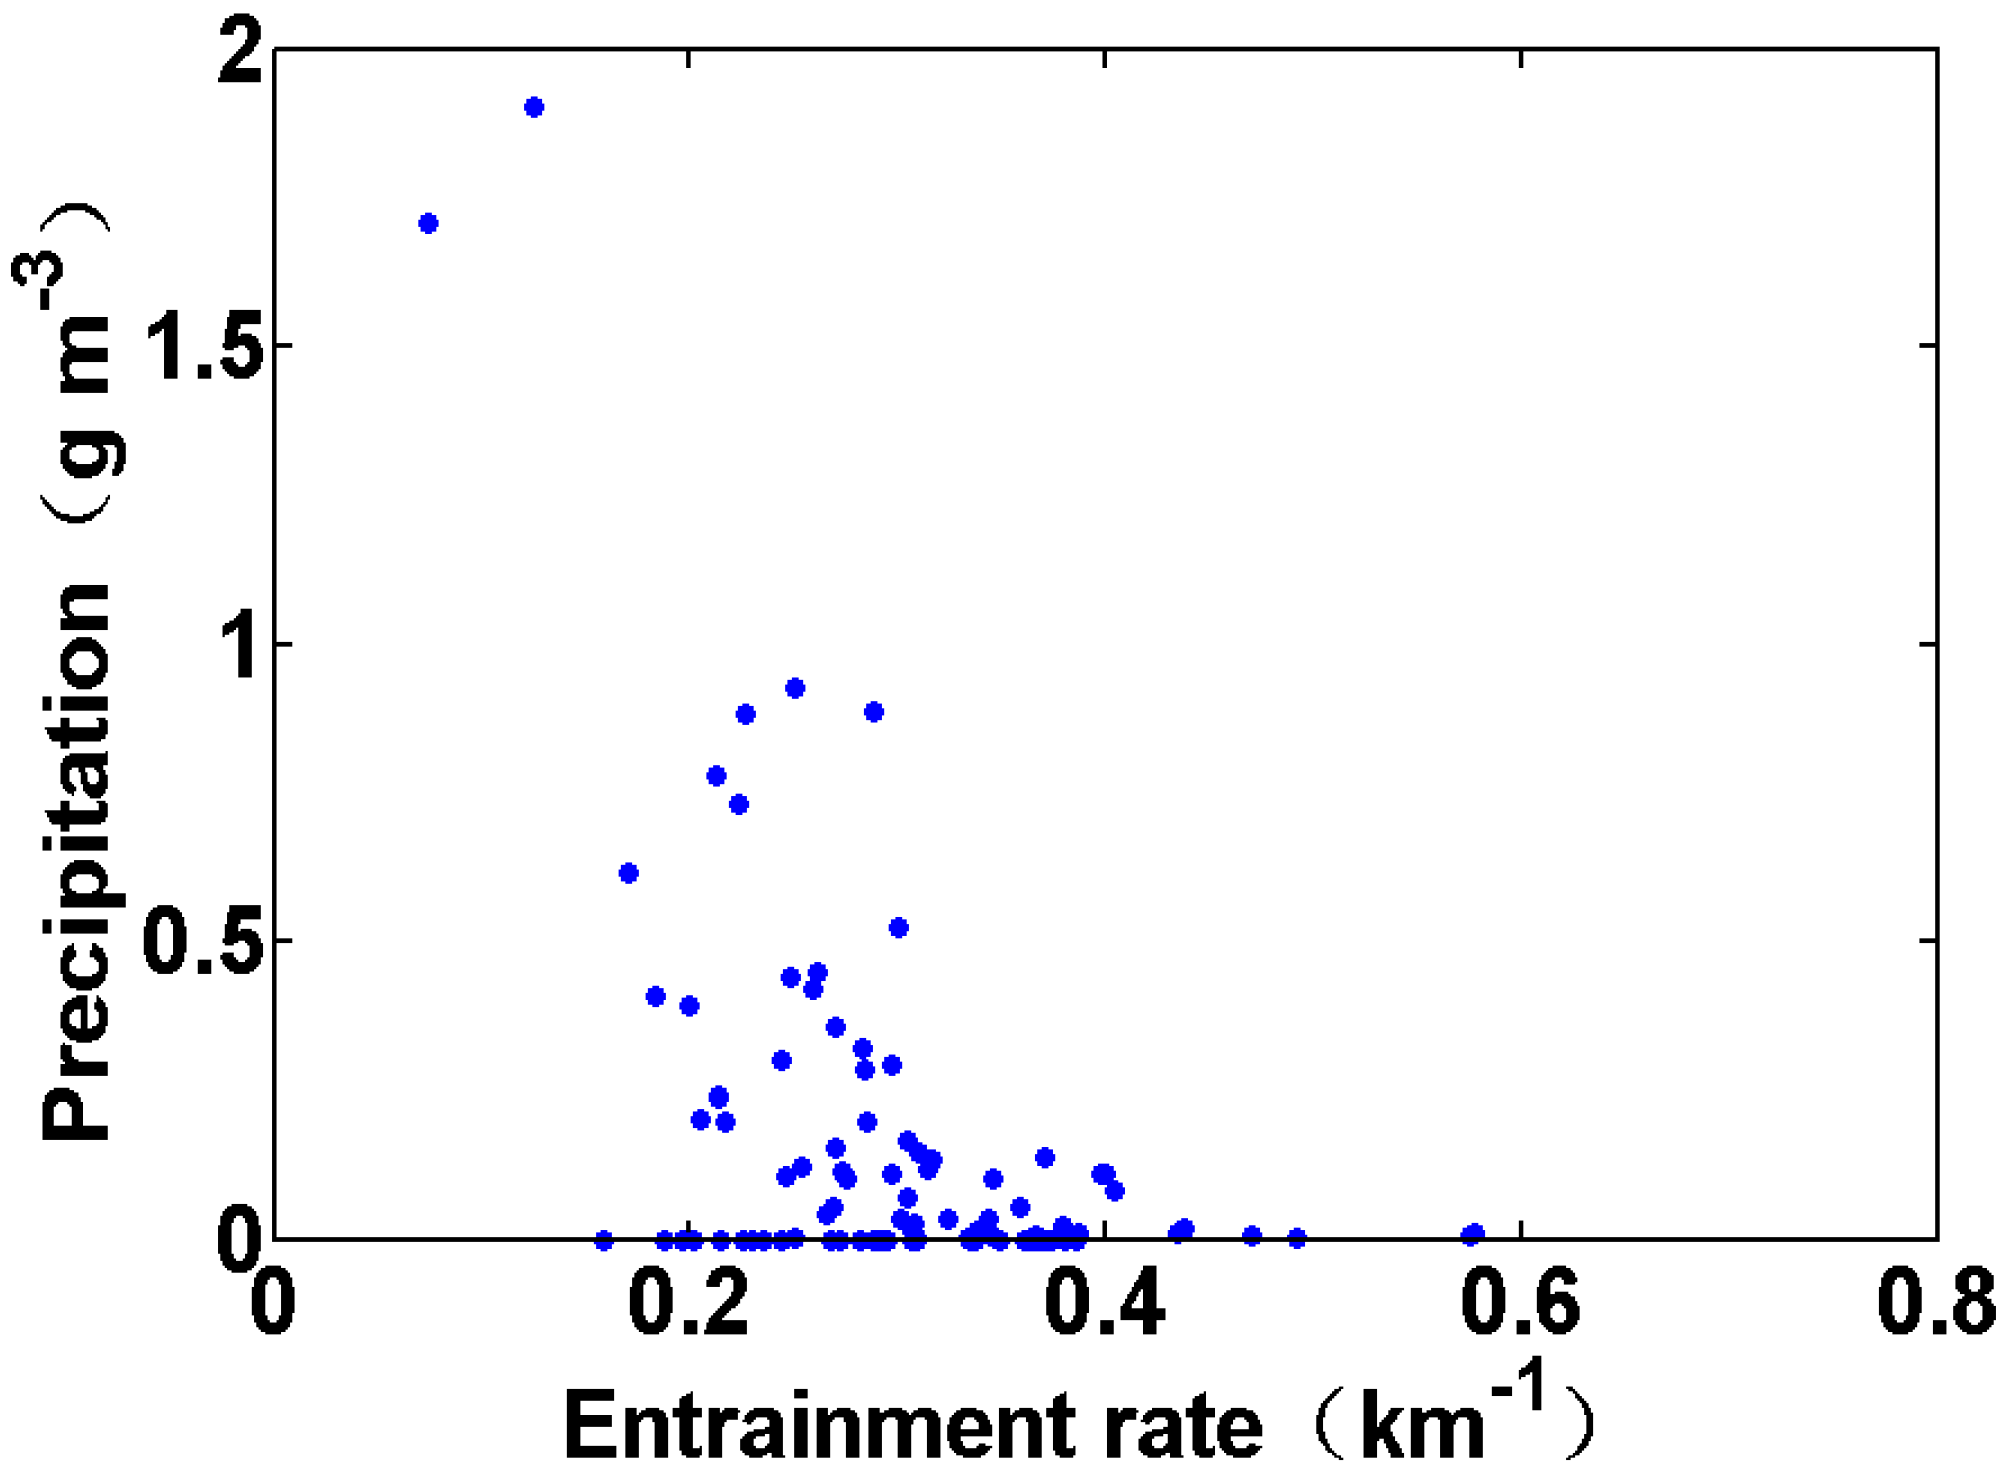
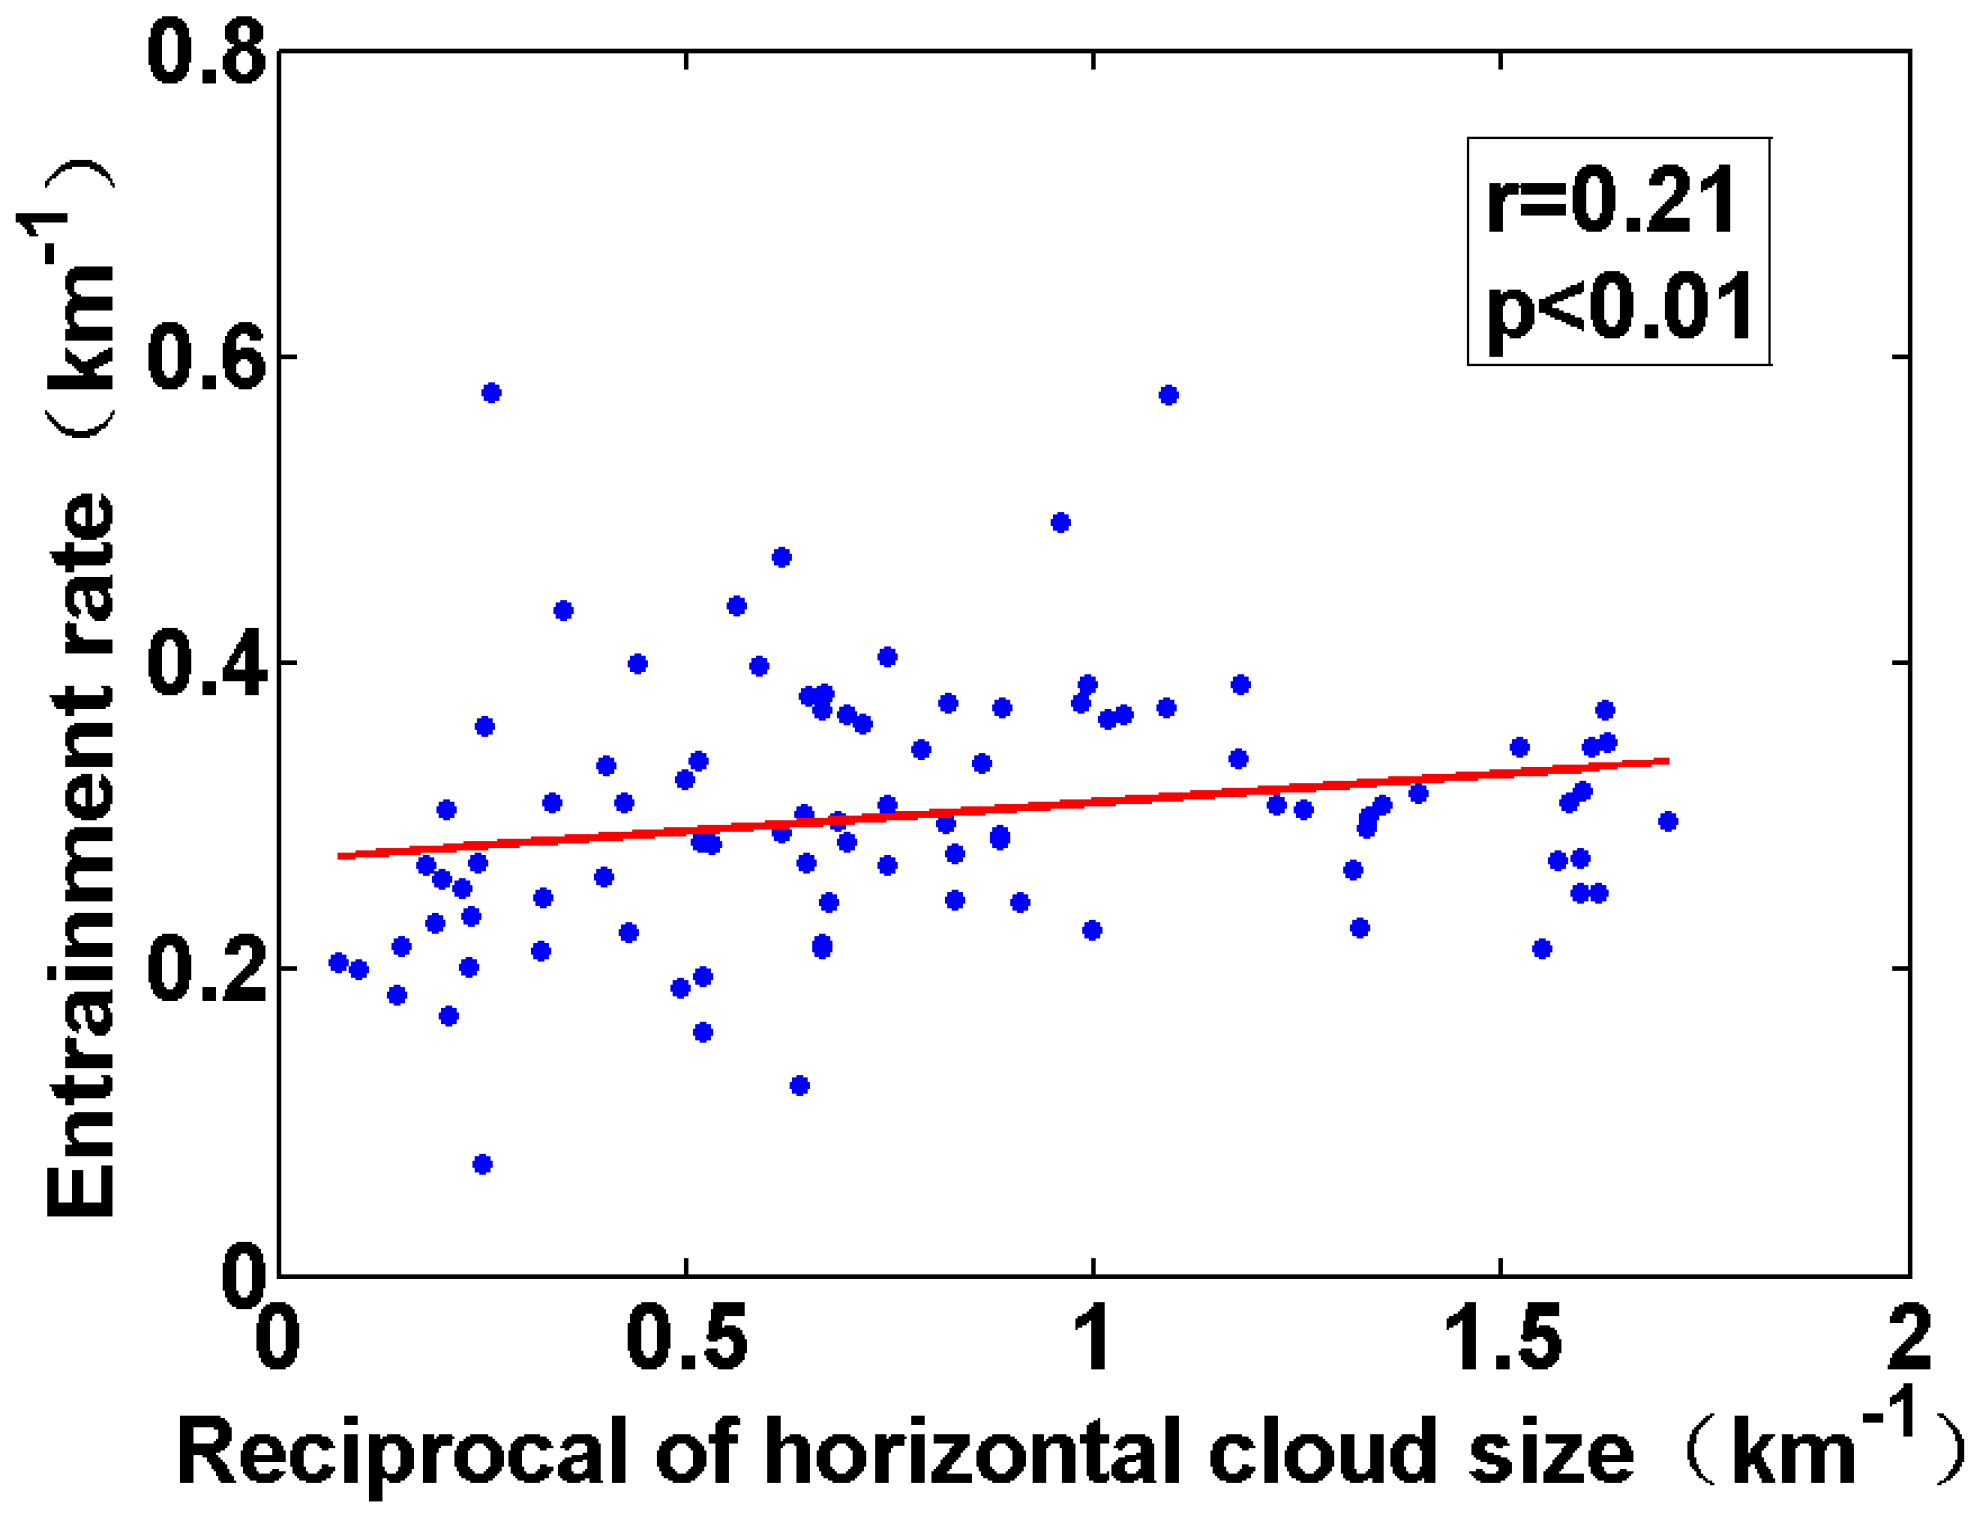
3.2. Relationships between λ and Cloud Properties


3.3. Effects of Different Sources of Environmental Air on λ

4. Conclusions
Acknowledgments
Author Contributions
Conflicts of Interest
References
- Tost, H.; Jockel, P.; Lelieveld, J. Influence of different convection parameterisations in a GCM. Atmso. Chem. Phys. 2006, 6, 5475–5493. [Google Scholar] [CrossRef]
- Liang, X.Z.; Li, L.; Dai, A.G.; Kunkel, K.E. Regional climate model simulation of summer precipitation diurnal cycle over the United States. Geophys. Res. Lett. 2004, 31, L24208. [Google Scholar] [CrossRef]
- Li, X. Sensitivity of WRF simulated typhoon track and intensity over the Northwest Pacific Ocean to cumulus schemes. Sci. China Earth Sci. 2013, 56, 270–281. [Google Scholar] [CrossRef]
- Zhang, G.J.; Song, X. Interaction of deep and shallow convection is key to Madden-Julian Oscillation simulation. Geophys. Res. Lett. 2009, 36, L09708. [Google Scholar] [CrossRef]
- Siebesma, A.P.; Cuijpers, J.W.M. Evaluation of parametric assumptions for shallow cumulus convection. J. Atmos. Sci. 1995, 52, 650–666. [Google Scholar] [CrossRef]
- Wang, Y.; Li, Z.; Kevin, H. Effect of convective entrainment/detrainment on the simulation of the topical precipitation diurnal cycle. Mon. Weather Rev. 2007, 135, 567–585. [Google Scholar] [CrossRef]
- Betts, A.K. Parametric interpretation of trade-wind cumulus budget studies. J. Atmos. Sci. 1975, 32, 1934–1945. [Google Scholar] [CrossRef]
- Gerber, H.E.; Frick, G.M.; Jensen, J.B.; Hudson, J.G. Entrainment, mixing, and microphysics in trade-wind cumulus. J. Meterol. Soc. Jpn. 2008, 86, 87–106. [Google Scholar] [CrossRef]
- Raga, G.B.; Jensen, J.B.; Baker, M.B. Characteristics of cumulus band clouds off the coast of Hawaii. J. Atmos. Sci. 1990, 47, 338–356. [Google Scholar] [CrossRef]
- Jensen, M.P.; Genio, A.D.D. Factors limiting convective cloud-top height at the ARM Nauru Island climate research Facility. J. Climate 2006, 19, 2015–2117. [Google Scholar] [CrossRef]
- Norgren, M.S.; Small, J.D.; Jonsson, H.H.; Chuang, P.Y. Observational estimates of detrainment and entrainment in non-precipitating shallow cumulus. Atmos. Chem. Phys. Discuss. 2014, 14, 21785–21827. [Google Scholar] [CrossRef]
- Genio, D.; Anthony, D.; Wu, J.B. The role of entrainment in the diurnal cycle of continental convection. J. Climate 2010, 10, 2722–2738. [Google Scholar] [CrossRef]
- Arakawa, A.; Schubert, W.H. Interaction of a cumulus cloud ensemble with the large-scale environment, Part I. J. Atmos. Sci. 1974, 31, 674–701. [Google Scholar] [CrossRef]
- Khairoutdinov, M.; Randall, D. High-resolution simulation of shallow to deep convection transition over land. J. Atmos. Sci. 2006, 63, 3421–3436. [Google Scholar] [CrossRef]
- de Rooy, W.C.; Bechtold, P.; Fröhlich, K.; Hohenegger, C.; Jonker, H.; Mironov, D.; Siebesma, A.P.; Teixeira, J.; Yano, J.-I. Entrainment and detrainment in cumulus convection: An overview. Q. J. R. Meteorol. Soc. 2011, 00, 2–29. [Google Scholar]
- Martin, S.S.; Paul, A.O. Influence of entrainment on the thermal stratification in simulations of radiative-convective equilibrium. Geophys. Res. Lett. 2013, 40, 5223–5227. [Google Scholar]
- Böing, S.J.; Jonker, H.J.J.; Nawara, W.A.; Siebesma, A.P. On the deceiving aspects of mixing diagrams of deep cumulus convection. J. Atmos. Sci. 2014, 71, 56–68. [Google Scholar] [CrossRef]
- Romps, D.M. A direct measure of entrainment. J. Atmos. Sci. 2010, 67, 1908–1927. [Google Scholar] [CrossRef]
- Dawe, J.T.; Austin, P.H. The influence of the cloud shell on tracer budget measurements of LES cloud entrainment. J. Atmos. Sci. 2011, 68, 2909–2920. [Google Scholar] [CrossRef]
- Lu, C.S.; Liu, Y.G.; Niu, S.J.; Vogelmann, A.M. Lateral entrainment rate in shallow cumuli: Dependence on dry air sources and probability density functions. Geophys. Res. Lett. 2012, 39, L20812. [Google Scholar] [CrossRef]
- Webster, P.J.; Lucas, R. TOGA COARE: The coupled ocean–atmosphere response experiment. Bull. Amer. Meteor. Soc. 1992, 73, 1377–1416. [Google Scholar] [CrossRef]
- Lu, C.S.; Liu, Y.G.; Niu, S.J.; Vogelmann, A.M. Empirical relationship between entrainment rate and microphysics in cumulus clouds. Geophys. Res. Lett. 2013, 40, 2333–2338. [Google Scholar] [CrossRef]
- Yang, J.; Chen, B.J.; Yin, Y. Physics of Clouds and Precipitation; China Meteorological Press: Beijing, China, 2011. [Google Scholar]
- Wang, Y.G.; Geerts, B.; French, J. Dynamics of the cumulus cloud margin: An observational study. J. Atmos. Sci. 2009, 66, 3660–3677. [Google Scholar] [CrossRef]
- Dawe, J.T.; Austin, P.H. Direct entrainment and detrainment rate distributions of individual shallow cumulus clouds in an LES. Atmos. Chem. Phys. 2013, 13, 7795–7811. [Google Scholar] [CrossRef]
- Romps, D.M.; Kuang, Z. Nature versus nurture in shallow convection. J. Atmos. Sci. 2010, 67, 1655–1666. [Google Scholar] [CrossRef]
- Sušelj, K.; Hogan, T.F.; Teixeira, J. Implementation of a stochastic eddy-diffusivity/mass-flux parameterization into the Navy Global Environmental Model. Weather Forecast. 2014, 29, 1374–1390. [Google Scholar] [CrossRef]
- Neggers, R.A.J.; Siebesma, A.P.; Jonker, H.J.J. A multiparcel model for shallow cumulus convection. J. Atmos. Sci. 2002, 59, 1655–1668. [Google Scholar] [CrossRef]
- Bretherton, C.S.; Blossey, P.N.; Khairoutdinov, M. An energy-balance analysis of deep convective self-aggregation above uniform SST. J. Atmos. Sci. 2005, 62, 4273–4292. [Google Scholar] [CrossRef]
- Kuang, Z.; Bretherton, C.S. A mass-flux scheme view of a high-resolution simulation of a transition from shallow to deep cumulus convection. J. Atmos. Sci. 2006, 63, 1895–1909. [Google Scholar] [CrossRef]
- Cheng, M.N.; Lu, C.S.; Liu, Y.G. Variation in entrainment rate and relationship with cloud microphysical properties on the scale of 5 m. Sci. Bull. 2015, 60, 707–717. [Google Scholar] [CrossRef]
- Asuero, A.G.; Sayago, A.; Gonzalez, A.G. The correlation coefficient: An overview. Crit. Rev. Anal. Chem. 2006, 36, 41–59. [Google Scholar] [CrossRef]
- Lu, C.S.; Liu, Y.G.; Niu, S.J. Examination of turbulent entrainment-mixing mechanisms using a combined approach. J. Geophys. Res. 2011, 116, D20207. [Google Scholar] [CrossRef]
- Lu, C.S.; Liu, Y.G.; Niu, S.J.; Endo, S. Scale dependence of enrainment-mixing mechanisms in cumulus clouds. J. Geophys. Res. 2014, 119, D022265. [Google Scholar]
- Andrejczuk, M.; Grabowski, W.W.; Malinowski, S.P.; Smolarkiewicz, P.K. Numerical simulation of cloud-clear air interfacial mixing: Homogeneous versus inhomogeneous mixing. J. Atmos. Sci. 2009, 66, 2493–2500. [Google Scholar] [CrossRef]
- Lehmann, K.; Siebert, H.; Shaw, R.A. Homogeneous and inhomogeneous mixing in cumulus clouds: Dependence on local turbulence structure. J. Atmos. Sci. 2009, 66, 3641–3659. [Google Scholar] [CrossRef]
- Burnet, F.; Brenguier, J.L. Observational study of the entrainment-mixing process in warm convective clouds. J. Atmos. Sci. 2007, 64, 1995–2011. [Google Scholar] [CrossRef]
- Jensen, J.B.; Austin, P.H.; Baker, M.B.; Blyth, A.M. Turbulent mixing, spectral evolution and dynamics in a warm cumulus cloud. J. Atmos. Sci. 1985, 42, 173–192. [Google Scholar] [CrossRef]
- Tiedtke, M. A comprehensive mass flux scheme for cumulus parameterization in large-scale models. Mon. Weather Rev. 1989, 117, 1779–1800. [Google Scholar] [CrossRef]
- Kain, J.S.; Fritsch, J.M. A one-dimensional entraining/detraining plume model and its application in convective parameterization. J. Atmos. Sci. 1990, 47, 2784–2802. [Google Scholar] [CrossRef]
- Wagner, T.M.; Graf, H.F. An ensemble cumulus convection parameterization with explicit cloud treatment. J. Atmos. Sci. 2010, 67, 3854–3869. [Google Scholar] [CrossRef]
© 2015 by the authors; licensee MDPI, Basel, Switzerland. This article is an open access article distributed under the terms and conditions of the Creative Commons Attribution license (http://creativecommons.org/licenses/by/4.0/).
Share and Cite
Guo, X.; Lu, C.; Zhao, T.; Zhang, G.J.; Liu, Y. An Observational Study of Entrainment Rate in Deep Convection. Atmosphere 2015, 6, 1362-1376. https://doi.org/10.3390/atmos6091362
Guo X, Lu C, Zhao T, Zhang GJ, Liu Y. An Observational Study of Entrainment Rate in Deep Convection. Atmosphere. 2015; 6(9):1362-1376. https://doi.org/10.3390/atmos6091362
Chicago/Turabian StyleGuo, Xiaohao, Chunsong Lu, Tianliang Zhao, Guang J. Zhang, and Yangang Liu. 2015. "An Observational Study of Entrainment Rate in Deep Convection" Atmosphere 6, no. 9: 1362-1376. https://doi.org/10.3390/atmos6091362