
Air Quality of Beijing and Impacts of the New Ambient Air Quality Standard


Abstract
:1. Introduction
2. Data and Methods
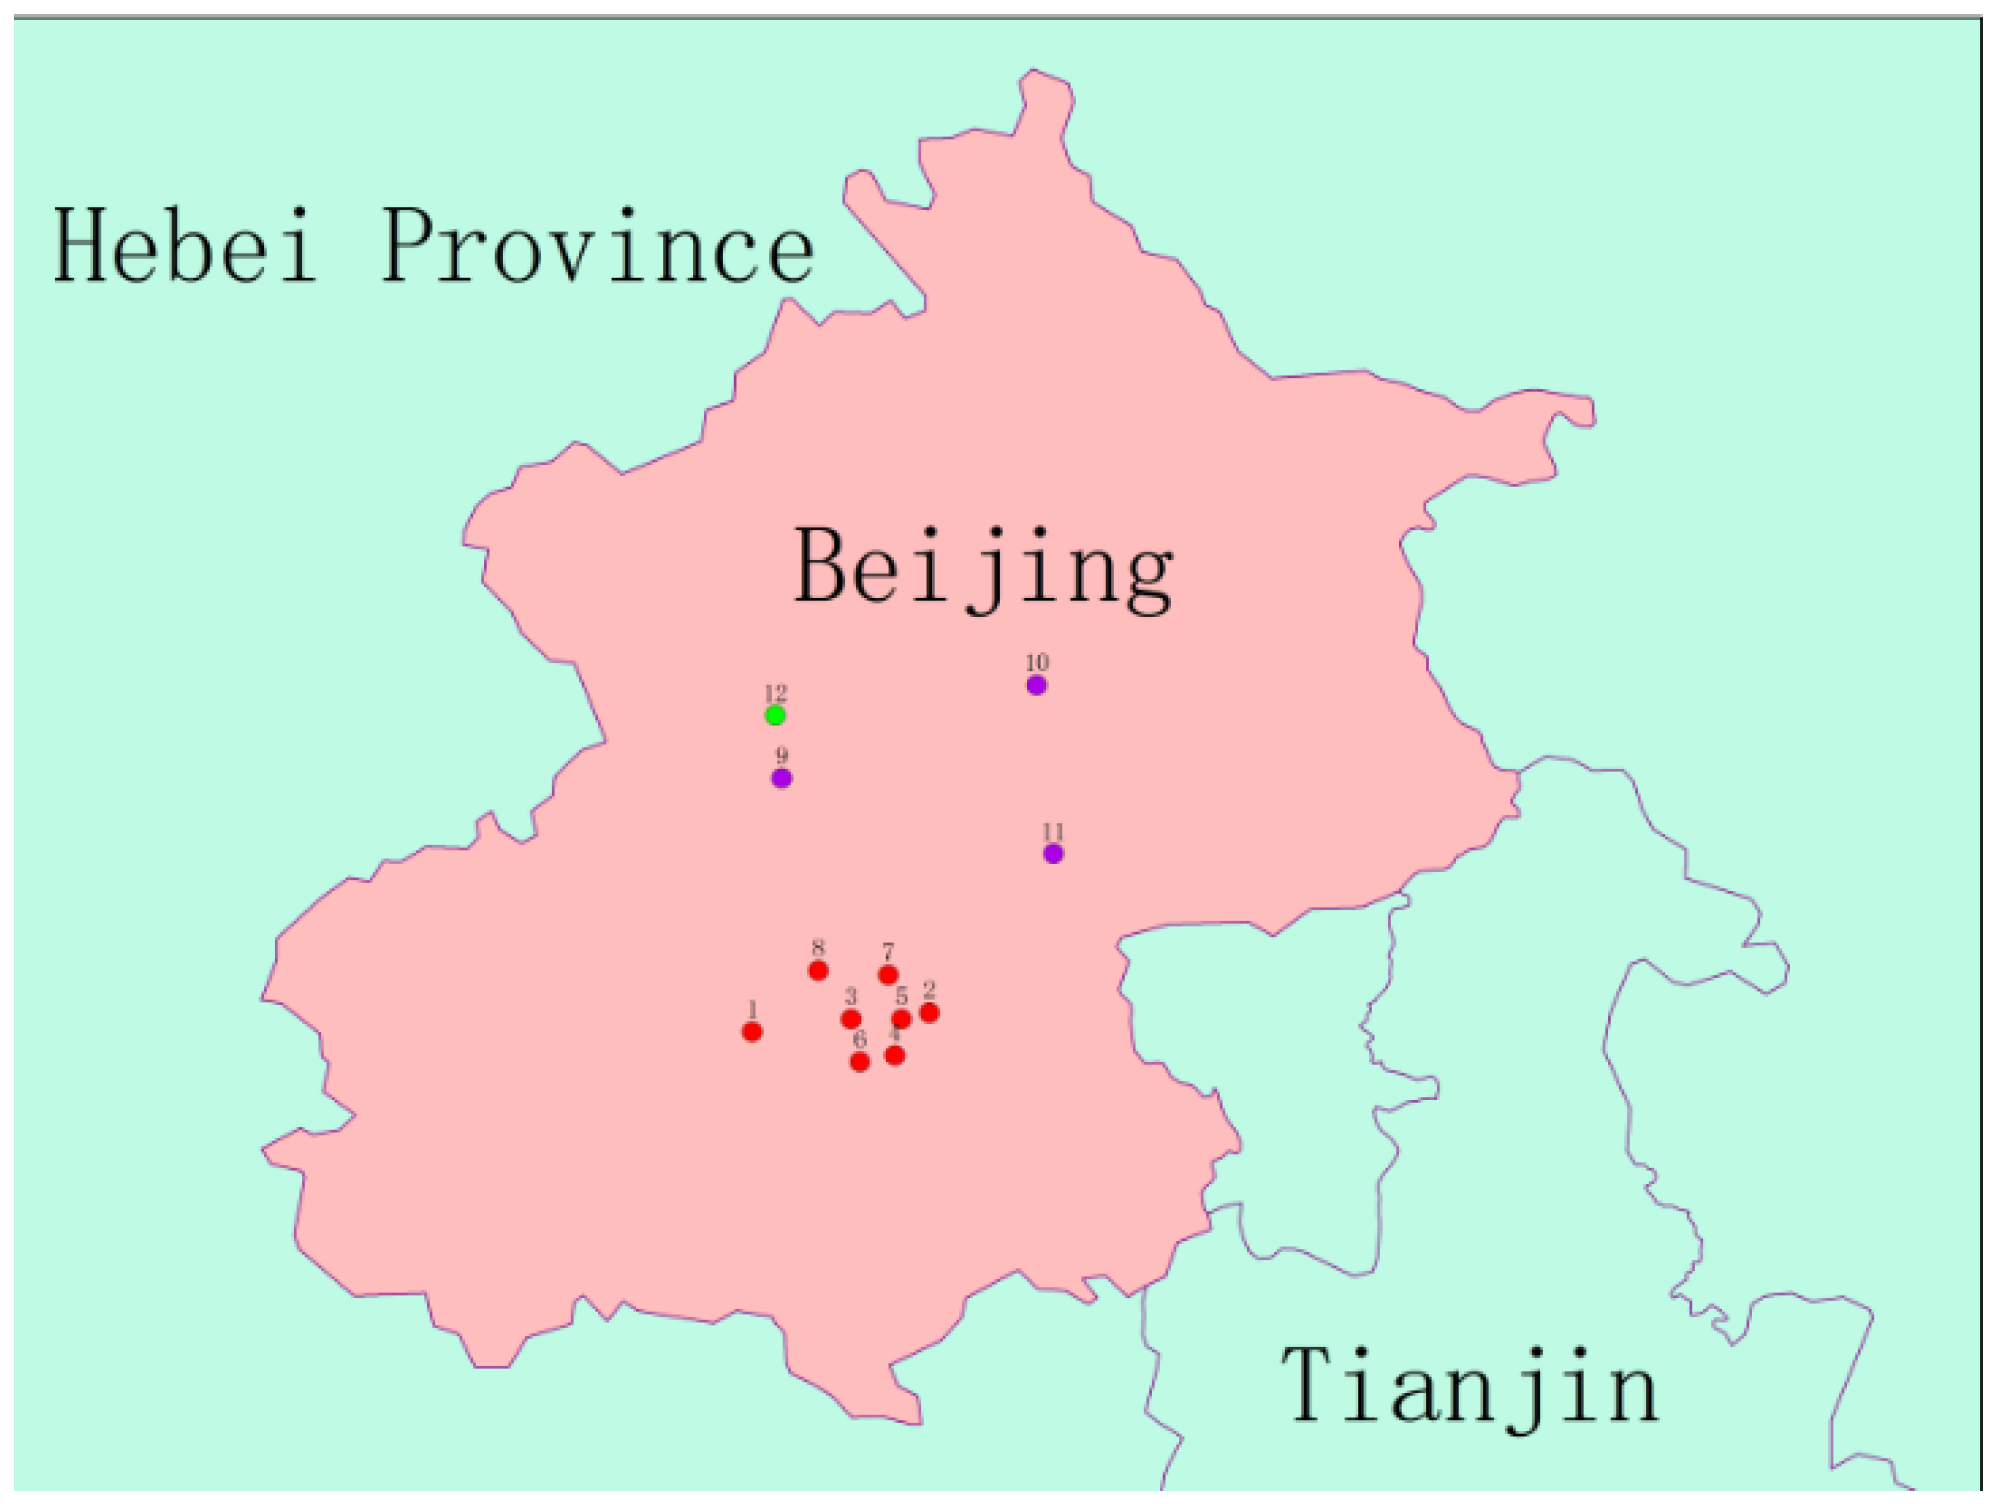
2.1. Data

| IAPI | Daily SO2 Concentration (μg/m3) | Daily NO2 Concentration (μg/m3) | Daily PM10 Concentration (μg/m3) |
|---|---|---|---|
| 50 | 50 | 80 | 50 |
| 100 | 150 | 120 | 150 |
| 200 | 800 | 280 | 350 |
| 300 | 1600 | 565 | 420 |
| 400 | 2100 | 750 | 400 |
| 500 | 2620 | 940 | 600 |
| IAQI | Daily SO2 Concentration (μg/m3) | Daily NO2 Concentration (μg/m3) | Daily PM10 Concentration (μg/m3) | Daily CO Concentration (mg/m3) | Daily O3 Concentration (μg/m3) | Daily PM2.5 Concentration (μg/m3) |
|---|---|---|---|---|---|---|
| 50 | 50 | 40 | 50 | 2 | 160 | 35 |
| 100 | 150 | 80 | 150 | 4 | 200 | 75 |
| 150 | 475 | 180 | 250 | 14 | 300 | 115 |
| 200 | 800 | 280 | 350 | 24 | 400 | 150 |
| 300 | 1600 | 565 | 420 | 36 | 800 | 250 |
| 400 | 2100 | 750 | 500 | 48 | 1000 | 350 |
| 500 | 2620 | 940 | 600 | 60 | 1200 | 500 |

2.2. Methods
3. Results and Discussion
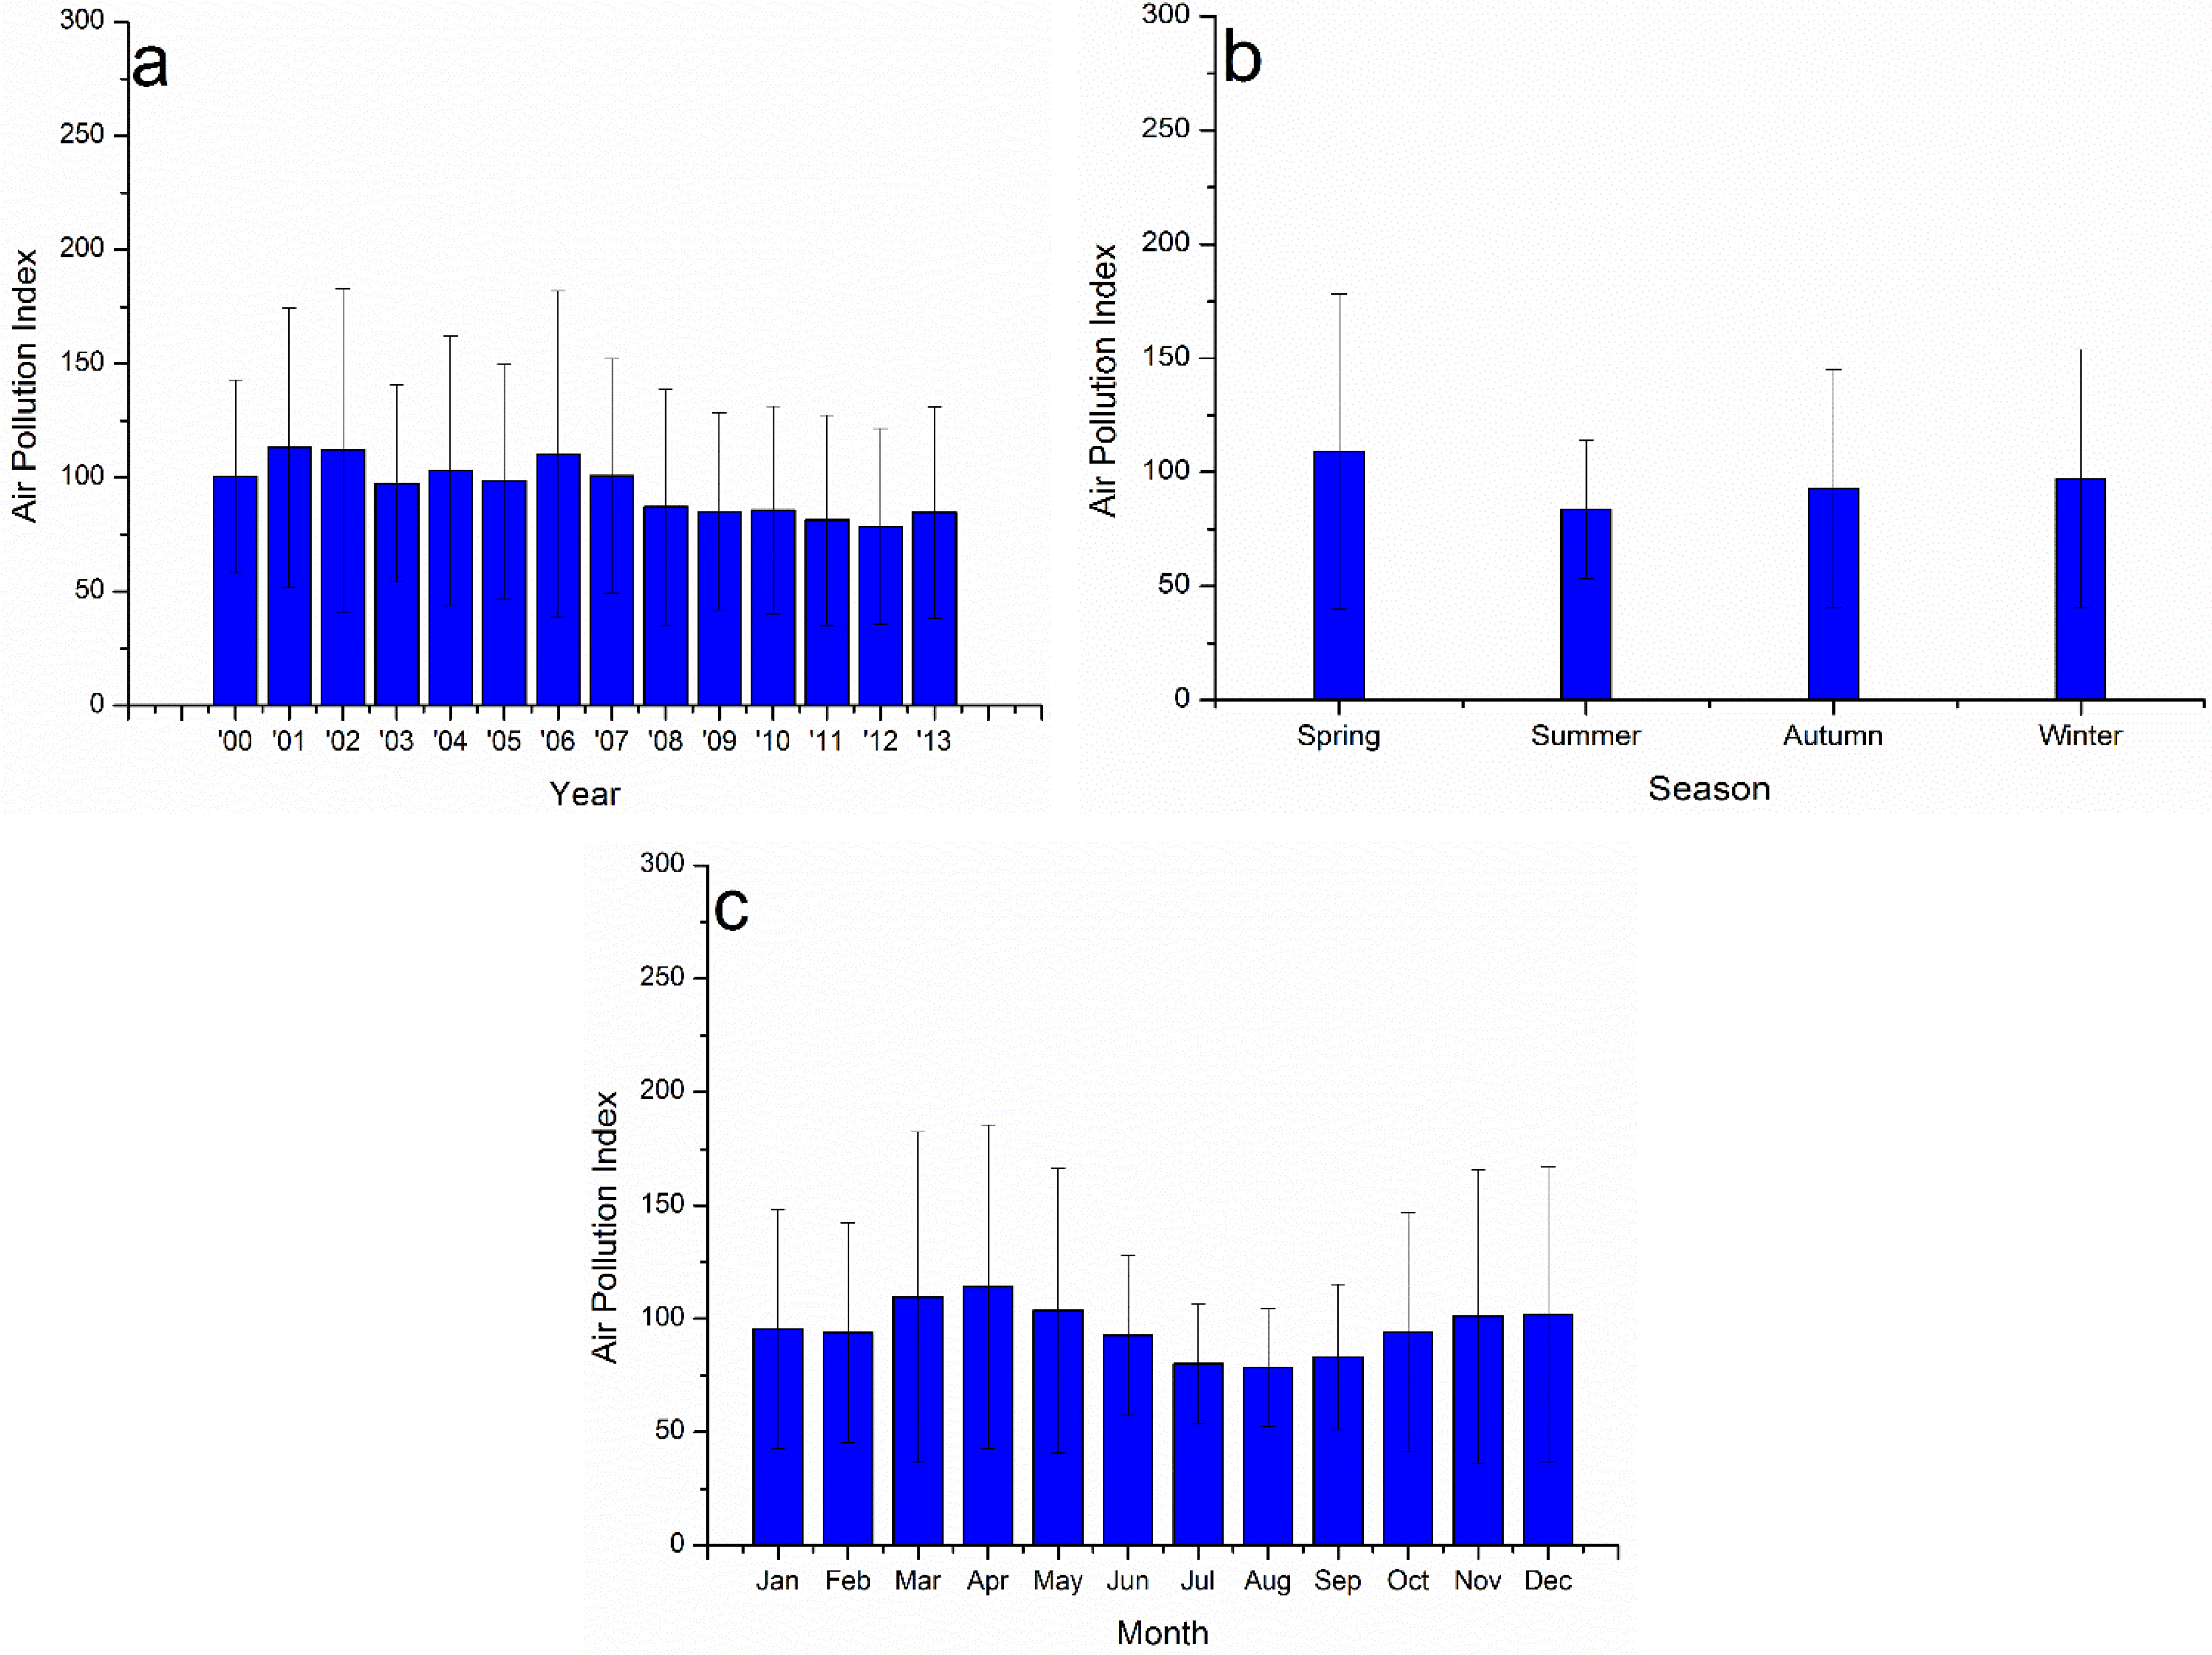
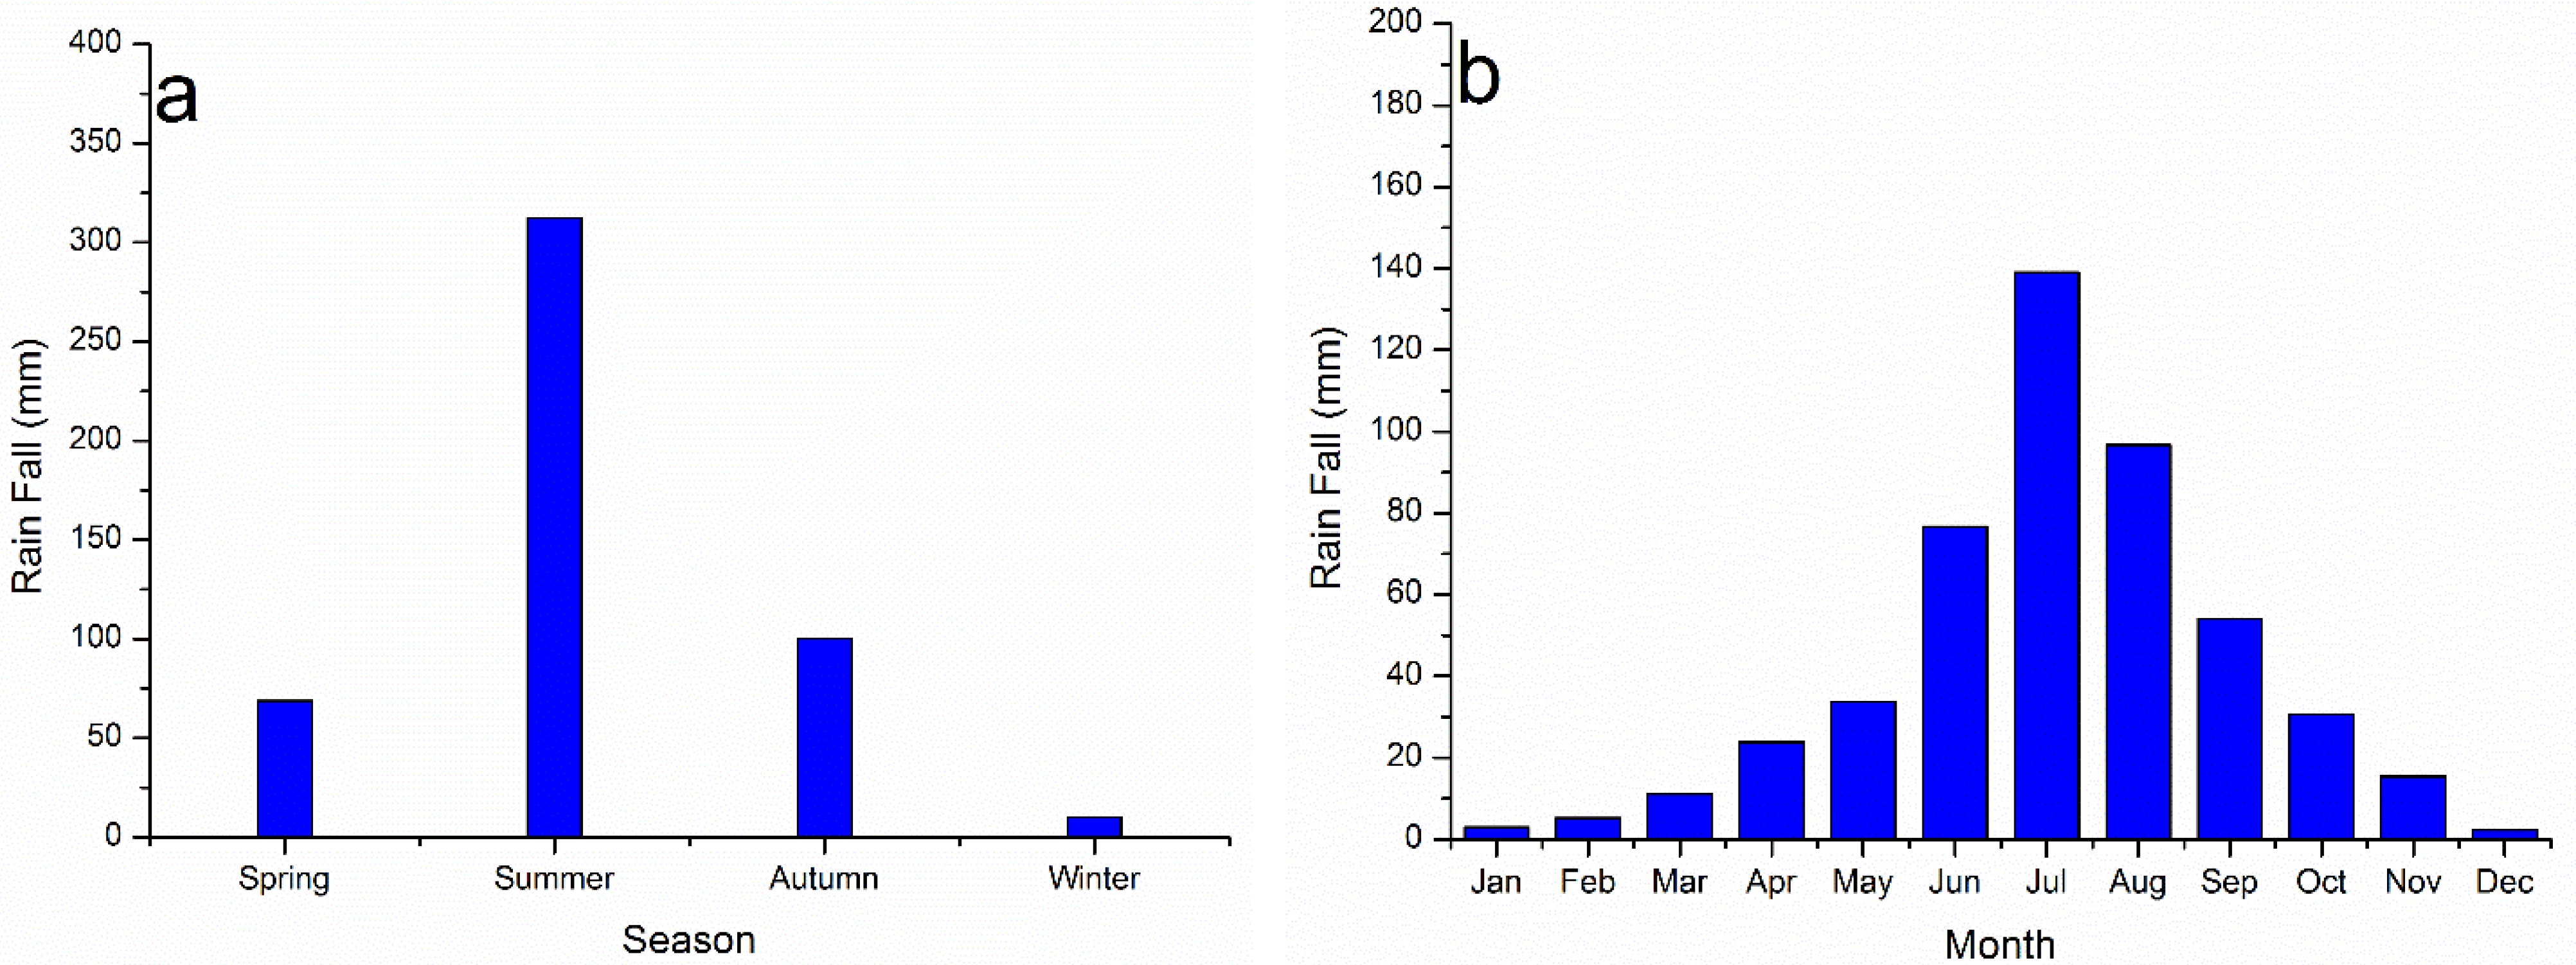
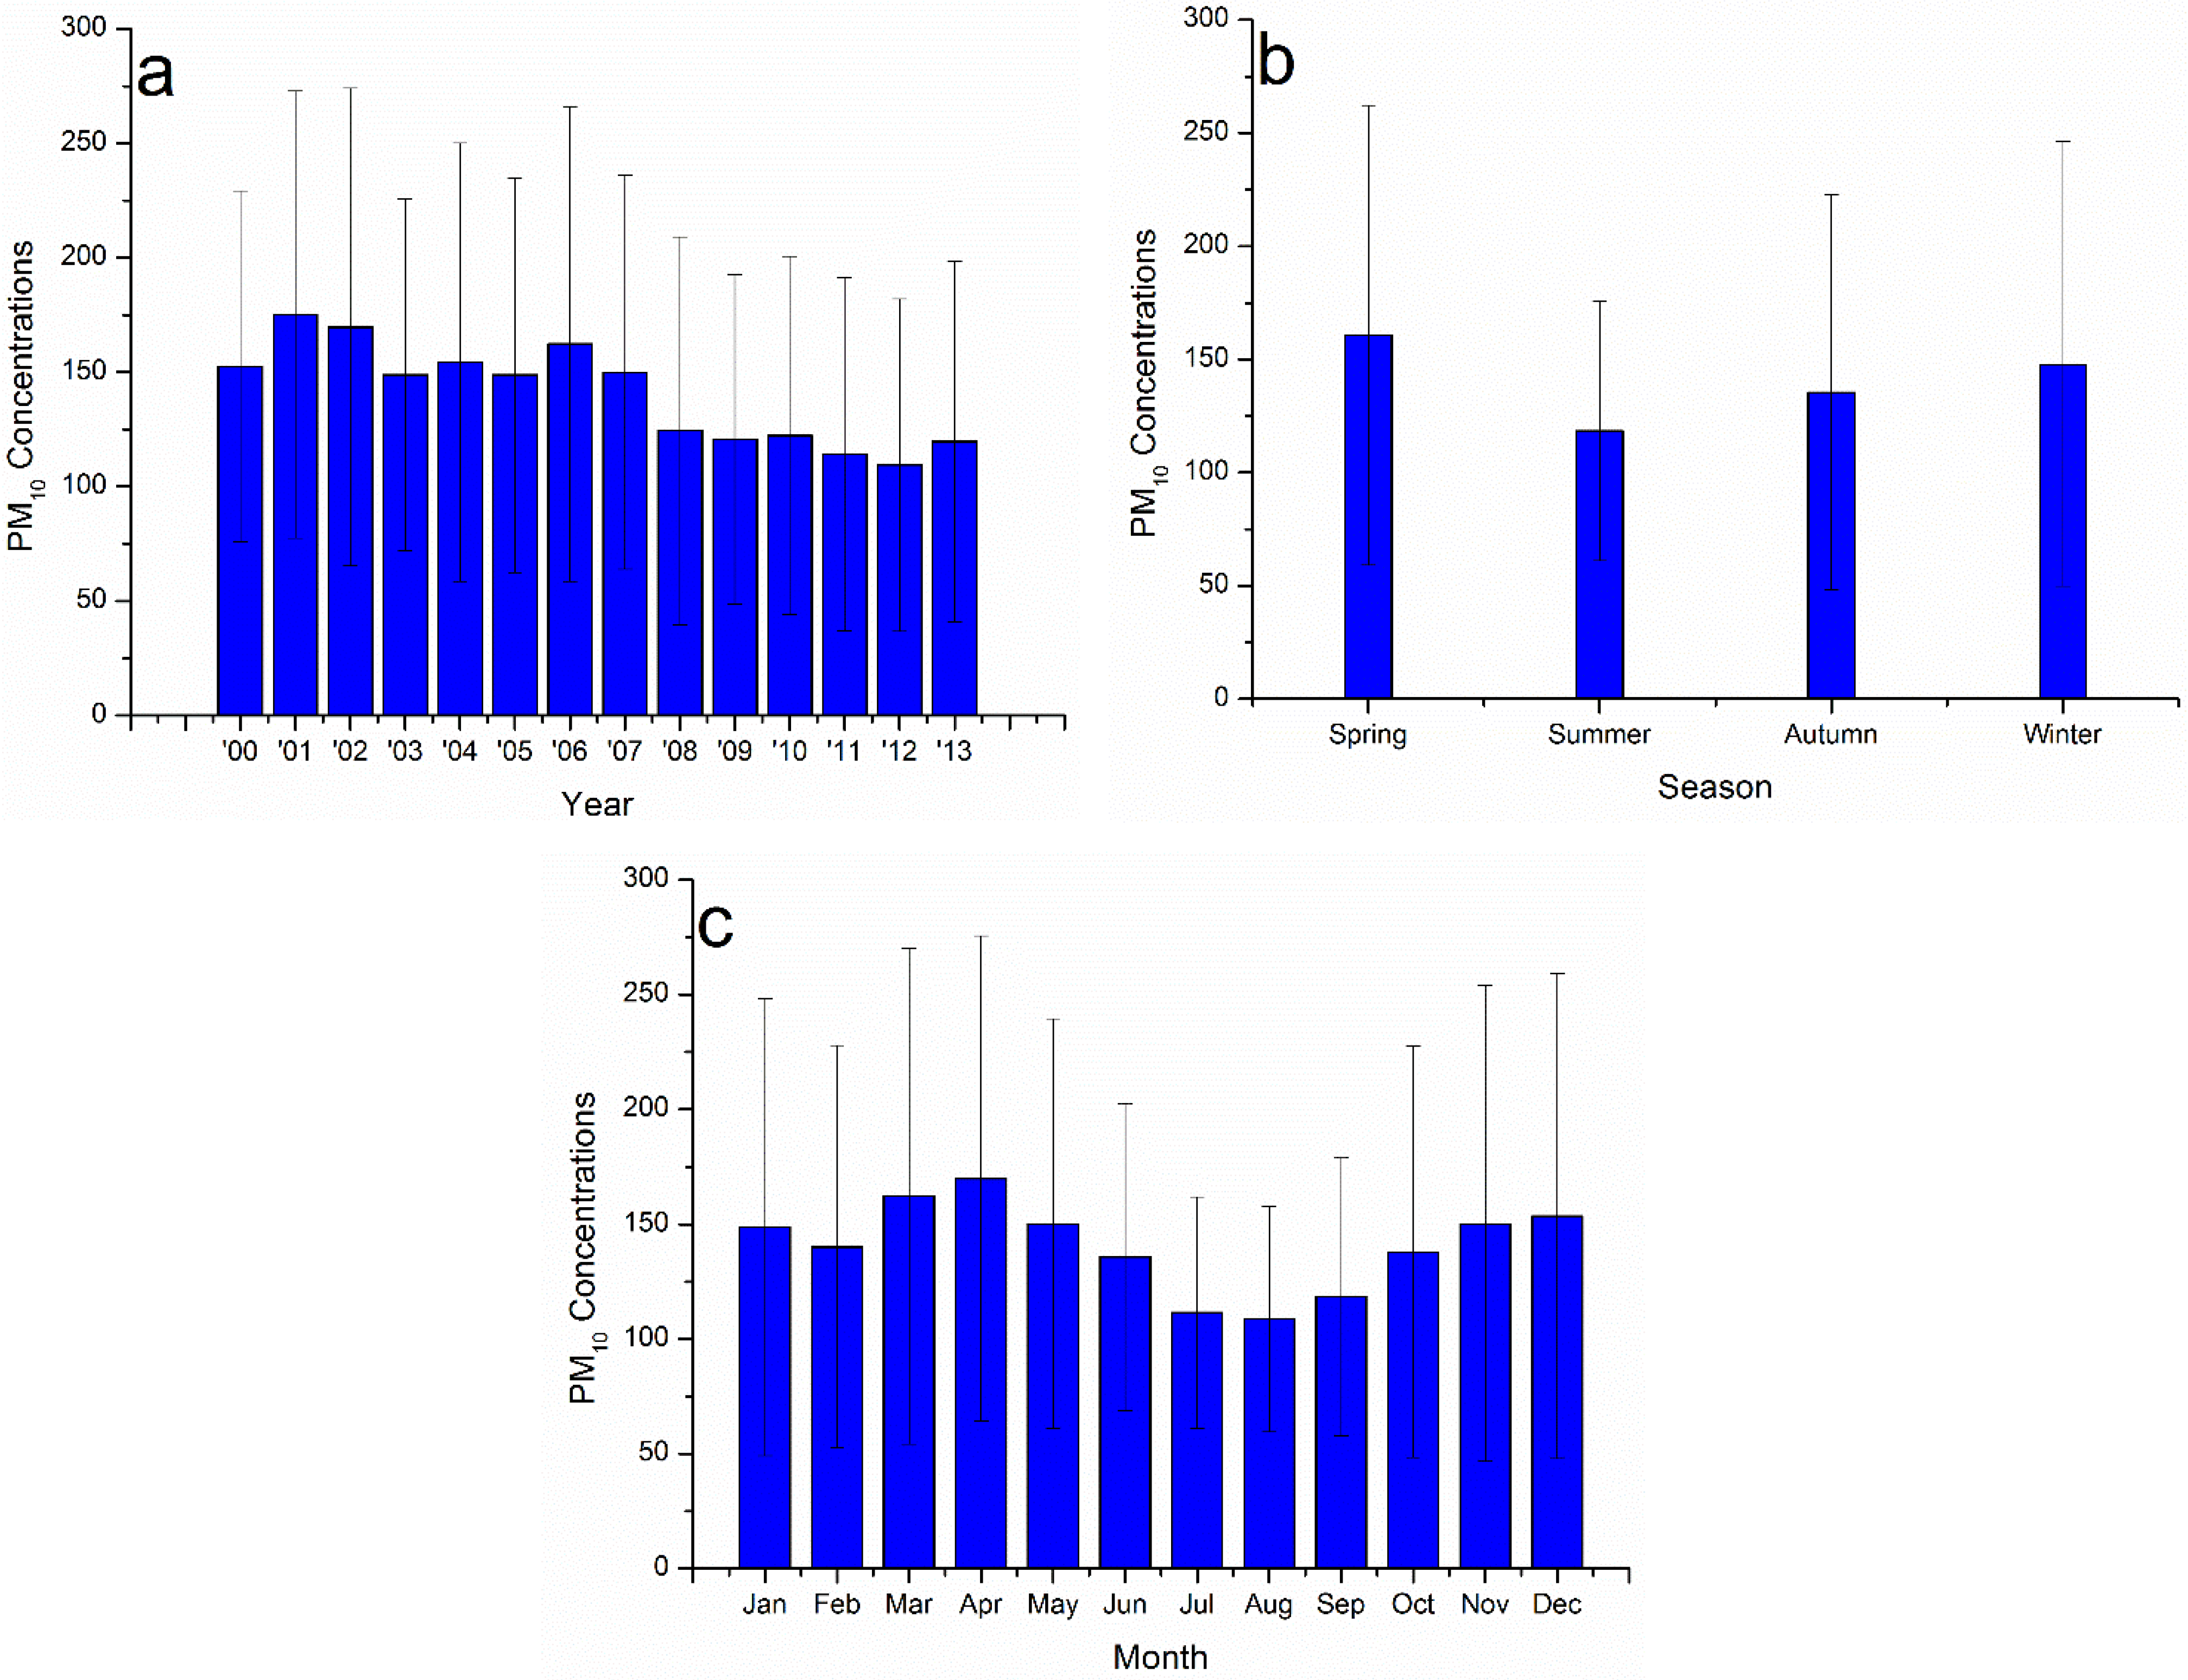
3.1. Air Pollution and Quality under NAAQS-1996


| Year | “Blue Sky” Days | Level 1 Days | Level 2 Days | Level 3 Days | Level 4 and 5 Days |
|---|---|---|---|---|---|
| 2001 | 185 | 12 | 173 | 157 | 23 |
| 2002 | 20322 | 22 | 181 | 143 | 19 |
| 2003 | 224 | 27 | 197 | 136 | 5 |
| 2004 | 228 | 33 | 195 | 121 | 17 |
| 2005 | 234 | 36 | 198 | 122 | 9 |
| 2006 | 241 | 26 | 215 | 100 | 24 |
| 2007 | 246 | 32 | 214 | 108 | 11 |
| 2008 | 274 | 62 | 212 | 84 | 8 |
| 2009 | 285 | 47 | 238 | 75 | 5 |
| 2010 | 286 | 53 | 233 | 73 | 6 |
| 2011 | 286 | 76 | 210 | 74 | 5 |
| 2012 | 281 | 86 | 196 | 81 | 5 |
| 2013 | 271 | 58 | 213 | 84 | 7 |
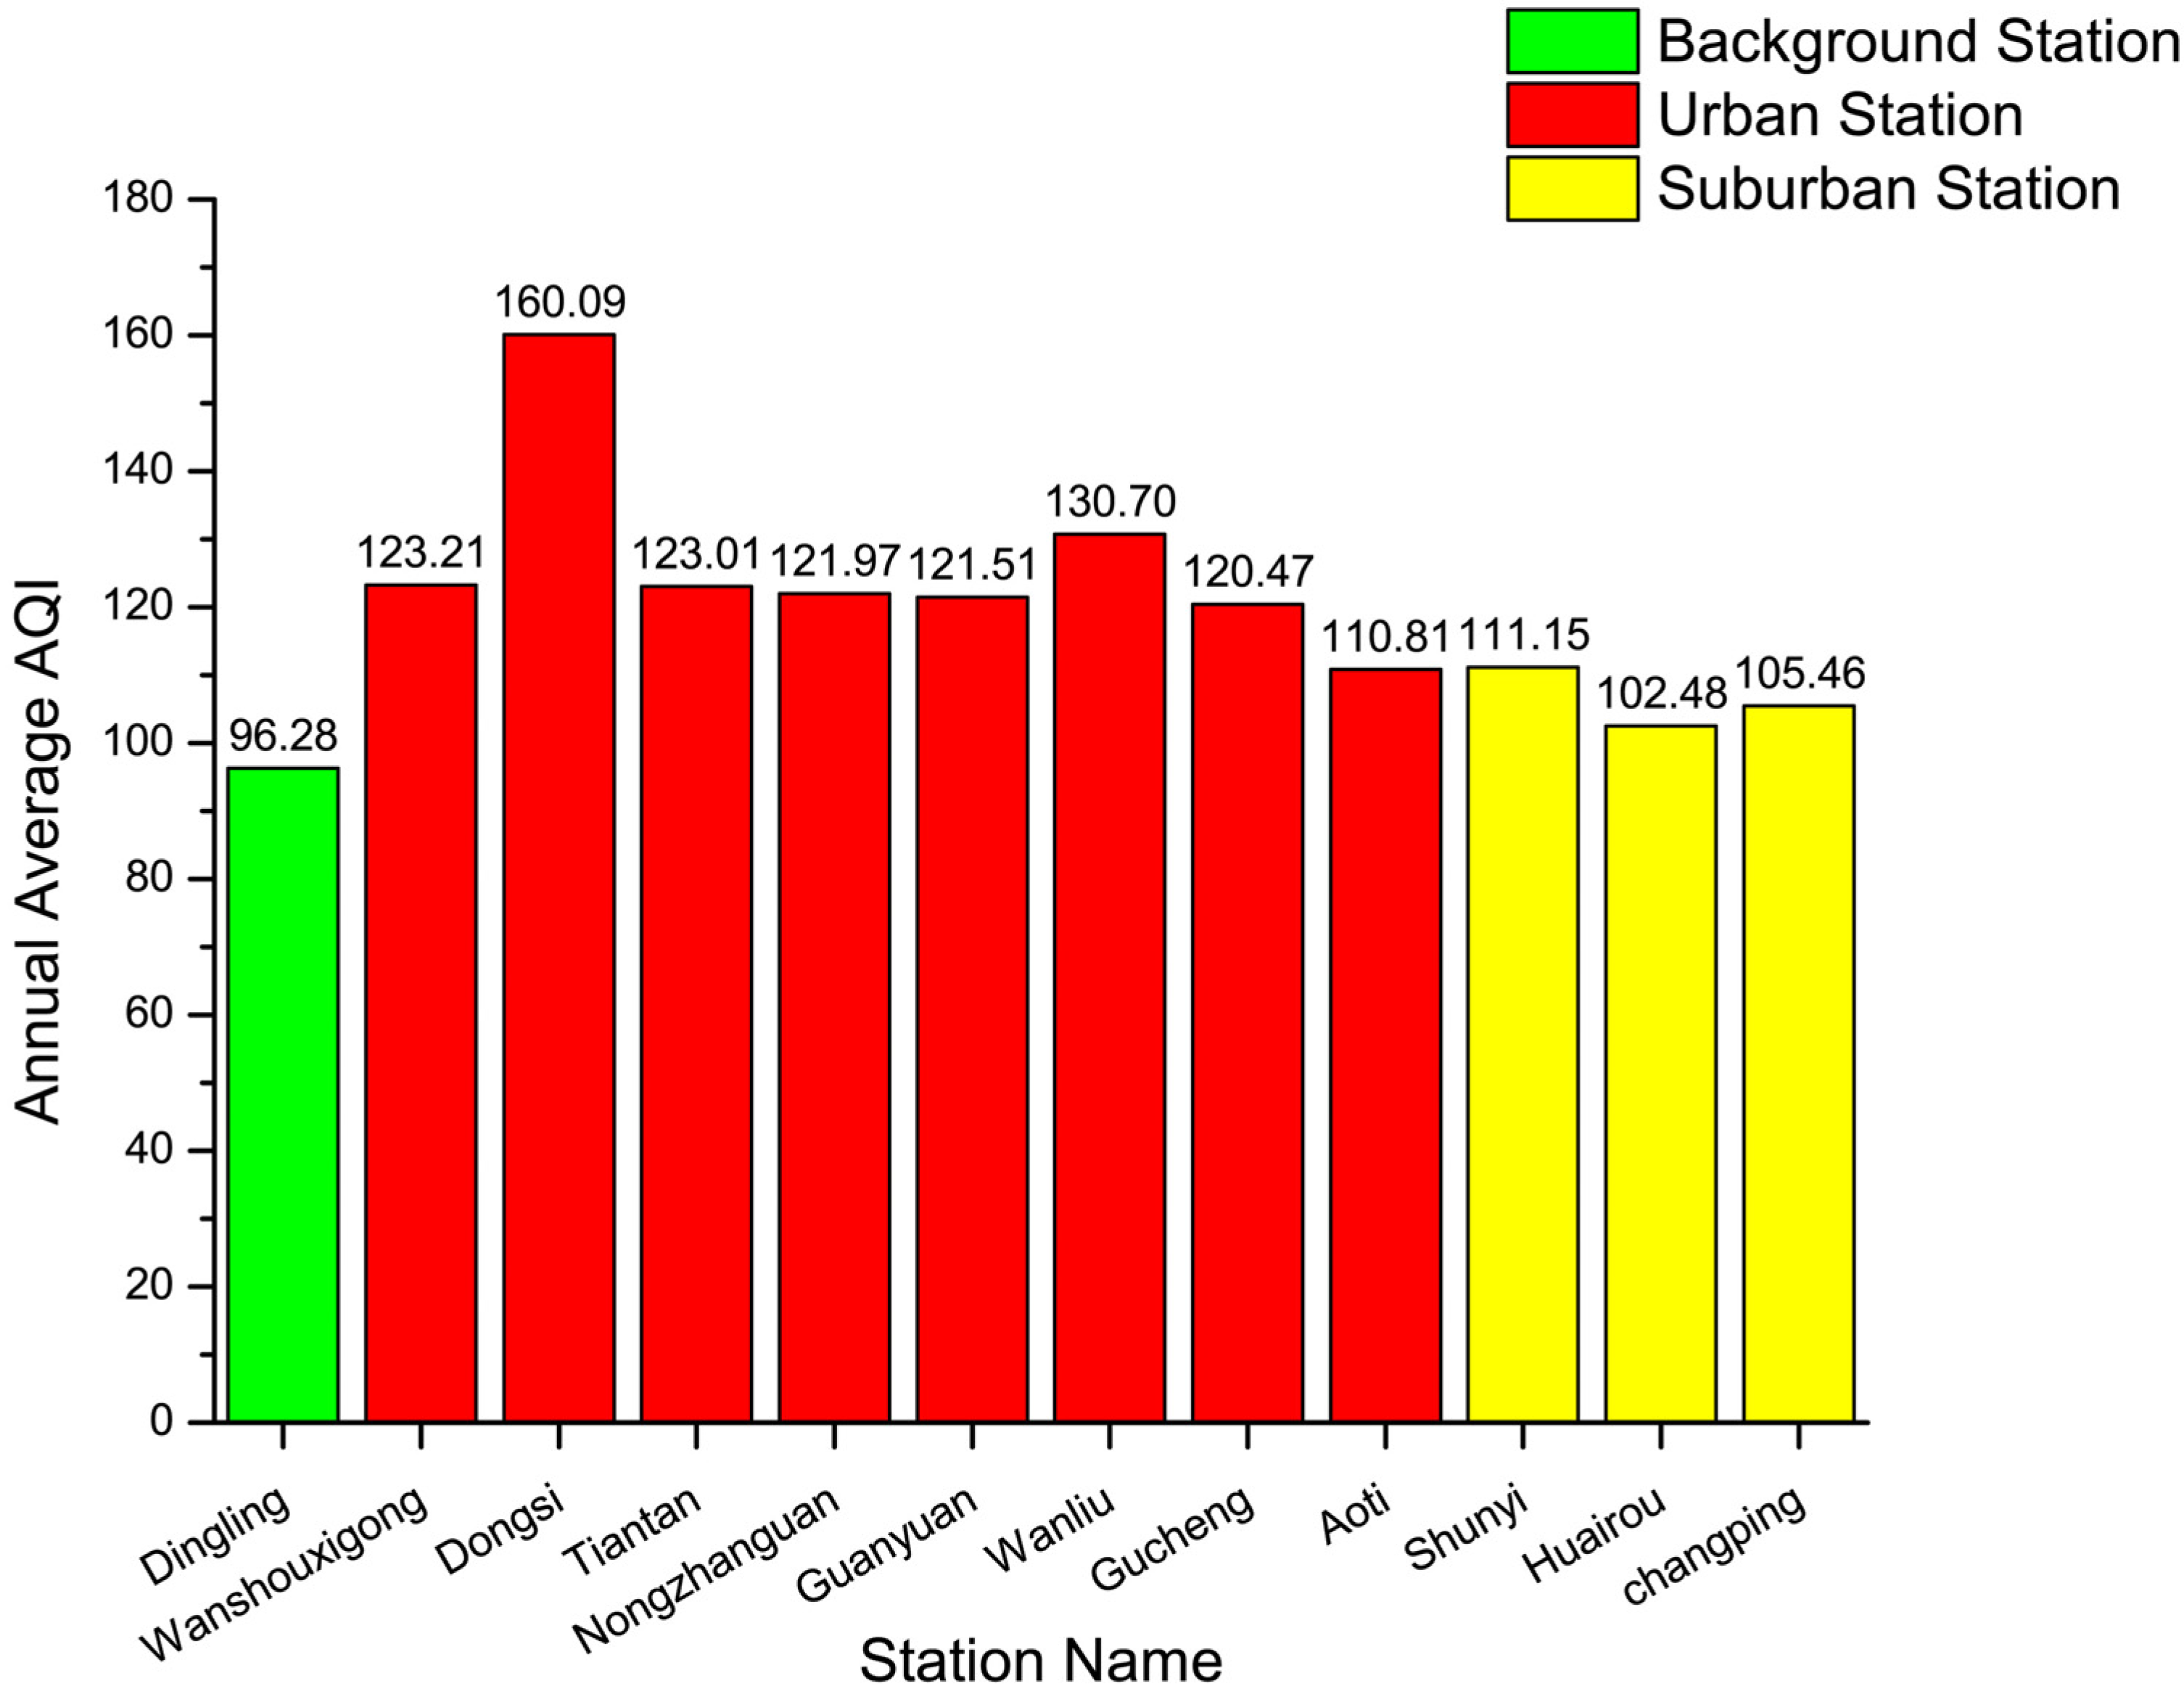
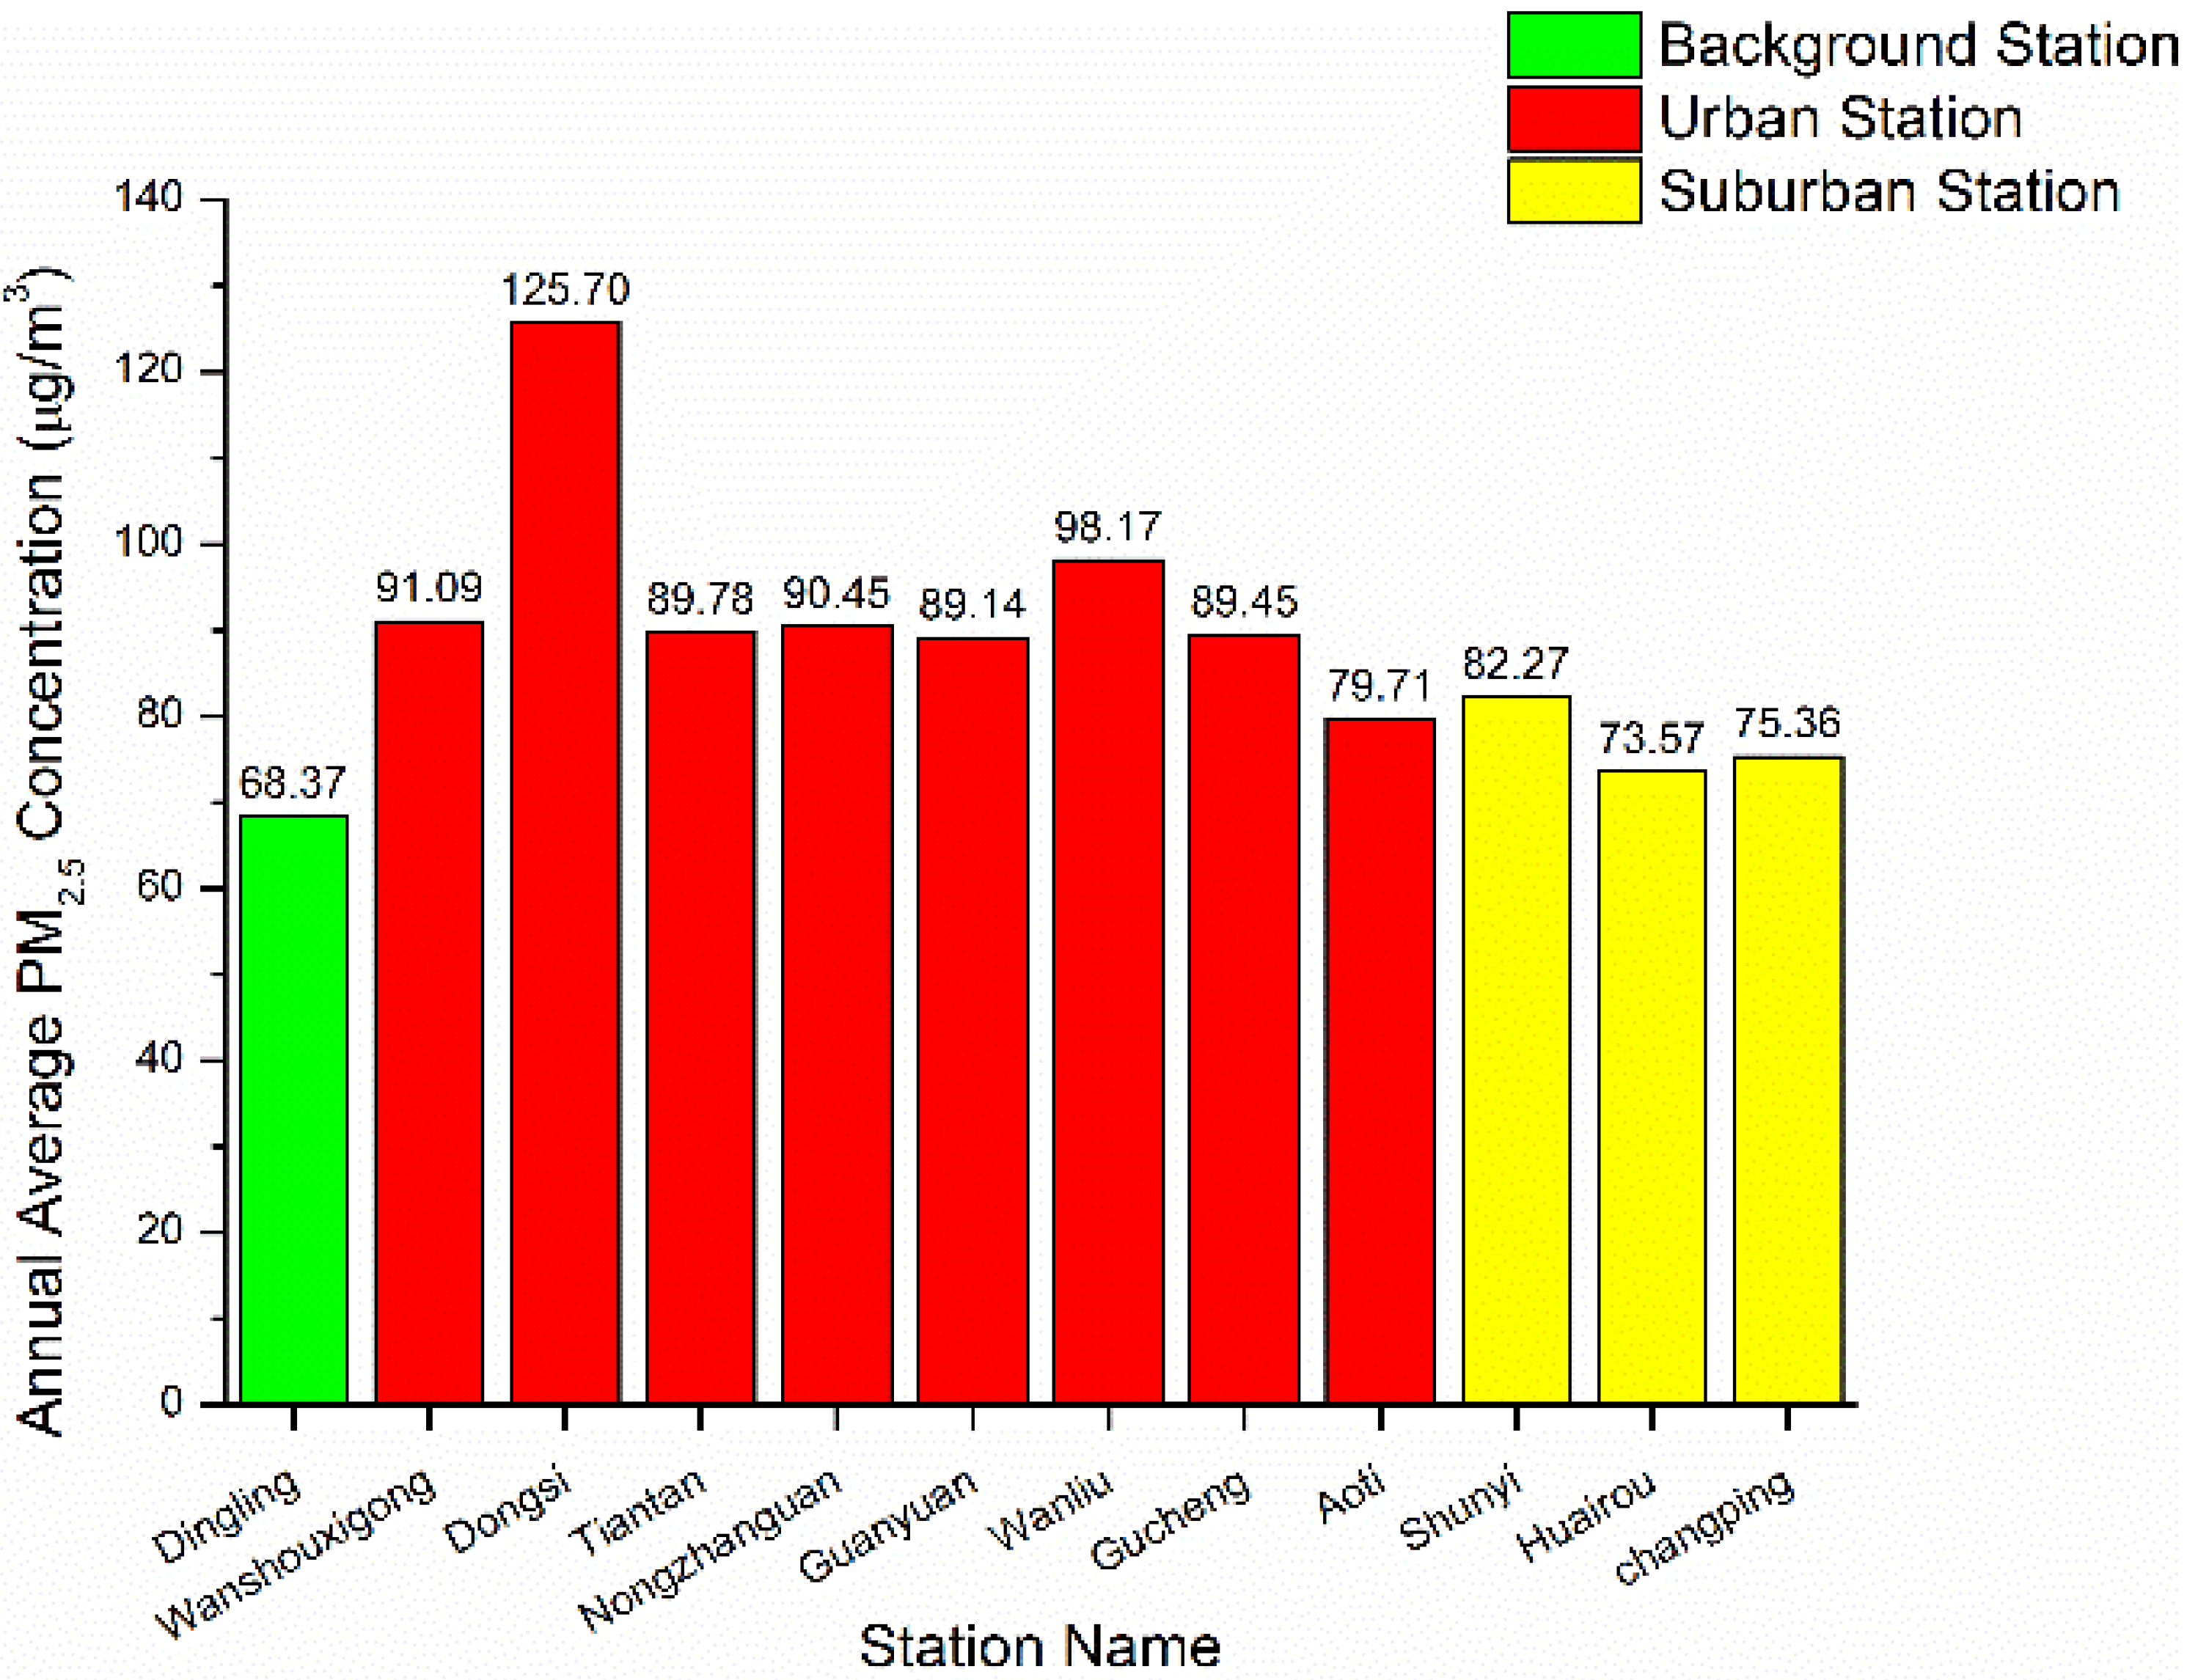
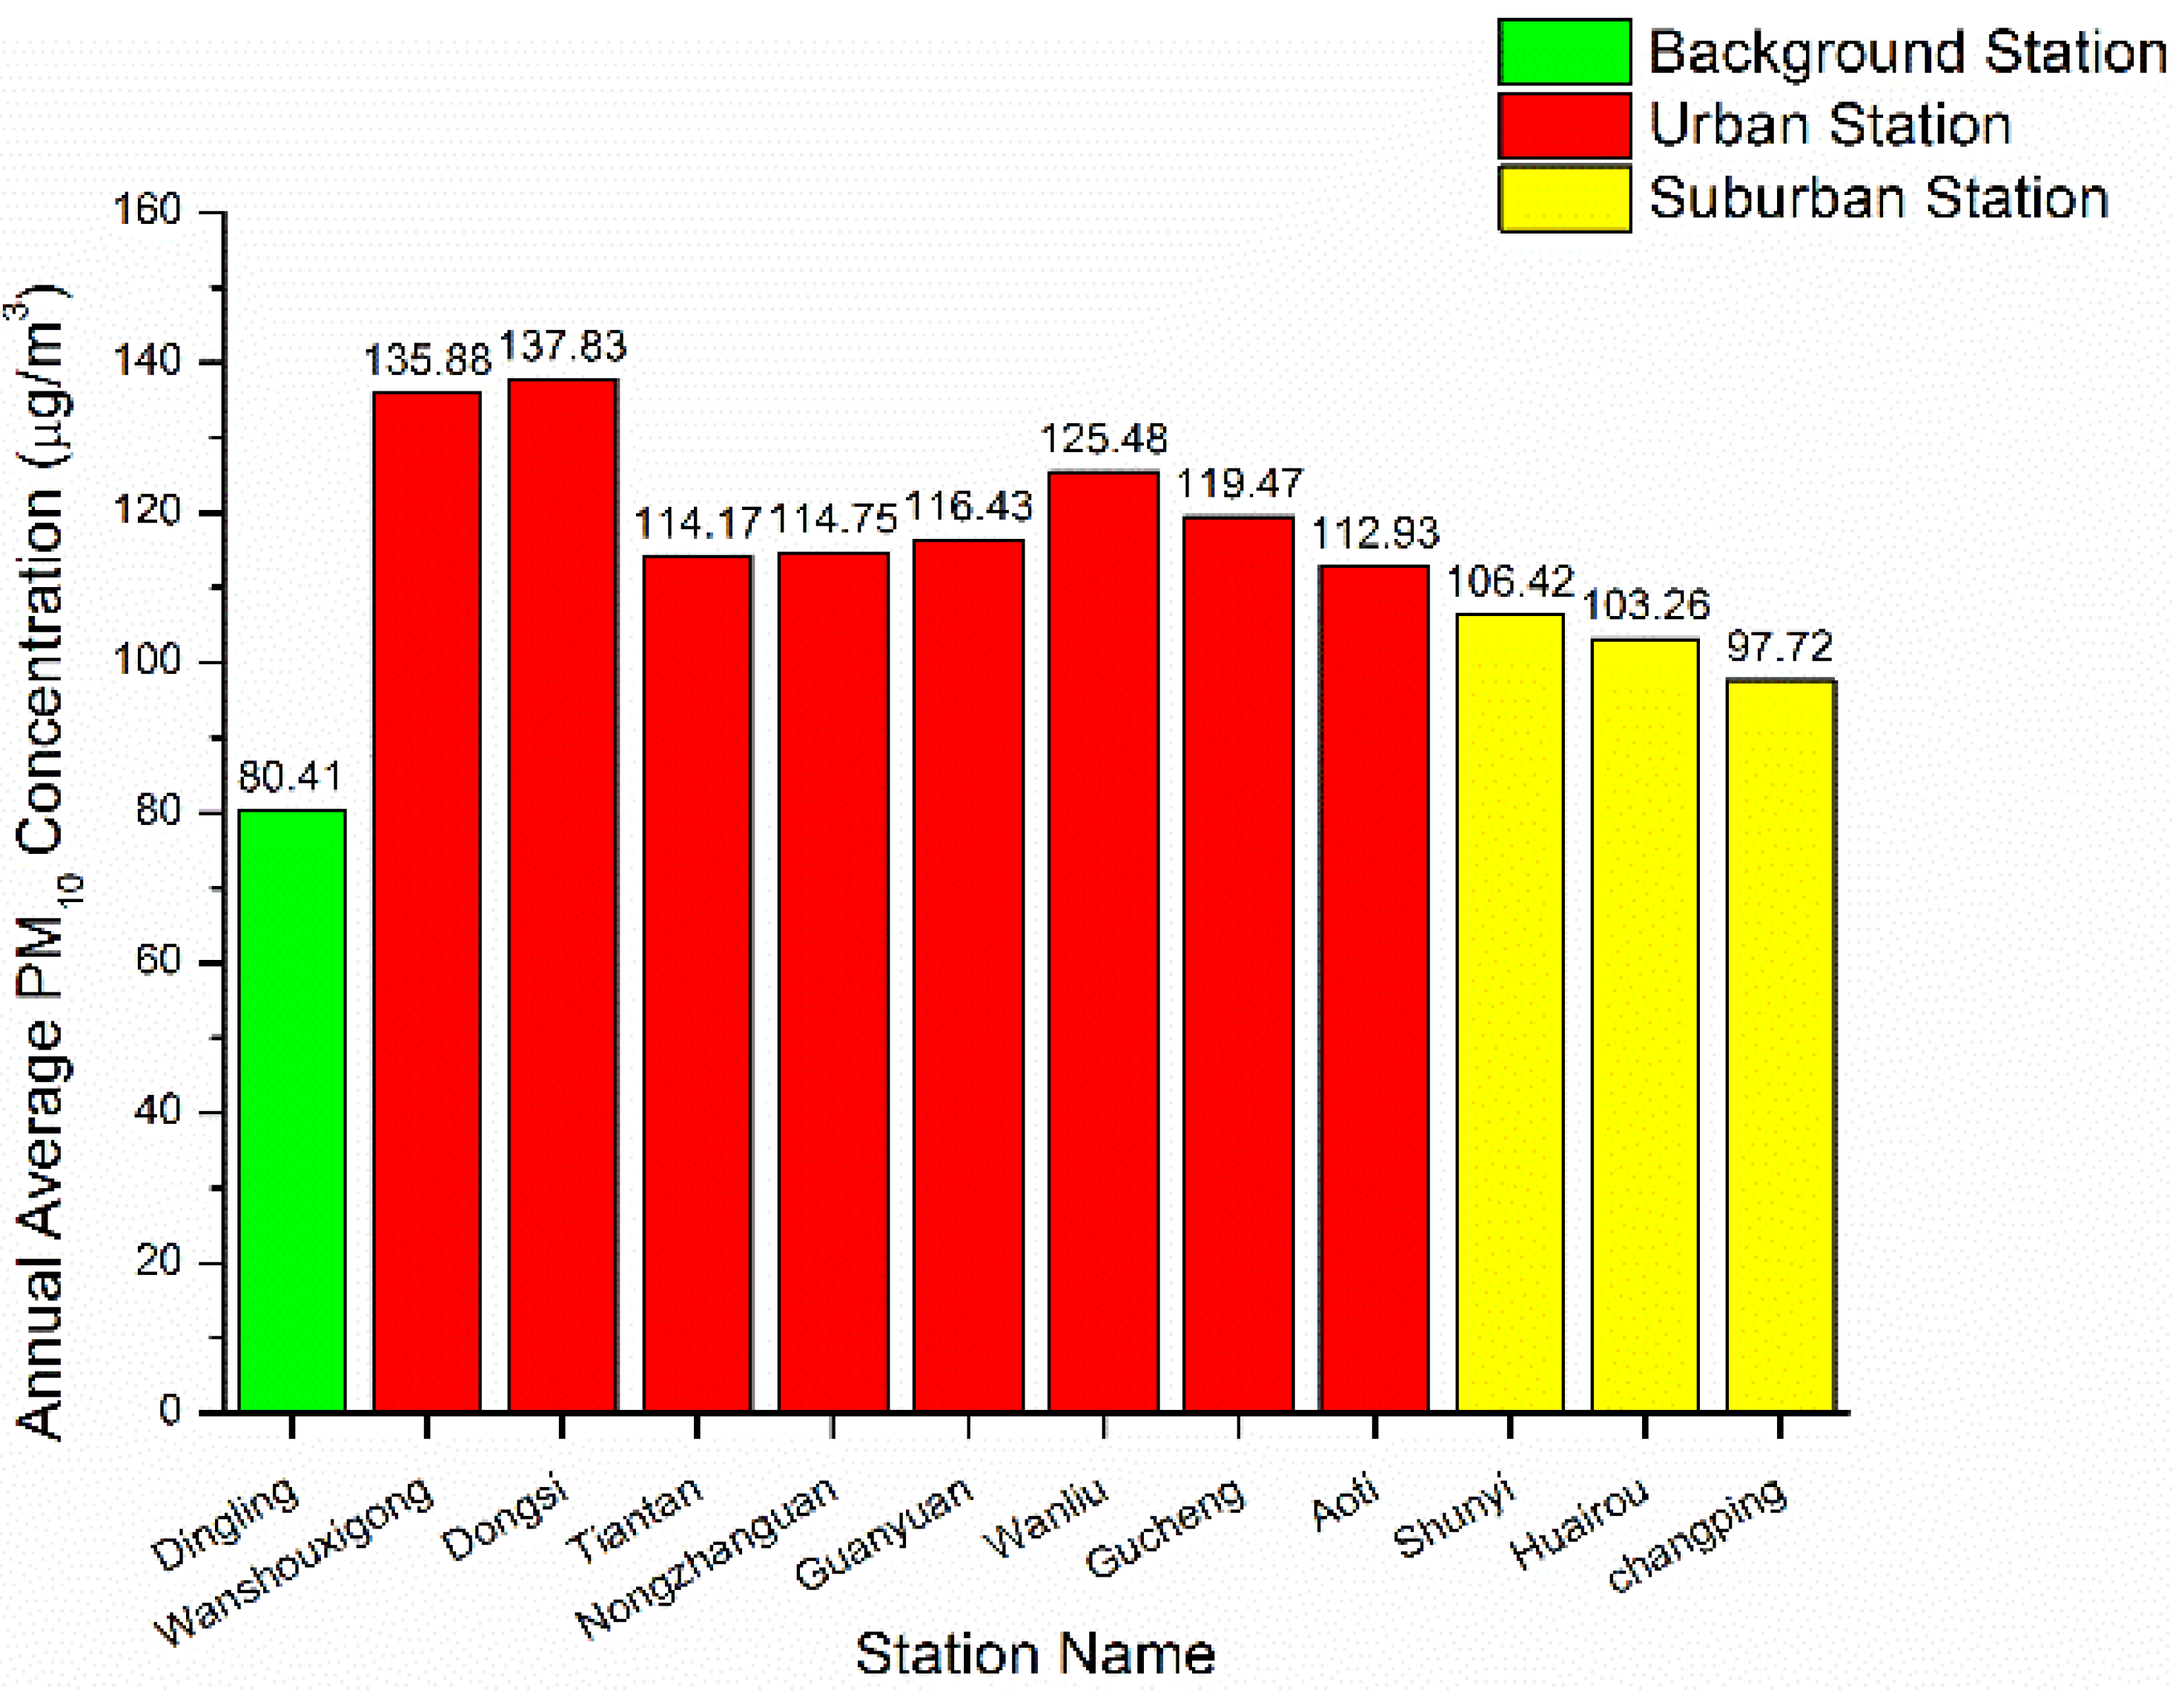
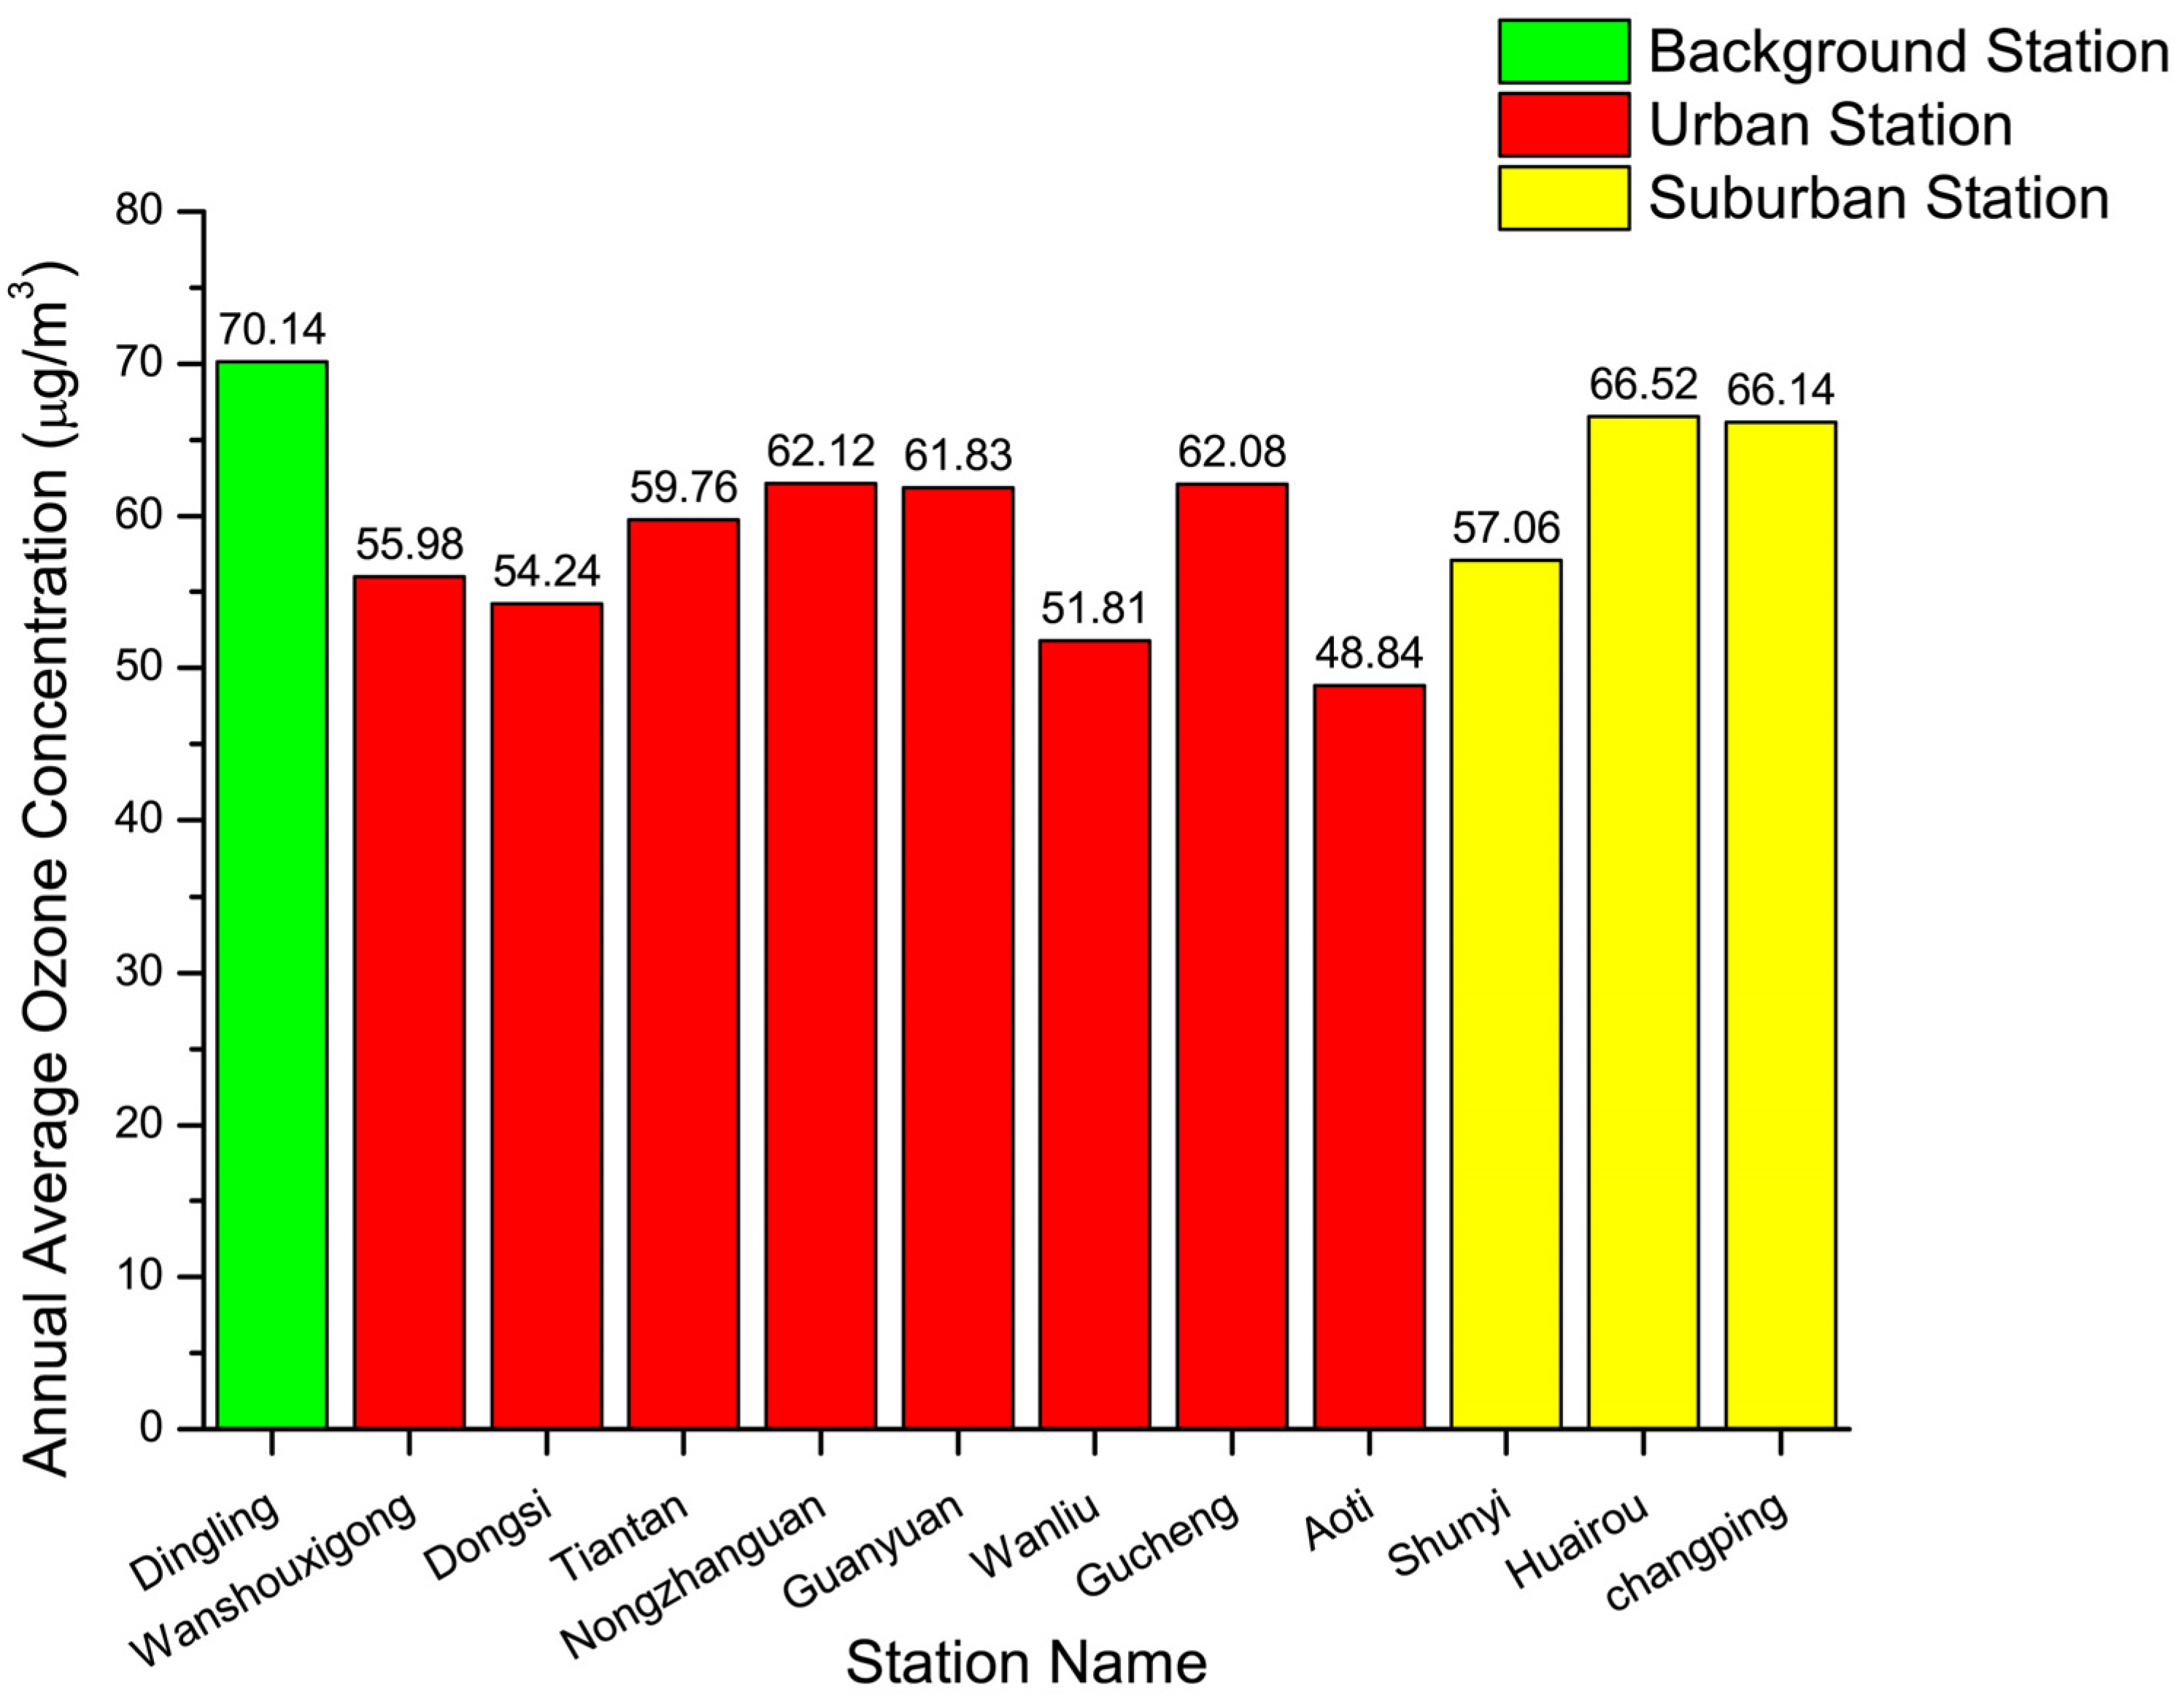
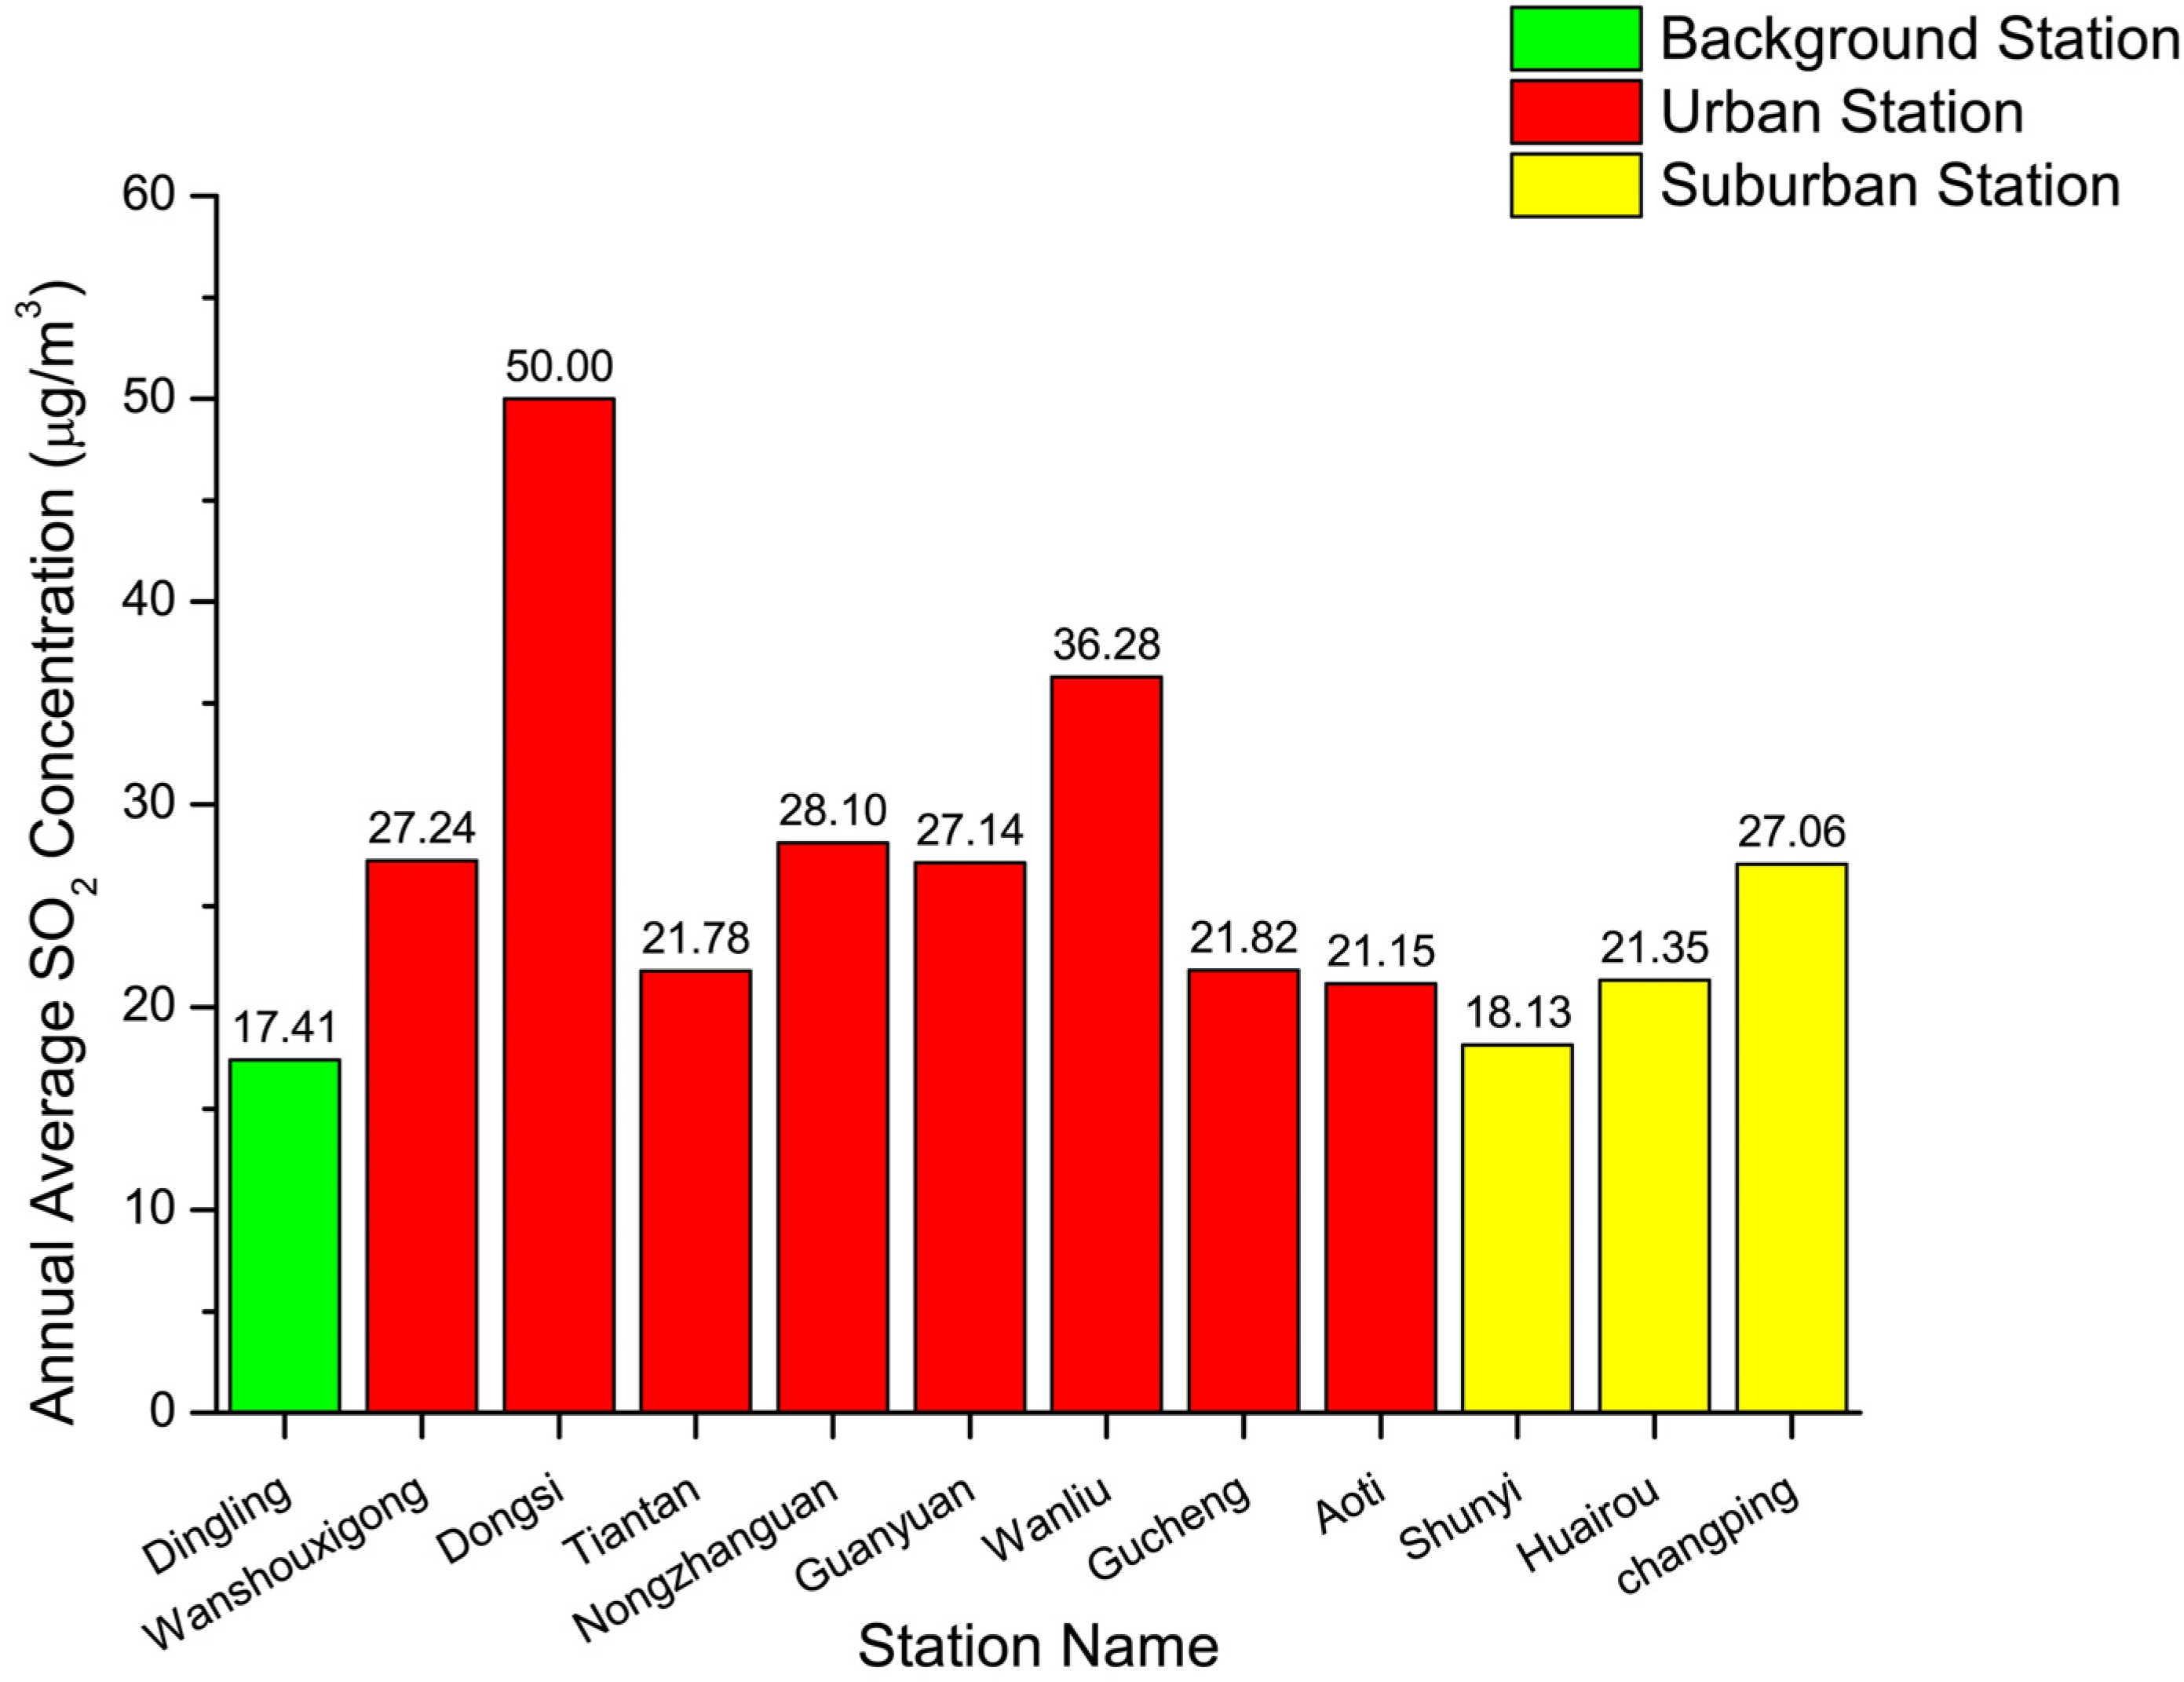
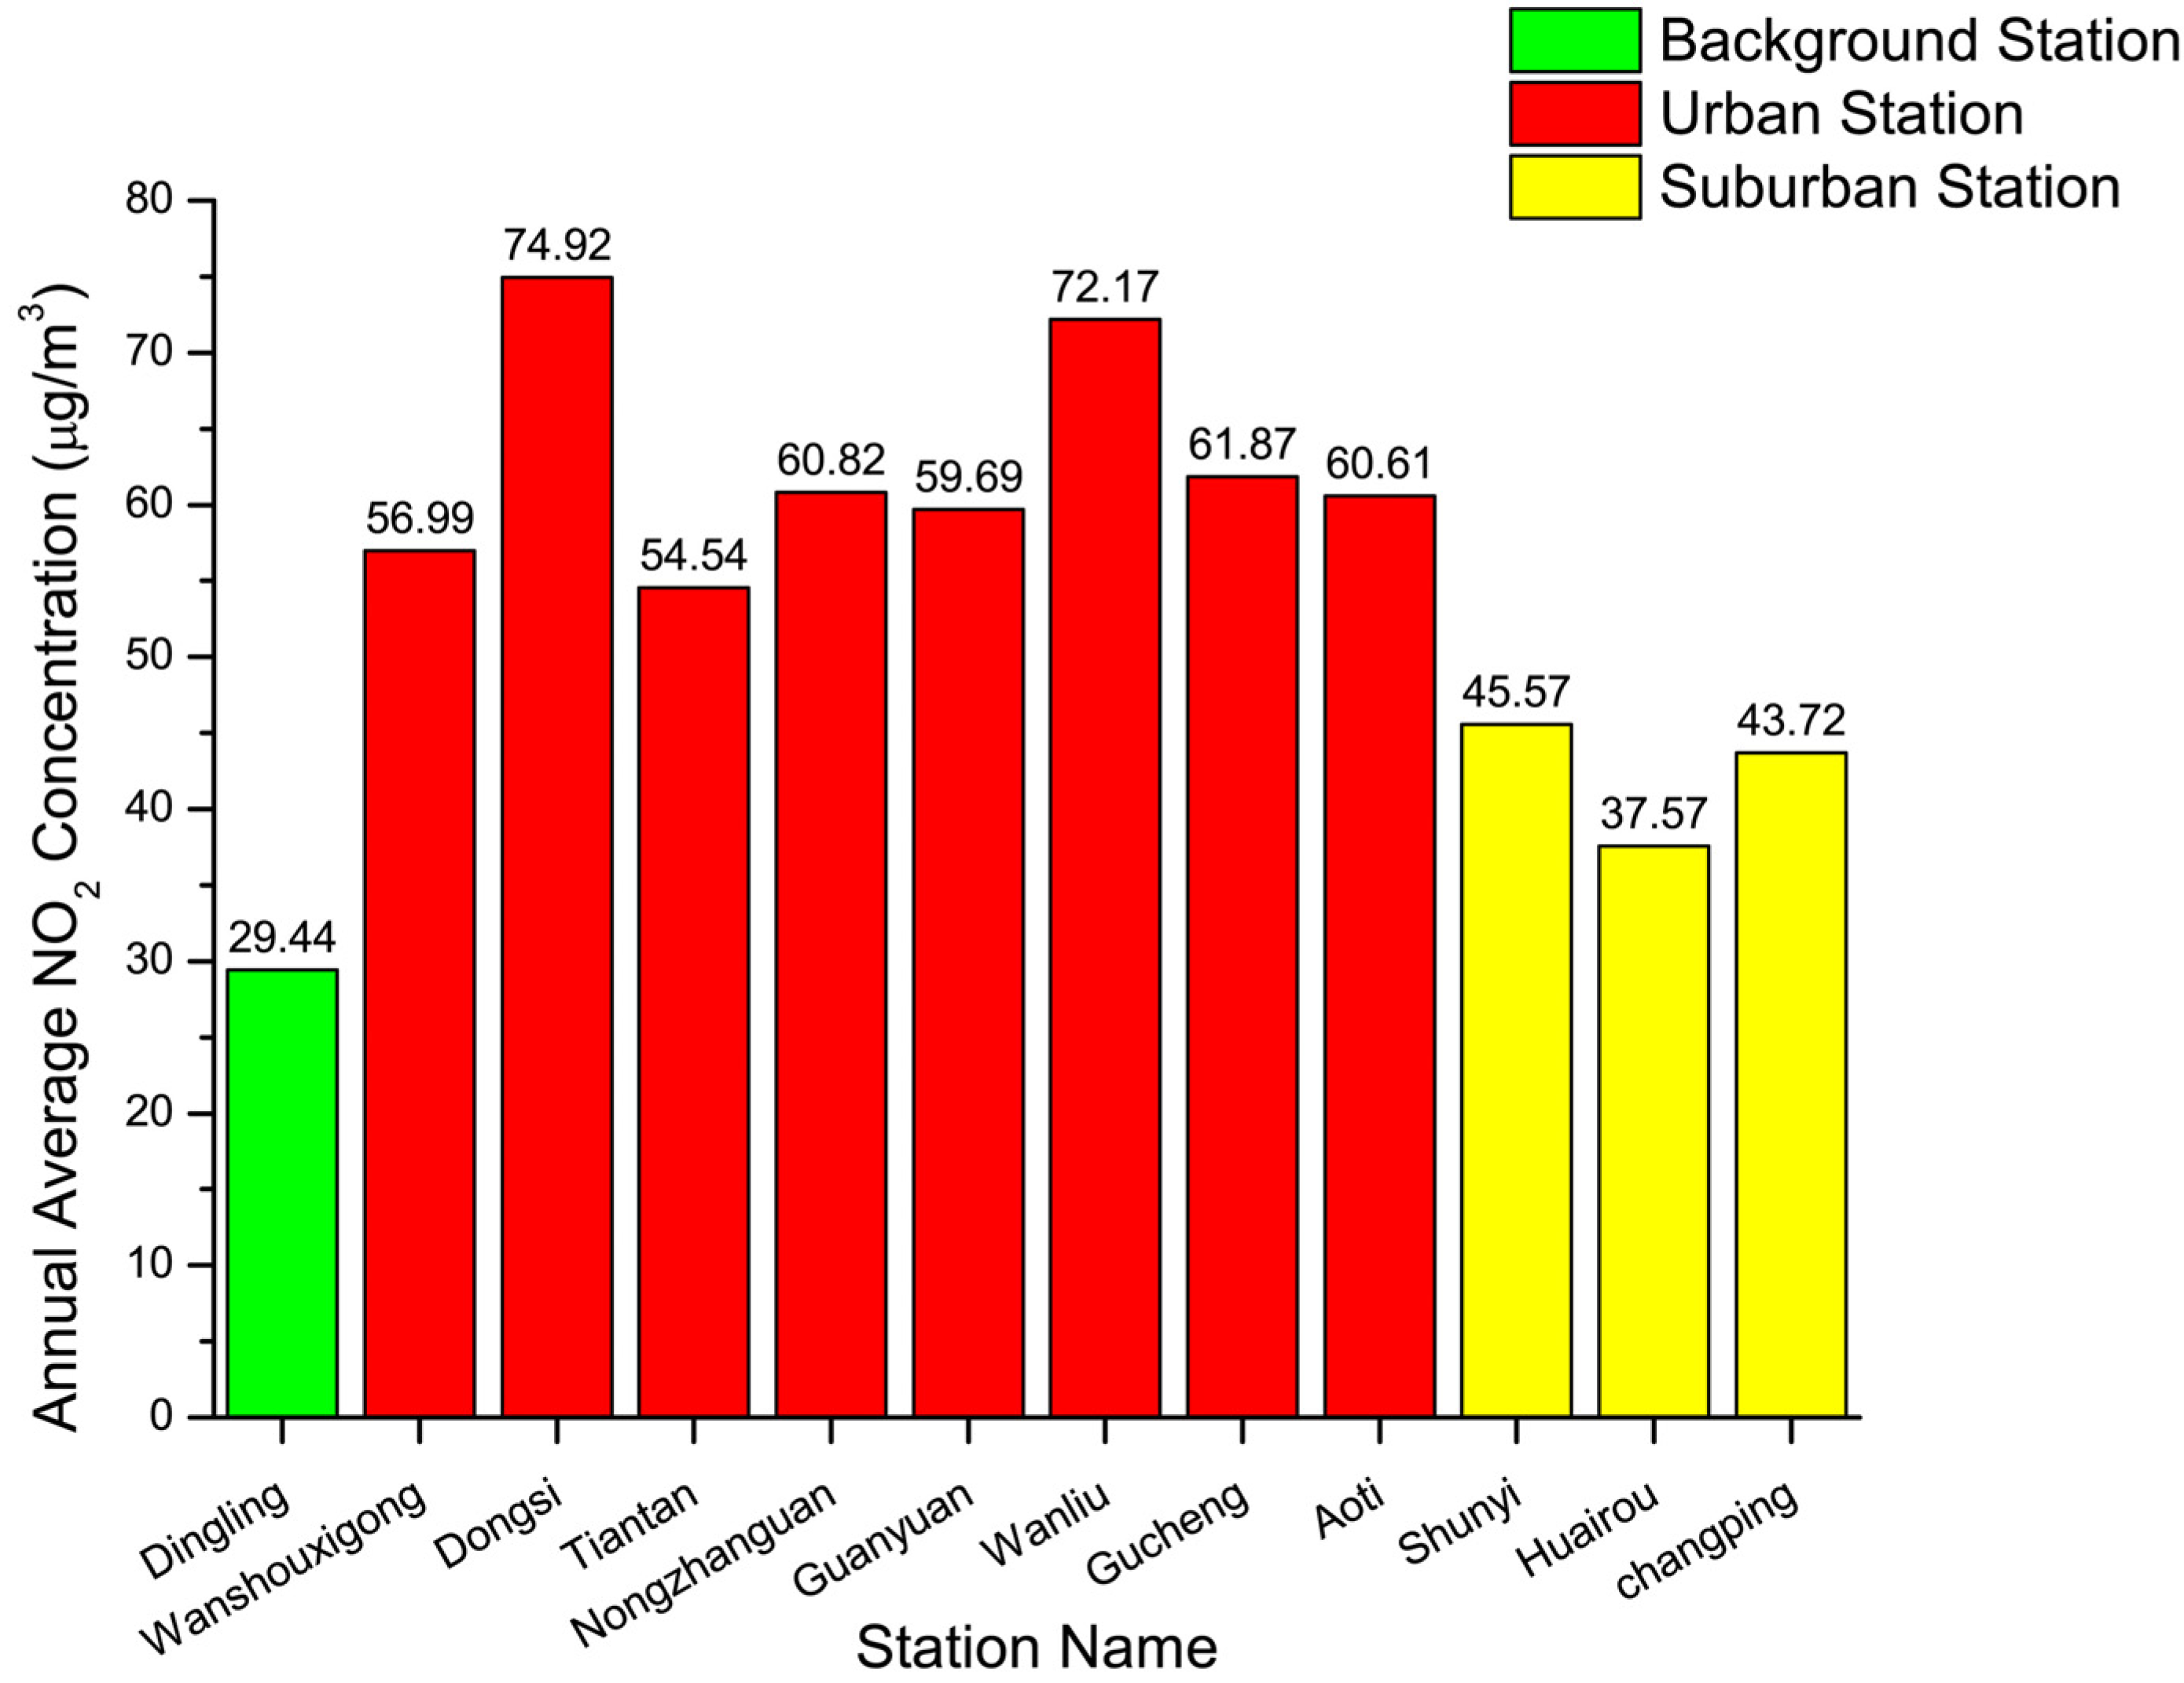
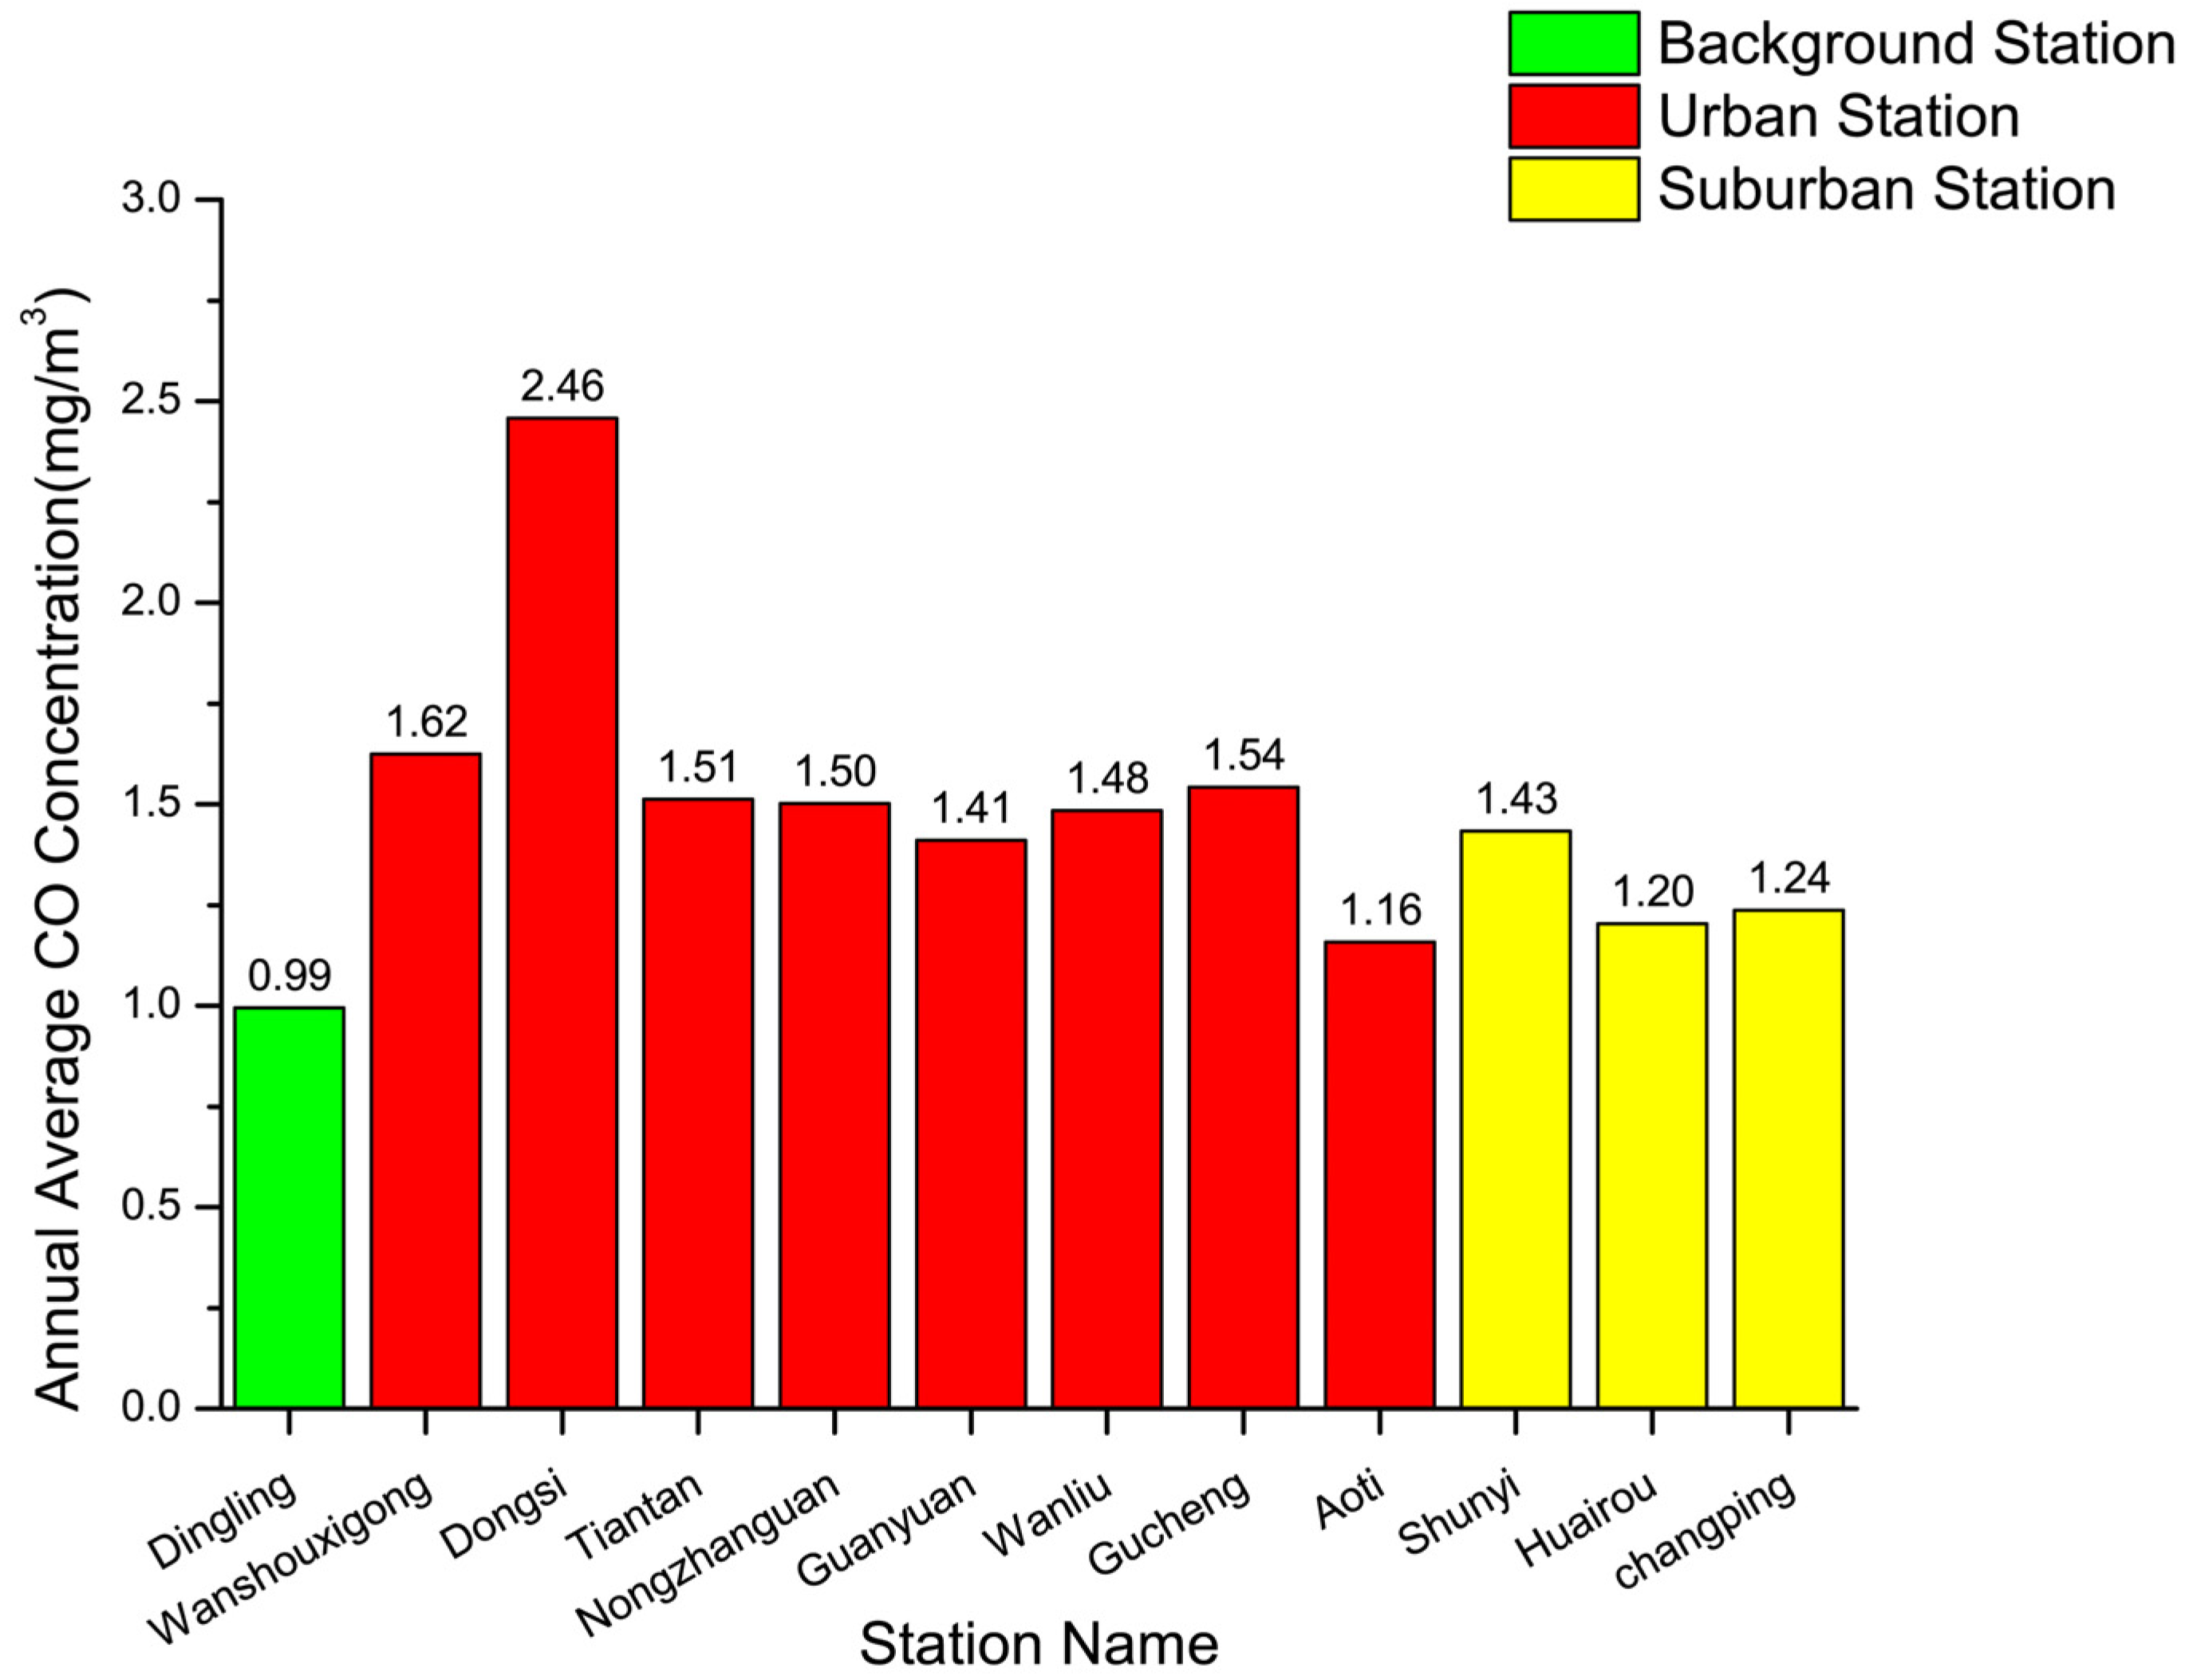
3.2. Spatial Variation and Assessment of Air Quality under NAAQS-2012


3.3. Air Quality Assessment Comparison between Two Versions of NAAQS
4. Conclusions
Acknowledgments
Conflicts of Interest
References
- Zhang, R.; Jing, J.; Tao, J.; Hsu, S.C.; Wang, G.; Cao, J.; Lee, C.S.L.; Zhu, L.; Chen, Z.; Zhao, Y.; et al. Chemical characterization and source apportionment of PM2.5 in Beijing: Seasonal perspective. Atmos. Chem. Phys. 2013, 13, 7053–7074. [Google Scholar]
- Seinfield, J.; Pandis, S. Atmospheric Chemistry and Physics; Wiley & Sons. Inc.: Hoboken, NJ, USA, 2006. [Google Scholar]
- Bergen, S.; Sheppard, L.; Sampson, P.D.; Kim, S.Y.; Richards, M.; Vedal, S.; Kaufman, J.D.; Szpiro, A.A. A National prediction model for PM2.5 component exposures and measurement error-corrected health effect inference. Environ. Health Persp. 2013, 121, 1017–1025. [Google Scholar] [CrossRef] [PubMed]
- Janssen, N.A.H.; Fischer, P.; Marra, M.; Ameling, C.; Cassee, F.R. Short-term effects of PM2.5, PM10 and PM2.5–10 on daily mortality in the netherlands. Sci. Total Environ. 2013, 463, 20–26. [Google Scholar] [CrossRef] [PubMed]
- Krishnan, R.M.; Adar, S.D.; Szpiro, A.A.; Jorgensen, N.W.; Van Hee, V.C.; Barr, R.G.; O’Neill, M.S.; Herrington, D.M.; Polak, J.F.; Kaufman, J.D. Vascular responses to long- and short-term exposure to fine particulate matter mesa air (multi-ethnic study of atherosclerosisi and air pollution). J. Am. Coll. Cardiol. 2012, 60, 2158–2166. [Google Scholar] [CrossRef] [PubMed]
- Leiva, M.A.; Santibanez, D.A.; Ibarra, S.; Matus, P.; Seguel, R.A. Five-year study of particulate matter (PM2.5) and cerebrovascular diseases. Environ. Pollut. 2013, 181, 1–6. [Google Scholar] [CrossRef] [PubMed]
- Nel, A. Air pollution-related illness: Effects of particles. Science 2005, 308, 804–806. [Google Scholar] [CrossRef] [PubMed]
- Pope, C.A.; Burnett, R.T.; Thun, M.J.; Calle, E.E.; Krewski, D.; Ito, K.; Thurston, G.D. Lung cancer, cardiopulmonary mortality, and long-term exposure to fine particulate air pollution. Jama-J. Am. Med. Assoc. 2002, 287, 1132–1141. [Google Scholar] [CrossRef]
- Sarnat, J.A.; Schwartz, J.; Suh, H.H. Fine particulate air pollution and mortality in 20 US cities. N. Engl. J. Med. 2001, 344, 1253–1254. [Google Scholar] [PubMed]
- Du, X.A.; Kong, Q.A.; Ge, W.H.; Zhang, S.J.; Fu, L.X. Characterization of personal exposure concentration of fine particles for adults and children exposed to high ambient concentrations in Beijing, China. J. Environ. Sci.-China 2010, 22, 1757–1764. [Google Scholar] [CrossRef]
- Kan, H.D.; London, S.J.; Chen, G.H.; Zhang, Y.H.; Song, G.X.; Zhao, N.Q.; Jiang, L.L.; Chen, B.H. Differentiating the effects of fine and coarse particles on daily mortality in Shanghai, China. Environ. Int. 2007, 33, 376–384. [Google Scholar] [CrossRef] [PubMed]
- Gavett, S.H.; Koren, H.S. The role of particulate matter in exacerbation of atopic asthma. Int. Arch. Allergy Imm. 2001, 124, 109–112. [Google Scholar] [CrossRef]
- Guo, Y.M.; Jia, Y.P.; Pan, X.C.; Liu, L.Q.; Wichmann, H.E. The association between fine particulate air pollution and hospital emergency room visits for cardiovascular diseases in Beijing, China. Sci. Total Environ. 2009, 407, 4826–4830. [Google Scholar] [CrossRef] [PubMed]
- Wang, J.F.; Hu, M.G.; Xu, C.D.; Christakos, G.; Zhao, Y. Estimation of citywide air pollution in Beijing. Plos One 2013, 8. [Google Scholar] [CrossRef] [PubMed]
- Chan, C.K.; Yao, X. Air pollution in mega cities in China. Atmos. Environ. 2008, 42, 1–42. [Google Scholar] [CrossRef]
- Chen, W.Y.; Xu, R.N. Clean coal technology development in China. Energy Policy 2010, 38, 2123–2130. [Google Scholar] [CrossRef]
- Sun, Y.L.; Zhuang, G.S.; Tang, A.H.; Wang, Y.; An, Z.S. Chemical characteristics of PM2.5 and PM10 in haze-fog episodes in Beijing. Environ. Sci. Technol. 2006, 40, 3148–3155. [Google Scholar] [CrossRef] [PubMed]
- Li, L.J.; Wang, Y.; Zhang, Q.; Li, J.X.; Yang, X.G.; Jin, J. Wheat straw burning and its associated impacts on Beijing air quality. Sci. China Ser. 2008, 51, 403–414. [Google Scholar] [CrossRef]
- Wang, Q.Q.; Shao, M.; Liu, Y.; William, K.; Paul, G.; Li, X.H.; Liu, Y.A.; Lu, S.H. Impact of biomass burning on urban air quality estimated by organic tracers: Guangzhou and Beijing as cases. Atmos. Environ. 2007, 41, 8380–8390. [Google Scholar] [CrossRef]
- Cheng, S.Y.; Lang, J.L.; Zhou, Y.; Han, L.H.; Wang, G.; Chen, D.S. A new monitoring-simulation source apportionment approach for investigating the vehicular emission contribution to the PM2.5 pollution in Beijing, China. Atmos. Environ. 2013, 79, 308–316. [Google Scholar] [CrossRef]
- Bell, T.L.; Rosenfeld, D.; Kim, K.M.; Yoo, J.M.; Lee, M. I.; Hahnenberger, M. Midweek increase in US summer rain and storm heights suggests air pollution invigorates rainstorms. J. Geophys. Res. Atmos. 2008, 113, D2. [Google Scholar] [CrossRef]
- Gianicolo, E.A.L.; Serinelli, M.; Cervino, M.; Mangia, C.; Portaluri, M.; Vigotti, M.A. Acute effects of air pollution in brindisi, 2003–2005 is the answer blowing in the wind? Epidemiology 2009, 20, S198–S199. [Google Scholar] [CrossRef]
- Kim, Y.; Guldmann, J.M. Impact of traffic flows and wind directions on air pollution concentrations in Seoul, Korea. Atmos. Environ. 2011, 45, 2803–2810. [Google Scholar] [CrossRef]
- Tay, S.S.C. Fires, haze and acid rain: The social and political framework of air pollution in ASEAN and Asia. In Challenges of a Changing Earth; Springer: Berlin, Germany, 2002; pp. 49–55. [Google Scholar]
- Walcek, C.J. Effects of wind shear on pollution dispersion. Atmos. Environ. 2002, 36, 511–517. [Google Scholar] [CrossRef]
- Wang, L.T.; Zhang, P.; Tan, S.B.; Zhao, X.J.; Cheng, D.D.; Wei, W.; Su, J.; Pan, X.M. Assessment of urban air quality in China using air pollution indices (APIs). J. Air Waste Manage. 2013, 63, 170–178. [Google Scholar] [CrossRef]
- Guo, Y; Feng, N; Christopher, S.A.; Kang, P; Zhan, F.B.; Hong, S. Satellite remote sensing of fine particulate matter (PM2.5) air quality over Beijing using MODIS. Int. J. Remote Sens. 2014, 35, 6522–6544. [Google Scholar] [CrossRef]
© 2015 by the authors; licensee MDPI, Basel, Switzerland. This article is an open access article distributed under the terms and conditions of the Creative Commons Attribution license (http://creativecommons.org/licenses/by/4.0/).
Share and Cite
Chen, W.; Wang, F.; Xiao, G.; Wu, K.; Zhang, S. Air Quality of Beijing and Impacts of the New Ambient Air Quality Standard. Atmosphere 2015, 6, 1243-1258. https://doi.org/10.3390/atmos6081243
Chen W, Wang F, Xiao G, Wu K, Zhang S. Air Quality of Beijing and Impacts of the New Ambient Air Quality Standard. Atmosphere. 2015; 6(8):1243-1258. https://doi.org/10.3390/atmos6081243
Chicago/Turabian StyleChen, Wei, Fusheng Wang, Guofeng Xiao, Kai Wu, and Shixuan Zhang. 2015. "Air Quality of Beijing and Impacts of the New Ambient Air Quality Standard" Atmosphere 6, no. 8: 1243-1258. https://doi.org/10.3390/atmos6081243