Article

Spatial and Temporal Analysis of Organic and Black Carbon Mass Concentrations in Lithuania

by
Julija Pauraitė
,
Genrik Mordas
,
Steigvilė Byčenkienė
and
Vidmantas Ulevicius
*
State Research Institute Center for Physical Sciences and Technology, Savanorių Avenue 231, Vilnius, Lithuania
*
Author to whom correspondence should be addressed.
Atmosphere 2015, 6(8), 1229-1242; https://doi.org/10.3390/atmos6081229
Submission received: 3 July 2015 / Revised: 4 August 2015 / Accepted: 5 August 2015 / Published: 19 August 2015

Abstract

:
Both organic carbon (OC) and black carbon (BC) mass concentrations were measured in Lithuania at coastal/marine (Preila), rural (Rūgšteliškis), and urban background (Vilnius) environments have been analyzed to infer the spatial and temporal distributions of the OC/BC ratios from May 2013 to October 2014. OC/BC ratios reflected the location of the different sites, as well as possible different sources influencing air quality. The results from an industrialized and populated urban background area indicated that biomass combustion for heating contributed to BC and OC mass concentration. Typically, BC mean concentrations (±st.deviation) were higher in urban areas (1.72(±1.22 μg·m−3)) than in rural (0.40(±0.35 μg·m−3)) and coastal/marine (0.53(±0.43 μg·m−3)) during warm and cold (2.34(±2.15); 0.77(±0.52) and 0.84(±0.50) μg·m−3, respectively) periods, while OC concentrations were higher in urban backgrounds (5.91(±1.99 μg·m−3)) and rural areas (4.56(±3.98 μg·m−3)) during warm periods. The air mass backward trajectory analysis indicated influence of local sources in urban environment and strong influence of long-range transport in rural environment. A clear seasonal dependence of OC/BC ratios was observed at rural and urban environments. The highest OC/BC ratios were calculated in coastal/marine (6.3) and rural (9.5) environments in summer.

1. Introduction

Atmospheric carbonaceous aerosols constitute a significant part of the atmospheric aerosols, while a large part of them consists of organic material (~50%) [1]. The carbonaceous atmospheric particulate matter consists of black carbon (otherwise called elemental carbon (EC) and a variety of organic compounds. Black carbon (BC) is a primary incomplete combustion-generated carbonaceous aerosol with a graphitic-like structure, while organic carbon (OC) may have both primary and secondary origins [2]. Primary OC may result from fossil fuel emissions, biomass burning or represent biological particles or plant debris [3] while the secondary OC can be formed in the atmosphere by gas-to-particle conversion [4]. There are several indirect approaches used to estimate the amount of primary and secondary OC. Among these, OC/EC ratios exceeding values of 2.0 have been used to identify the presence of secondary organic aerosols [5]. Secondary organic aerosols are also associated with high levels of water-soluble organic carbon, induced by photochemical reactions, especially during warm seasons [6]. It is known that OC exhibits a wider size distribution, whereas EC is found generally in the submicrometer range [3]. As BC and EC in airborne particulate matter originates from the incomplete combustion of carbonaceous fuel [7,8], these two carbonaceous species are often well correlated [9]. A number of studies have been published regarding BC measurements with a view to assess the spatial and temporal variation [10,11,12,13,14,15,16] via multiple ground-based instrumentation and techniques. Many research studies have been performed and reported for influence of traffic [17] and domestic biomass burning [18] which play significant roles in the atmosphere of urban areas. The lifetime of BC is about seven days in the troposphere [19] and hence can be transported to long-distances [20]. Thus, it is important that investigations on BC concentrations would be carried out in different environments in order to understand their impacts. Increasing attention was being concentrated in the estimation of primary and secondary OC concentrations [2,3,21,22,23]. Pio et al. [3] suggested that the ratio of OC and EC could be used as a tool to derive OC from primary and secondary sources. Although many uncertainties remain with BC analysis techniques, EC has mostly been used as surrogate for BC [24]. Inter comparison measurements of BC and EC have been conducted in different countries and environments [25] and substantial differences must be expected. However, the sources of OC still cannot be estimated accurately. In Lithuania, few studies have been carried out on BC measurements with a view to assess their pollution events and annual variation of BC mass concentration [26,27]. There have not been previous long-term OC measurements.
The aim of this study is to characterize the variations of BC and OC aerosols in distinct environments of Lithuania. We have performed seasonal variations of BC and OC to show spatial and temporal alteration and determine important sources at each environment. The long-range transport of BC between two sites and analysis of OC/BC ratios also has been presented. This study can improve the understanding of the carbonaceous aerosol sources in Baltic region.

2. Methods

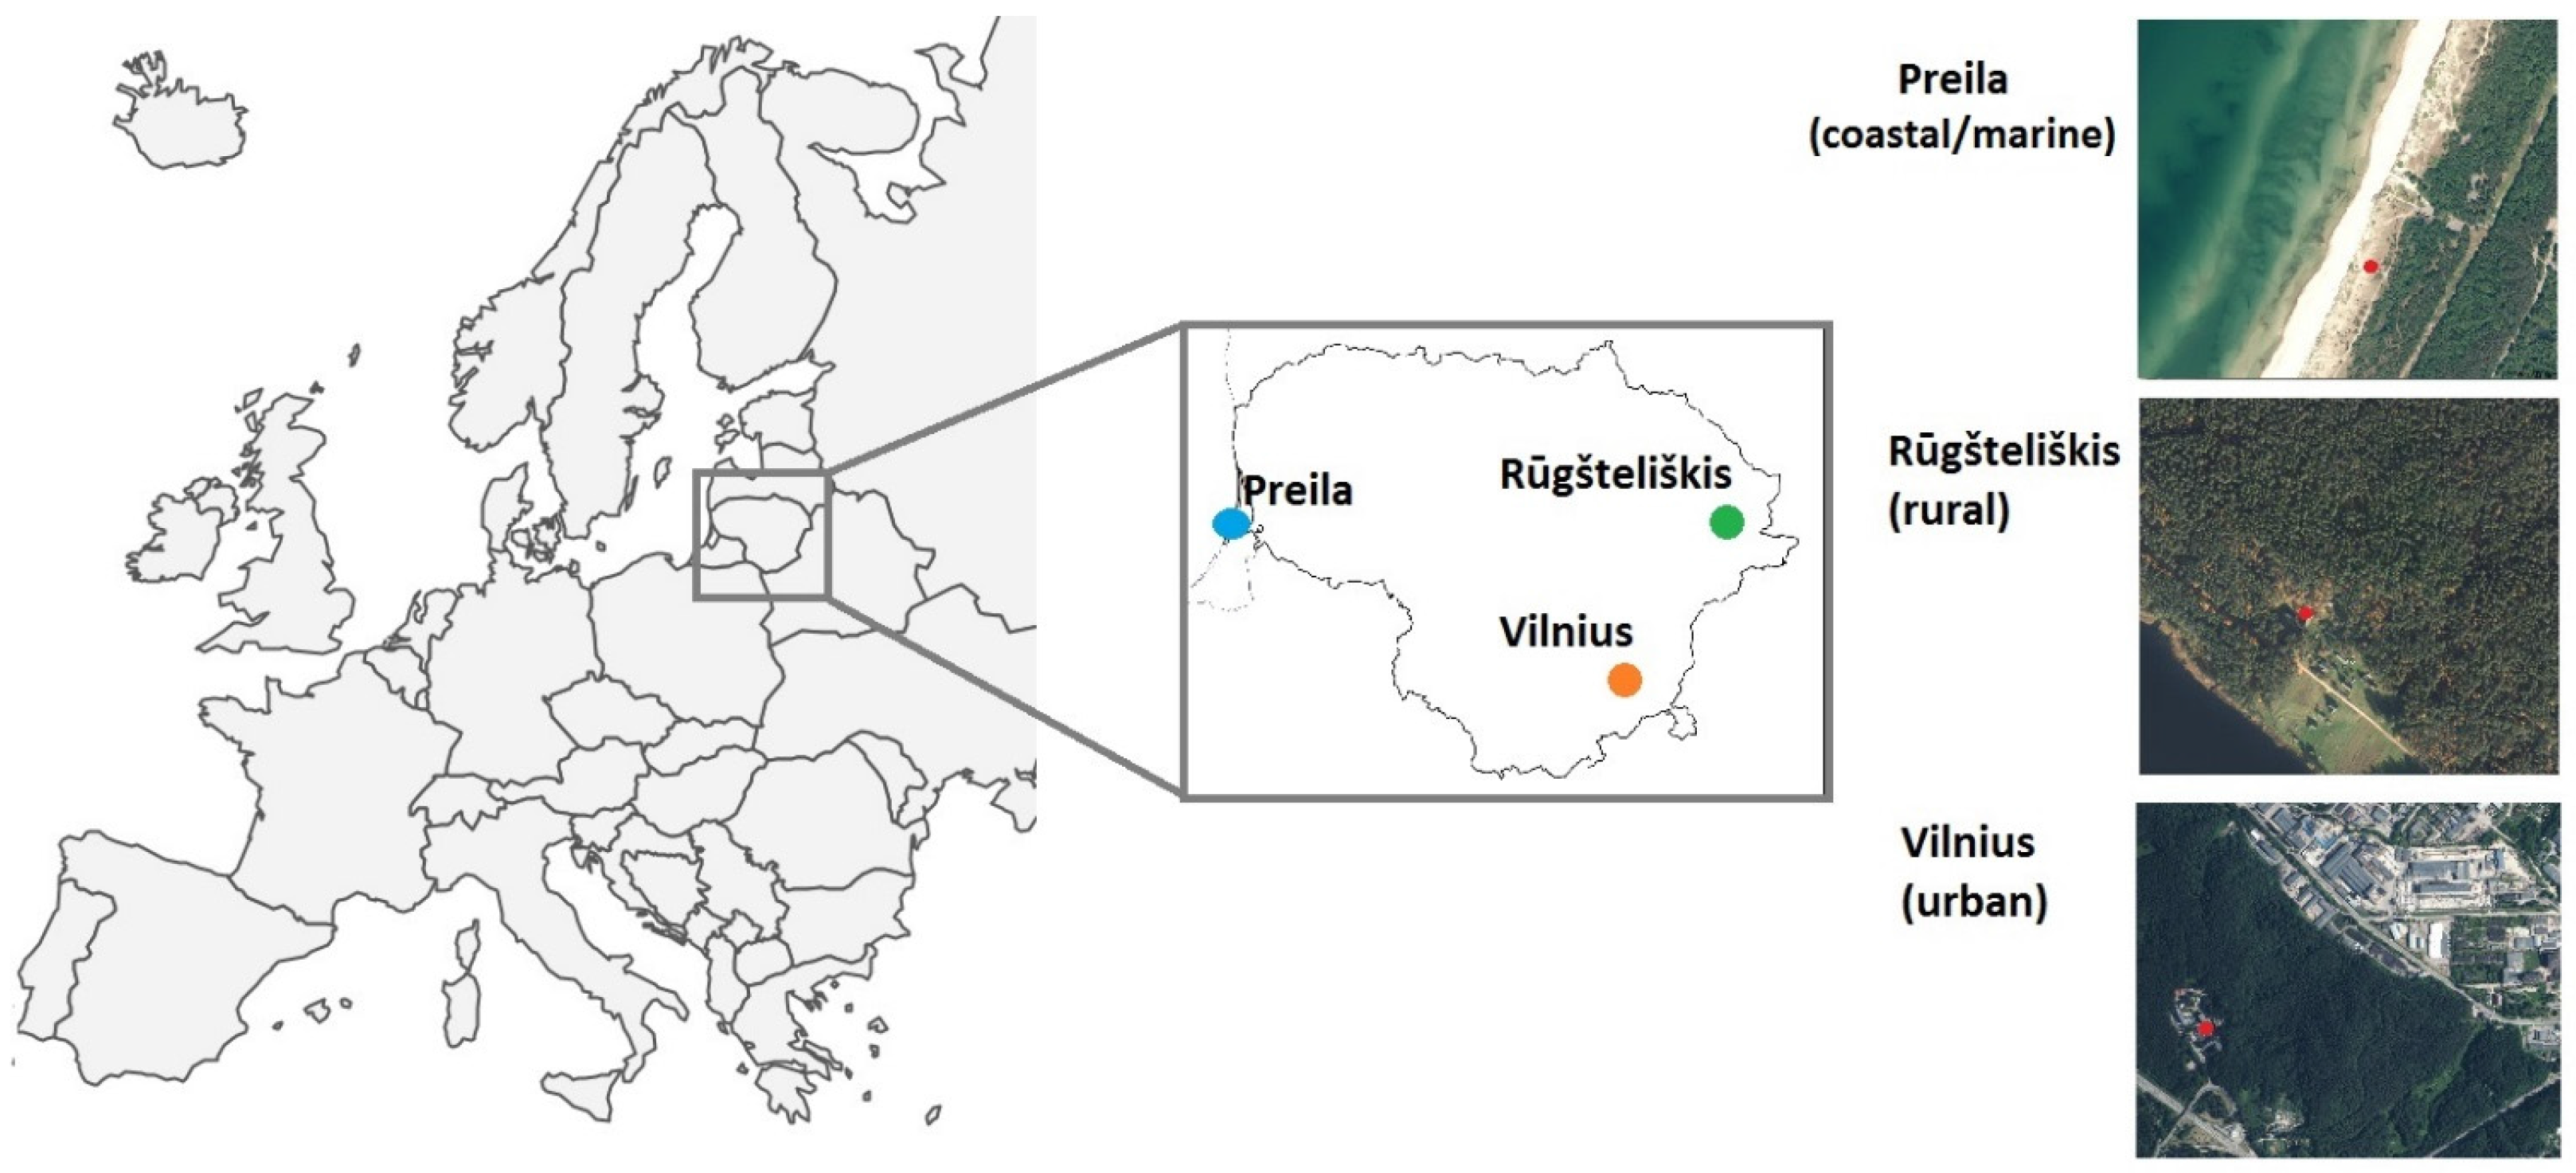
2.1. Measurement Sites Description

The continuous measurements of the mass concentrations of BC and OC were performed at three different sites in different seasons (Figure 1). The study sites were selected in different geographical positions in order to have a wide range of the levels of BC and OC in Lithuania. Ambient levels of BC and OC were studied at a Preila (March–April 2014), Rūgšteliškis (November 2013, May 2014) and Vilnius (December 2013, October 2014). The main difference between the sites is the amount of seasonal fluctuation in BC and OC levels observed each year. Environmental pollution research site Preila (55°55′N, 21°00′E, 5 m above the sea level (a.s.l.)) is located in the coastal/marine environment on the Curonian Spit, between Curonian Lagoon and the Baltic Sea. A road along the spit connects summer resorts and fishing villages. At Curonian Spit’s north end, lagoon is connected to the Baltic Sea by the Lithuanian port of Klaipėda-the nearest industrial city at a distance of about 40 km to the north from Preila. The other major city Kaliningrad (Russia) is about 90 km to the south. Preila site is characterized as a regionally representative background area characterized by tender winter, middling summer and rapidly changing meteorological conditions. Rūgšteliškis integrated monitoring site (55°46′N, 26°00′E, 160 m above Sea level, rural forested environment) is located at a distance of about 313 km east from Preila-in Aukštaitija. This site is located in the north-eastern part of Lithuania, in remote forested (forests cover 70% of park’s area, mostly 60 years old in average pine (Pinus sylvestris) stands and sparsely populated area with vegetation varied from steppe to tundra species. The measurements were taken at 1.5 m above the ground level. The climate can be described as middling cold with higher humidity and considerable rainfall. The nearest major city Utena is about 27 km to the south from Rūgšteliškis.
Figure 1. Map of Lithuania and the sampling locations.
Atmosphere 06 01229 g001
Vilnius sampling site (54°64′N, 25°18′E, 112 m above Sea level is located at the center for physical science and technology campus. The continuous BC and OC measurements were taken about 20 m above the ground level, 12 km southwest of city center area. Vilnius is the largest city and the capital of Lithuania, with a population of 0.5 million. The main local anthropogenic particle source is traffic and heating-generated pollution during cold season (October–April). The location can be described as an urban background. Pollution emitted from the city can be easily transported to the site with the prevailing northeast wind. Vilnius is at a distance of about 280 km south-east from Preila and 105 km south from Rūgšteliškis.

2.2. Instrumentation

The Magee Scientific Company aethalometer (Model AE31 Spectrum manufactured by Aerosol d.o.o., Slovenia) was deployed at the Preila, Rūgšteliškis and Vilnius sites for the real-time measurements of BC mass concentration. The sampling aerosol flow of aethalometer of 4 l/min passed through impactor of PM2.5 and vertical 2.5 m long stainless steel tube (10 mm inner diameter). Measured light attenuation was converted to BC mass. The optical transmission of carbonaceous aerosol particles was measured sequentially at seven wavelengths λ (0.37, 0.45, 0.52, 0.59, 0.66, 0.88 and 0.95 μm). At 0.88 μm wavelength, BC is the principal absorber of light and other aerosol components have a minor influence for absorption. Because of this characteristic 0.88 μm wavelength was considered as representing channel of BC measurements in the atmosphere. BC aerosol mass concentration was measured with 5 min resolution. An empirical algorithm for loading effects compensation was used [28,29].
The chemical composition of non-refractory submicron particulate matter was measured using the Aerosol Chemical Speciation Monitor (ACSM) (Aerodyne Research, Inc., Billerica, MA, USA). Before reaching the instrument, the sampling aerosol flow of 1.6 lpm passed through a PM10 impactor-inlet (self-design), a 2.5 m vertical stainless steel sampling tube (6 mm inner diameter) and a Nafion dryer (MD-110-48S-4, Perma Pure LLC, Toms River, NJ, USA). The impactor removed coarse particles, while a flowrate of 1.6 l/min minimized the particle transport losses in the particle size range from 30 nm to 1 µm and the dryer set the relative humidity lower than 50%. Particle losses in the line were estimated to be lower than 2%. Reaching ACSM, the submicron aerosol particles were focused into a resistively heated surface at 600 °C, where the non-refractory PM1 components were flash vaporized. The resulting gases were subsequently detected and chemically characterized with 70 eV electron impact quadrupole mass spectrometry. The instrument was operated with a time resolution of 30 min for typical aerosol loadings (several μg·m−3) with a scan rate of mass spectrometer at 220 ms·amu−1 from m/z 10 to 140 (approximately 31.9 s per scan and 1.126 s pause, 56 scans and data interval 29 min 48 s). The mass concentrations and mass spectra were processed using ACSM standard data analysis software (v 1.5.3.0) and DAQ 1.4.4.4. Under ambient conditions, the mass concentration of organic matter (OM), sulphates (SO2−4), nitrates (NO−3), ammonium (NH+4) and chlorides (Cl) were measured with a detection limit <0.2 µg·m−3. The instrument was periodically main tenanced and calibrated using ammonium sulphate and ammonium nitrate. Experimentally determined calibration parameters were response factor RFNO3 and relative ionization efficiencies RIENH4, RIESO4. The relative ionization efficiencies RIEOrg = 1.4, RIEChl = 1.3 were set as the default. A collection efficiency (CE) was calculated from the measurement data using collection efficiency calculation algorithm suggested by Middlebrook et al. [28]. The instrument was calibrated using ammonium sulphate and ammonium nitrate. A collection efficiency (CE) was calculated using collection efficiency calculation algorithm suggested by Middlebrook et al. [28]. The average values of CE in Preila, Rūgšteliškis and Vilnius during cold period were 0.87, 0.74 and 0.70, respectively. While during warm period the average values of CE were 0.84, 0.88 and 0.50, respectively. The OC concentration was calculated from ratio of organic-mass-to-organic-carbon convert was done by Russel taken mean value of 1.4 which is typically taken to be 1.4 [30]. Thus, both BC and EC are generated from anthropogenic sources and was used to describe aspects of ambient particulate matter. In order to systematize ratio of carbonaceous aerosol concentrations, the comparison with other sites were made. The estimations of OC/BC and OC/EC ratios were made to compare values of parameter α. In this study, parameter α was determined by coefficient of linear fitting curve. To simplify the analysis, parameter α can be also evaluated by,
α = 180 ° π · tan 1 OC BC
where OC/BC represents averaged ratio of carbonaceous aerosols concentrations for investigation period.
The sampling time in all stations was considered in a way to represent both warm and cold periods.

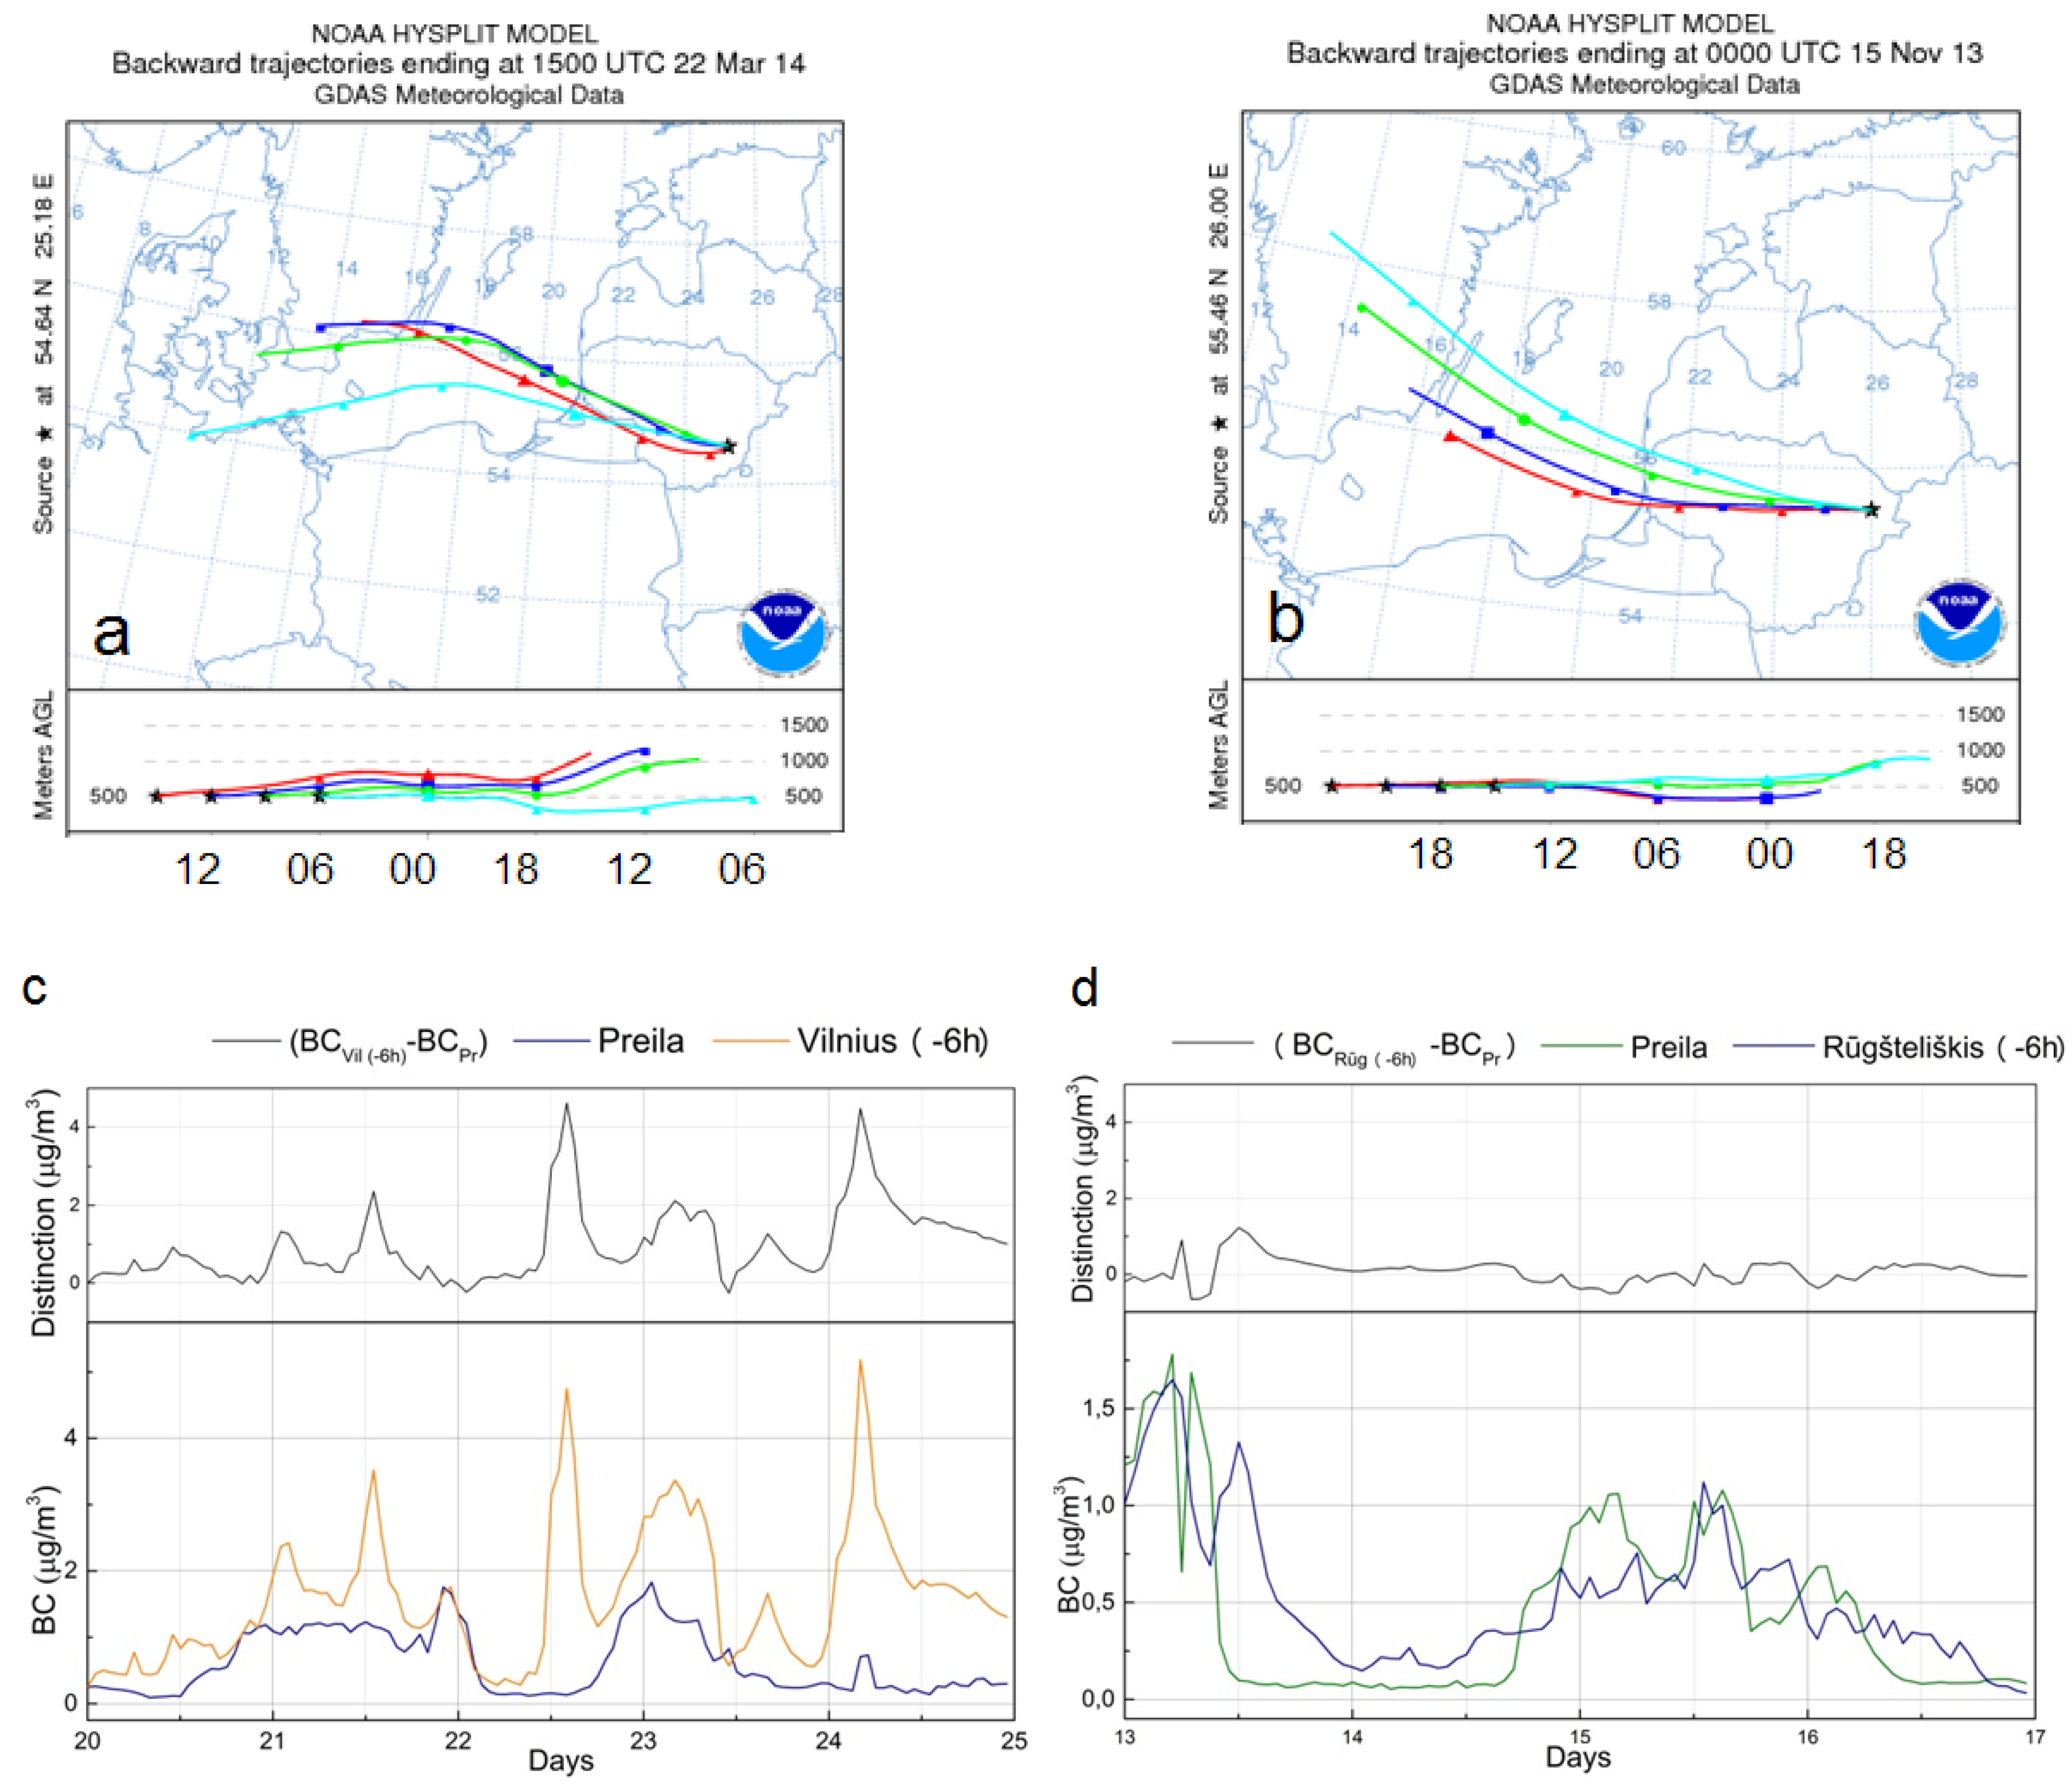
2.3. Air Mass Backward Trajectories

The air mass backward trajectory analysis provides knowledge about long-range transport patterns [30]. The aerosol characteristics with respect to air masses advection to estimate the transfer of aerosol particles between stations were analyzed. The trajectories were calculated for the days when air masses clearly pass through whole country territory from Baltic Sea towards continent. However, it is not possible to quantitatively separate the increment of transported aerosol concentration from that locally emitted. Therefore, studies in marine, rural and urban background area will be required to quantify the extent of transported material during the study periods. Additionally, 72-hour backward trajectories were computed using the HYbrid Single-Particle Lagrangian Integrated Trajectory (HYSPLIT) model [31] with the Global Data Assimilation System (GDAS) meteorological databases at the NOAA Air Resources Laboratory’s web server (http://ready.arl.noaa.gov/HYSPLIT_traj.php) for each measurement site with starting height of 500 m above sea level.

3. Results and Discussion

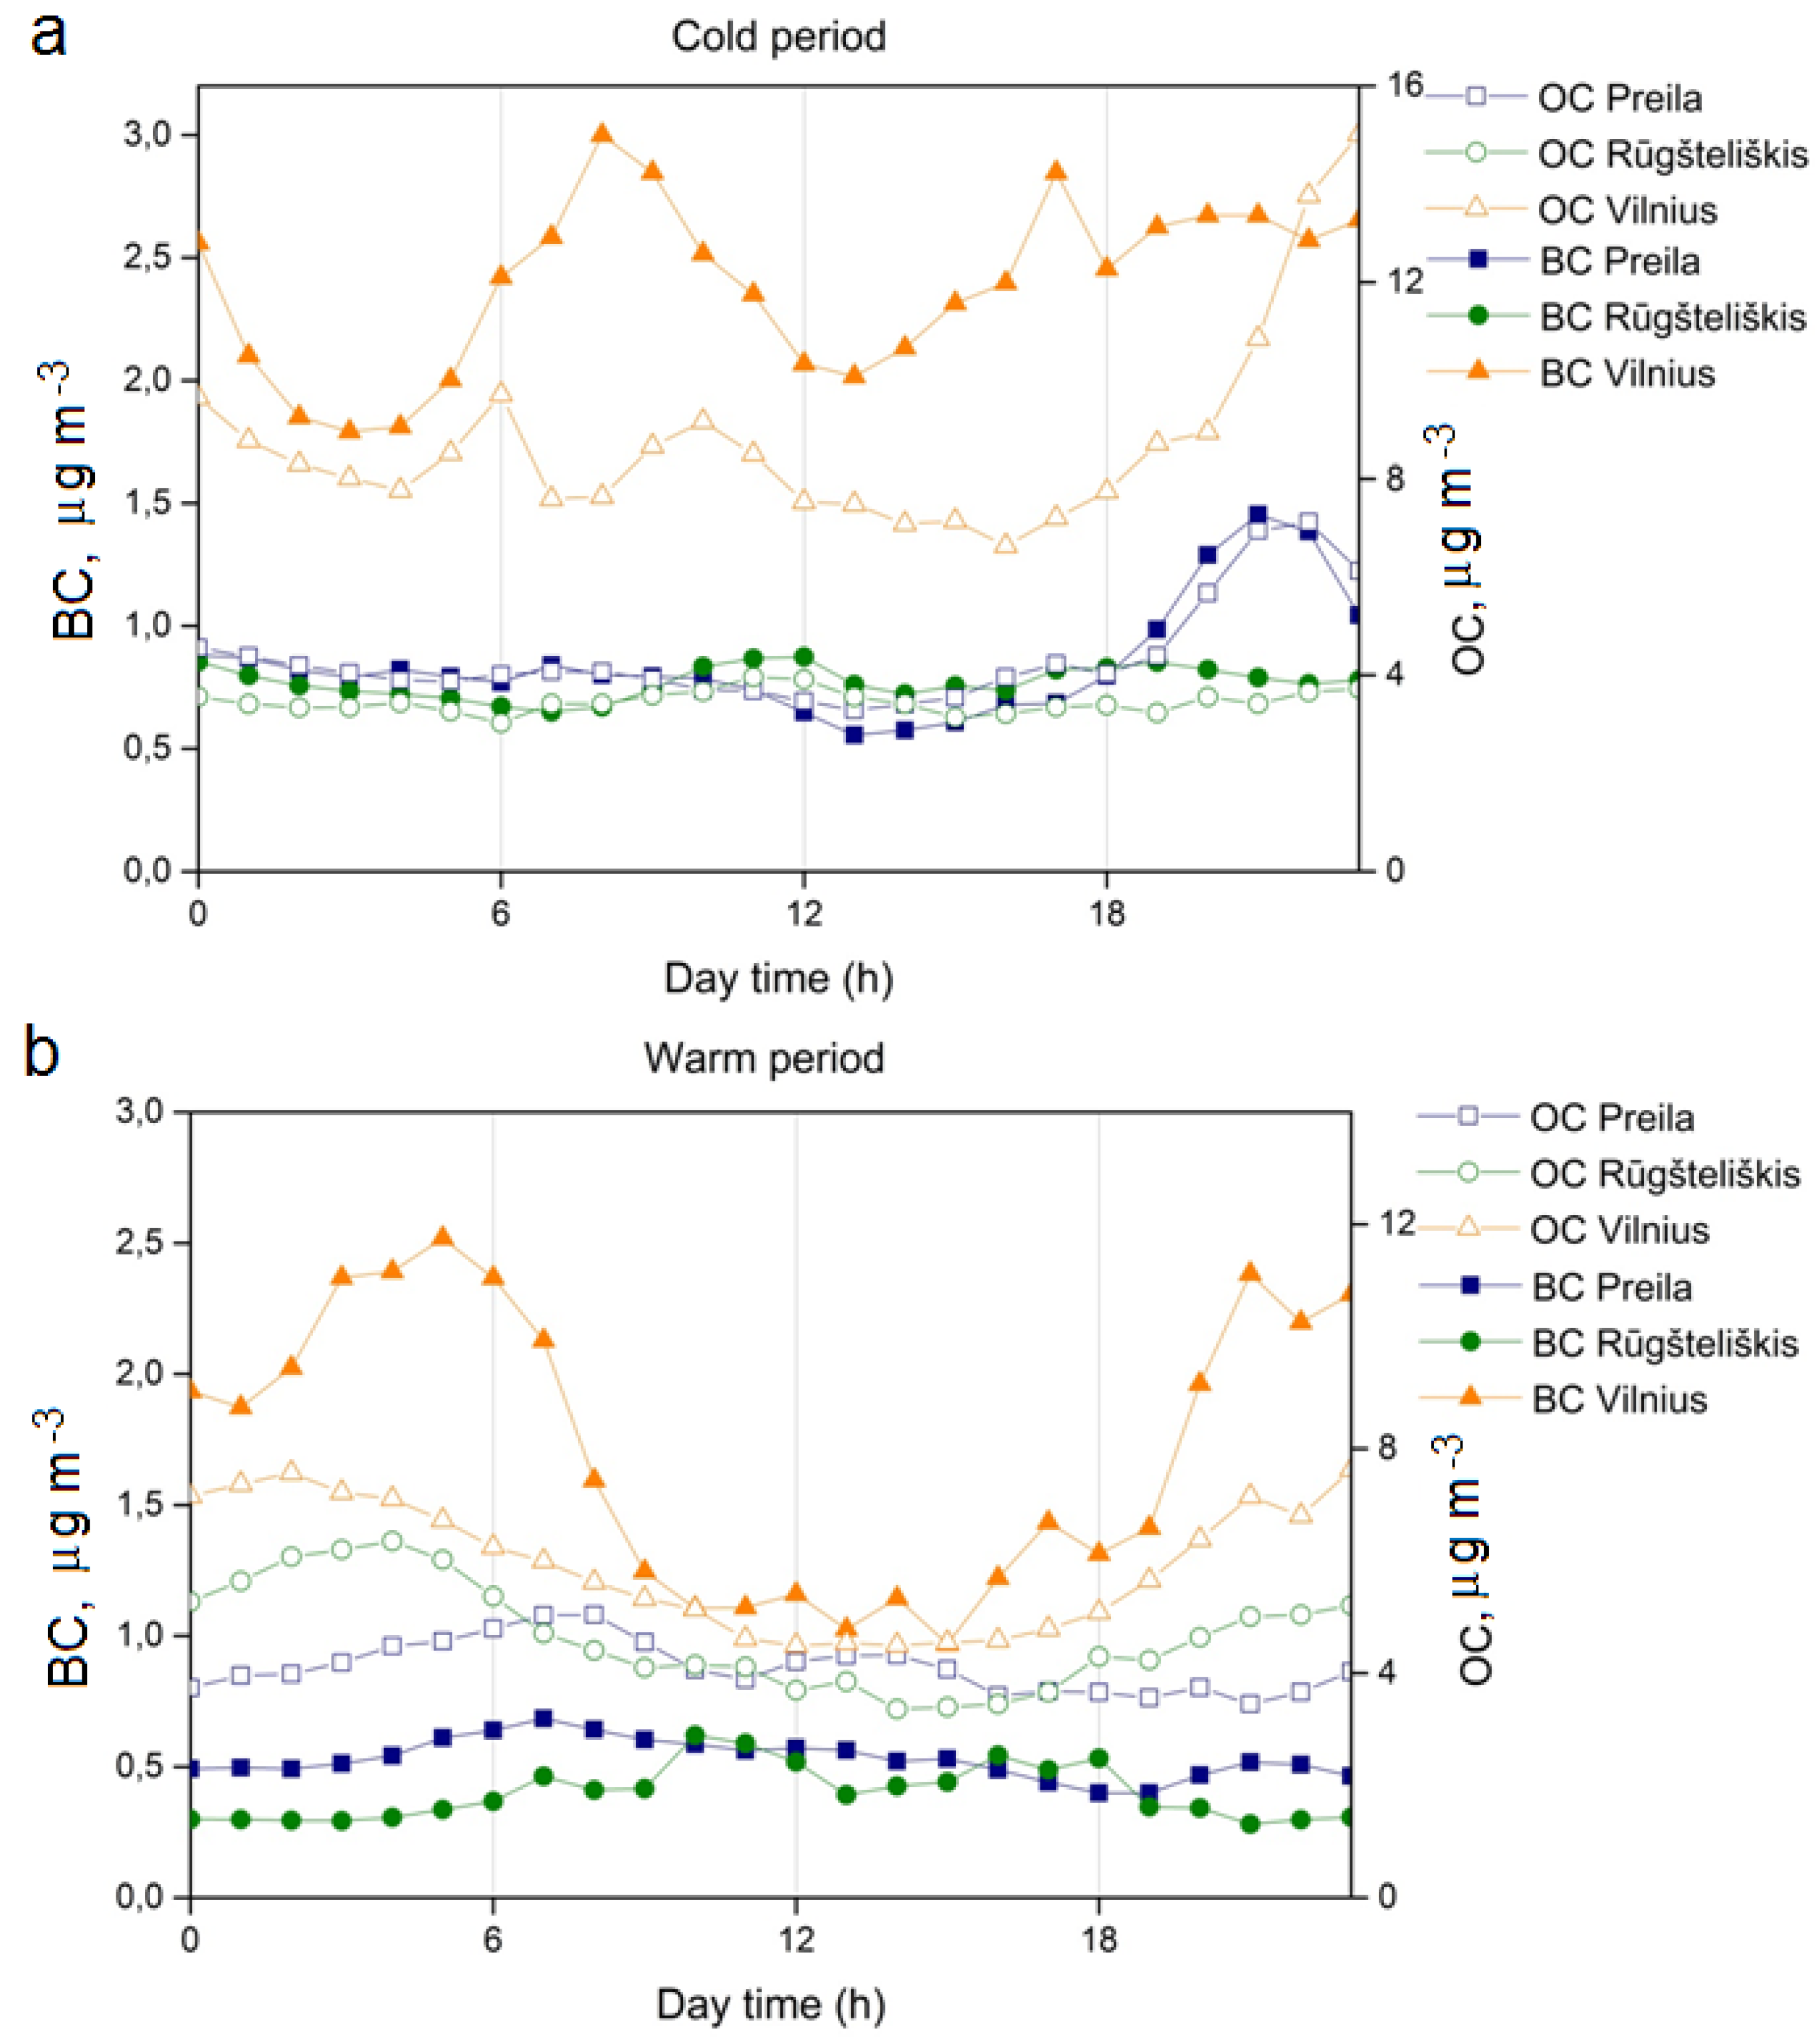
3.1. Seasonal and Diurnal Variations

Statistics of BC and OC concentrations measured from May 2013 to October 2014 in the coastal/marine, rural and urban background environments are summarized in Table 1. BC and OC concentrations show large variations with means (±standard deviation) of 0.98 (±0.81) and 4.86 (±4.31) µg·m−3, respectively, for the entire observation period. For analysis the annual data of BC and OC mass concentrations were divided into cold and warm periods. The hourly mean data show that atmospheric BC loading was higher during cold periods in all three environments. The highest hourly BC aerosol mass concentration in Vilnius reached 17.23 µg·m−3 during cold period, while the mean BC concentration was found to be 2.34 µg·m−3, which is about a factor of three higher than mean values in Preila and Rūgšteliškis sites (0.84 and 0.77 µg·m−3, respectively) (Table 1). The lowest hourly BC aerosol mass concentration of 0.02 µg·m−3 was observed in Preila during both warm and cold periods. Meanwhile, the mean BC aerosol mass concentration in Rūgšteliškis was lower by a factor of two during warm period (0.40 µg·m−3) compared to cold period (0.77 µg·m−3). The highest mean BC mass aerosol concentration during warm period was observed in Vilnius (1.72 µg·m−3), which is about a factor of 4.3 and 3.2 higher than those measured in Rūgšteliškis (0.40 µg·m−3) and Preila (0.53 µg·m−3), respectively. As can be seen, the differences in ambient BC levels may be caused by different sampling location and season as well as different emission sources. It was concluded that annual mean BC aerosol mass concentrations in Vilnius were significantly higher than those measured at coastal/marine and rural environments as domestic biofuel use, transportation and industry sectors are important emission sources in Vilnius [26].
Table 1. The concentrations (µg·m−3) of black carbon (BC) and organic carbon (OC) during warm and cold periods at the rural (Rūgšteliškis), coastal/marine (Preila) and background urban (Vilnius) environments.
LocationRugšteliškisPreilaVilnius
BCOCBCOCBCOC
Periodwarmcoldwarmcoldwarmcoldwarmcoldwarmcoldwarmcold
mean0.400.774.563.450.530.844.113.011.722.345.918.60
st. deviation0.350.523.982.280.431.223.862.561.222.151.997.04
min0.070.030.180.060.020.020.020.010.210.060.780.15
max3.793.0526.7917.282.2313.6021.7152.726.8417.2317.7875.44
Figure 2. Mean diurnal variation of OC and BC mass concentrations during (a) cold and (b) warm periods in the rural (Rūgšteliškis), coastal/marine (Preila) and urban background (Vilnius) environments.
Atmosphere 06 01229 g002
The mean OC concentrations have distinct seasonal variations with the highest values observed (8.60 ± 7.04 μg·m−3) in urban background and lowest mean concentration (3.01 ± 2.56 μg·m−3) in coastal/marine environment in cold period. The minimum OC concentrations moderately varied between 0.01 μg·m−3 and 0.78 μg·m−3, while the maximum values during cold period (75.44 μg·m−3) were more than four times higher of those in warm period (17.78 μg·m−3) in urban background environment [32]. In rural area contrary situation was observed. The mean OC values measured during the warm period in Preila (4.11 μg·m−3) and Rūgšteliškis (4.56 μg·m−3) was higher compared to the cold period (3.01 and 3.45 μg·m−3, respectively).
The mean diurnal BC and OC mass concentrations are shown in Figure 2. On a daily basis, there was a gradual increase in BC mass concentrations starting from 05:00 a.m., and the morning peak typically occurred at 08:00 a.m. during cold season (Figure 2a), while the BC mass concentrations were found to be the smallest during day (10:00 a.m.–19:00 p.m.) in the warm season (Figure 2b) in the urban environment due to stronger turbulent mixing and increased mixing layer height resulting in a dilution of BC mass concentrations [18]. Meanwhile, the OC concentration in Vilnius raised at nighttime that could be explained by domestic heating. The surface inversion after sunset resulted in the accumulation of BC and OC emissions, causing higher BC level in the late evening.
The evening sharp peak of BC and OC values observed between 20:00 p.m. and 20:00 a.m. in coastal/marine site resulting from biomass burning for heating during cold season (Figure 2a). BC and OC concentrations in Preila and Rūgšteliškis sites had no significant daytime peaks during both cold and warm periods. The BC concentrations during the warm period in rural and marine environments stayed unchanged (Figure 2b).

3.2. Case Studies: Impact of Long-Range Transport

In order to investigate the contribution of long-range transport and local sources to the BC concentrations, the additional air mass backward trajectory analysis was performed. Air mass backward trajectories were used to estimate spatial variation and transfer of BC and OC concentrations between investigation sites. Days in which same air masses advected between two sampling sites were chosen as event days. In our study, two of the most representative types of the BC and OC concentrations transfer events between investigation sites in terms of their behavior were investigated. During both of the events, advection of clean air masses, which were transported through the Baltic Sea to the Preila site, were observed. The time shift of air mass passing between two sites was calculated from data of the air mass backward trajectory.
During the first event, the air masses were advected in six hours from Preila towards Vilnius from 20 to 24 of March 2014 (Figure 3a). In 93% of the event duration, the concentration in Vilnius was higher than in Preila with correlation coefficient of 0.4. The increases of BC concentration in Vilnius were observed during daytime. Meanwhile, concentrations of BC during the nighttime were comparable with concentrations in Preila. The distinction of BC concentrations in Vilnius and Preila has ranged between −0.3 and 4.6 μg·m−3 (Figure 3), which could be explained by the significant influence of local sources in the urban environment.
The air mass advected from Preila toward Rūgšteliškis on 13–17 November 2013. The passing time between sites was the same as at the first event, thus the data of BC in Rūgšteliškis was also shifted backward for six hours (Figure 3b). The value of correlation coefficient was 0.7. In 58% of event duration the concentration of BC in Rūgšteliškis was higher than in Preila. The distinction of BC concentrations ranged from −0.7 and 1.3 μg·m−3 with mean BC concentrations distinction of 0.1 μg·m−3. This leads to the conclusion that between these two sites there is no significant BC emission sources. That means that the main contributing source for BC concentration in rural environments is long-range transport.
Figure 3. Air mass backward trajectories on (a) 22 March 2014 and (b) 15 November 2013. Time series of black carbon mass concentration in Vilnius and Preila during (c) 20–24 March 2014 and in Rūgšteliškis and Preila during (d) 13–17 November 2013.
Atmosphere 06 01229 g003

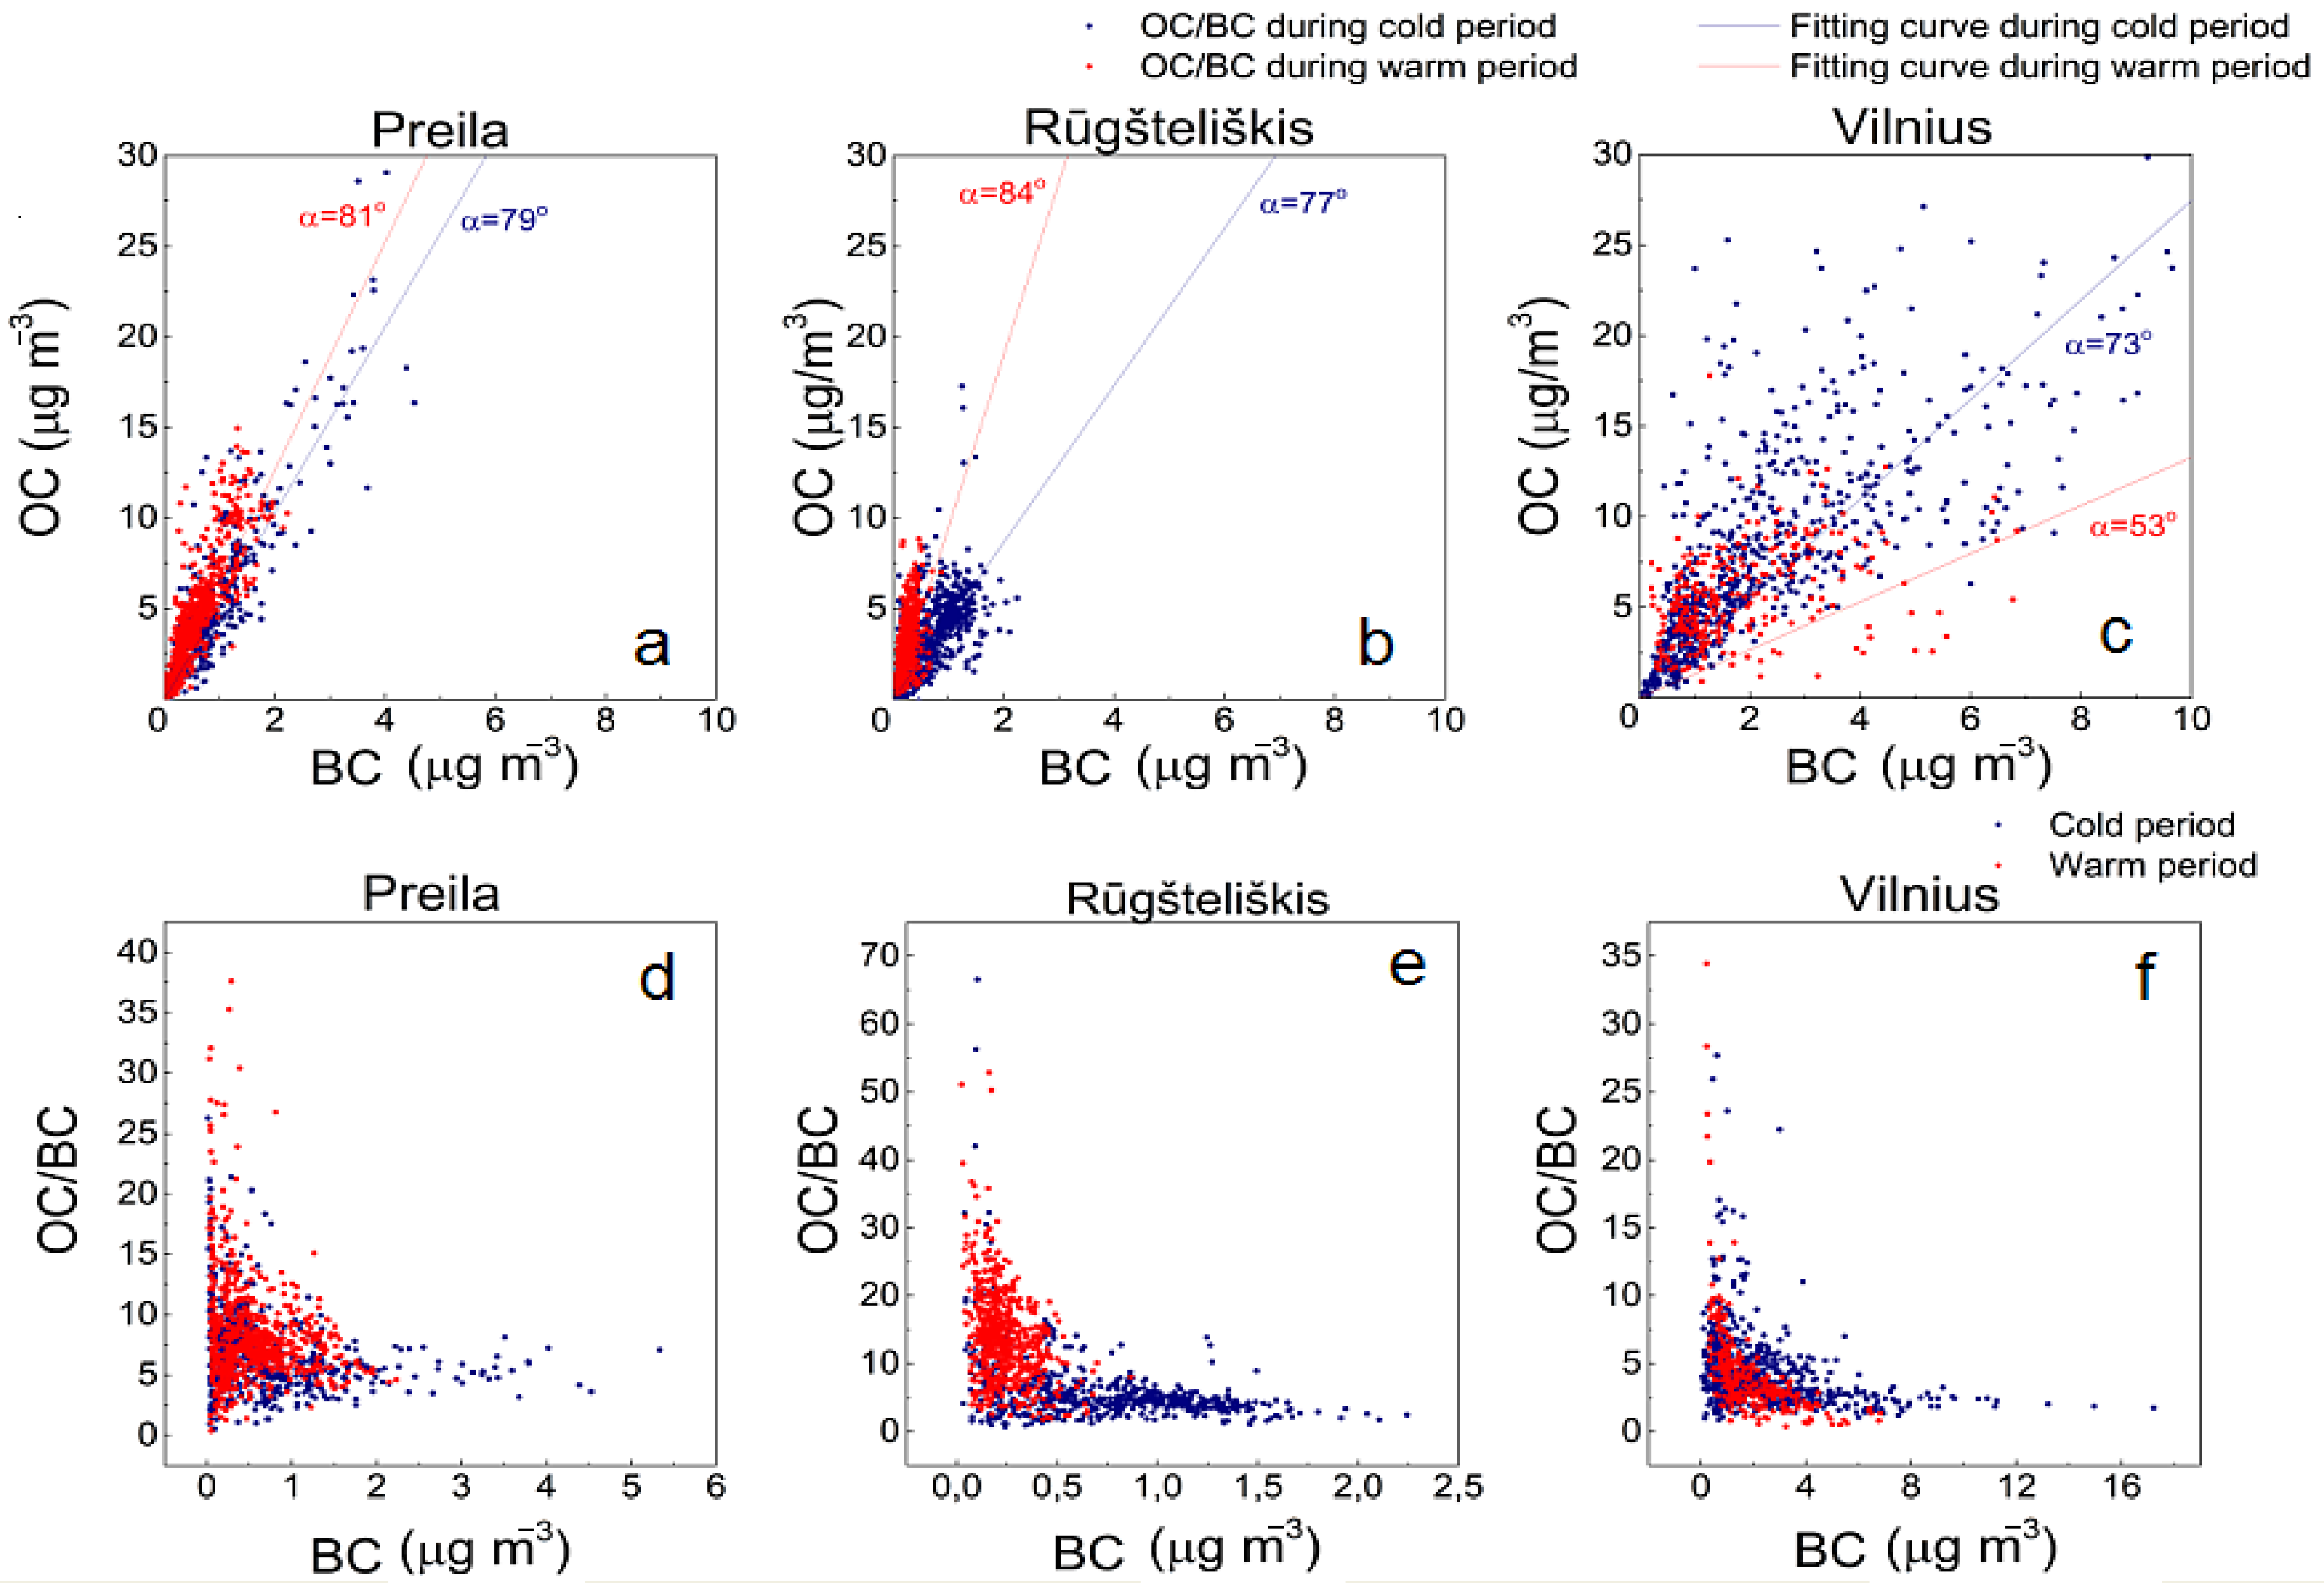
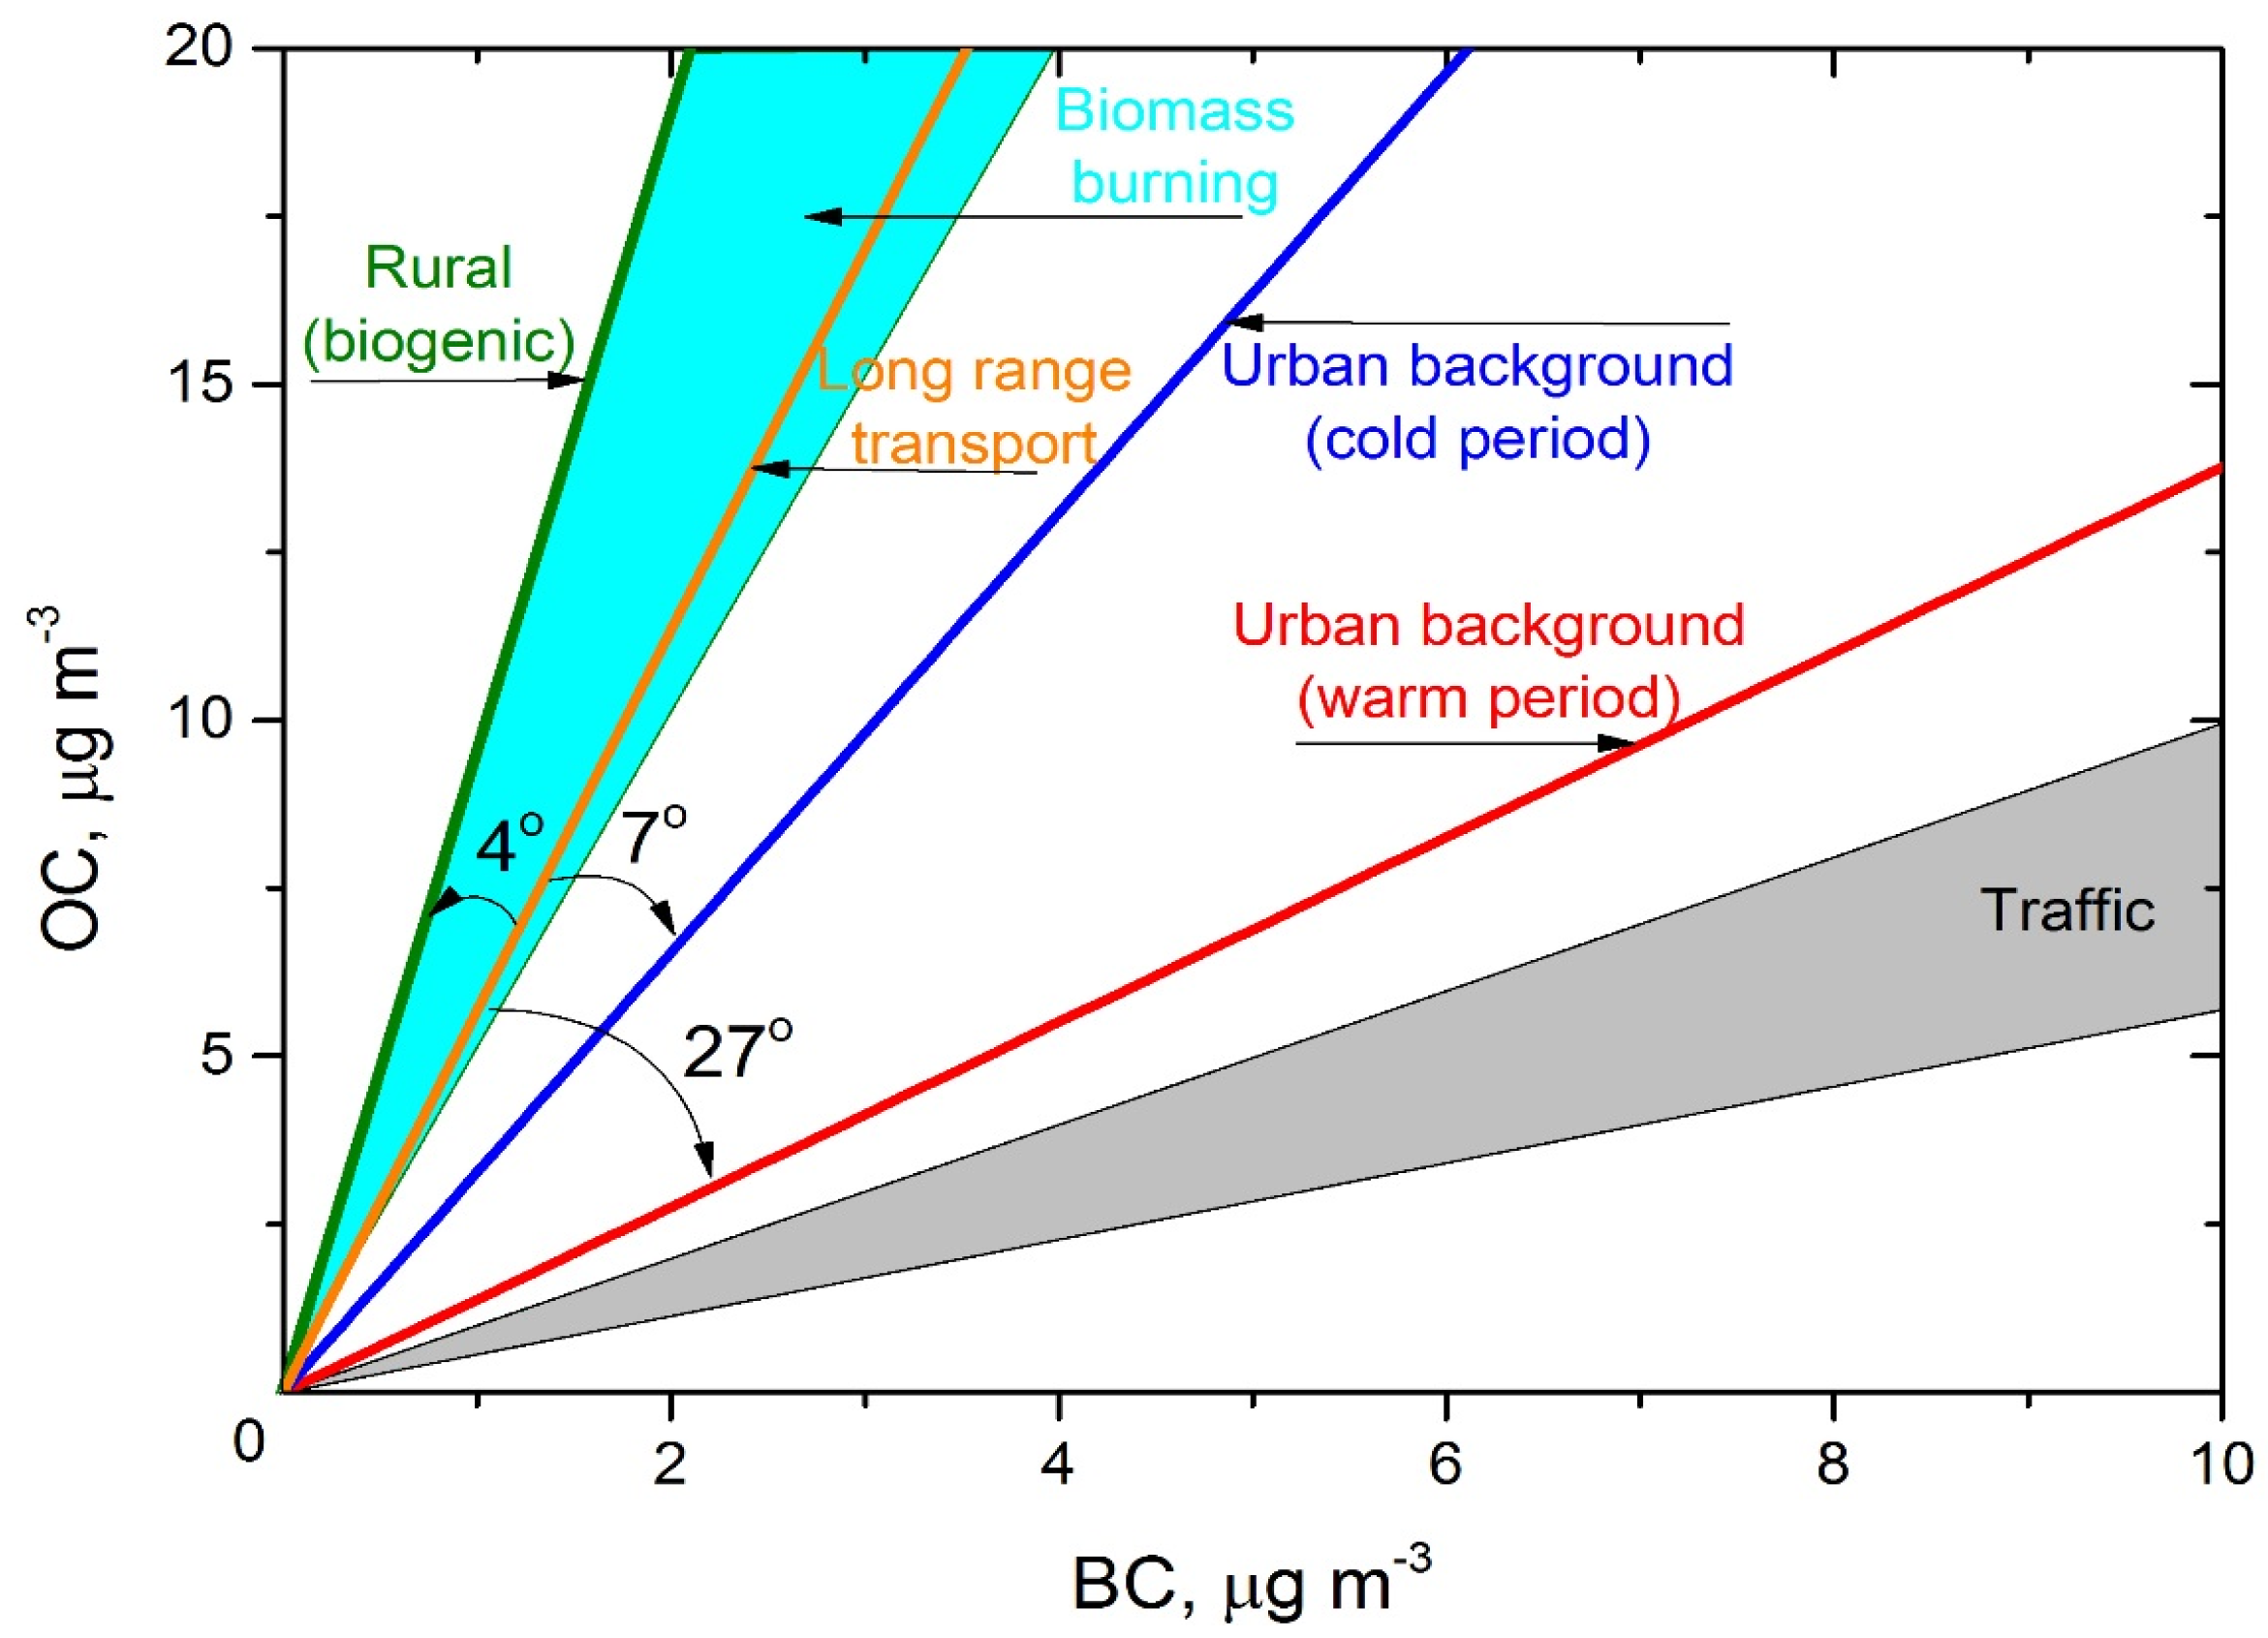
3.3. Correlation between OC and BC

The relation of BC to OC showed a moderate positive correlation during cold (r = 0.65) and warm (r = 0.43) periods in Vilnius, suggesting that there were several sources with different OC/BC ratios that varied in time. Meanwhile, moderate correlation in rural environment indicates other sources, i.e., biogenic OC. Clearly higher correlation coefficients were detected at the marine environment during cold (r = 0.93) and warm (r = 0.85) periods. Moderate statistical linear relationship in rural environment were found to be r = 0.63 and r = 0.43 during cold and warm periods, respectively. This tendency is likely due to the significant influence of air mass long-range transport and domestic biomass burning to both OC and BC mass concentrations. The scatter plots of OC and BC distribution for three sites are given in Figure 4.
Figure 4. Scatter plots of OC versus BC and OC/BC versus BC in (a,d) coastal/marine (Preila), (b,e) rural (Rūgšteliškis) and (c,f) urban background (Vilnius) environments during cold (blue) and warm (red) periods.
Atmosphere 06 01229 g004
The angle α of OC vs. BC fitting curve in Preila were found to be α = 81° and α = 79° during cold and warm periods, respectively. This insensitivity to seasonal variations indicates strong influence of air mass long-range transport and no noticeable local source. Similar angle (α = 77°) was observed in Rūgšteliškis during the cold period. This alteration of OC/BC ratio in Rūgšteliškis could be determined by strong influence of the secondary organic carbon provides a significant contribution to the total OC during the warm period. In contrast to Rūgšteliškis, the ratio of OC/BC in Vilnius had the opposite seasonal trend, when the estimated α was significantly higher during cold period (α = 73° and α = 53°, respectively). Urban environment has significant local sources of both organic and black carbon during the cold period; consequently, the value of α in Vilnius is lower than values of α observed in Preila and Rūgšteliškis during cold period. A scatter plot of OC/BC versus BC (Figure 4d–f) categorized according to season (Figure 4d–f) shows good separation of data for the highest and lowest BC values. A scatter plot shows that high ratios are clustered at BC concentrations <1 μg·m−3. Coastal/marine data analysis show similar features with other European studies: extremely high ratios (up to ~30) for BC < 1 μg·m−3 at “background” locations in Italy, Hungary, and Sweden [33]. Seasonally, the lower OC/BC ratio in cold period was owing to biomass burning for heating (Figure 4d–f).
The high values of OC/BC ratio in forested area (Rūgšteliškis) suggest that OC emissions may be derived from biogenic sources, for which the OC/BC ratios are known to be high. The higher OC mass concentration and weak correlation of OC with BC (r = 0.43) suggest that gas to particle conversion produces substantial amounts of secondary OC in the warmer months. The values of α has been compared with values of parameter α from different sites (Table 2).
Table 2. Values of parameter α at the various sampling sites in Europe.
Station typeSiteOC/BC (or OC/EC)Calculated α in this studyReference
Warm periodCold periodWam periodCold period
UrbanVilnius1.33.353°73°(This study)
Birmingham2.1 65° [3]
Helsinki1.7*2.2*59°66°[32]
Lisbon 3.1 72°[3]
Oporto2.0 63° [3]
RuralRūgšteliškis9.54.384°77°(This study)
Hyytiälä9.1*5.2*84°79°[32]
Lamas de Olo11.8 85° [3]
Coastal/marinePreila6.35.181°79°(This study)
Areão7.34.082°76°[34]
Mace Head10.8 85° [34]
Note:* Recalculated from EC.
As expected, the ratio of OC/BC was highest in rural and coastal/marine sites. The carbonaceous aerosol shows a relative enrichment in OC during warm period in these sites (α = 84°–85°). Meanwhile, ratio of carbonaceous aerosol concentrations in urban sites was lower. The most similar to value of parameter α in Vilnius during warm period was measured in Helsinki (53° and 59°, respectively). In addition, these sites are similar in regards of seasonal behavior [35]. OC/BC ratio in Europe has a mean of 2.69 ± 0.91 for urban locations, increasing to values as high as 25 for background locations in Hungary, Italy, and Sweden, where BC concentrations are lower.
Figure 5. Alteration of parameter α value for different sources.
Atmosphere 06 01229 g005
In order to generalize spatial and temporal variability of α, the additional calculations were performed. The analysis of BC and OC concentrations in Preila during both periods and in Rūgšteliškis during the cold period showed no significant influence of local sources. This leads to the assumption that averaged value of parameter α = 80° shows the influence of air mass long-range transport (Figure 5). Thus, this value of α was chosen as the baseline. It should be noted that α = 90° resembles BC concentration equal to zero and it indicates that carbonaceous aerosol originate from exclusively biogenic sources. Additionally, α = 0° indicate exclusively anthropogenic sources of carbonaceous aerosol.
The rural environment was clearly distinguished because it is mainly influenced by the biogenic emissions and long-range transport without local anthropogenic sources. On the other hand, the value of parameter α is not equal to 90°. This leads to the conclusion that the alteration of parameter α value in rural environments during the warm period was determined by biogenic sources, which increased the value of parameter α by 4° in addition to long-range transport value.
Local traffic is one of the most important parameters influencing the BC concentration in urban environments [16]. The decrease of the OC/BC ratio in urban environments during the warm period is a consequence of the vehicle traffic activity and other anthropogenic sources. For this reason, the highest α value alterations from the baseline were observed in Vilnius during the warm period. Low values of OC/BC ratio are systematically associated with highest BC concentration [35]. During the cold period, BC and OC concentrations were affected by several local sources (vehicle traffic, domestic heating, industrial activities and other). The aerosols generated by domestic biomass burning consist mainly of OC, and smaller amounts of BC [36]. Thus, domestic heating increased both OC and BC concentrations, even though the strong influence of domestic heating in Vilnius during the cold period leads to higher OC/BC ratios than in the warm period.

4. Conclusions

The OC and BC concentrations were determined for urban, rural and costal/marine environments during the warm and cold periods. The highest hourly BC aerosol mass concentration in urban background environments reached 17.23 μg·m−3 during the cold period, while the mean BC concentration was found to be 2.34 μg·m−3, which is about a factor of three higher than mean values in coastal/marine and rural sites (0.84 and 0.77 μg·m−3, respectively). It was estimated that the mean OC concentrations have distinct seasonal variations with the highest values observed (8.60 ± 7.04 μg·m−3) in urban backgrounds and lowest mean concentration (3.01 ± 2.56 μg·m−3) in coastal/marine environment in the cold period. The minimum OC concentrations varied between 0.01 μg·m−3 and 0.78 μg·m−3, while the maximum values during the cold period (75.44 μg·m−3) were more than four times higher of those in the warm period (17.78 μg·m−3) in urban background environments. In contrast, the mean OC values measured during the warm period in coastal/marine (4.11 μg·m−3) and rural (4.56 μg·m−3) environments was higher compared to the cold period (3.01 and 3.45 μg·m−3, respectively). Strong influence of local sources of BC in urban environments and long-range transport in rural environments was observed. The carbonaceous aerosol shows a relative enrichment in OC during the warm period in coastal/marine and rural sites (α = 84°–85°). The high values of OC/BC ratio in forested (rural) areas suggest that OC emissions could be derived from biogenic sources. The decrease of the OC/BC ratio in urban environment during the warm period was caused by the vehicle traffic activity and other anthropogenic sources.

Acknowledgments

This work was supported by the Lithuanian-Swiss Cooperation Programme “Research and Development” project AEROLIT (No. CH-3-ŠMM-01/08).

Author Contributions

Julija Pauraitė and Genrik Mordas conceived of and designed the experimental campaign, dataset analysis, and drafting of the manuscript; Vidmantas Ulevicius supervised the research topic; Steigvilė Byčenkienė wrote the paper.

Conflicts of Interest

The authors declare no conflict of interest.

References

  1. Jimenez, J.L.; Canagaratna, M.R.; Donahue, N.M.; Prevot, A.S.H.; Zhang, Q.; Kroll, J.H.; DeCarlo, P.F.; Allan, J.D.; Coe, H.; Ng, N.L.; et al. Evolution of organic aerosols in the atmosphere. Science 2009, 326, 1525–1529. [Google Scholar] [CrossRef] [PubMed]
  2. Satsangi, A.; Pachauri, T.; Singla, V.; Lakhani, A.; Kumari, K.M. Organic and elemental carbon aerosols at a suburban site. Atmos. Res. 2012, 113, 13–21. [Google Scholar] [CrossRef]
  3. Pio, C.; Cerqueira, M.; Harrison, R.M.; Nunes, T.; Mirante, F.; Alves, C.; Oliveira, C.; Sanchez de la Campa, A.; Artíñano, B.; Matos, M. OC/EC ratio observations in Europe: Re-thinking the approach for apportionment between primary and secondary organic carbon. Atmos. Environ. 2011, 45, 6121–6132. [Google Scholar] [CrossRef]
  4. Calvo, A.I.; Alves, C.; Castro, A.; Pont, V.; Vicente, A.M.; Fraile, R. Research on aerosol sources and chemical composition: Past, current and emerging issues. Atmos. Res. 2013, 120, 1–28. [Google Scholar] [CrossRef]
  5. Viana, M.; Maenhaut, W.; ten Brink, H.M.; Chi, X.; Wijers, E.; Querol, X.; Alastuey, A.; Mikuška, P.; Večeřa, Z. Comparative analysis of organic and elemental carbon concentrations in carbonaceous aerosols in three European cities. Atmos. Environ. 2007, 41, 5972–5983. [Google Scholar] [CrossRef]
  6. Kumagai, K.; Iijima, A.; Tago, H.; Tomioka, A.; Kozawa, K.; Sakamoto, K. Seasonal characteristics of water-soluble organic carbon in atmospheric particles in the inland Kanto plain, Japan. Atmos. Environ. 2009, 43, 3345–3351. [Google Scholar] [CrossRef]
  7. Salako, G.O.; Hopke, P.K.; Cohen, D.D.; Begum, B.A.; Biswas, S.K.; Pandit, G.G.; Chung, Y.-S.; Rahman, S.A.; Hamzah, M.S.; Davy, P.K.; et al. Exploring the variation between EC and BC in a variety of locations. Aerosol Air Qual. Res. 2012, 12, 1–7. [Google Scholar] [CrossRef]
  8. Seinfeld, J.H.; Pandis, S.N. Atmospheric Chemistry and Physics: from Air Pollution to Climate Change; John Wiley & Sons: New York, USA; p. 1326.
  9. Cyrys, J.; Heinrich, J.; Hoek, G.; Meliefste, K.; Lewne, M.; Gehring, U.; Bellander, T.; Fischer, P.; Van Vliet, P.; Brauer, M.; et al. Comparison between Different Traffic-related Particle Indicators: Elemental. Carbon (EC), PM2.5 Mass, and Absorbance. J. Exposure Anal. Environ. Epidemiol. 2003, 13, 134–143. [Google Scholar] [CrossRef] [PubMed]
  10. Ozdemir, H.; Pozzoli, L.; Kindap, T.; Demir, G.; Mertoglu, B.; Mihalopoulos, N.; Theodosi, C.; Kanakidou, M.; Im, U.; Unal, A. Spatial and temporal analysis of black carbon aerosols in Istanbul megacity. Sci. Total Environ. 2014, 473, 451–458. [Google Scholar] [CrossRef] [PubMed]
  11. Schleicher, N.; Norra, S.; Fricker, M.; Kaminski, U.; Chen, Y.; Chai, F.; Wang, S.; Yu, Y.; Cen, K. Spatio-temporal variations of black carbon concentrations in the Megacity Beijing. Environ. Pollut. 2013, 182, 392–401. [Google Scholar] [CrossRef] [PubMed]
  12. Dumka, U.C.; Manchanda, R.K.; Sinha, P.R.; Sreenivasan, S.; Moorthy, K.K.; Babu, S.S. Temporal variability and radiative impact of black carbon aerosol over tropical urban station Hyderabad. J. Atmos. Sol. Terr. Phy. 2013, 105, 81–90. [Google Scholar] [CrossRef]
  13. Hyvärinen, A.P.; Kolmonen, P.; Kerminen, V.M.; Virkkula, A.; Leskinen, A.; Komppula, M.; Hatakka, J.; Burkhart, J.; Stohl, A.; Aalto, P.; et al. Aerosol black carbon at five background measurement sites over Finland, a gateway to the Arctic. Atmos. Environ. 2011, 45, 4042–4050. [Google Scholar] [CrossRef]
  14. Saha, A.; Despiau, S. Seasonal and diurnal variations of black carbon aerosols over a Mediterranean coastal zone. Atmos. Res. 2009, 92, 27–41. [Google Scholar] [CrossRef]
  15. Clarke, A.D.; Shinozuka, Y.; Kapustin, V.N.; Howell, S.; Huebert, B.; Doherty, S.; Weber, R.; et al. Size distributions and mixtures of dust and black carbon aerosol in Asian outflow: Physiochemistry and optical properties. J. Geophys. Res. 2004, 109, D15S09. [Google Scholar]
  16. Kondo, Y.; Matsui, H.; Moteki, N.; Sahu, L.; Takegawa, N.; Kajino, M.; Brune, W.H. Emissions of black carbon, organic, and inorganic aerosols from biomass burning in North America and Asia in 2008. J. Geophys. Res. 2011, 116, D08204. [Google Scholar] [CrossRef]
  17. Ning, Z.; Chan, K.L.; Wong, K.C.; Westerdahl, D.; Močnik, G.; Zhou, J.H.; Cheung, C.S. Black carbon mass size distributions of diesel exhaust and urban aerosols measured using differential mobility analyzer in tandem with Aethalometer. Atmos. Environ. 2013, 80, 31–40. [Google Scholar]
  18. Byčenkienė, S.; Ulevicius, V.; Kecorius, S. Characteristics of black carbon aerosol mass concentration over the East Baltic region from two-year measurements. J. Environ. Monit. 2011, 13, 1027–1038. [Google Scholar] [CrossRef] [PubMed]
  19. Cape, J.N.; Coyle, M.; Dumitrean, P. The atmospheric lifetime of black carbon. Atmos. Environ. 2012, 59, 256–263. [Google Scholar] [CrossRef] [Green Version]
  20. Aruna, K.; Lakshmi Kumar, T.V.; Narayana Rao, D.; Krishna Murthy, B.V.; Suresh Babu, S.; Krishna Moorthy, K. Black carbon aerosols in a tropical semi-urban coastal environment: Effects of boundary layer dynamics and long range transport. J. Atmos. Sol. Terr. Phy. 2013, 104, 116–125. [Google Scholar] [CrossRef]
  21. Grivas, G.; Cheristanidis, S.; Chaloulakou, A. Elemental and organic carbon in the urban environment of Athens. Seasonal and diurnal variations and estimates of secondary organic carbon. Sci. Total Environ. 2012, 414, 535–545. [Google Scholar] [CrossRef] [PubMed]
  22. Wang, F.; Guo, Z.; Lin, T.; Hu, L.; Chen, Y.; Zhu, Y. Characterization of carbonaceous aerosols over the East China Sea: The impact of the East Asian continental outflow. Atmos. Environ. 2015, 110, 163–173. [Google Scholar] [CrossRef]
  23. Guzman-Morales, J.; Frossard, A.A.; Corrigan, A.L.; Russell, L.M.; Liu, S.; Takahama, S.; Taylor, J.W.; Allan, J.; Coe, H.; Zhao, Y.; et al. Estimated contributions of primary and secondary organic aerosol from fossil fuel combustion during the Cal-Nex and Cal-Mex campaigns. Atmos. Environ. 2014, 88, 330–340. [Google Scholar] [CrossRef]
  24. Huang, X.F.; Gao, R.S.; Schwarz, J.P.; He, L.Y.; Fahey, D.W.; Watts, L.A.; McComiskey, A.; Cooper, O.R.; Sun, T.L.; Zeng, L.W.; et al. Black Carbon measurements in the Pearl River Delta Region of China. J. Geophys. Res. Atmos. 2011, 116, D12208. [Google Scholar] [CrossRef]
  25. Rattigan, O.V.; Civerolo, K.; Doraiswamy, P.; Felton, H.D.; Hopke, P.K. Long term black carbon measurements at two urban locations in New York. Aerosol Air Qual. Res. 2013, 13, 1181–1196. [Google Scholar] [CrossRef]
  26. Byčenkienė, S.; Plauškaitė, K.; Dudoitis, V.; Ulevicius, V. Urban background levels of particle number concentration and sources in Vilnius, Lithuania. Atmos. Res. 2014, 143, 279–292. [Google Scholar] [CrossRef]
  27. Ulevicius, V.; Byčenkienė, S.; Remeikis, V.; Garbaras, A.; Kecorius, S.; Andriejauskienė, J.; Jasinevičienė, D.; Mocnik, G. Characterization of pollution events in the East Baltic region affected by regional biomass fire emissions. Atmos. Res. 2010, 98, 190–200. [Google Scholar] [CrossRef]
  28. Middlebrook, A.M.; Bahreini, R.; Jimenez, J.L.; Canagaratna, M.R. Evaluation of Composition-Dependent Collection Efficiencies for the Aerodyne Aerosol Mass Spectrometer using Field Data. Aerosol Sci. Techl. 2012, 46, 258–271. [Google Scholar] [CrossRef]
  29. Collaud Coen, M.; Weingartner, E.; Apituley, A.; Ceburnis, D.; Fierz-Schmidhauser, R.; Flentje, H.; Henzing, J.S.; Jennings, S.G.; Moerman, M.; Petzold, A.; et al. Minimizing light absorption measurement artifacts of the Aethalometer: evaluation of five correction algorithms. Atmos. Meas. Tech. 2010, 3, 457–474. [Google Scholar] [CrossRef]
  30. Rozwadowska, A.; Zielinski, T.; Petelski, T.; Sobolewski, P. Cluster analysis of the impact of air back-trajectories on aerosol optical properties at Hornsund, Spitsbergen. Atmos. Chem. Phys. 2010, 10, 877–893. [Google Scholar] [CrossRef]
  31. Draxler, R.R.; Rolph, G.D. HYSPLIT (HYbrid Single-Particle Lagrangian Integrated Trajectory) Model access via NOAA ARL READY Website 2015. Available online: http://ready.arl.noaa.gov/HYSPLIT.php (accessed on 5 August 2015).
  32. Aurela, M.; Saarikoski, S.; Timonen, H.; Aalto, P.; Keronen, P.; Saarnio, K.; Teinilä, K.; Kulmala, M.; Hillamo, R. Carbonaceous aerosol at a forested and an urban background sites in Southern Finland. Atmos. Environ. 2011, 45, 1394–1401. [Google Scholar] [CrossRef]
  33. Zappoli, S.; Andracchio, A.; Fuzzi, S.; Facchini, M.C.; Gelencsér, A.; Kiss, G.; Krivácsy, Z.; Molnár, Á.; Mészáros, E.; Hansson, H.C.; et al. Inorganic, organic and macromolecular components of fine aerosol in different areas of Europe in relation to their water solubility. Atmos. Environ. 1999, 33, 2722–2743. [Google Scholar] [CrossRef]
  34. Castro, L.M.; Pio, C.A.; Harrison, R.M.; Smith, D.J.T. Carbonaceous aerosol in urban and rural European atmospheres: Estimation of secondary organic carbon concentrations. Atmos. Environ. 1999, 33, 2771–2781. [Google Scholar] [CrossRef]
  35. Asmi, A.; Wiedensohler, A.; Laj, P.; Fjaeraa, A.M.; Sellegri, K.; Birmili, W.; Weingartner, E.; Baltensperger, U.; Zdimal, V.; Zikova, N.; et al. Number size distributions and seasonality of submicron particles in Europe 2008–2009. Atmos. Chem. Phys. 2011, 11, 5505–5538. [Google Scholar] [CrossRef] [Green Version]
  36. Novakov, T.; Menon, S.; Kirchstetter, T.W.; Koch, D.; Hansen, J.E. Aerosol organic carbon to black carbon ratios: Analysis of published data and implications for climate forcing. J. Geophys. Res. 2005, 110, D21205. [Google Scholar] [CrossRef]

