1. Introduction
Particulate matter impacts the environment, climate, and human health and has become one of the most important pollutants affecting air quality. However, particulate matter, including PM
10 with an aerodynamic equivalent diameter less than 10 μm and PM
2.5 with an aerodynamic equivalent diameter less than 2.5 μm, has significant effect on human health in the last decades [
1]. PM
10 can be absorbed by the human body, thereby causing diseases following deposition in the respiratory tract and alveoli, and a number of studies have been conducted on this issue. For example, Wu
et al. and Amador-Muñoz
et al. studied the concentration and potential threats of PM
10 in coal-fired industrial cities in China [
2] and in Southwestern Mexico [
3]. Makra
et al. and Malandrino
et al. studied the distribution of PM
10 under different traffic patterns in Szeged and Bucharest [
4], and the yearly and quarterly changes of the trace elements in PM
10 in Turin, Italy [
5], respectively. However, few studies have been conducted on PM
10 distribution in Buddhist scenic spots, where a large number of incenses and candles are burned during the peak tourist season.
Studies on human health, particularly respiratory diseases, have increased in recent years. PM
2.5 is likely to adsorb toxic substances and to be inhaled into the alveoli and blood [
6], which has increased people’s awareness regarding this matter. Compared with PM
10, PM
2.5 is characterized by small particle size, large area, and high activity. It is also likely to absorb toxic and harmful substances, have a long residence time in the air, and travel long distances. The majority of recent reports on PM
2.5 have focused on the analysis of chemical components in organic pollutants, inorganic chemical components, and microbial components in particulate matter. For instance, Mikuška
et al. analyzed all organic pollutants contained in the PM
2.5 of Ostrava, an industrial city in the Czech Republic during winter [
7]. Salameh
et al. studied the seasonal and spatial distribution characteristics of the chemical components of PM
2.5 in five cities around the Mediterranean Sea in Europe [
8]. Cao
et al. extracted DNA from some microorganisms in PM
2.5 in Beijing for metagenomic analysis [
9].
Work-related stress, fast-paced lifestyles, and severe atmospheric and environmental pollution have caused the degradation of living standards in urban areas. This has led to the popularity of tourism as it allows urban dwellers to get “close to nature”. However, increasing vehicle flow and emissions from fossil fuel combustion have resulted in anthropogenic pollution in scenic spots and these effects cannot be underestimated any longer. In scenic spots, some studies on PM
10 and PM
2.5 focused on particulate matter concentration and analysis of chemical components. For instance, Zhang,
et al. [
10] studied the samples of aerosol from PM
2.5 in the Yulong Scenic Spot southeast of the Qinghai Tibet Plateau, China, during the winter to determine the chemical composition and source. Lee,
et al. [
11] analyzed the impact of soot caused by biomass burning, the dispersion of PM
2.5 concentrations in Southeast Asia, and the presence of water-soluble ions in Lulin Mountain Region, Taiwan.
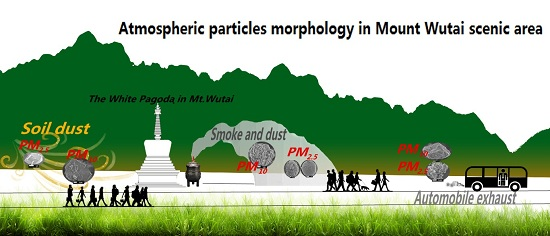
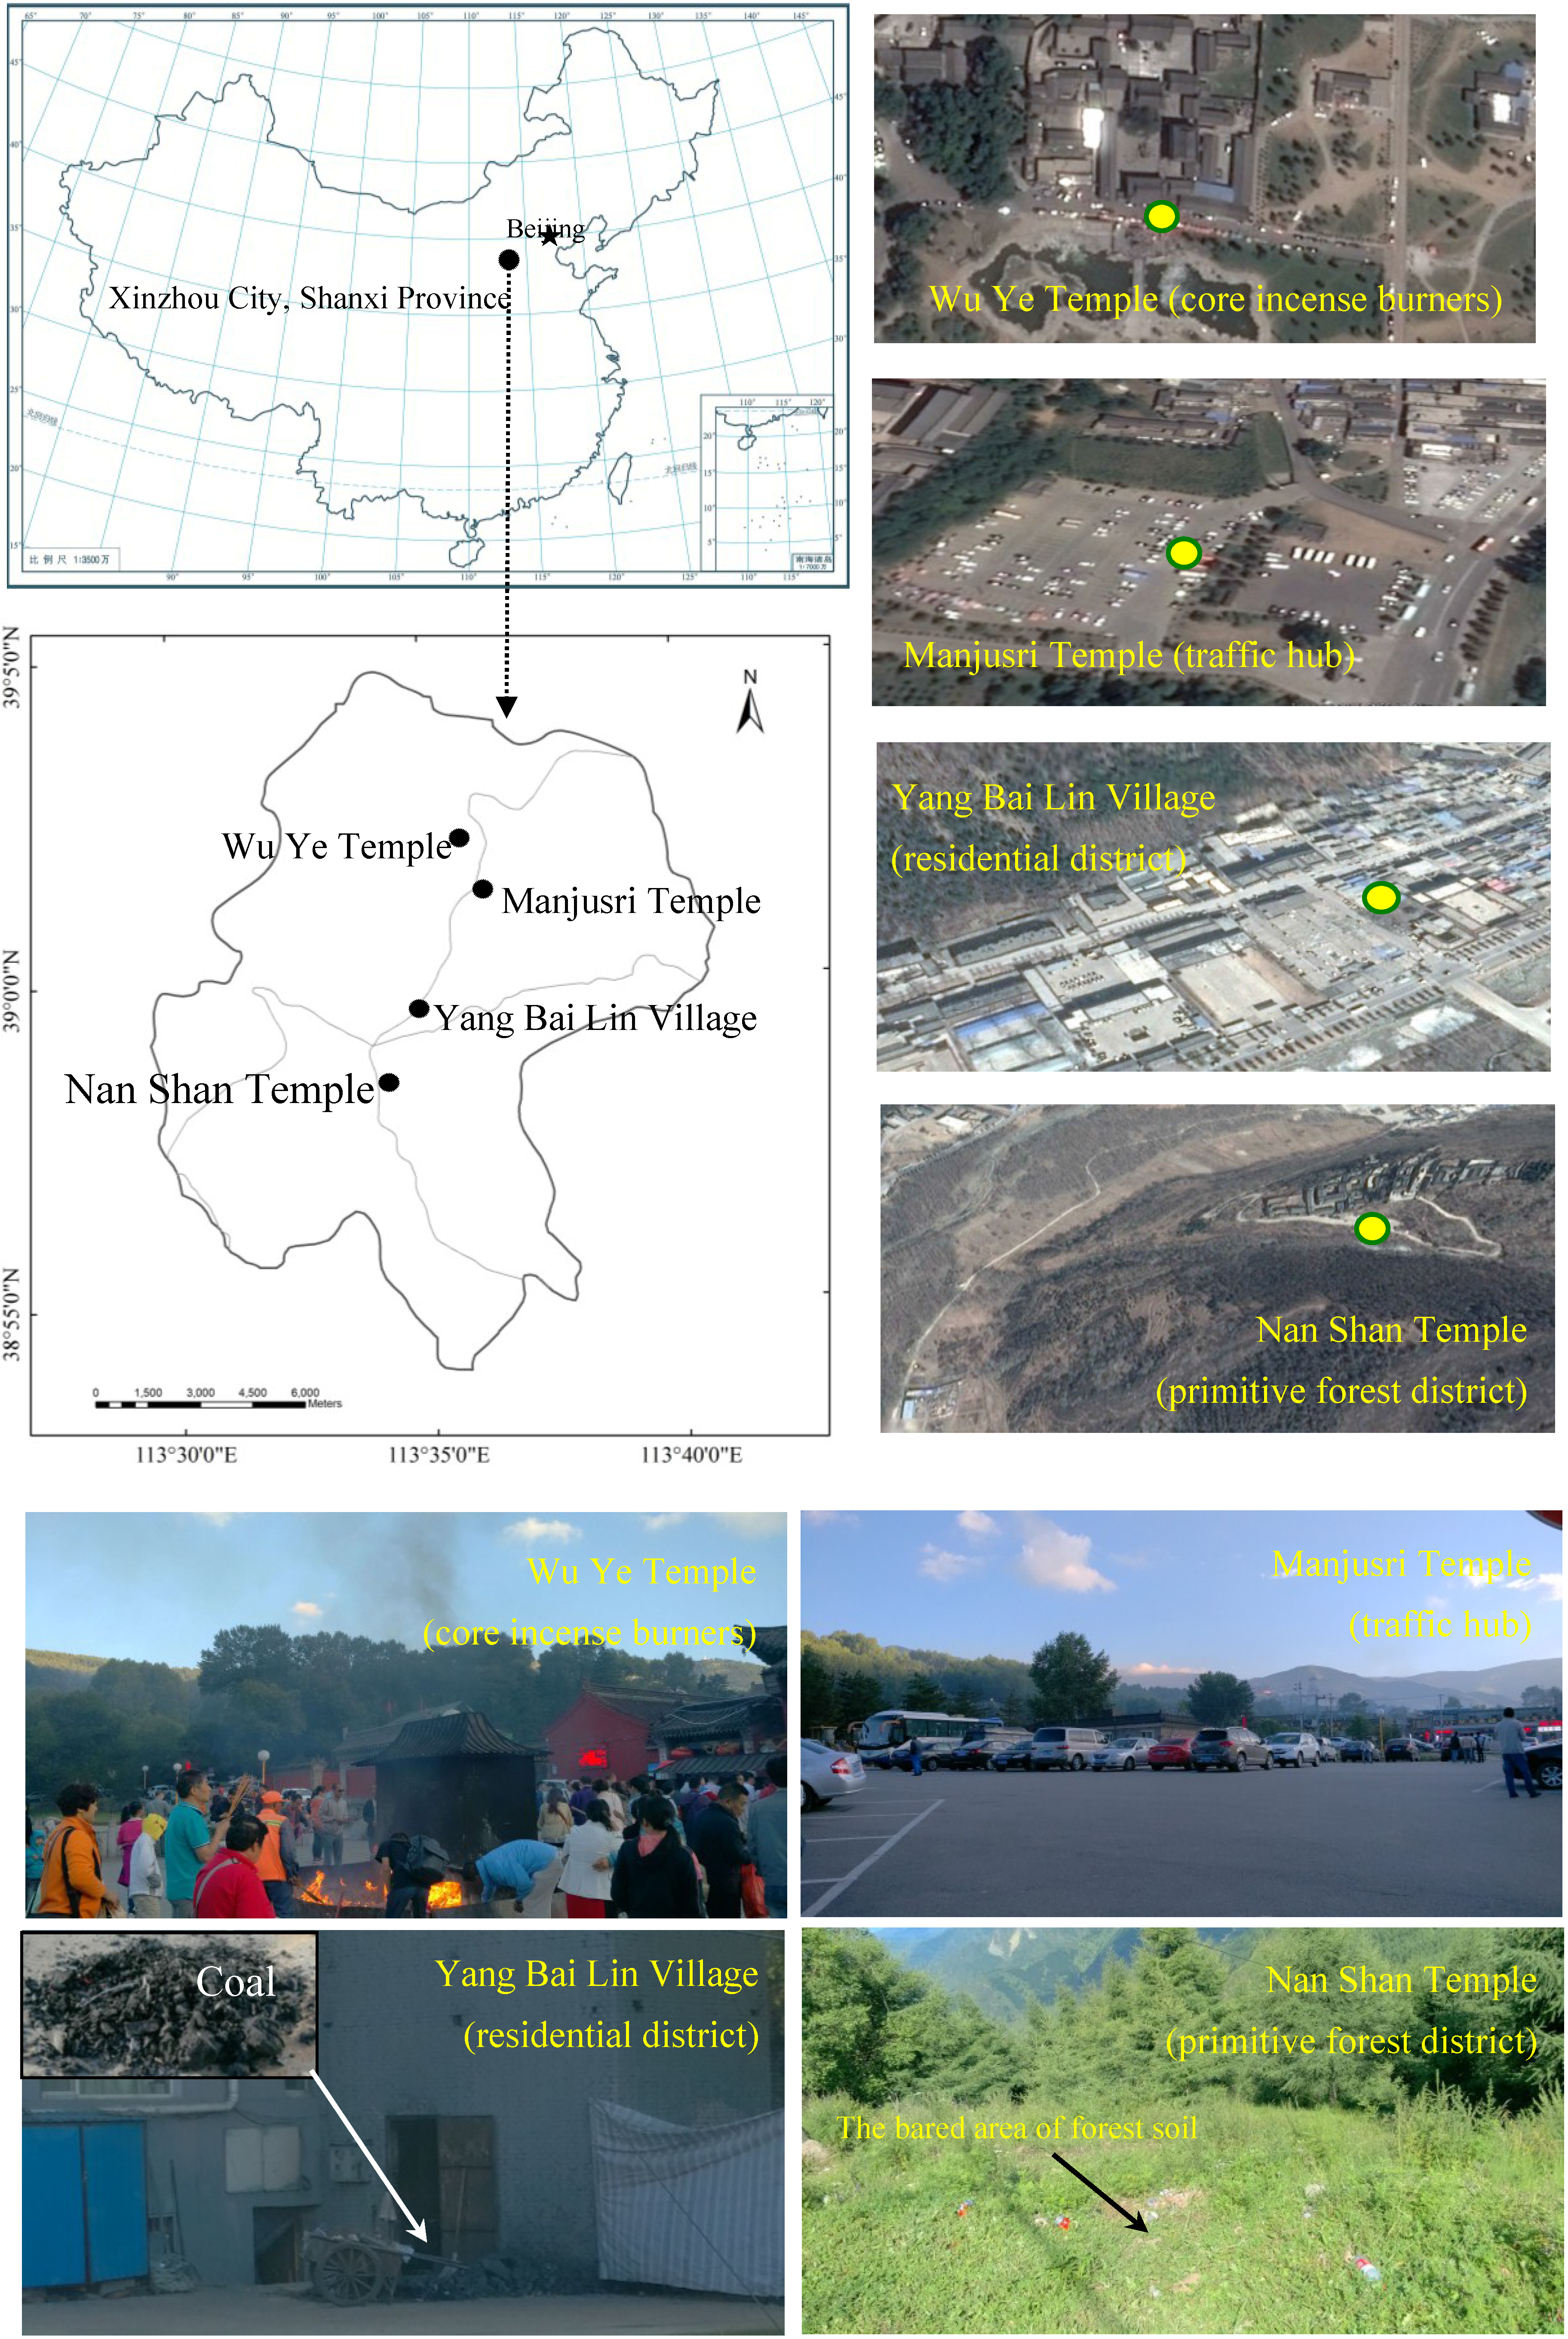
Few studies have been carried out on single-particle morphology of PM2.5 in a natural scenic spot. Single-particulate matter research techniques can provide single-particle morphology, chemical composition, particle size distribution, and other pertinent information. Analytical data related to single-particulate matter can be used as “fingerprint information”, to some extent, to show the corresponding natural or anthropogenic source. Unlike urban areas and other scenic spots, Mount Wutai Scenic Spot, located in Shanxi, China, a sacred place for Buddhists, is visited by many pilgrims who burn candles while praying. During tourists praying at Buddhist tourist spots at Mount Wutai, they burning a lot of incense and candle, which consisted with some combustible biomass materials, such as natural sticky powder, elm wood powder, and fragrant material. Strong pungent odor can be produced when incense, candles, and its plastic package materials burning accompanied with intense black smoke. Sometimes, the pungent odor can be easy-nosed by tourists in 30–50 m away. In addition, transportation and catering business are also expansion with the increasing of tourists. Furthermore, some tourists carry out their tourism activities in primitive forest district. During these activities, large amounts of particulate matter may be produced from incense and candles burning in praying, automobile exhaust, coal burning in catering business, and fugitive dust come from bared land caused by the tourists trample in primitive forest district. Unfortunately, to the best of our knowledge, none studies have investigated the PM10 or PM2.5 pollution at Buddhist scenic areas, such as Mount Wutai Scenic Spot.
The initial objective of the present work was to investigate the concentrations of PM10 and PM2.5 in the four different areas, including Wu Ye Temple (core incense burners), Manjusri Temple (a traffic hub), Yang Bai Lin Village (a residential district), and Nan Shan Temple (located in a primitive forest district), at Mount Wutai scenic spot during the peak season. In order to explore: (1) the typical pattern of particulate matter produced in Mount Wutai Scenic Spot and (2) the main elements, which may enter the human body by breathing these particulate matter. The morphology and elemental composition of PM10 and PM2.5 in the different areas were also investigated. The outcomes will provide scientific data for atmospheric pollution control at Mount Wutai scenic spot.
3. Results and Discussions
3.1. Concentration Distribution of PM10 and PM2.5 at Mount Wutai Scenic Spot
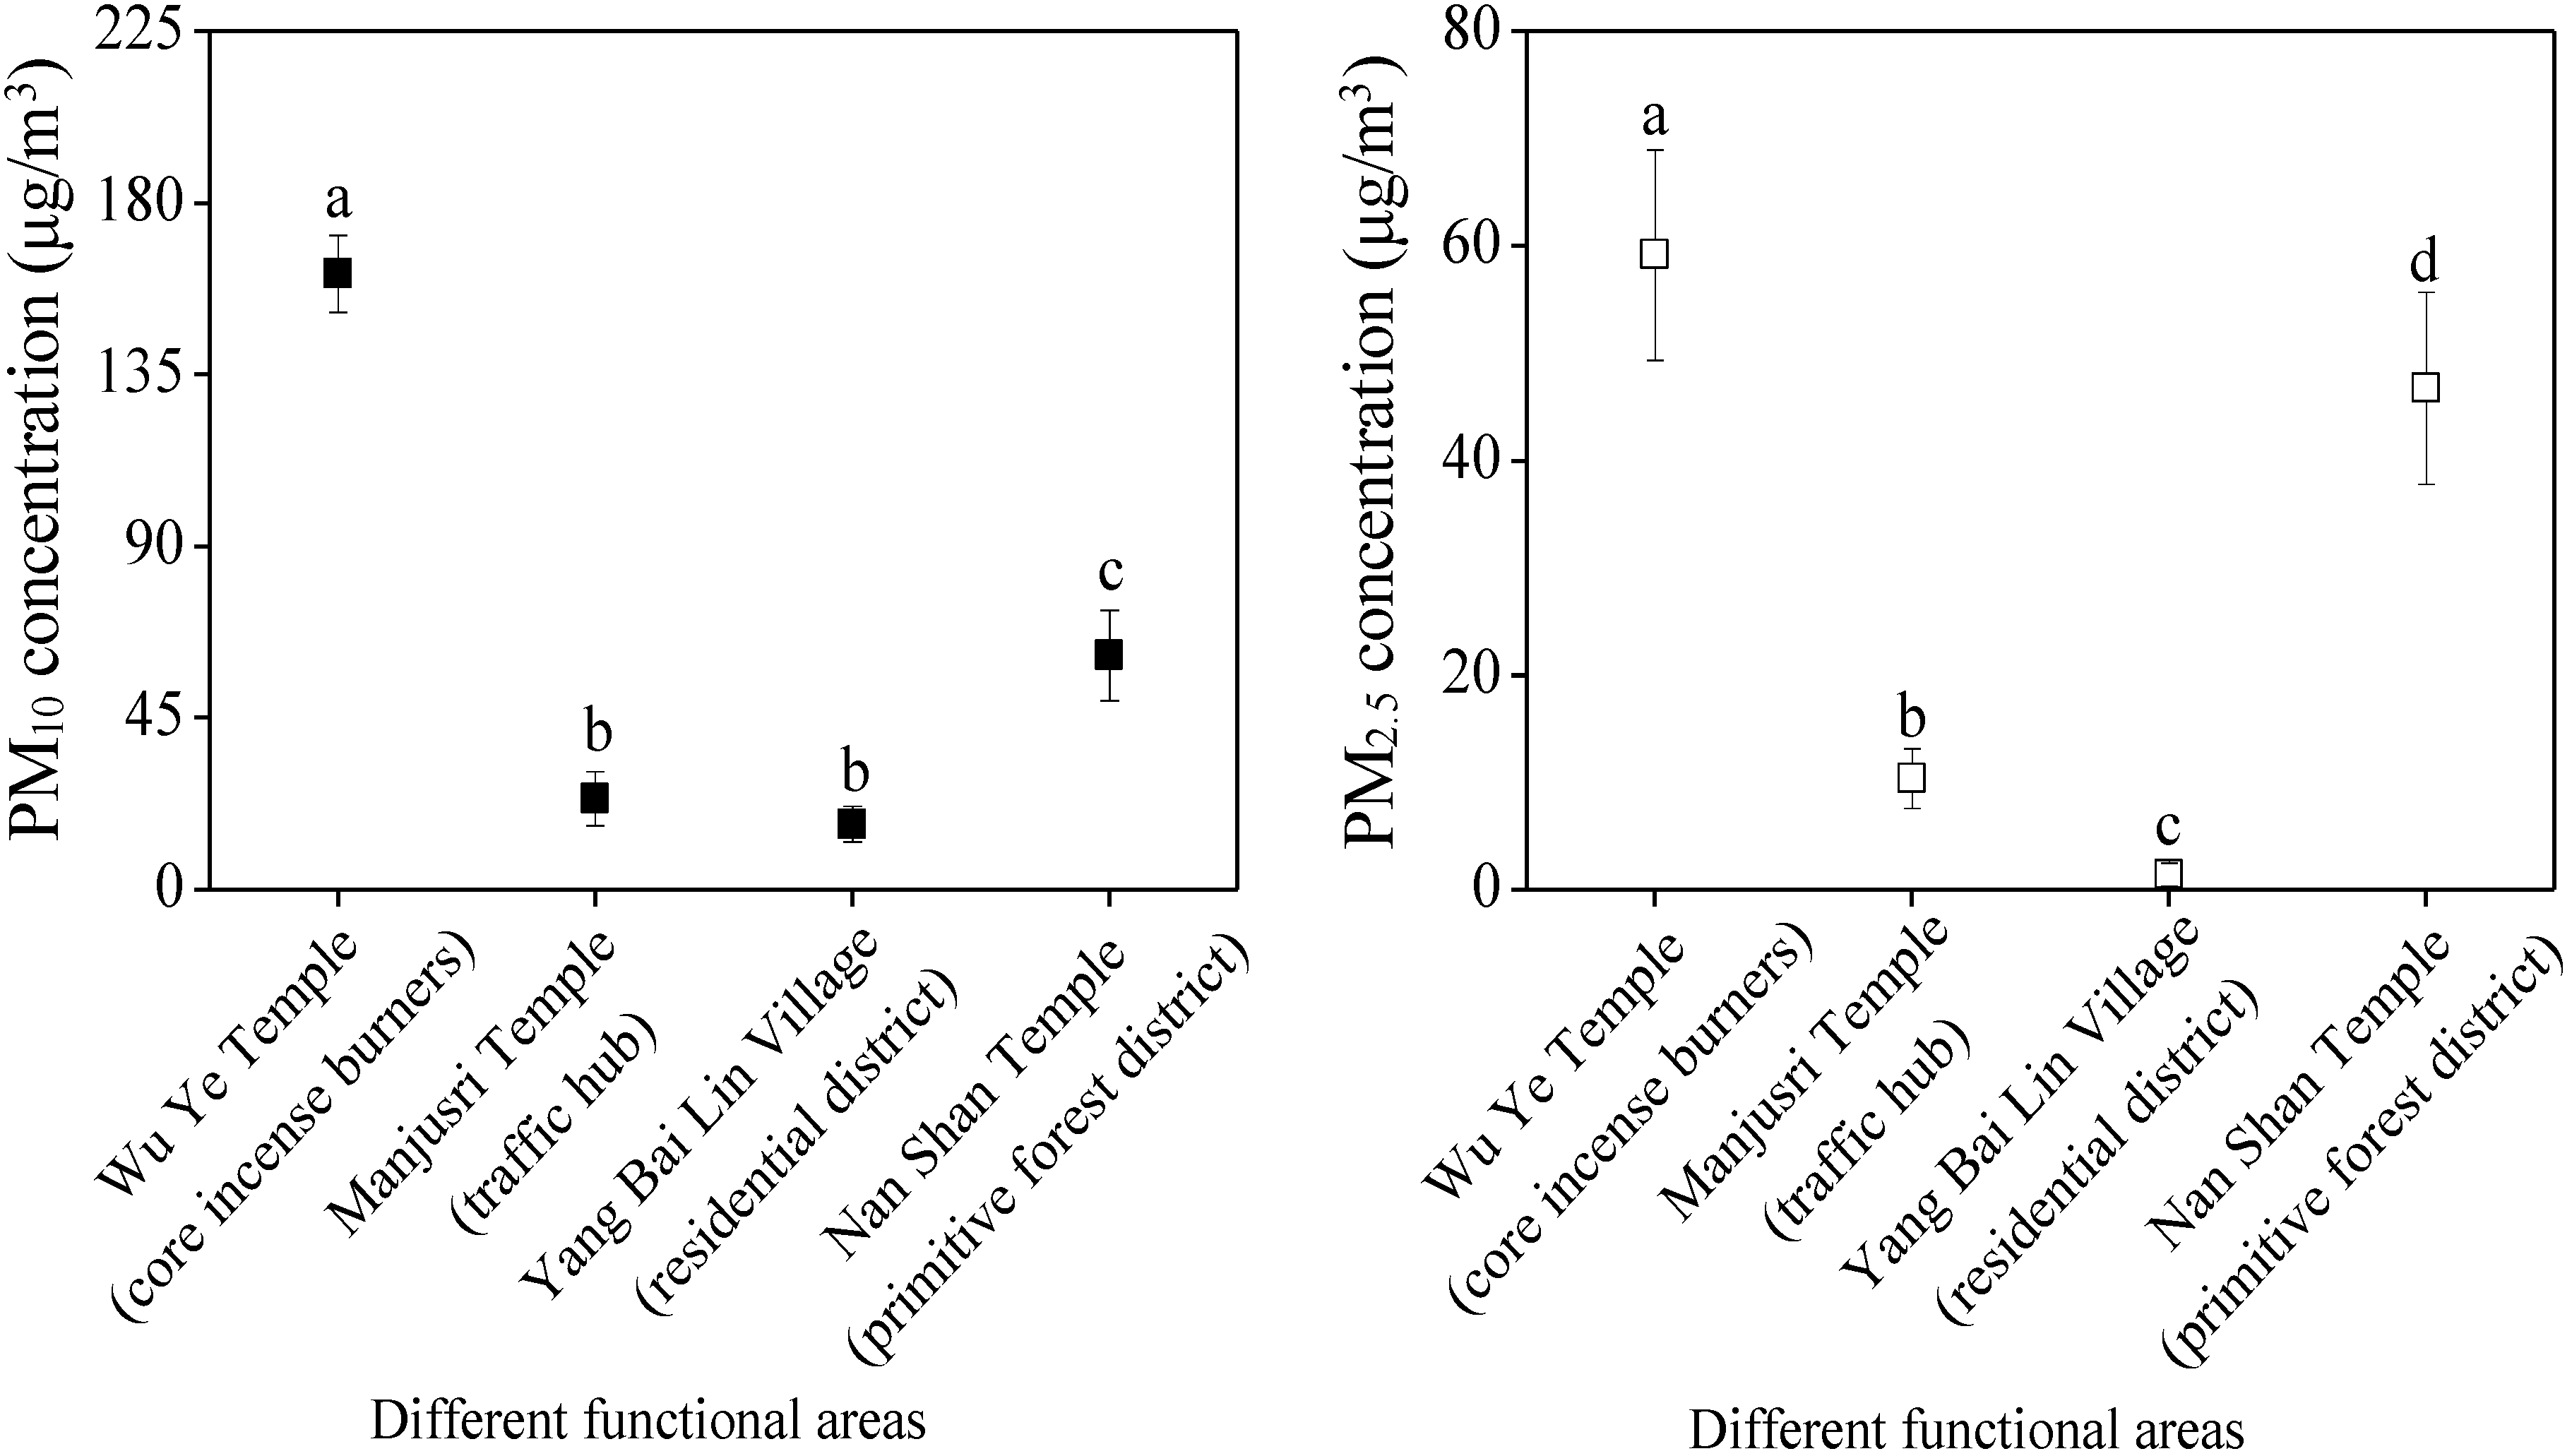
The mean daily concentrations of PM
10 and PM
2.5 are shown in
Figure 2. The results showed that the PM
10 concentration at the four different areas were within the range of 17.40 μg/m
3 to 161.45 μg/m
3, whereas the mean daily value at Wu Ye Temple was 1.01–1.14 times higher than the threshold (50 μg/m
3) of the World Health Organization (WHO) Air Quality Guidelines (2005). The daily value for Nan Shan Temple Forest District was 0.99–1.46 times higher than the threshold of the above standard, respectively. However, at Manjusri Temple and Yang Bai Lin Village sampling points, the PM
10 concentrations did not exceed the threshold of the WHO standard. The PM
2.5 concentration at the four different areas was 1.43 μg/m
3 to 59.20 μg/m
3; the mean daily values of PM
2.5 at sampling points Wu Ye Temple and Nan Shan Temple Forest District were 1.75–2.70 times and 0.99–1.87 times higher than the WHO standard (25 μg/m
3), respectively. However, the PM
10 and PM
2.5 concentrations at the Manjusri Temple and Yang Bai Lin Village sampling points were lower than the WHO standard.
Figure 2.
PM10 and PM2.5 concentration distribution in the four different areas at Mount Wutai, Shanxi, China. Data labeled in the point with the same letter are not significantly different at p < 0.05. The vertical T-bars indicated standard deviation about the means.
Figure 2.
PM10 and PM2.5 concentration distribution in the four different areas at Mount Wutai, Shanxi, China. Data labeled in the point with the same letter are not significantly different at p < 0.05. The vertical T-bars indicated standard deviation about the means.
In addition, the results of this study show that the mean concentration ratios of PM2.5 to PM10 at Wu Ye Temple, Manjusri Temple, Yang Bai Lin Village, and Nan Shan Temple Forest District were 0.367, 0.435, 0.083 and 0.760, respectively. Thus, the mean concentration ratio of PM2.5 to PM10 in the four areas was 0.387. It is concluded that the particulate matter around Manjusri Temple was mostly sub-fine particles with an equivalent spherical diameter range of 2.5–10 μm. The sub-fine particle concentrations at Wu Ye Temple and Yang Bai Lin Village were lower that the level at Manjusri Temple.
3.2. Particle Size Distribution of Airborne Particulate Matter at Mount Wutai Scenic Spot
It is now generally accepted that fine particles are more harmful to health effect than larger particles because fine particles offer a larger surface area and hence potentially larger concentrations of adsorbed or condensed toxic air pollutants per unit mass [
12] or fine particles are more efficiently retained in the peripheral lung [
13]. Based on equivalent spherical diameter, the particle size distributions of particulate matter in the four different areas are shown in
Figure 3.
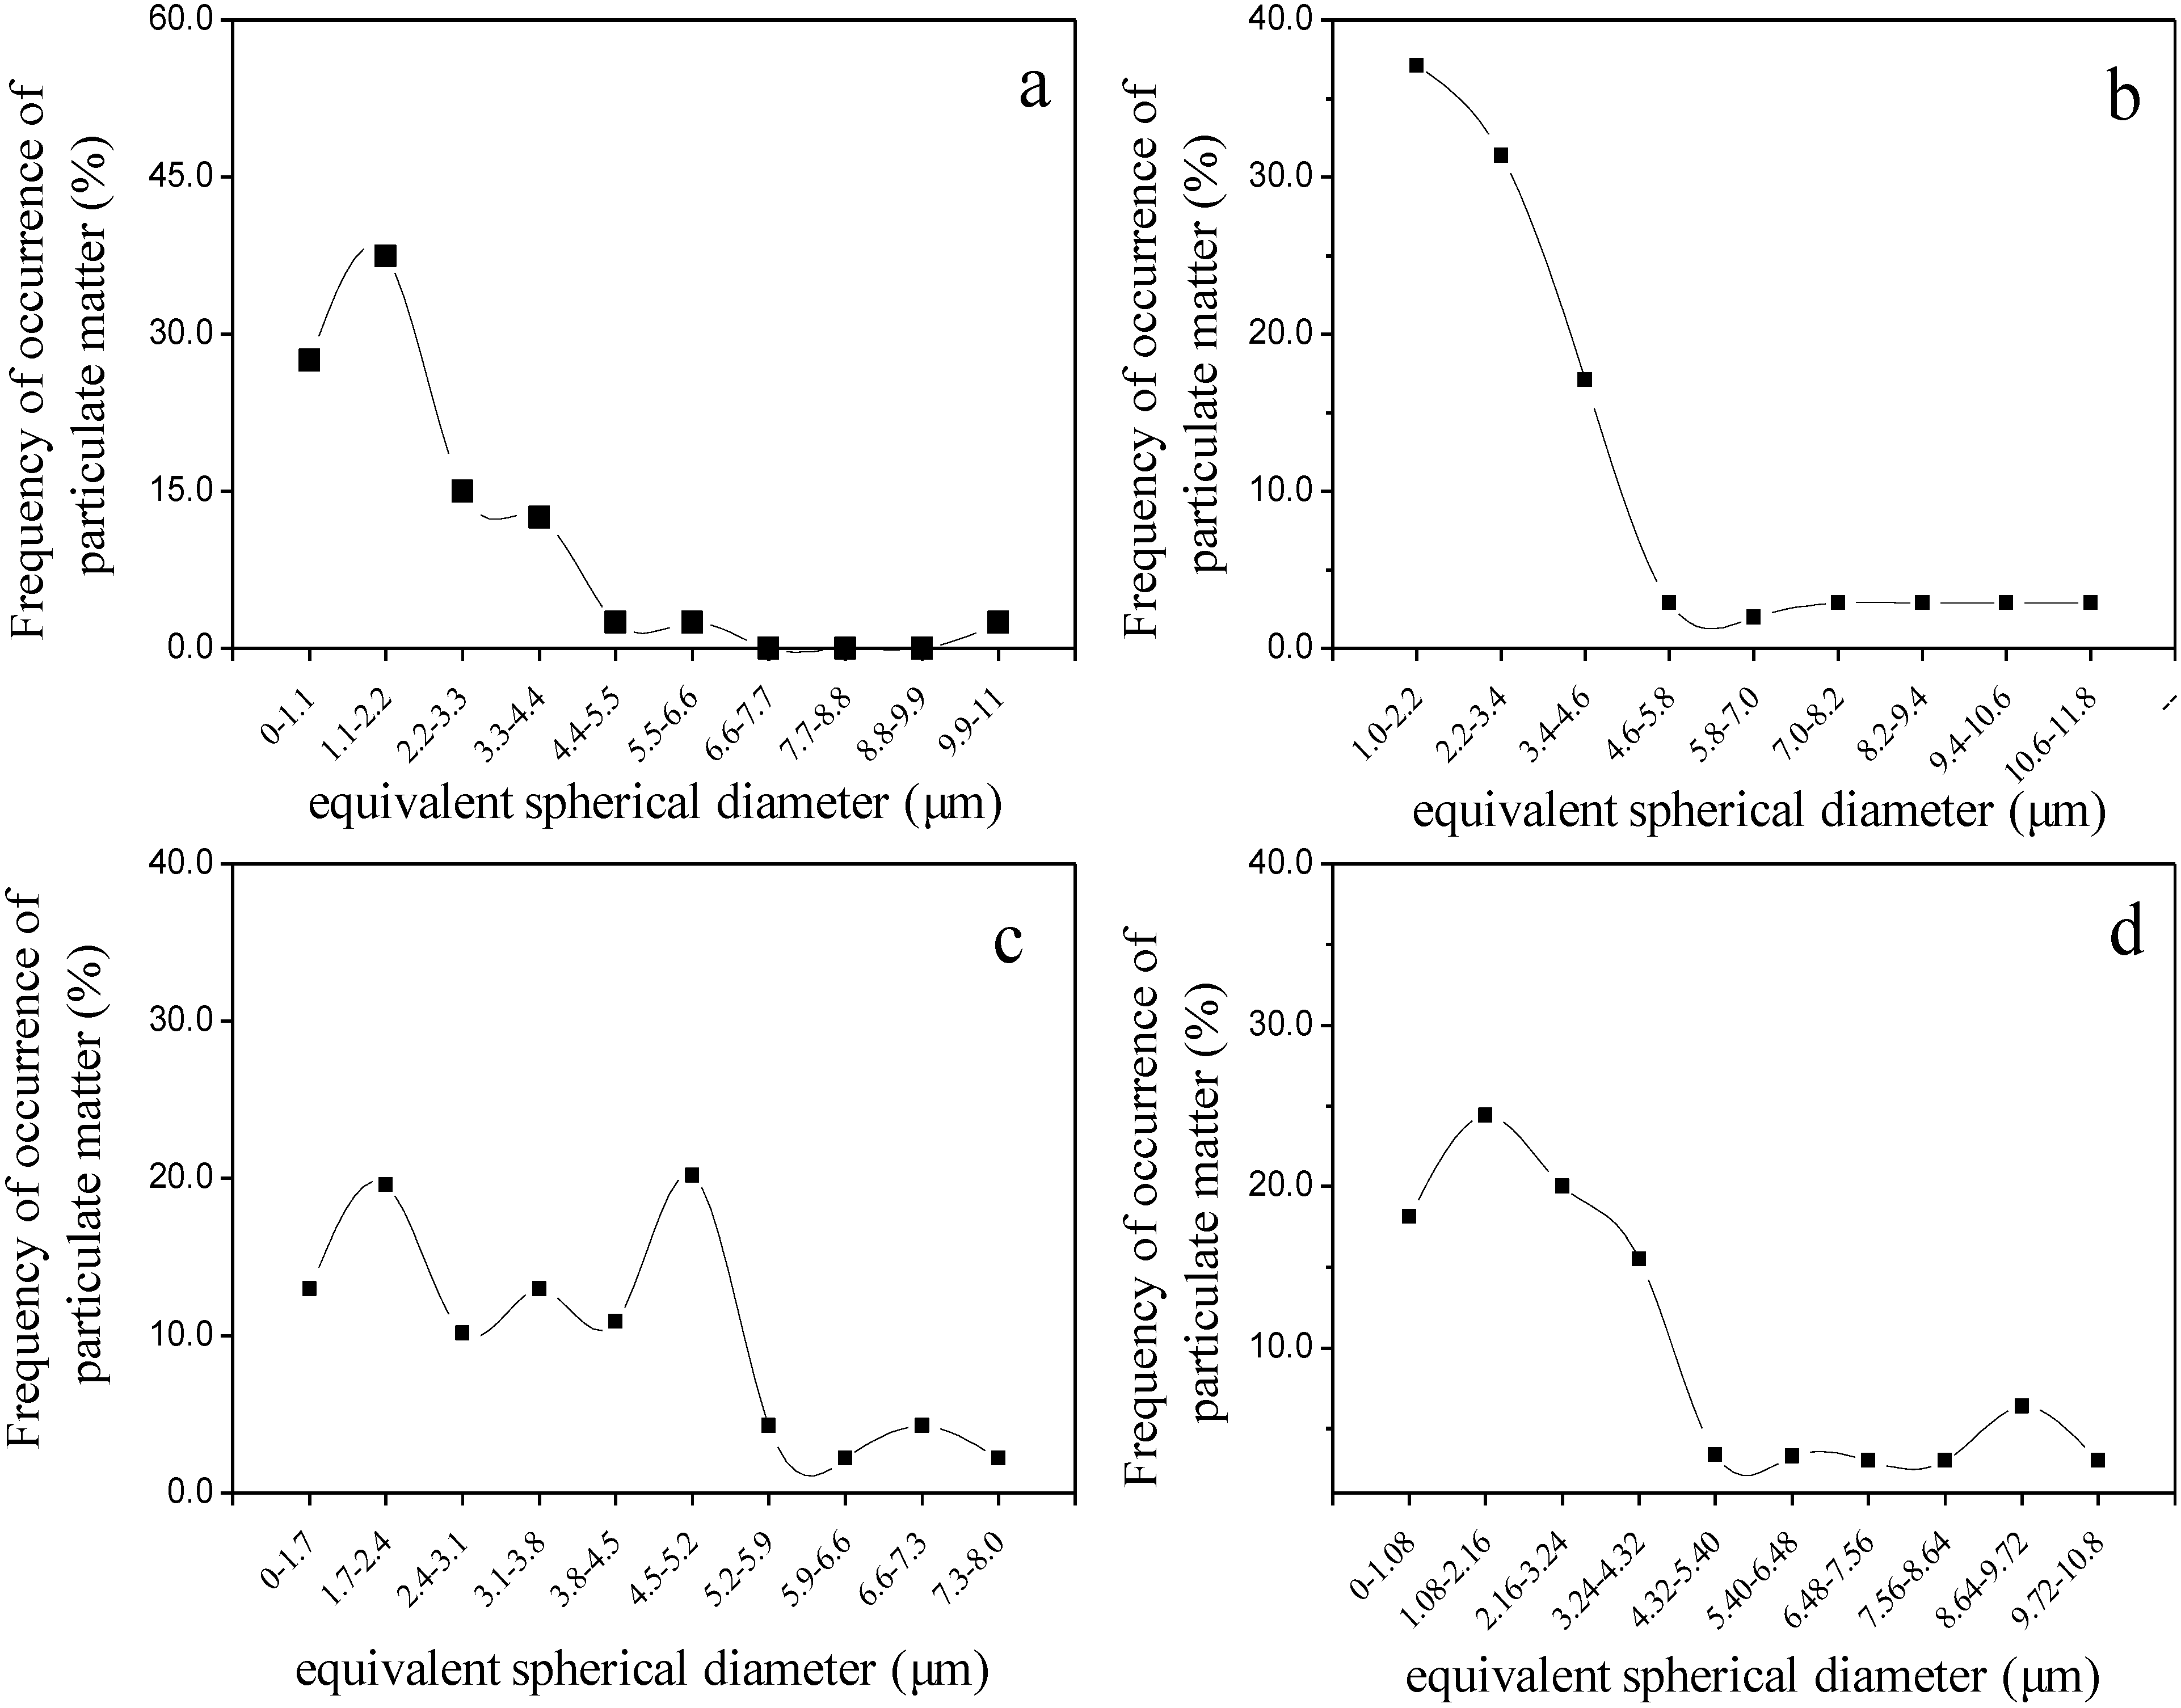
Figure 3.
Equivalent spherical diameter distribution of atmospheric fine particles in the four different areas at Mount Wutai, Shanxi, China. ((a) Sampling points in the Wu Ye Temple; (b) sampling points in the Manjusri Temple; (c) sampling points in the Yang Bai Lin Village; (d) sampling points in the Nan Shan Temple Forest District).
The main particulate matter at the Wu Ye Temple sampling point had an equivalent spherical diameter of 0–3.30 μm. The particulate numbers in the range of 0–3.30 μm accounted for 80.0% of the particulate numbers of PM
10 at this point, with the peak occurring at 1.10–2.20 μm (
Figure 3a). However, no particulate matter in the range between 7.70 and 9.90 μm was observed. Furthermore, the particulate numbers of PM
2.5 accounted for 65.0% of the PM
10 particulate numbers at this point. The particle size distribution of particulate matter in Manjusri Temple assumed an unimodal pattern (
Figure 3b), with particulate matter mainly within the 0–4.60 μm range and accounted for 85.6% of the total particulate numbers in PM
10 at this point. The peak interval was within 1.08–2.16 μm. Unlike Wu Ye Temple, the number ratio of PM
2.5 to PM
10 was 37.1%. Therefore, the proportion of PM
2.5 that can penetrate into the lungs was smaller than the particulate matter at Wu Ye Temple (65.0%). The particle size distribution of particulate matter at Yang Bai Lin Village assumed a bimodal pattern (
Figure 3c), which was different to the other sampling points, and the individual peak-to-peak interval at this point was within 1.7–2.4 μm and 4.5–5.2 μm Furthermore, the particulate matter was mainly distributed within the range of 0–5.90 μm. The particulate number in the range of 0–5.90 μm accounted for 86.9% of the total particulate numbers of PM
10 at this point. In addition, the number ratio of PM
2.5 to PM
10 was 32.6%. The particle size distribution of particulate matter in Nan Shan Temple Forest District assumed a unimodal pattern, with the particulate matter mainly distributed within the range of 0–4.32 μm, the particulate numbers in this scale accounted for 77.9% of the total PM
10 particulate numbers. The peak occurred within the range of 1.08–2.16 μm (
Figure 3d). The number ratio of PM
2.5 to PM
10 was 42.5% at this sampling point. Nan Shan Temple Forest District is located in a primitive forest district, and previous studies have shown that the plant leaf surfaces have a relatively strong absorptive capacity for fine particles, thus effectively reducing the airborne particulate matter concentration [
14]. However, compared with Manjusri Temple and Yang Bai Lin Village sampling points, the particulate matter concentrations of PM
10 and PM
2.5 in this area were relatively high (
Figure 2). The forest coverage is relatively small or a portion of the primitive forest has been damaged by human activities and may be the main reason for these results.
In conclusion, the number ratios of PM2.5 to PM10 were 65.0%, 37.1%, 32.6% and 42.5% at Wu Ye Temple, Manjusri Temple, Yang Bai Lin Village, and Nan Shan Temple Forest District sampling points. PM2.5 was the main air pollutant in Wu Ye Temple (core incense and candle burners). The size of particulate matter in Yang Bai Lin Village (a residential district), Manjusri Temple (a traffic hub), and Nan Shan Temple Forest District (located in a primitive forest district) were mainly distributed between 2.5 and 10 μm.
3.3. Single-Particle Morphology and Elemental Analysis of PM10 in the Four Different Areas at Mount Wutai, Shanxi, China
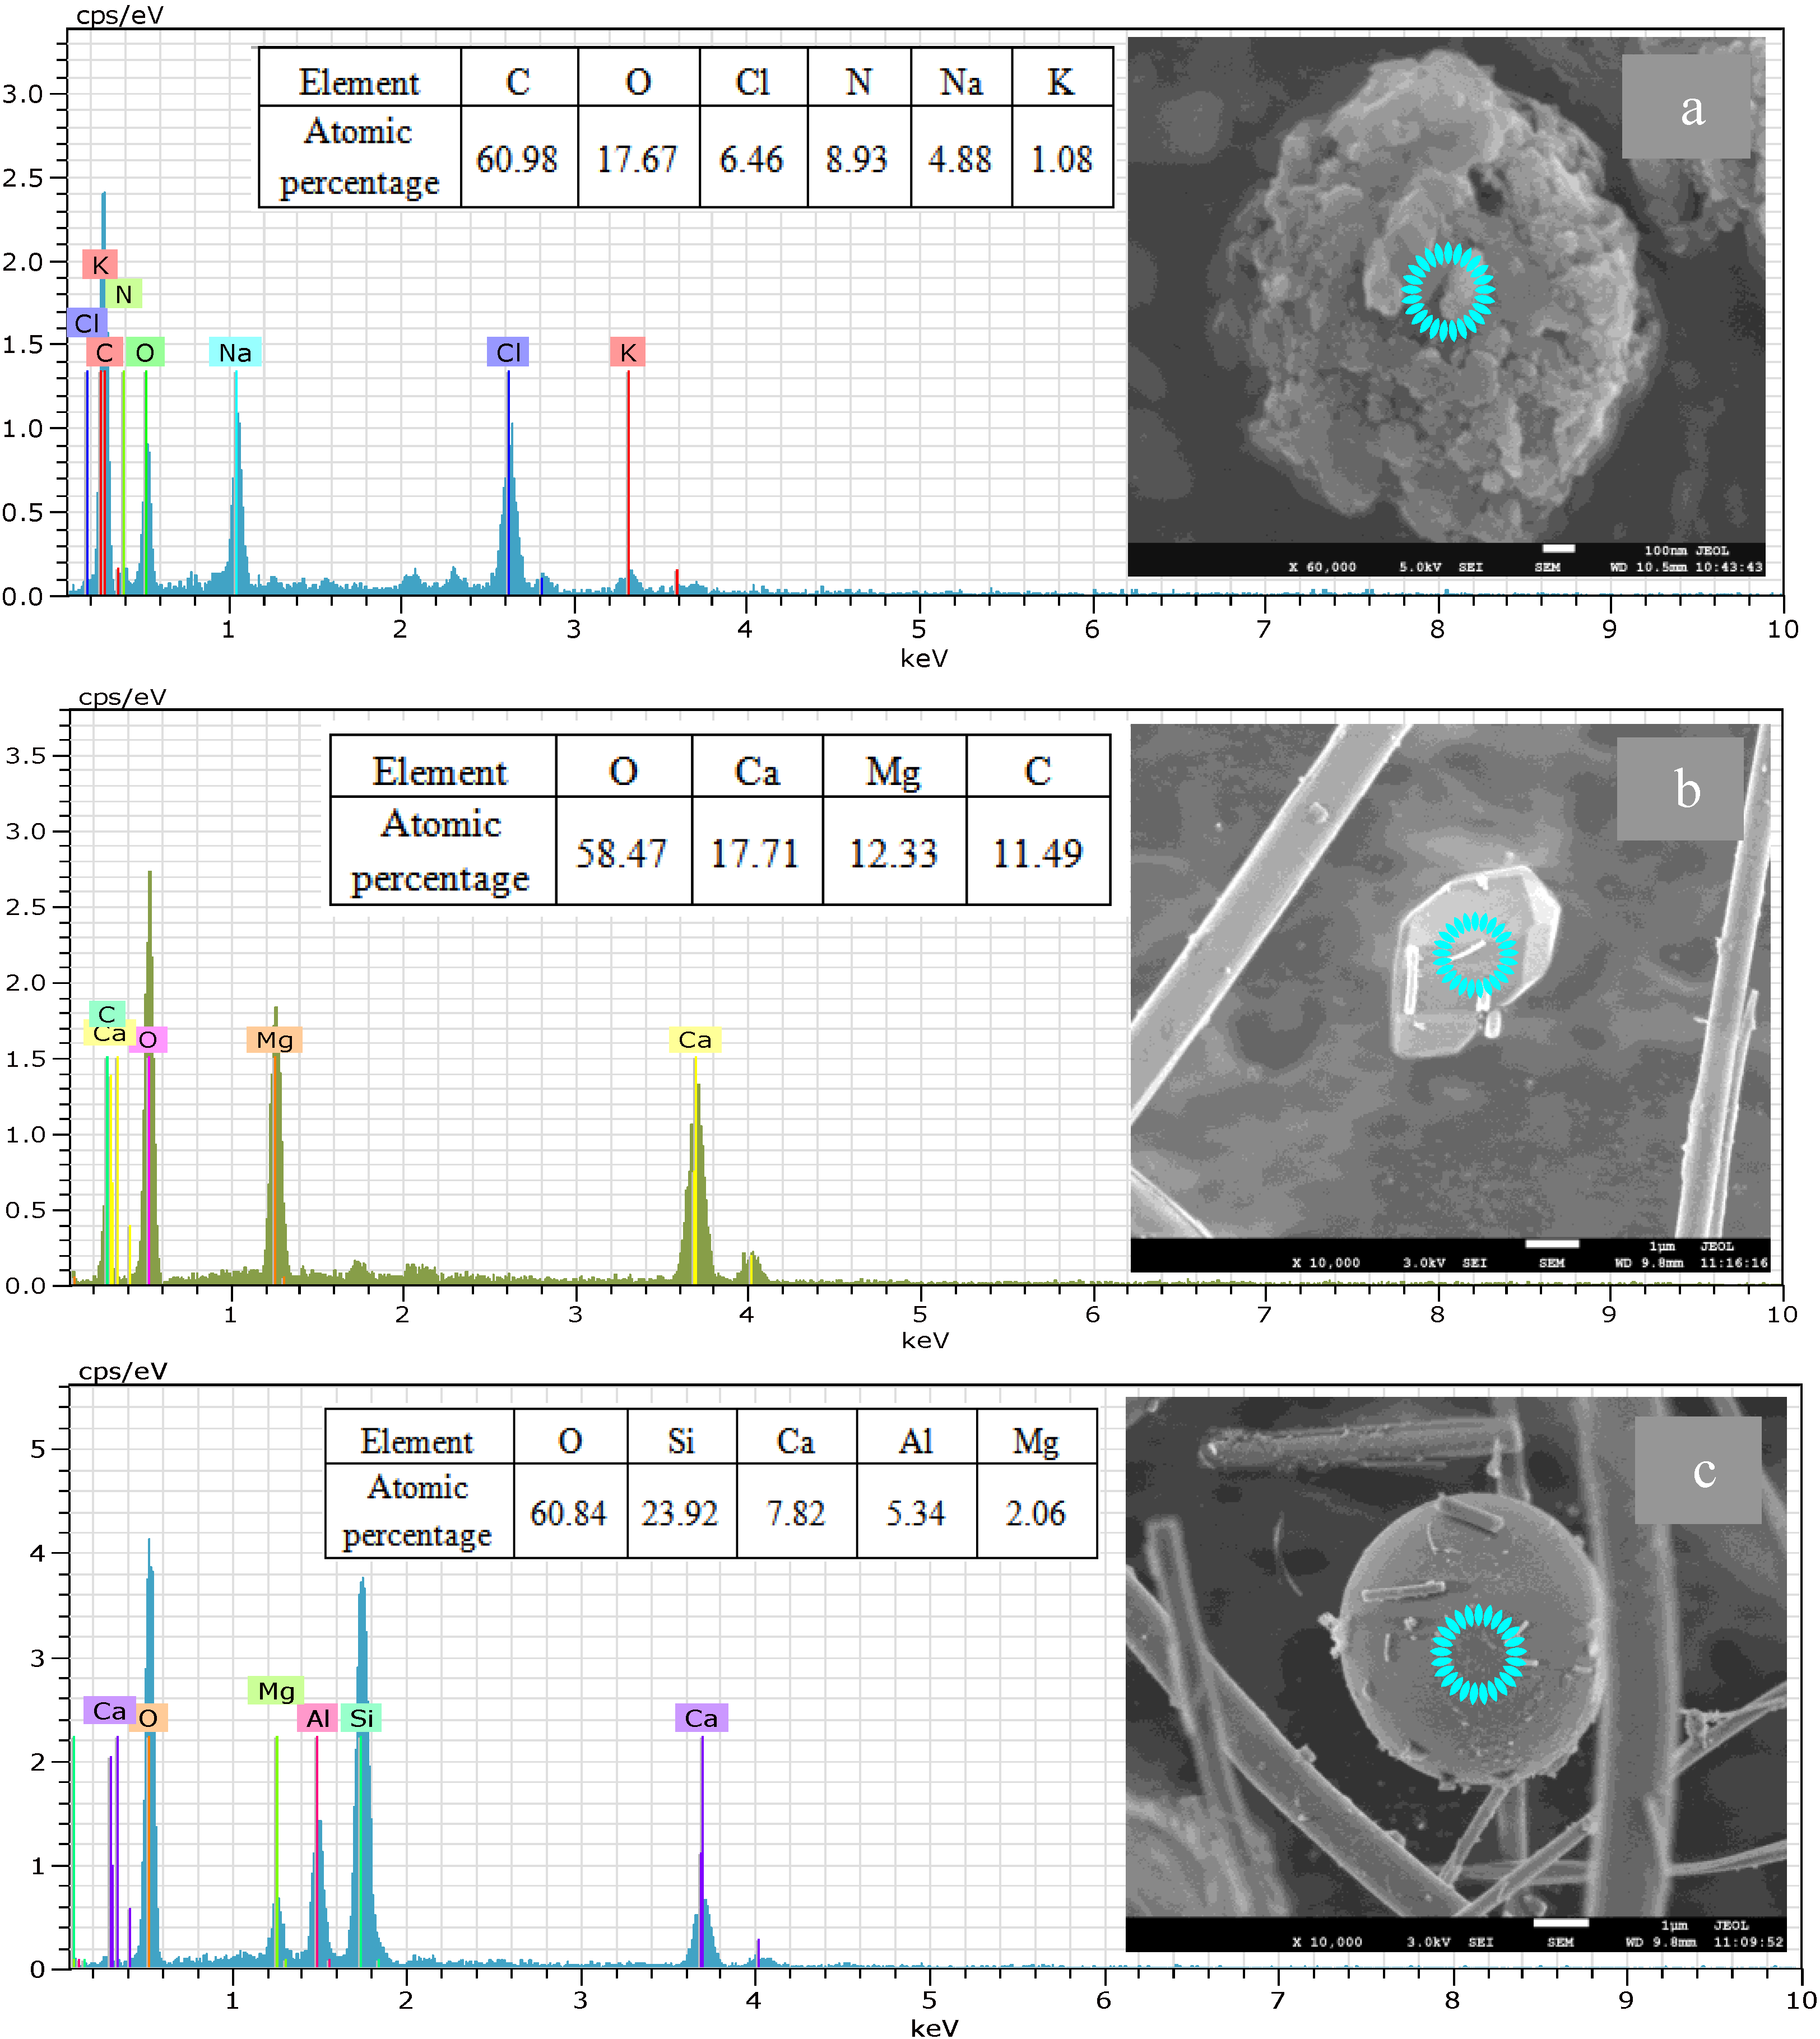
On the basis of field-emission scanning electron microscopy and energy dispersive X-ray spectroscopy (EDS) results of the collected samples (
Figure 4 and
Figure 5), the single-particle morphology of PM
10 was divided into two categories: soot particles and soil dust particles.
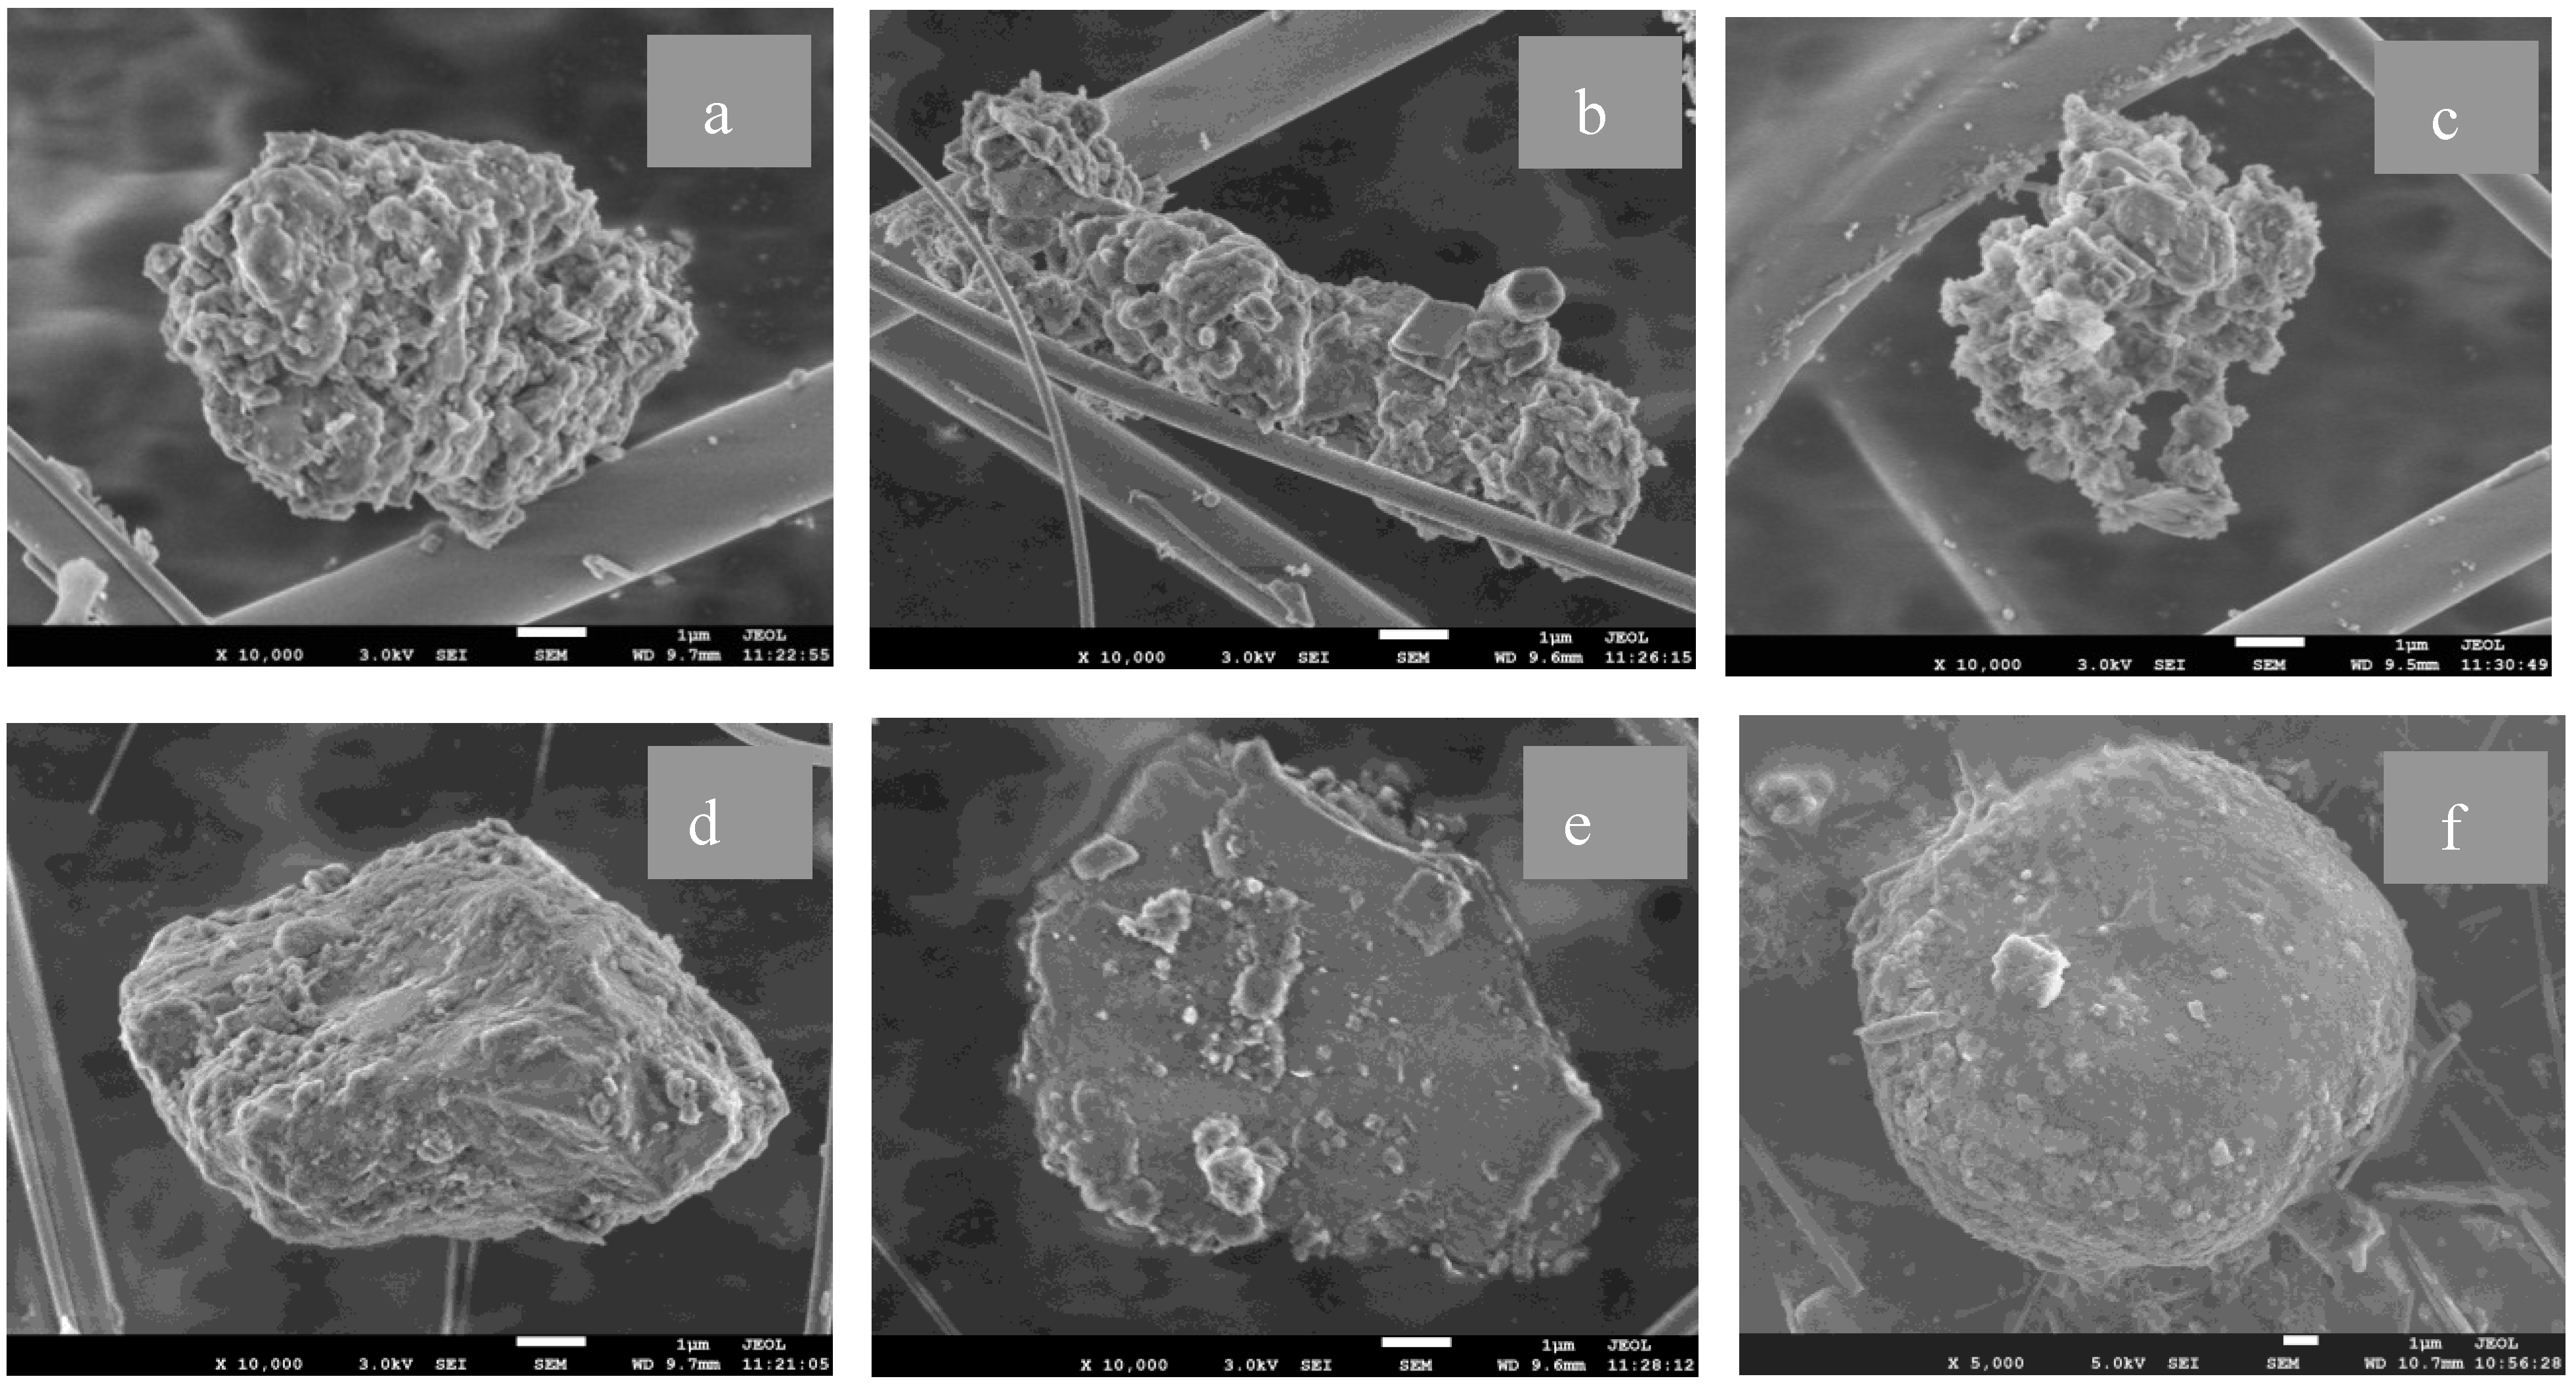
Soot particles are formed by scaly fine particle aggregates, with a bitty appearance, loose structure, and particle size of 5.35–8.36 μm Most of the soot particles appeared near the primary tourist areas of Wu Ye Temple and Yang Bai Lin Village. Soot particles can be roughly divided into three categories on the basis of morphology: near-spherical (
Figure 4a), rod-like (
Figure 4b), and flocculent amorphous bodies (
Figure 4c). The SEM-EDS results of particulate matter collected in the area of incense burners in Wu Ye Temple (
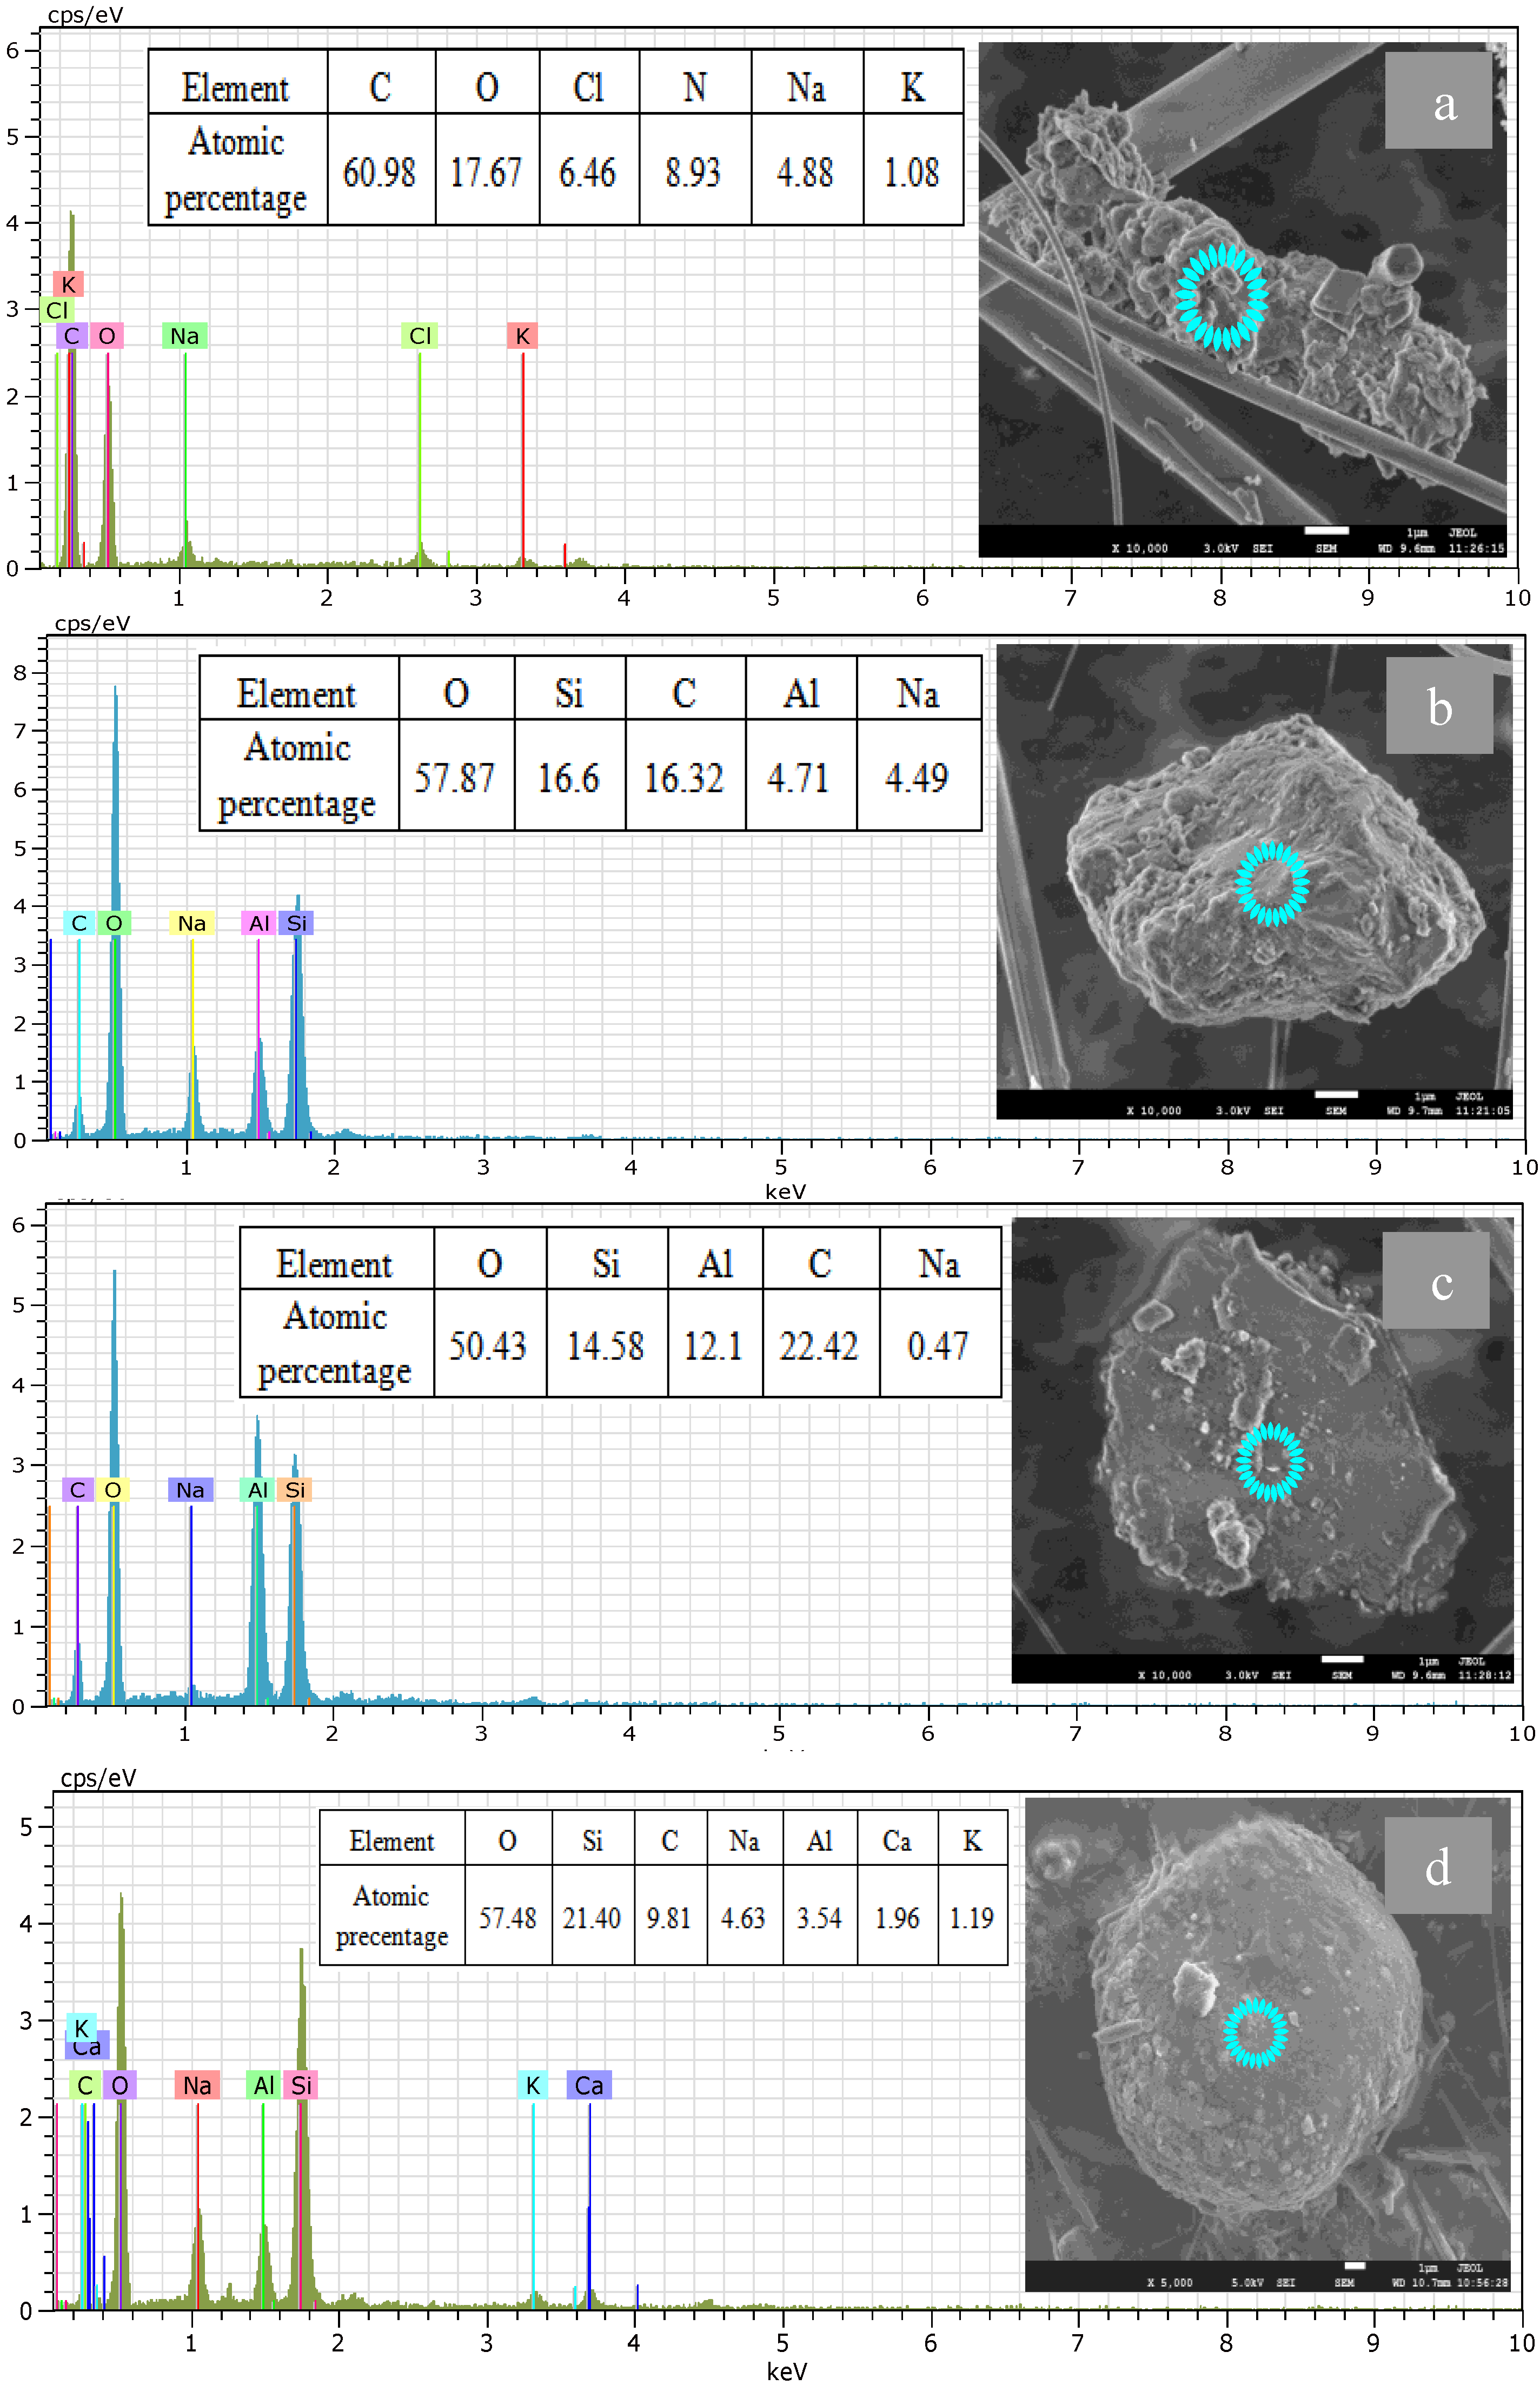
Figure 5a) indicated that the distribution of major elements in such aggregates included C, O, N, Cl, Na, and K of which the atomic percentages were 60.98%, 17.67%, 8.93%, 6.46%, 4.88%, and 1.08%, respectively, with high contents of C, O, and N. The main sources of particulate matter were anthropogenic combustion. This phenomenon was described by Carrico
et al. [
15], who found that an increase in the particle size of soot aerosol particulate matter from biomass burning was mostly dependent upon its hygroscopic growth. The large number of soot particle aggregates distributed at the Mount Wutai scenic spot was closely associated with high rainfall and humidity during the summer. The surfaces of most soil dust particles have impurities. Thus, dust particles are not single-mineral particulate matter and had a relatively high frequency of occurrence in the samples collected in Manjusri Temple and from Yang Bai Lin Village. The SEM-EDS results in
Figure 5b,c show that the distribution of the major elements in ellipsoidal particles collected from Manjusri Temple (
Figure 4d) and Yang Bai Lin Village (
Figure 4e) sampling points, which included O, Si, Ca, Al, and Na with atomic percentages of 57.87%, 16.60%, 16.32%, 4.71%, and 4.49% (
Figure 5b), and of 50.43%, 14.58%, 12.10%, 22.42%, and 0.47% (
Figure 5c), respectively. Particulate matter containing aluminosilicate minerals was likely formed during secondary atmospheric reactions. This result was verified previously by Dada
et al. [
16]. Another type of ellipsoidal particle (
Figure 4f) was found in the Nan Shan Temple Forest District sampling point, and its surface had a slight depression and greater clastic particle adhesion.
Figure 4.
Scanning electron microscopy (SEM) images of atmospheric particles in PM10 at Wutai Mount scenic spot ((a) in the Wu Ye Temple sampling point; (b) in the Wu Ye Temple sampling point; (c) in the Yang Bai Lin Village sampling point; (d) in the Manjusri Temple sampling point; (e) in the Yang Bai Lin Village sampling point; (f) in the Nan Shan Temple Forest District sampling point).
Figure 5.
Element analysis of atmospheric particles in PM10 at Wutai Mount scenic spot ((a) in the Wu Ye Temple sampling point; (b) in the Manjusri Temple sampling point; (c) in the Yang Bai Lin Village sampling point; (d) in the Nan Shan Temple Forest District sampling point).
Figure 5.
Element analysis of atmospheric particles in PM10 at Wutai Mount scenic spot ((a) in the Wu Ye Temple sampling point; (b) in the Manjusri Temple sampling point; (c) in the Yang Bai Lin Village sampling point; (d) in the Nan Shan Temple Forest District sampling point).
On the basis of the distribution of the major elements in particulate matter, the atomic percentages of O, Si, C, Na, Al, Ca, and K were 54.78%, 21.40%, 9.81%, 4.63%, 3.54%, 1.96%, and 1.19%, respectively; among these elements, O and Si were the major components (
Figure 5d). It is concluded that soot aggregates are found in Wu Ye Temple and Yang Bai Lin Village, and soil particles are found in Manjusri Temple, Yang Bai Lin Village, and Nan Shan Temple Forest District.
3.4. Single-Particle Morphology and Elemental Analysis of PM2.5 in the Four Different Areas at Mount Wutai, Shanxi, China
Similar to PM
10, the single-particle morphologies of PM
2.5 were also divided into two categories: soot particles and soil dust particles.
Figure 6 and
Figure 7 show the single-particle morphology and elemental analysis of PM
2.5 in the four different areas at Mount Wutai. The shape of PM
2.5 was roughly divided into the following three types: ultrafine soot particles, soil dust particles, and spherical soot particles. Soot particles of PM
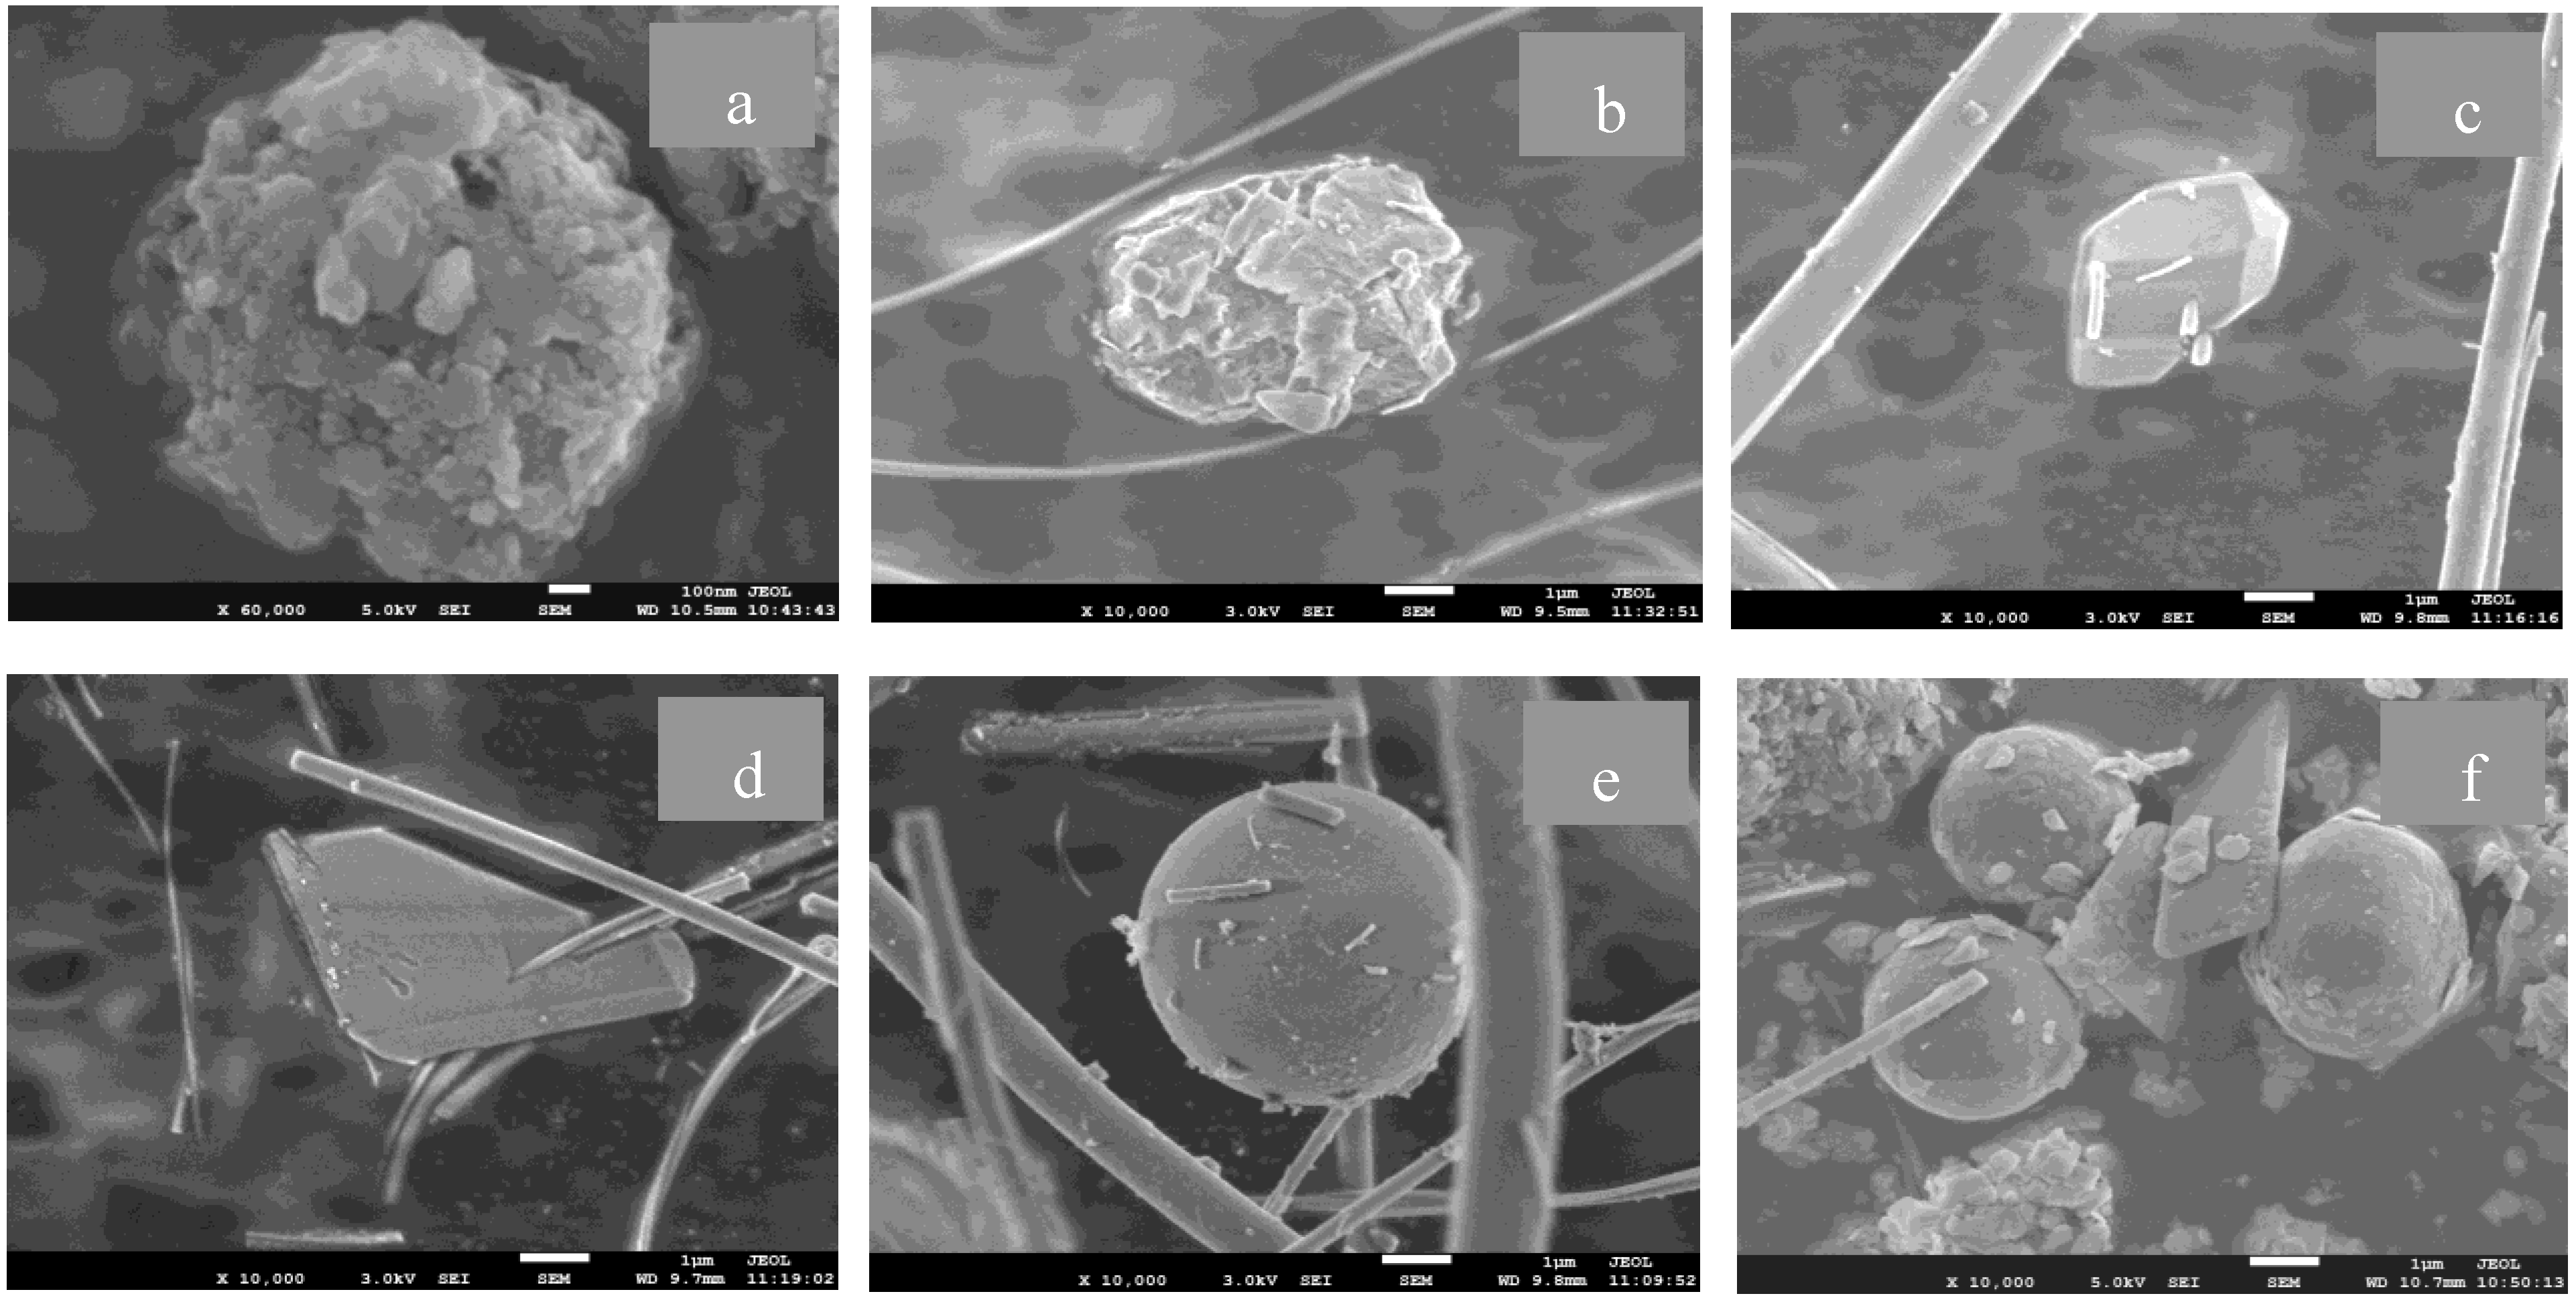
2.5 collected at Wu Ye Temple and Yang Bai Lin Village were characterized by scaly aggregates with a particle size distribution of 0.06–2.37 μm (
Figure 6a,b). The elemental composition of these particles included C, O, N, Cl, Na, and K with atomic percentages of 60.98%, 17.67%, 8.93%, 6.46%, 4.88%, and 1.08%, respectively (
Figure 7a). The elemental composition of PM
2.5 was approximately consistent with that of PM
10 (
Figure 5a–c); therefore, PM
2.5 and PM
10 had similar emission sources.
Figure 6.
Scanning electron microscopy (SEM) images of atmospheric particles in PM2.5 at Wutai Mount scenic spot ((a) in the Wu Ye Temple sampling point; (b) in the Yang Bai Lin Village sampling point; (c) in the Manjusri Temple sampling point; (d) in the Nan Shan Temple Forest District sampling point; (e) in the Wu Ye Temple sampling point; (f) in the Yang Bai Lin Village sampling point).
Consistent with the findings of Baumgartner
et al. [
17], black carbon emissions from the area with the incense burners at the Mount Wutai scenic spot, as well as the emissions from six villages in Yunnan and Tibet, are primarily produced by biomass burning.
Soil dust particles of PM
2.5 collected at Manjusri Temple and Nan Shan Temple Forest District were mostly characterized by an irregular morphology with distinct edges and corners and a particle size distribution of 0.03–1.49 μm (
Figure 6c,d). Most fine dust debris were from crust-derived minerals and had elemental compositions of O, Ca, Mg, and C with atomic percentages of 58.47%, 17.71%, 12.33%, and 11.49%, respectively (
Figure 7b). The debris is presumed to be the mineral particulate matter of dolomite (CaMg(CO
3)
2) [
18] or magnesite (MgCO
3). [
19] reporting on in-site observations in Hengshan, China, confirmed that gritty dust with a particle size of 15–50 µm easily becomes the core of dust under light conditions, thus allowing photochemical isomerization with moisture and dust in the atmosphere, promoting the formation of new composite particles, and providing the carrier for the long-distance transport of pollutants. Reducing soil dust particles is important for the reduction of atmospheric particulate matter.
Figure 7.
Element analysis of atmospheric particles in PM2.5 at Wutai Mount scenic spot ((a) in the Wu Ye Temple sampling point; (b) in the Manjusri Temple sampling point; (c) in the Wu Ye Temple sampling point).
Figure 7.
Element analysis of atmospheric particles in PM2.5 at Wutai Mount scenic spot ((a) in the Wu Ye Temple sampling point; (b) in the Manjusri Temple sampling point; (c) in the Wu Ye Temple sampling point).
However, with the exception of scaly aggregates mentioned above, spherical particles with a smooth surface collected at Wu Ye Temple and Yang Bai Lin Village were another type of soot particle at these sampling points. SEM images combined with micrograph analysis method (Image-Pro Plus 6.0) showed that the average roundness of such particulate matter was 0.37 ± 0.30 μm, and that the particle size distribution was 2.99–5.04 μm. EDS revealed that the distribution of major elements in the particulate matter included O, Si, Ca, Al, and Mg, with atomic percentages of 60.84%, 23.92%, 7.82%, 5.34%, and 2.06%, respectively (
Figure 7c). Shi
et al. [
20] found that the particulate matter in the emissions from coal and other high-temperature combustion sources included spherical particulate matter with a smooth surface and a spherical particulate matter with the surface covered with particles. The particulate matter had the same morphology as that of fly ash particles determined by Geng
et al. [
21] in Tokchok Island, South Korea, during the summer; an 80% similarity in the distribution of the major elements was found in this study and the current research. Considering the actual situation at the scenic spot, it is concluded that the particulate matter in the scenic spot was mainly sourced from the secondary atmospheric reactions of the emission from biomass burning, such as the fire coal or candles used in catering the primary tourist area.
In conclusion, the main single-particulate morphology of airborne particulate matter at Mount Wutai scenic spot included soot particles and soil dust mineral particles. Huang
et al. [
22] found that the main emission sources of soot particles are fossil fuel and biomass burning. Reducing the emission of such particulate matter can effectively reduce the concentration of secondary organic aerosol precursors and help avoid the occurrence of haze.
This research, which is consistent with other published literature, suggest implementing pollution control measures in the different functional areas of the Mount Wutai Buddhism Scenic Spot. For Wu Ye temple area, the incense and candles burning furnace should be covered by a smoke collector, in which the strong black smoke can be treated efficiency through absorption and precipitation devices. For Yang Bai Lin Village residential area, the natural gas, electromagnetic or solar energy types should be advocate use to replace coal as the main energy resource for heating and catering. For Manjusri Temple transport hub area, the green belt should be set at the both sides of the road. In addition, the water sprinkler working times and road cleaning should be increased. The vehicles numbers should be restricted in this area. The electric energy or other clean fuel should be employed for vehicles running. For Nanshan Temple next to the primeval forest area, it is should facilitate afforestation as more as possible. Some broad-leaved plants should be cultivated because the broad-leaved plants can intercept the dust produced from bare land and in further reduce the concentration of particulate matter in the atmosphere in this area.
It is noted that in the process of this research, we focused on the elements kinds and contents in the typical particulate matters, but not the total particulate matters, in the different sampling points. In order to identify potential local origin or long-range transport of the elements, the enrichment factor (EF) of the elements in total particulate matter in different survey areas will be the focus of our further research.
4. Conclusions
Characteristics of PM10 with an aerodynamic equivalent diameter less than 10 μm and PM2.5 with an aerodynamic equivalent diameter less than 2.5 μm in four different areas, including Wu Ye Temple (core incense burners), Manjusri Temple (a traffic hub), Yang Bai Lin Village (a residential district), and Nan Shan Temple (located in a primitive forest district), were determined at Mount Wutai, Shanxi, China, a Buddhist scenic spot. To the best of our knowledge, this study is the first to present the characteristics of PM10 and PM2.5 in a Buddhist scenic spot. It was found that the daily average concentrations of PM10 and PM2.5 were 17.40–161.45 μg/m3 and 1.43–59.20 μg/m3, respectively. The number ratio of PM2.5 to PM10 was 65.0% at the Wu Ye Temple sampling point, and was 37.1%–42.5% at the other three sampling points. The particulates in Wu Ye Temple were mainly characterized by spherical, rod-like, and irregular soot aggregates (PM10) and spherical particles of dust (PM2.5). Manjusri Temple and Yang Bai Lin Village predominantly exhibited irregular soil mineral particulate matter (PM10), and amorphous ultrafine soot particulate matter (PM2.5). It is concluded that soot particles with high content of C, O, and N in PM10 or with high content of O, Si, and Ca in PM2.5, and soil dust particles with high content of O, Si, Ca, and Mg elements in PM10 and PM2.5 are present at Mount Wutai. The findings in this study have great significance in developing measures to control atmospheric pollution at Mount Wutai scenic spot.


