Article

Study of Black Sand Particles from Sand Dunes in Badr, Saudi Arabia Using Electron Microscopy

by
Haider Abbas Khwaja
1,2,*,
Omar Siraj Aburizaiza
3,*,
Daniel L. Hershey
4,
Azhar Siddique
3,5,
David A. Guerrieri P. E.
4,
Jahan Zeb
3,
Mohammad Abbass
6,
Donald R. Blake
7,
Mirza Mozammel Hussain
1,2,
Abdullah Jameel Aburiziza
8,
Malissa A. Kramer
4 and
Isobel J. Simpson
7
1
Wadsworth Center, New York State Department of Health, Albany, New York, NY 12201, USA
2
Department of Environmental Health Sciences, School of Public Health, University at Albany, Albany, New York, NY 12201, USA
3
Unit for AinZubaida and Groundwater Research, King Abdulaziz University, Jeddah 21589, Saudi Arabia
4
New York State Department of Environmental Conservation, 625 Broadway, Albany, New York, NY 12233, USA
5
Chemistry Department, University of Karachi, Karachi 75270, Pakistan
6
Civil Engineering Department, King Abdulaziz University, Jeddah 21589, Saudi Arabia
7
Department of Chemistry, University of California-Irvine, Irvine, CA 92697, USA
8
School of Medicine, Umm Ul Qura University, Mecca 21955, Saudi Arabia
*
Authors to whom correspondence should be addressed.
Atmosphere 2015, 6(8), 1175-1194; https://doi.org/10.3390/atmos6081175
Submission received: 28 February 2015 / Revised: 30 June 2015 / Accepted: 7 July 2015 / Published: 17 August 2015
(This article belongs to the Special Issue Atmospheric Composition Observations)

Abstract

:
Particulate air pollution is a health concern. This study determines the microscopic make-up of different varieties of sand particles collected at a sand dune site in Badr, Saudi Arabia in 2012. Three categories of sand were studied: black sand, white sand, and volcanic sand. The study used multiple high resolution electron microscopies to study the morphologies, emission source types, size, and elemental composition of the particles, and to evaluate the presence of surface “coatings or contaminants” deposited or transported by the black sand particles. White sand was comprised of natural coarse particles linked to wind-blown releases from crustal surfaces, weathering of igneous/metamorphic rock sources, and volcanic activities. Black sand particles exhibited different morphologies and microstructures (surface roughness) compared with the white sand and volcanic sand. Morphological Scanning Electron Microscopy (SEM) and Laser Scanning Microscopy (LSM) analyses revealed that the black sand contained fine and ultrafine particles (50 to 500 nm ranges) and was strongly magnetic, indicating the mineral magnetite or elemental iron. Aqueous extracts of black sands were acidic (pH = 5.0). Fe, C, O, Ti, Si, V, and S dominated the composition of black sand. Results suggest that carbon and other contaminant fine particles were produced by fossil-fuel combustion and industrial emissions in heavily industrialized areas of Haifa and Yanbu, and transported as cloud condensation nuclei to Douf Mountain. The suite of techniques used in this study has yielded an in-depth characterization of sand particles. Such information will be needed in future environmental, toxicological, epidemiological, and source apportionment studies.

1. Introduction

Particulate air pollution significantly impacts public health in both developed and developing countries. Major sources of particulate matter (PM) include large industries, such as power plants, petrochemical plants, cement plants, vehicular traffic, windblown dust, crustal erosion, volcanic eruptions, wildfires, sea spray, and combustion processes [1]. Amongst all of these, combustion is the main source for pollutant emissions. PM varies in composition, origin, and size, ranging from submicron (sub-μm), 1–30 μm, and up to 50 μm or more. Large particles (>10 μm) have a relatively low residence time in the air and tend to settle quickly through gravitational subsidence. Fine particles with aerodynamic diameters less than 2.5 μm (PM2.5) and “coarse” particles with aerodynamic diameters less than 10 μm (PM10) remain airborne for a longer period of time. Ultrafine particles are particulate matter of nanoscale size (less than 100 nm in diameter). Fine particles in the 0.05–2 μm range can travel distances up to approximately 1000 km [2].
Exposure to PM has been associated with numerous effects on human health, including increased morbidity and mortality, respiratory problems, cardiovascular diseases, lung cancer, renal and brain damage, and human metal poisonings [3,4,5,6]. Both fine and coarse particles are readily inhaled into the human respiratory tract. It is suggested that fine particles are more strongly implicated in cardiovascular effects than coarse particles, while both impact respiratory end points [7]. In epidemiological studies, positive correlations have been established between elevated levels of inhaled airborne PM, especially PM2.5, and acute adverse health effects [8,9,10]. Aside from the amount of PM inhaled, particle-related parameters, such as size, composition, and solubility have also been linked to health effects in toxicology studies. Size affects the site deposition in the human respiratory tract and the consequent degree of toxicity that may result. Therefore, ultrafine particles are more toxic than coarse particles and are linked to pulmonary diseases in human and animals [11,12,13,14]. Particle sizes also reveal the origin and the formation of airborne particles: larger sized particles are of crustal origin whereas fine particles originate from combustion processes or gas-to-particle conversion in the atmosphere [15].
Particulate air pollution is a health concern among the residents of Badr, Saudi Arabia. Deposition of black sand particles has recently become common on Douf Mountain (Figure 1), located to the west of Badr. The soil surrounding Medina consists mostly of basalt, while the hills to the southeast and northeast are volcanic sand that dates to the Paleozoic era. The geology of Badr is represented by granophyre and alkali-feldspar granite. Dominant lithologies are andesitic and dacitic to rhyolitic tuffs, lavas, and volcanic rocks [16]. The town of Badr, in Medina province (23°47′N 38°47′E; 123 m altitude), is located about 150 km southwest of the holy city of Medina, towards the western outlet of Wadi-e-Safra (Figure 2a). The total area of Badr is 8226 km2 with a population of 61,600. Average annual rainfall is 80 mm. June, July, August, and September are the hottest months in Badr with an average temperature of 40 °C, while the coldest are January and February at 14 °C. Historically, Badr was a market, situated on the road which connects Sham (Syria, Lebanon and Palestine now) with Mecca (Figure 2b).
Figure 1. (a) Photograph of black sand on Douf Mountain, Badr, Saudi Arabia; (b) Photograph of black sand collected from Douf Mountain on February 2012.
Atmosphere 06 01175 g001
Figure 2. (a) Map of Saudi Arabia; (b) Map of western Saudi Arabia showing location of sampling site, Badr.
Atmosphere 06 01175 g002
Despite concerns about the health and environmental significance of the black sand particles, not much is known about the size, morphology, and specific chemical constituents of these sand particles. It is generally known that certain chemical forms are more toxic than others: in general, soluble forms are potentially more toxic than those tied up as insoluble oxides or forming glassy structures [17]. Knowledge of the morphology and chemical characterization of sand particles can aid in control strategies and help to interpret and predict chemical interactions in the atmosphere, downwind fallout rates, potential damage to vegetation, deterioration of materials and structures, and, in particular, impact on human health. Among microanalytical techniques for characterizing black sand particles, Scanning Electron Microscopy with an attached Energy Dispersive X-ray Spectrometer (SEM/EDS) is the most versatile technique, capable of simultaneously obtaining information on particle size, morphology, elemental composition, and microstructure [18,19]. Here the microscopic make-up of different varieties of sand particles collected from a dune near Badr is presented.

2. Experimental

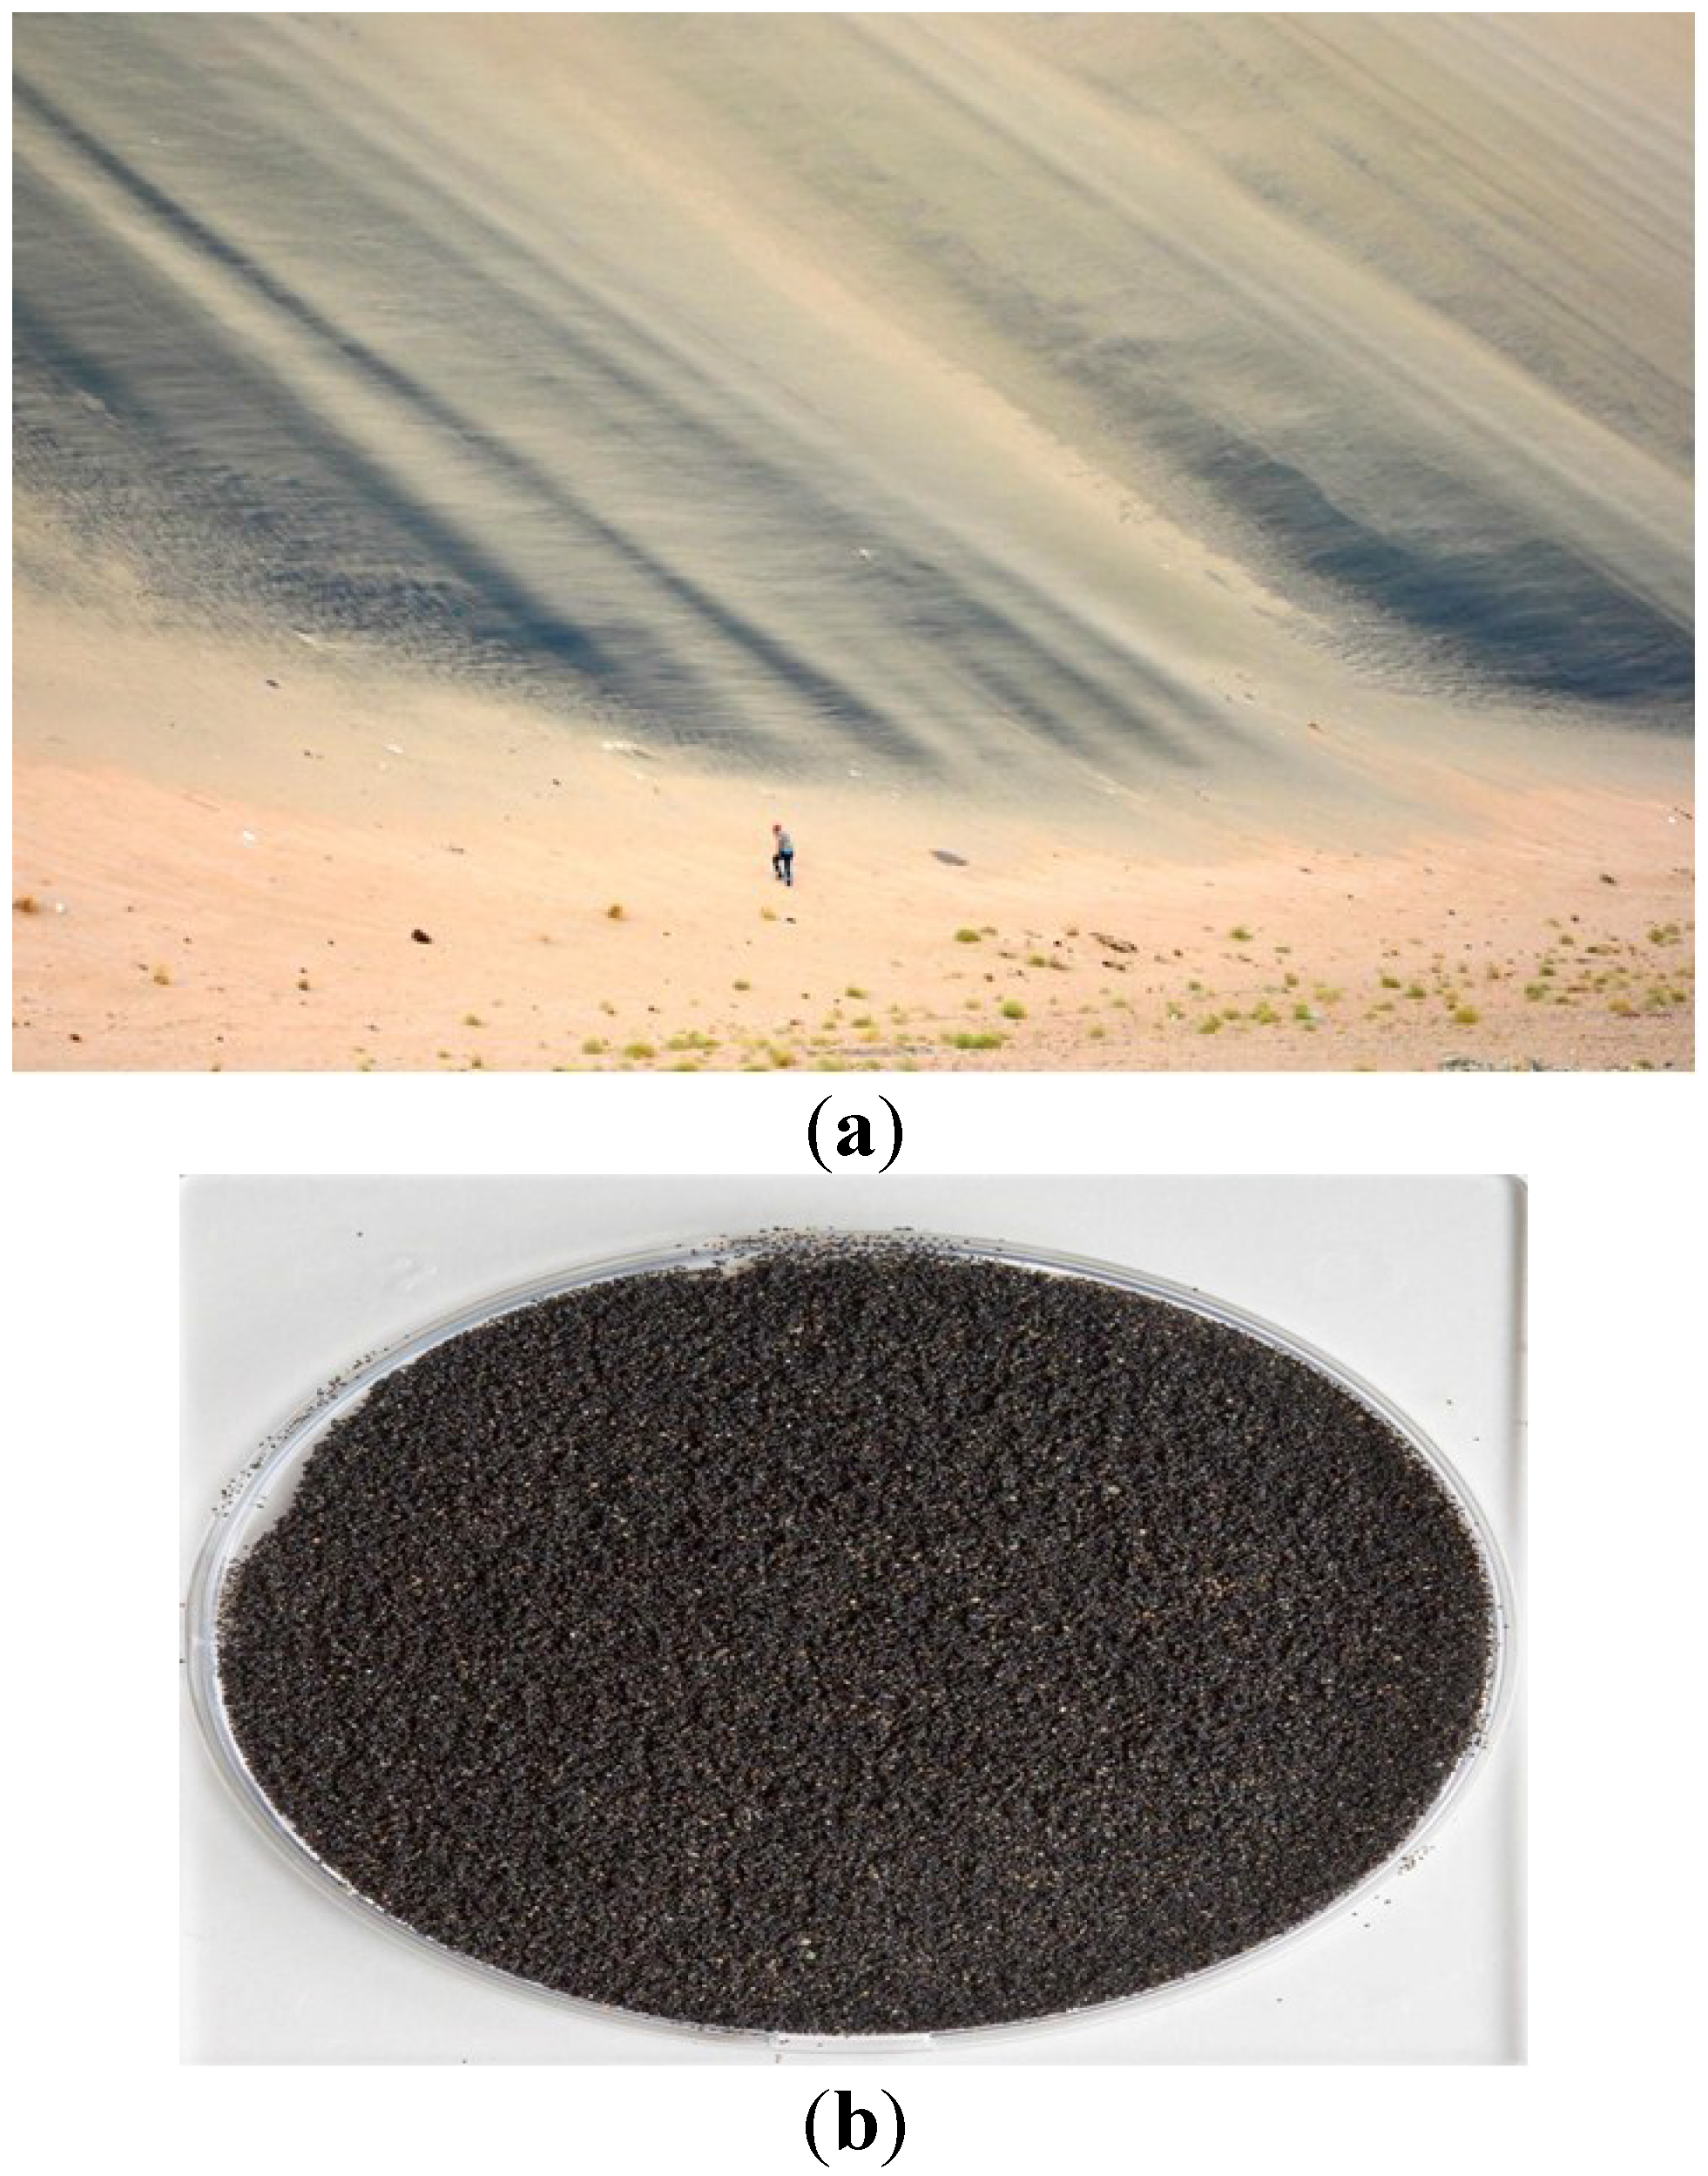
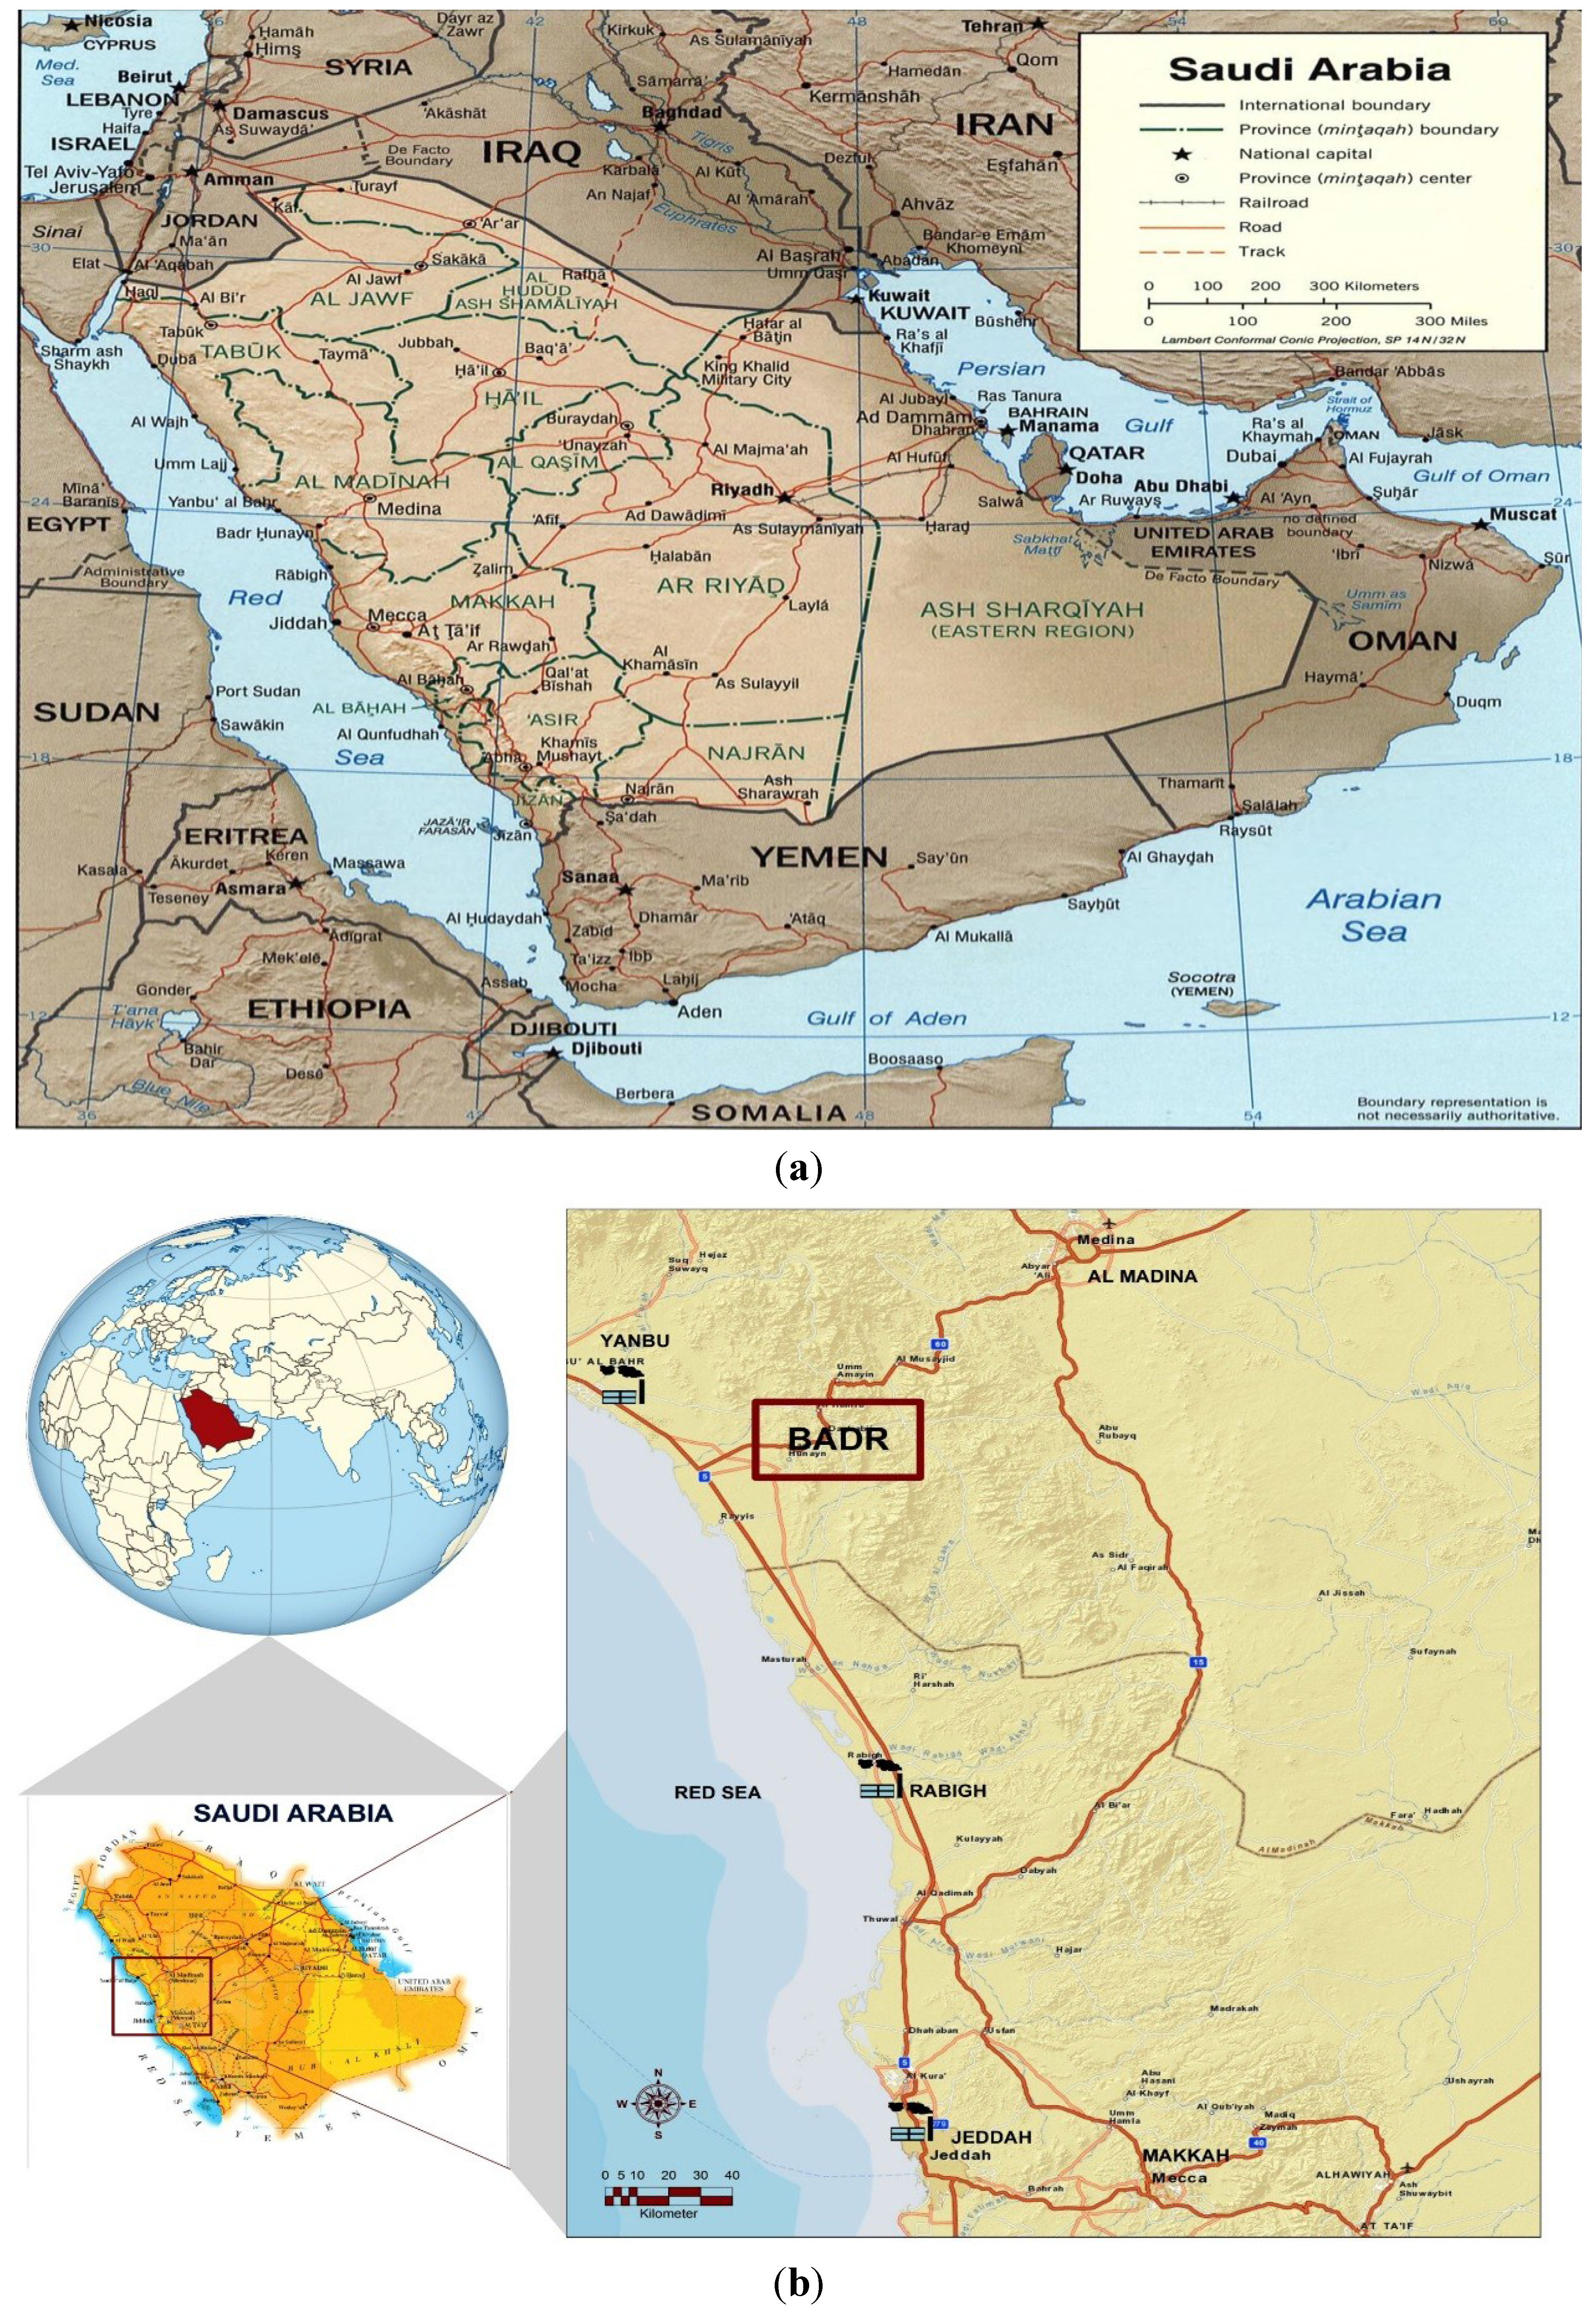
2.1. Sample Collection

Representative random composite sand samples about 4–6 inches thick were collected in 2012 from various locations in the sand dunes (Figure 1b) using hand towels and gloves. The randomly collected samples were composited and thoroughly mixed, and a representative sub-sample was taken for analysis. The sample collected was very black in color, and it was then separated into three groups in the laboratory: magnetic black sand, non-magnetic black sand, and white sand. Of the black sand sampled, there were two distinct types: magnetic and non-magnetic. Solutions of the black sands, immersed in deionized water gave a low pH of 5.0, indicating acidity. A volcanic sand sample was also collected from the area. For this study, the two types of black sand were compared to “normal” white sand and to volcanic sand. Four samples were selected for microscopic examination and morphology, size, and elemental composition were determined. Several hundred individual particles of each type (magnetic black sand, non-magnetic black sand, white sand, and volcanic sand) were viewed for comparison purposes.

2.2. Equipment and Analytical Methodology

Sand particles were characterized at the New York State Department of Environmental Conservation (NYS DEC) microscopy laboratory in Rensselaer NY, using an Olympus SZX12 optical stereo microscope (OSM), SEM/EDS (model JEOL 6490LV SEM equipped with a Sahara EDS), and an Olympus LEXT laser scanning microscope (LSM, model OLS 3100 LSM). This suite of techniques provided images showing morphology of particles, size, elemental composition, and specific source types. The stereo microscope provided a colored representation of the differences in the particles. The SEM provided much more detail at higher magnifications: high resolution of up to 300,000× magnification can be achieved. For this study, 12,000× microscope magnification was used. In addition, elemental composition was determined using an energy dispersive X-ray spectrometer (EDS) attachment to the SEM. An Olympus-LEXT instrument was used to locate, determine, and characterize fine particles adhered to the sand particles. An LSM or confocal scanning microscope (CLSM) was used to create high resolution optical images that show depth, creating a 3-dimensional image of the object being scanned, which can show how the particles are adhered to the particle surface. This technique allows the surface contours to be imaged for profile viewing. The LSM offers better detail on surface morphology and layering of the surface and produces a surface structure in submicron units (minimum resolution of 0.1 μm).
The analysis of the samples was performed by a SEM/EDS to determine particle morphology and elemental composition. Electron microscopic particle identifications were based on visual comparisons to in-house reference standards and to data in McCrone’s Atlas [20]. The EDS system can collect data from X-rays equivalent to the depth of the secondary electron formation. This is dependent on the sample density and keV. The approximate secondary electron collection depth is between 0.5 and 1 micron. For this study, both secondary electron imaging and backscattered electron imaging were used. Operating conditions for the SEM analysis were: accelerating voltage = 15 keV; filament current = 112 μA; working distance = 19 mm; analytical time = 200 s; dead time = varied from sample to sample. The X-ray spectra were generated from specified areas on sand grains placed on aluminum SEM stubs and collected for 90 s with probe current of 50 nA. The weight-percent of the elemental analysis was determined by using ZAF correction factors for each element.
Attached to the JEOL SEM was a Bruker-energy dispersive X-ray spectrometer (EDS; “Spirit” system), that was able to quantify elements with atomic number Z ≥ 6. The EDS detector was controlled by Bruker “Spirit” system. In combination, the two provided detailed particle analysis information. A second EDS system, equipped with TEAM software, owned and operated by EDAX Inc., was used for back up and confirmation purposes. Intensities of the EDS spectrum lines were converted to corresponding weight-percent concentrations based on their excitation energy (Kv). Calibration was referenced to the excitation energy of Al and Cu. Weight-percent concentrations of elements were determined semi-quantitatively using the TEAM software. Forty-one X-ray regions of interest were used to detect the presence of C, O, Na, Mg, Al, Si, P, S, Cl, K, Ca, Ti, V, Cr, Mn, Fe, Co, Ni, Cu, Zn, Ga, As, Se, Br, Sr, Y, Zr, Mo, Pd, Ag, Cd, In, Sn, Sb, Ba, La, Au, Hg, Tl, Pb, and U. An element was considered to be present if its peak counts were at least three times the square root of the background counts in the region of interest. Uncertainty in the reported percentages is within ±3%–5% for each element studied.
Source contributions for individual samples were determined by comparing elemental ratios, morphological identifiers [20] and verified using a variety of microscopy techniques. Most of these techniques include visual observations, comparison to reference standards, comparisons to the source samples, and digital mapping. When setting up the individual source classes, miscellaneous and unidentified particles were placed in the biological/miscellaneous category. Particle size and elemental ratios were determined with the aid of multiple digital maps. The particle size was determined using the Feret diameter. In addition to the above, the identification of questionable particles was compared to reference standards and to McCrone’s Atlas [20]. SEM/EDS elements were calibrated at different energies using computer generated standards, in-house standards, and a copper grid (ASTM) prior to sample analysis.
The Dionex ICS 2500 ion chromatography system used for the determination of anions and cations was configured with an auto sampler, a pump, and a conductivity detector. Anions were eluted from an analytical column (AS14 4 mm × 250 mm) and a guard column (AG14 4 mm) using 3.5 mM Na2CO3/1.0 mM NaHCO3 eluent. Cations were eluted from an analytical column (CS14 4 mm × 250 mm) and a guard column (CG14 4 mm) using 10 mM methylsulfonic acid eluent. For quantification, a linear calibration curve (r > 0.995) was established for each analyte and an independently made quality control sample was analyzed to validate the calibration curve. Sand samples were extracted in water (1 g dry weight/5 mL of water), filtered through a pre-cleaned 0.2 μM PTFE filter, and collected in a scintillation vial.

2.3. Sample Preparation

The sample was placed on a 12.5 mm diameter aluminum stub in order to directly observe the particles in an undisturbed condition. Each sample was affixed to the stub with double-sided carbon tape. To obtain representative elemental composition, and to avoid artificial damage and distortion of particles, the samples were not coated with carbon or gold.

3. Results and Discussion

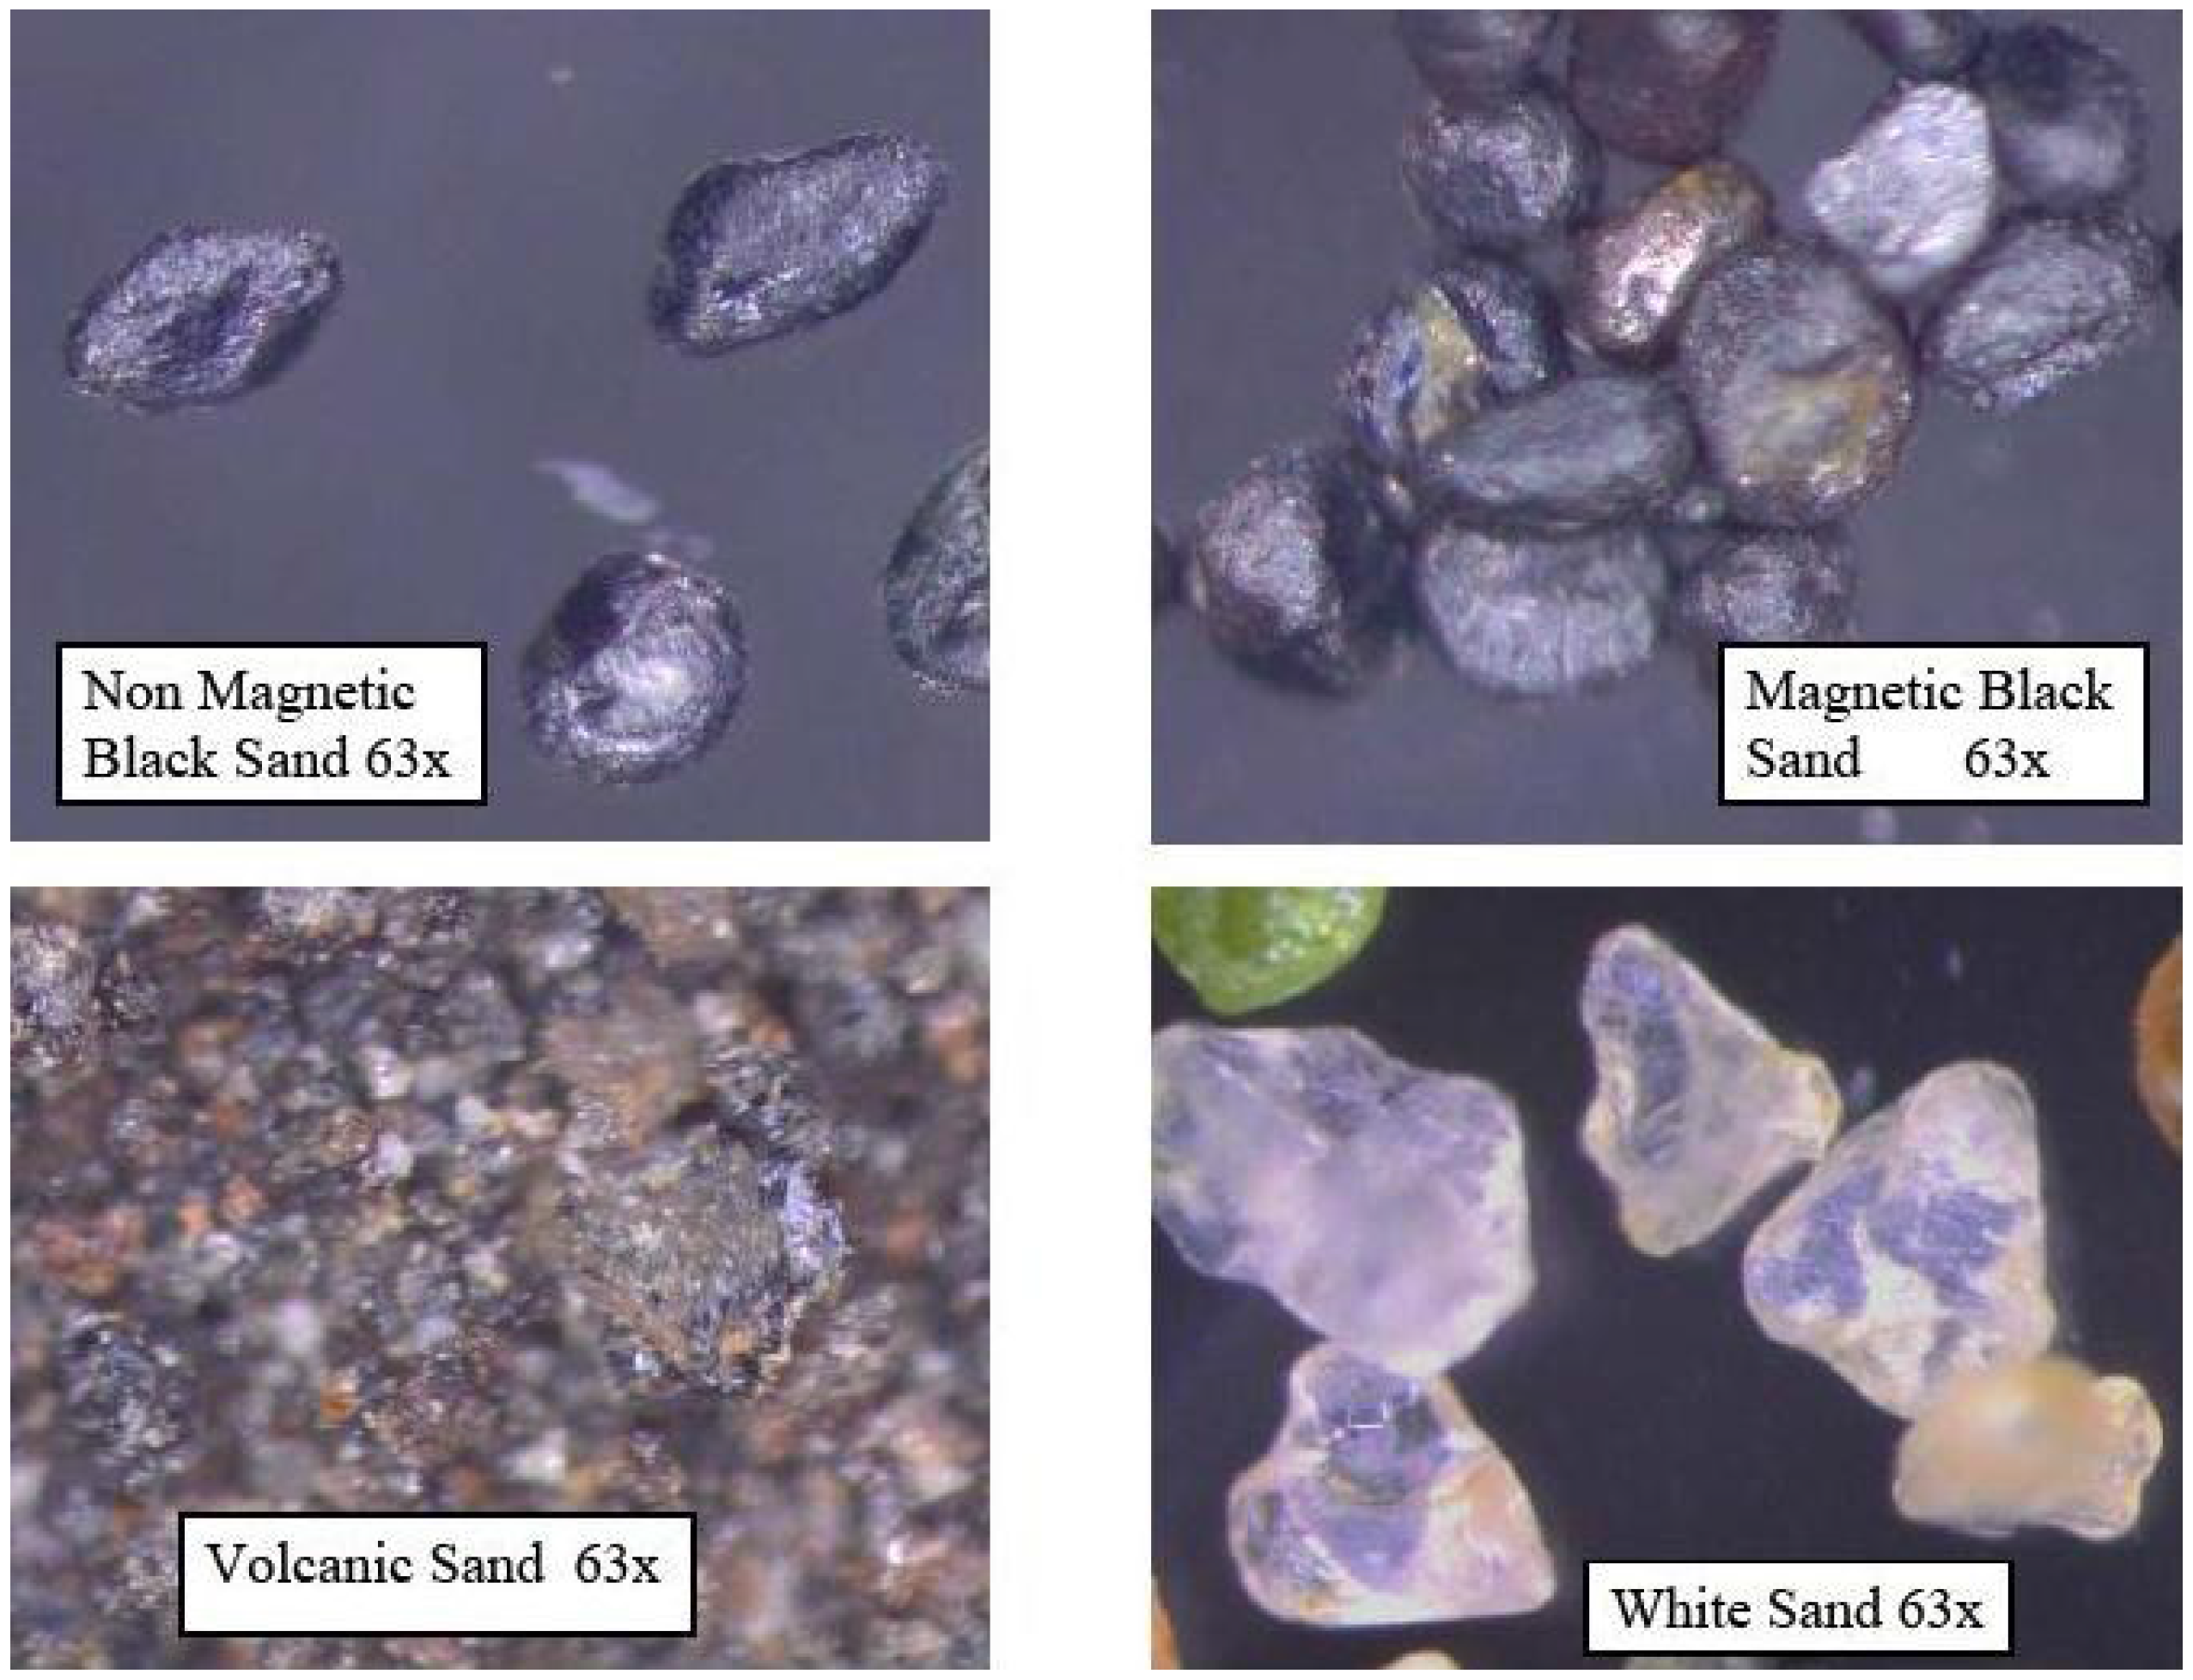
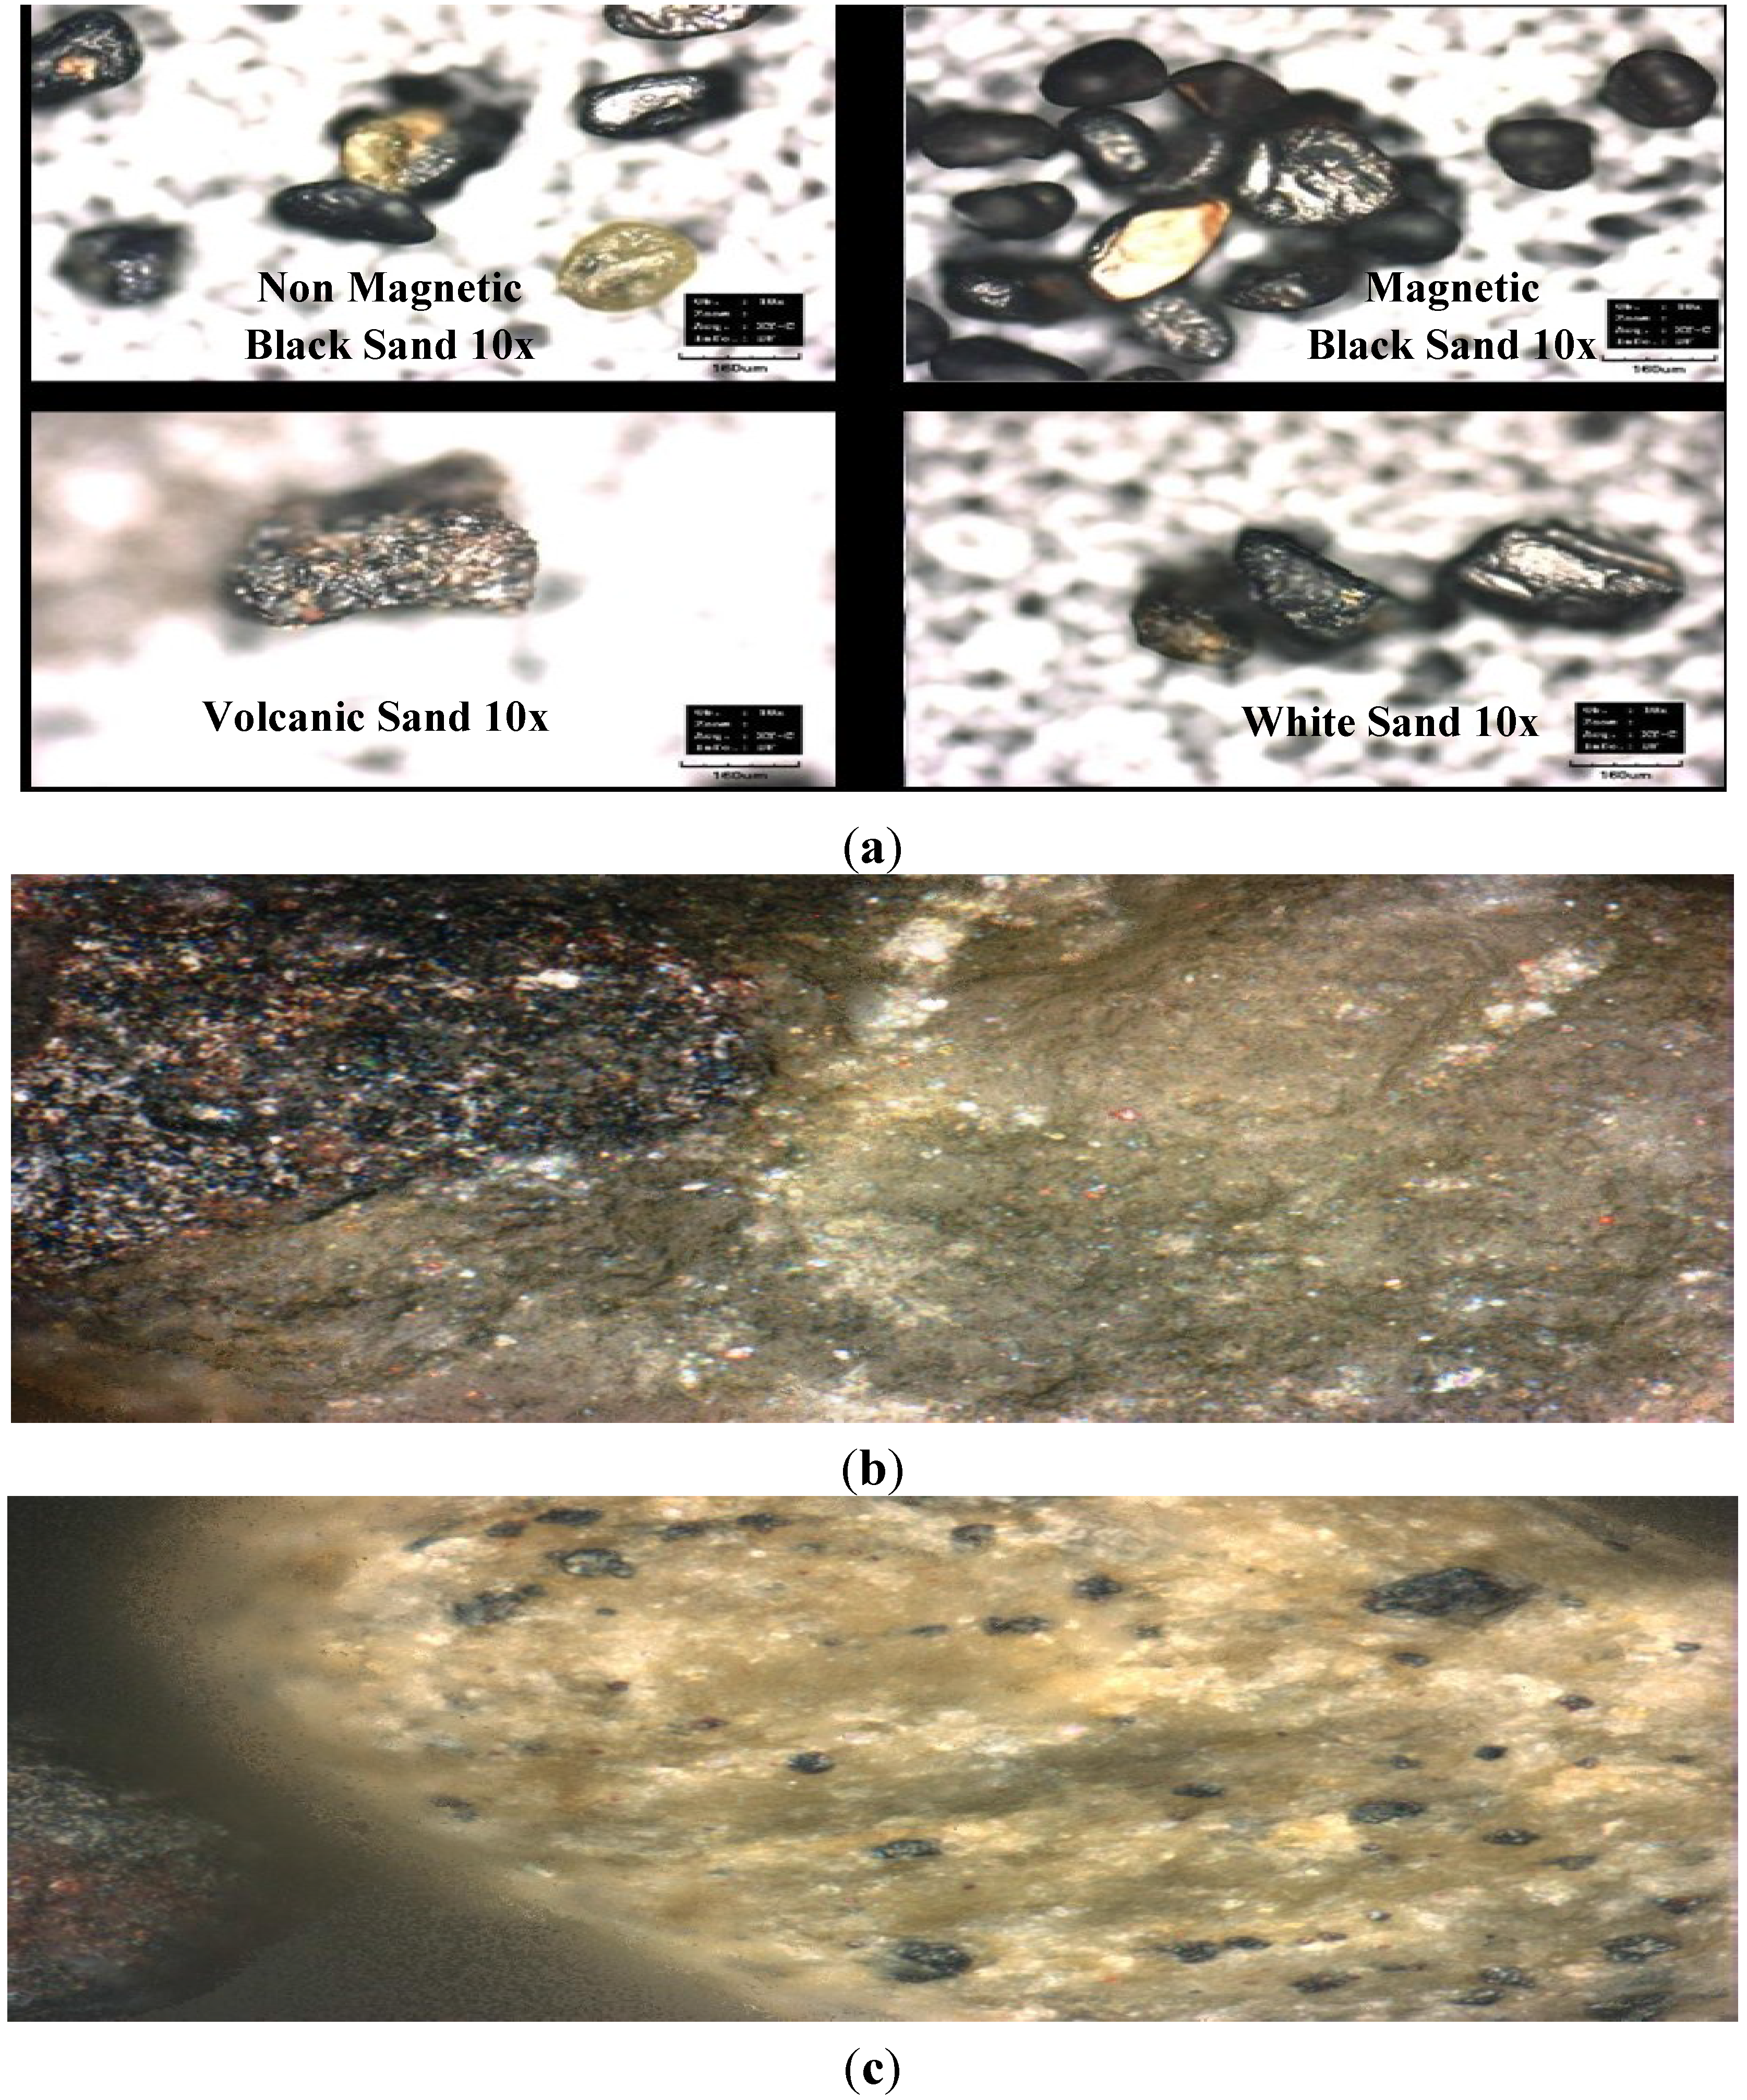
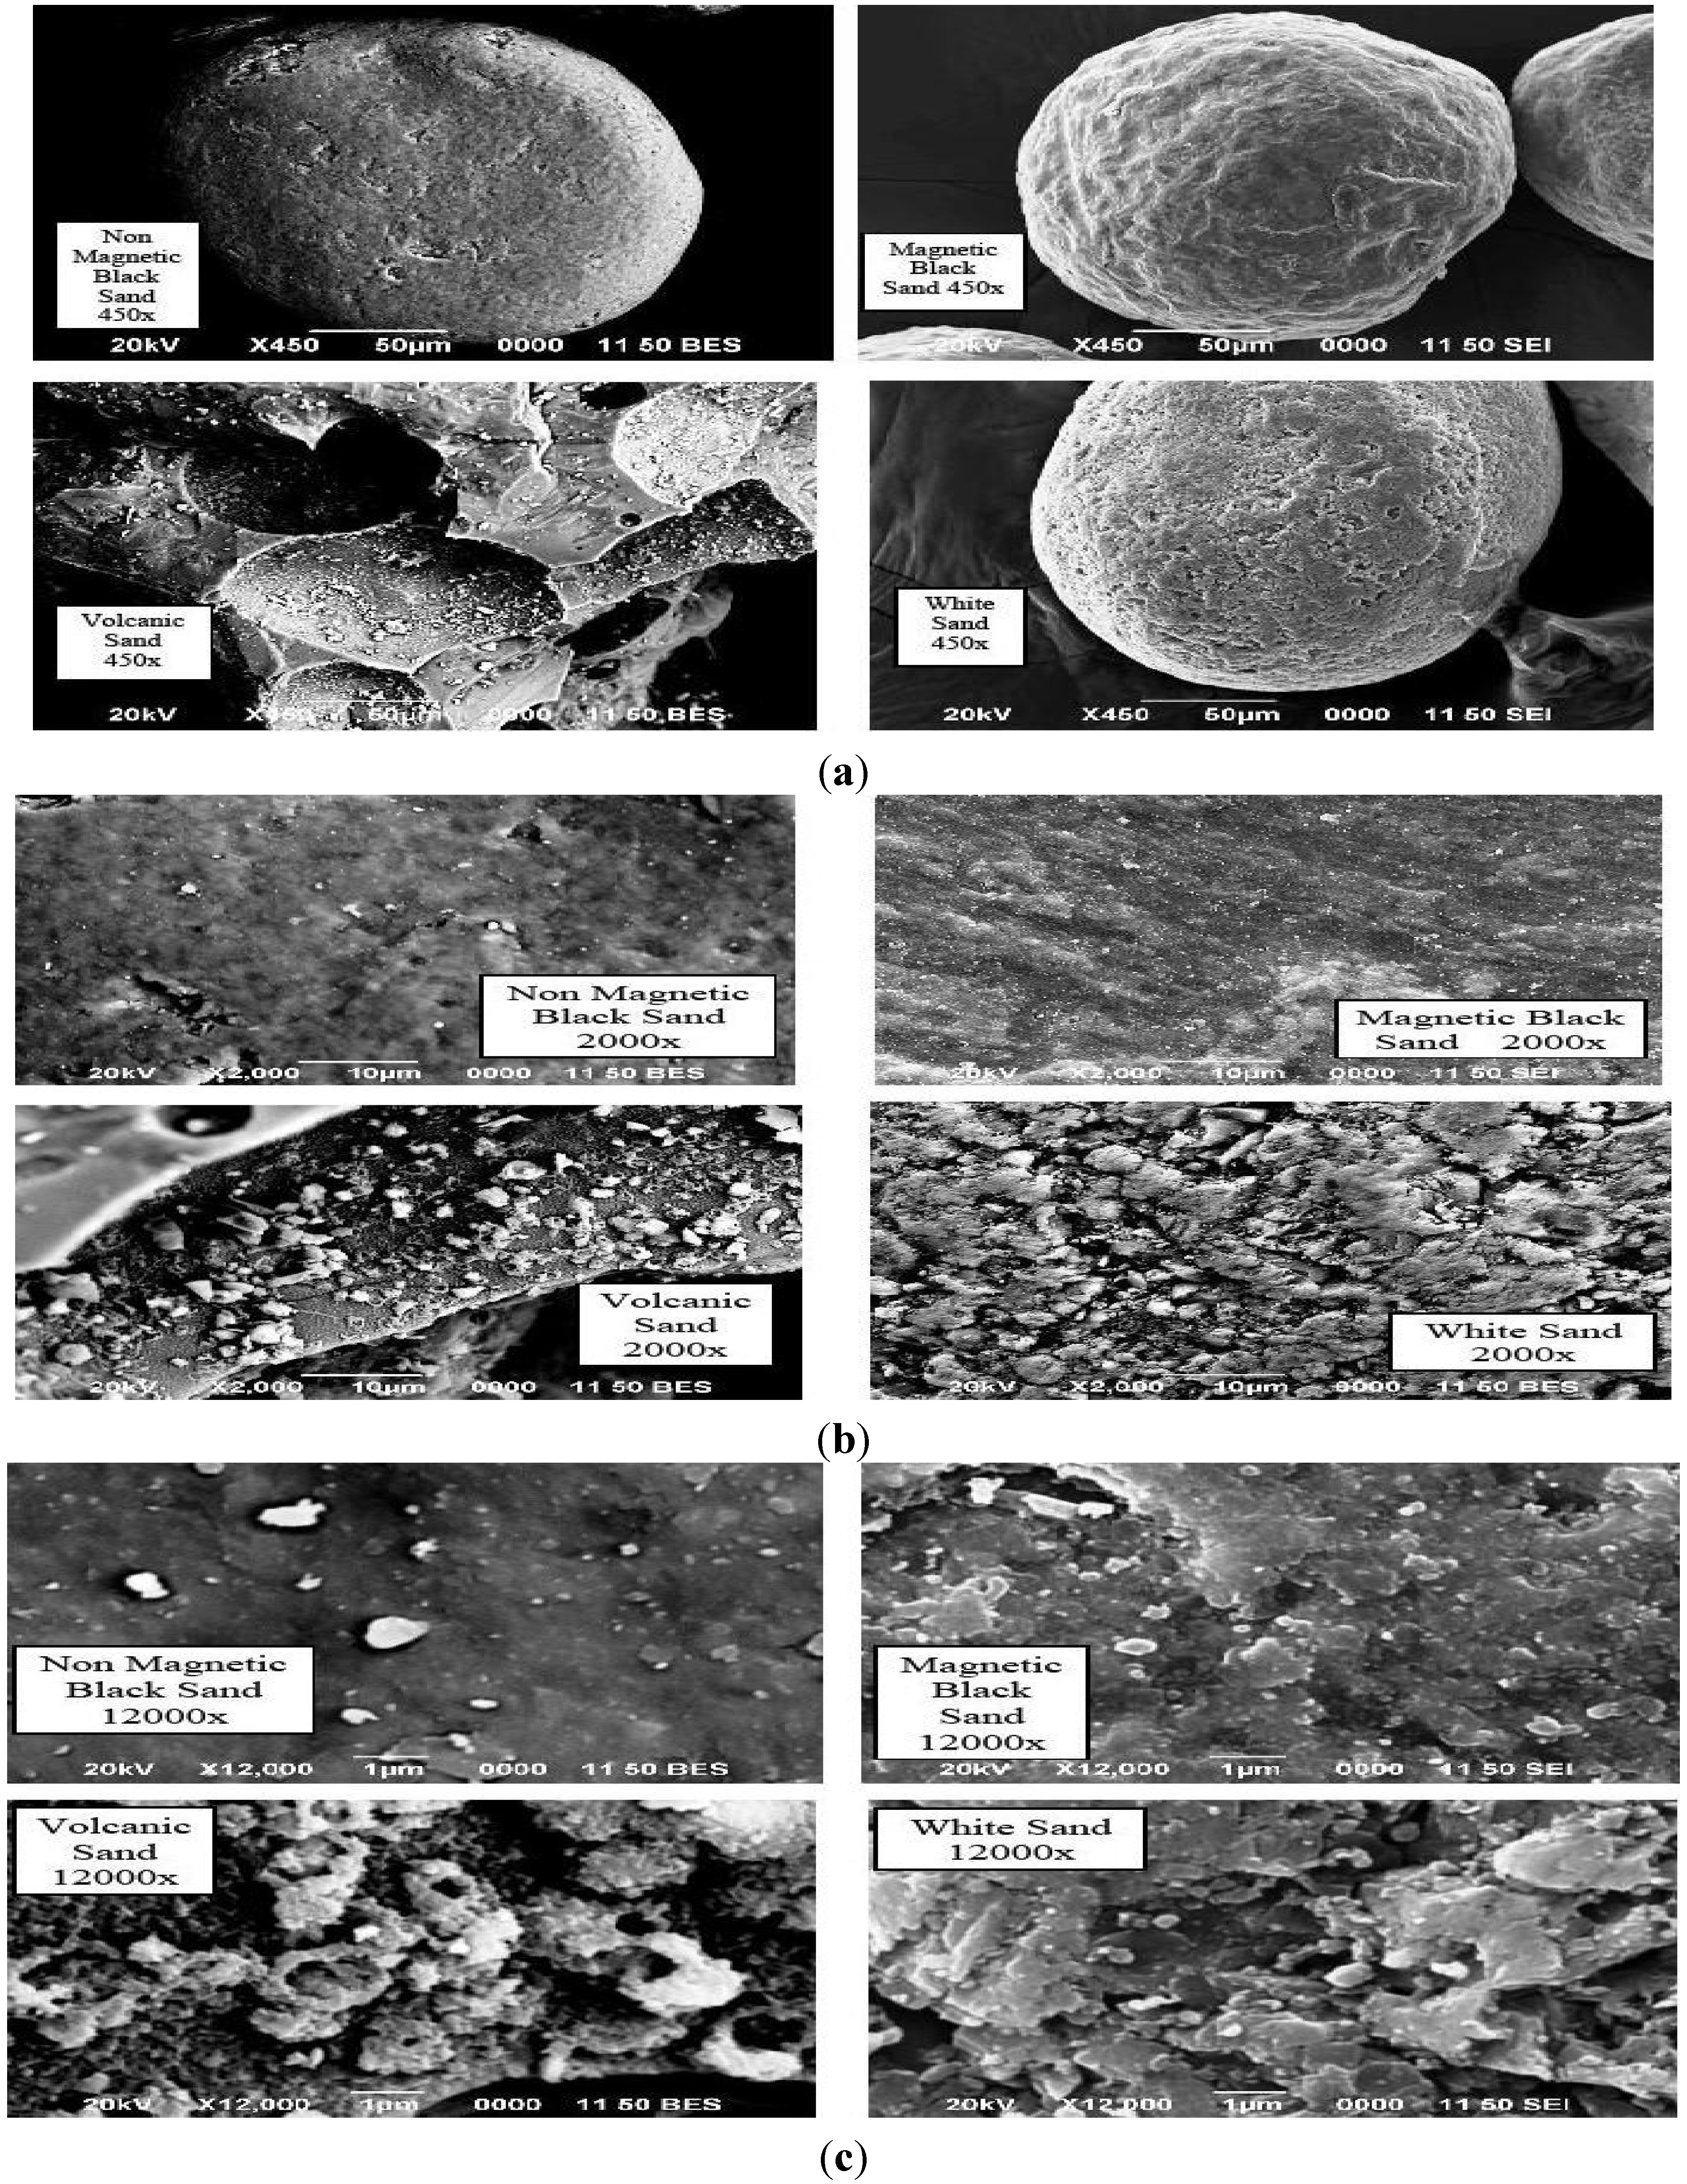
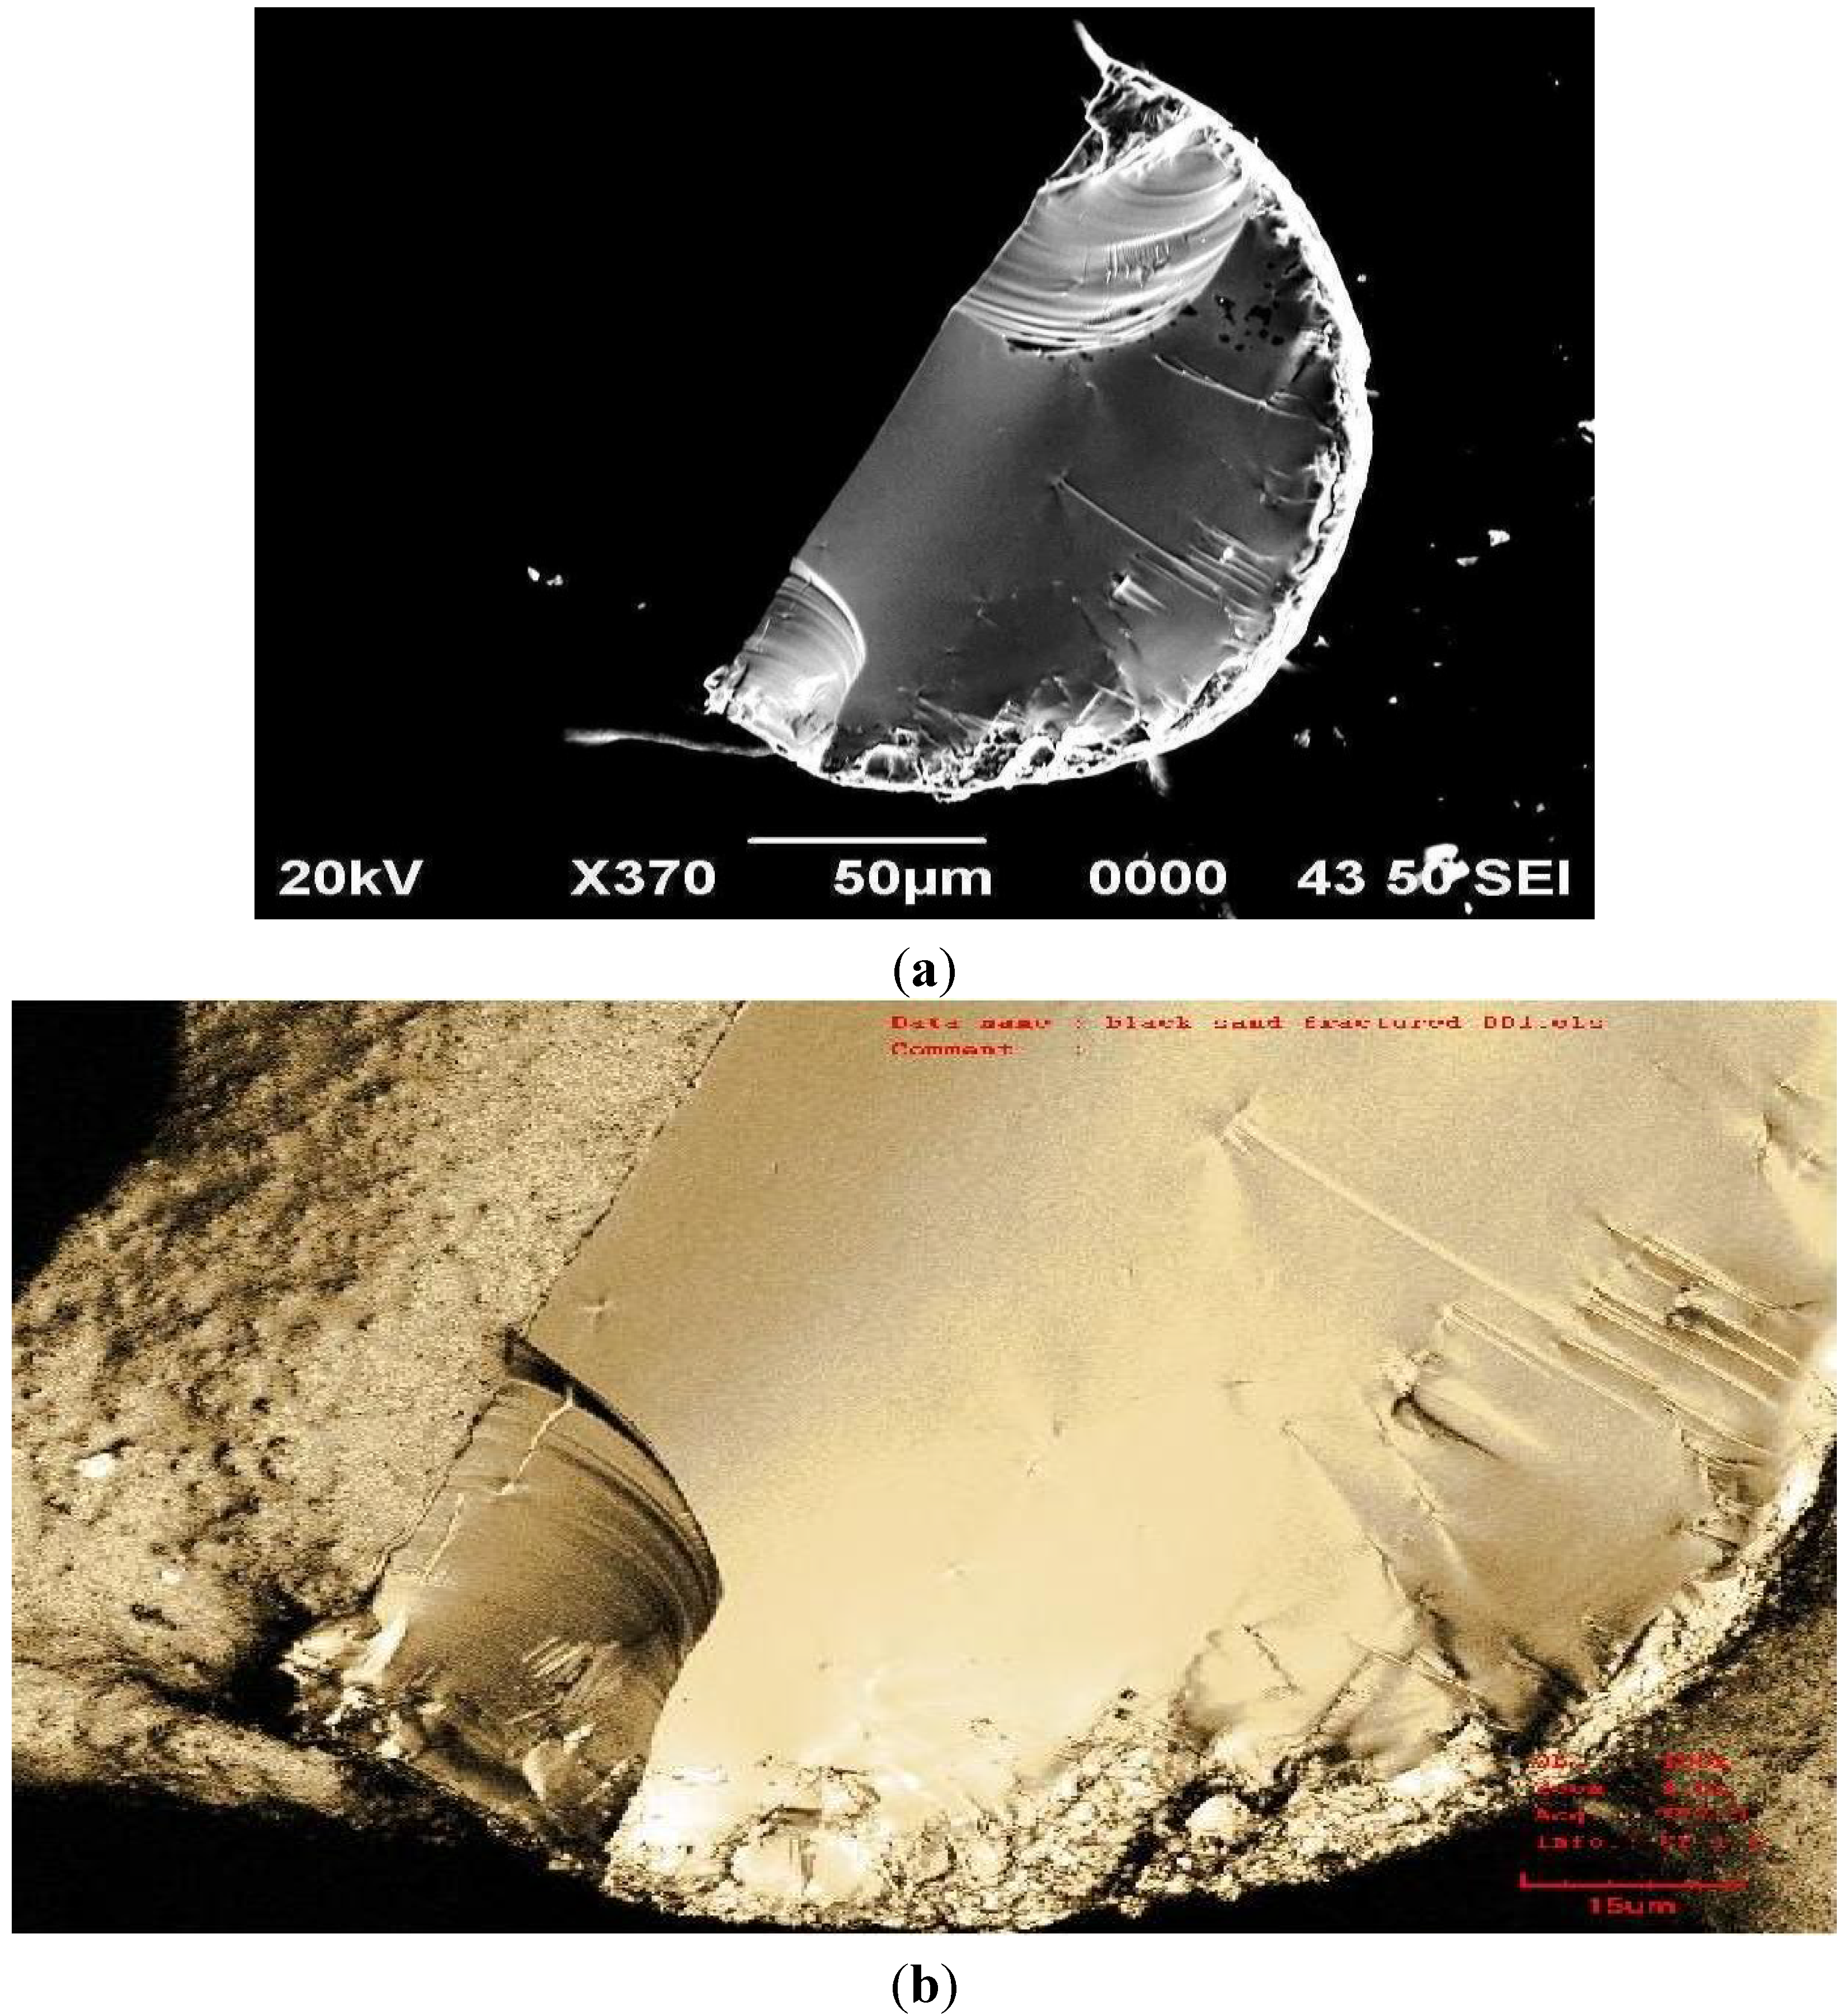
3.1. Morphology of Sand Samples

OSM, SEM, LSM Analysis

Figure 3 shows four stereo microscope images (63×) of non-magnetic black sand, magnetic black sand, white sand, and volcanic sand. White sand appears as a clean crystalline structure (quartz—SiO2), whereas the volcanic sand and the magnetic black sand both have reddish tints indicative of iron oxide. Even at relatively low SEM magnification (220×), significant structural and elemental features were evident. The volcanic sand illustrates a very angular structure while ovoid structures were evident in the remaining three sands. The iron oxide particles were either irregular or spherical.
Figure 3. Stereo micrograph of non-magnetic black, magnetic black, white, and volcanic sand (63× magnification).
Atmosphere 06 01175 g003
The surface differences became more pronounced at higher SEM magnification (450×; Figure 4a). Black sand particles, both magnetic and non-magnetic were more spherical than the oval white sand particles and angular volcanic sand.
Figure 4. Scanning electron micrographs of sand at (a) 450× magnification; (b) (2000× magnification showing ultrafine particles; and (c) 12,000× magnification.
Atmosphere 06 01175 g004
SEM images at a magnification of 2000× (Figure 4b) revealed different surface structures in all four samples. At this magnification the fine particles began to appear, attached to the surfaces of the sand grains, especially the black sand particles. There are distinct differences between the images of the black sand particles and the images of the white sand and volcanic sand particles. While white sand and the volcanic sand are crustal in nature (Figure 4b), the white sand particles have been polished over time due to weathering; however, they otherwise appear similar to the volcanic sand. At 7000× magnification, fine particles attached to the surface of the white and black sand grains were round in shape, whereas particles on the volcanic sand were jagged and irregular. Examination at 7000× clearly indicated the predominance of fine and ultrafine particles (50 to 500 nm range) in the black sand sample. Morphology of these small round particles suggests industrial contributions and/or byproducts of fossil-fuel combustion. At higher magnification (12,000×), differences in the fine particles embedded on the grains became more evident (Figure 4c). Since they are complex aggregates, their total surface area is enormous in contrast to coarser PM. Due to the longer residence times and better mobility of fine particles, their dispersion in the atmosphere is more efficient than that of coarse particles, and they are very readily transported long distances by air streams.
The first series of LSM images, taken at 10× microscope magnification (mm optical, Figure 5a), showed characteristics of an oil-like product on the surface of the black sand samples with additional fine particles attached to the surface. The other three sand samples appeared similar in size, shape, and surface textures. The coloration of the three sand samples is somewhat similar; however, the magnetic black sand was less reflective because of the oil contribution. The LSM showed that the volcanic sand sample had a different appearance. It was less smooth and appeared more crystalline, and the surface appeared to be comprised of many smaller particles stuck together with many different color variations. At higher magnification (20×), all four sand samples did show differences in shape, as well as color variations. Black sand samples appeared more spherical whereas the white sand sample appeared more oval, as seen previously by SEM. The surface of the magnetic black sand had some roughness, similar to the white sand, and there were variations in coloration that were not as apparent at lower magnification. The volcanic sand looked to be very rough and composed of material of many colors. The black sand appeared to be mostly gold-colored at this magnification, with similar surface roughness to that of the magnetic black sand.
The first four LSM images (Figure 5a) were created using the optical settings of the microscope. The next two images (Figure 5b,c) were created using the confocal imaging capabilities of the LSM. In Figure 5b, a 100× color image of a magnetic black sand particle, individual fine particles are seen coating the surface. Figure 5c depicts a 100× color LSM image of a white sand particle, where fine black particles are seen coating the surface. They may be the beginning of a black coating, but most likely are anthropogenic. A cross section of a black sand particle (90× magnification; Supplementary Figure S1), shows a white interior with a black coating on the outside. In this image, taken with the stereo microscope, the particle on the left shows where the surface coating was removed and the white core exists. The magnetic black sand clearly depicts the reddish iron oxide particles.
Figure 5. LSM images (a) sand (10× magnification); (b) magnetic black sand (100× magnification); and (c) white sand (100× magnification).
Atmosphere 06 01175 g005
One of the black sand grains was fractured and divided into quarters, similar to an interior slice of an orange. In Figure 6a, an SEM image (370×), the left side shows the interior of the sand grain with no deposition or evidence of fine and ultrafine particles. The roundish outside clearly shows a “fingernail” effect. There is a thin surface layer (1 μm) embedding a large number of particles from the atmospheric deposition, and the coating can be seen as having a rough texture. A similar observation was seen using the LSM in the confocal mode (100×), in which the rough textured outside coating is apparent with individual submicron particles attached to the surface, and the inside is smooth with no coating (Figure 6b). The 1 μm deep surface coating is also apparent. It is known that emissions from combustion of fossil-fuel contain carbon soot and sulfur that is easily absorbed by soil particles during long-range transportation [21,22].
Figure 6. (a) Scanning electron micrograph of magnetic black sand (370× magnification); (b) LSM image of magnetic black sand (100× magnification).
Atmosphere 06 01175 g006
The coating of the sand grains with the oil-like material and the fine and ultrafine particles were identified independently and are believed to be correct. It does not appear likely that the black sands originated from a natural oil seep (leaking oil field) as opposed to having anthropogenic origin. Oil fields are located in eastern Saudi Arabia, and not in western Saudi Arabia where the study took place. In addition, the predominant wind direction is from the northwest, in the direction of a highly industrialized area (Yanbu, Figure 2). Indeed, three of the country’s largest oil refineries operate 83 km upwind of the sampling site. Together these results point to anthropogenic origin of the black sands, rather than impact from natural oil seeps.

3.2. Elemental Composition (SEM/EDS)

Elemental determinations were performed to indicate the possible chemical species and quantities present. In an energy range of up to 7.5 keV, the following elements were detected: C, O, Na, Mg, Al, Si, P, S, K, Ca, Ti, V, Cr, Mn, and Fe. Carbon, O, Na, Mg, Al, Si, K, Ca, Ti, and Fe peaks were observed at 0.28, 0.53, 1.04, 1.25, 1.50, 1.74, 3.31, 3.69, 4.51, and 6.40 keV, respectively. These elements were the most common, found in varying intensity in all samples (Table 1). A clear P peak at 2.01 keV appeared in the magnetic black sand and volcanic sand samples. Only the magnetic black sand sample exhibited a peak at 2.31 keV, which clearly indicates S. Well-defined V and Mn peaks at energies of 4.95 and 5.89 keV, respectively, were detected in the non-magnetic black and volcanic sand sample. A Cr peak at 5.41 keV in the volcanic sand was clearly pronounced. The striking difference in elemental analysis between the black and white sand confirms that the two distinct entities were being separately resolved. The analysis of black sand and the comparison with white and volcanic sand samples that were performed in this study enables one to attribute the observed elements to anthropogenic emissions.
Table 1. Elemental Comparison of Four Sand Grains (Weight %).
ElementMagneticNon-MagneticWhite SandVolcanic Sand
Black SandBlack Sand
C19.08.85.46.4
O13.237.651.942.3
Na0.30.53.12.5
Mg0.30.73.53.1
Al1.11.88.36.4
Si2.03.420.016.8
P0.10.00.00.4
S0.30.00.00.0
K1.00.11.90.7
Ca1.00.41.66.2
Ti6.718.00.81.5
V0.00.70.00.3
Cr0.00.00.00.3
Mn0.00.40.00.5
Fe55.027.63.512.6
The high sample to sample variability of the Fe concentration represents the most striking result shown on Table 1: the Fe weight contribution represents 55.0% of the magnetic black sand sample, compared to 27.6%, 12.6%, and 3.5% in the non-magnetic black sand, volcanic sand, and white sand samples, respectively. The higher O peak in the energy dispersive X-ray spectrum of the magnetic black and non-magnetic black sand indicates that the Fe may be present as iron oxides specifically hematite (Fe2O3), and magnetite (Fe3O4). The black color of the sand is a result of the large quantity of C-bearing particles with a nm size. The magnetic black sand sample had the highest C content (19.0 wt %), in contrast with the volcanic sand (6.4 wt %) and white sand (5.4 wt %). Elemental carbon is predominantly a product of the combustion process and is a good tracer for combustion-generated particles. Of the heavy metals, only Ti was present in levels approaching 6.7 wt %. Potassium, Ca, Al, and Si were present at 1–2 wt %. The presence of a low intensity but discernible S peak in addition to C and O peaks in magnetic black sand suggests soot particles derived from fossil-fuel combustion. Similar results were observed in other electron microscopy studies of ambient particles [23,24,25]. A study by Chen et al. [25] reported that soot particles exhibiting a sulfur EDS peak, in addition to carbon and oxygen peaks, are prominently derived from combustion of coal, residual oil, gasoline, and diesel oil. Generally, the S content of soot particles is much less than that of char particles [23]. Since soot particles have smaller density compared to soil particles, their lifetime in the atmosphere is longer and they are more easily transported far away from their source areas [26]. A study carried out by Ali-Mohamed and Matter [27] revealed that soot from black smoke of the Kuwaiti oil-well fires settled 400 km downwind in Bahrain. Particles of combustion source origin included C, Al, S, Ti, and Fe-rich particles from metal industries and iron deposits. Many studies have reported the prevalence of C-rich particles in the fine fraction of PM10 in several urban environments [28,29,30,31]. By analyzing precipitation samples collected at Kanazawa, Japan, Tazaki et al. [32] reported that the high concentration of nm sized C-bearing particles and powdery dusts were produced by oil field combustion and a sandstorm in Iraq, and the particles were transported as cloud nuclei from Iraq to Japan by westerly winds.
Non-magnetic black sand is characterized by C, O, Na, Mg, Al, Si, P, K, Ca, Ti, V, Mn and Fe (Table 1) and is highly enriched in Ti (18.0 wt %). Titanium oxide particles are common in ambient PM samples [33,34]. Carbon and Fe were observed in lesser amounts (8.8 and 27.6 wt %) as compared to the magnetic black sand sample (19.0 and 55.0 wt %). Levels of Mn (0.40 wt %) in non-magnetic black sand were comparable to the volcanic sand sample (0.50 wt %). The presence of transition metals on sand particles is consistent with the anthropogenic process where volatilized metal, H2SO4 vapor, and SO2 condense on submicron ash particles, forming a complex aerosol mixture that is eventually emitted into the ambient air [35]. Vanadium products can indicate a portion of fly ash from the combustion of heavy fuel oil [17]. The principal metals generally contained in fuel oils include C (1.5%–69%), Na (0.2%–3.91%), Mg (2.26%–18.4%), Al (0.01%–1.42%), Si (0.05%–0.31%), K (0.1%–0.13%), Ca (0.1%–1.0%), V (1.1%–12.85%), Fe (0.40%–0.61%), and Ni (0.35%–2.28%). Possible compound compositions of oil-fired fly ash are: C as C; Na as Na2SO4; Mg as MgO, Mg as MgSO4.H2O; Al as Al2O3, Al as Al2 (SO4)3; Si as SiO2; K as K2SO4; Ca as CaO, and Ca as CaSO4; V as V2O5, V as VOSO4.3H2O; and Fe as Fe2O3, Fe as FeSO4 [17].
White sand is rich in C, O, Na, Mg, Al, Si, K, Ca, Ti, and Fe (Table 1). Oxygen (51.9 wt %), Si (20 wt %), Al (8.3 wt %), Mg (3.5 wt %), Na (3.1 wt %), and K (1.9 wt %) had the highest values of the four sand grain samples. The white sand had the lowest carbon content (5.4 wt %), which is likely associated with Ca (as CaCO3—calcite, the main component of limestone) and other alkaline earth metals e.g., Mg (as CaMg (CO3)—dolomite), due to the corresponding presence of O [18]. It should be noted that the sample contained 2.4 times more Al than Fe. Both the white sand and the volcanic sand exhibit similar ratios of O to Si (2.59 and 2.52, respectively) and Si to Al (2.41 and 2.63, respectively). The silicates present in the white sand and volcanic sand are mainly silicon oxides and alumino-silicate particles originating from both natural (e.g., earth’s crustal matter) and anthropogenic (e.g., combustion of fossil-fuels) sources [25]. Silica-rich particles have been reported as significant constituents of the fine fractions of aerosols collected in arid desert areas of southern Utah [36], the northern Sahara [37], Cairo, Egypt [38], and Phoenix, Arizona [30].
Table 1 reveals that predominant elements in volcanic sand are Ca, Al, C, Fe, Si, and O: the weight concentration of these elements varies from 6.2% to 42.3%. Particles are rich in Ca, likely as CaCO3, and contain minor amounts of V, Cr, P, Mn, K, Ti, Na, and Mg (0.30% to 3.1%). Phosphorous had the highest value (0.40 wt %) of the four sand grain samples. Phosphorous–bearing particles normally occur as calcium phosphates [25]. Silicates present in the sample, within which Ca-rich silicates are prevalent, come from the soil [39].

3.3. Enrichment Factors (EFs)

Enrichment factors (EFs) were calculated to identify the role of potential sources of crustal or anthropogenic pollution:
EF = (Cx/CAl) sand/(Cx/CAl) crust
where Cx and CAl represent the concentrations of an element and the abundance of aluminum, respectively. The main advantage of the EF is that the enrichment of all elements can be promptly compared. Aluminum was selected as the reference element [40]. Usually, an EF value of <10 indicates an element of crustal origin, while an EF ≥ 10 is ascribed to an element of anthropogenic source [41]. The EFs of Na, Mg, Si, K, and Ca in magnetic black sand ranged from 0.5 to 3, demonstrating that these elements have a significant crustal origin. EFs of Fe, S, and Ti were 74, 84, and 88, respectively, revealing a mainly anthropogenic origin. For the non-magnetic black sand, a strong enrichment was observed for Mn (EF = 20), Fe (EF = 23), Ti (EF = 147), and V (EF = 237), while for all other elements EF values were less than 1. The EFs of V and Cr in volcanic sand were 26 and 37, respectively, which suggests an anthropogenic component.

3.4. Extractable Ion Analysis by IC

In order to quantify anthropogenic contributions and further assess SEM/EDS results, ion chromatography analysis of magnetic black sand was also performed, and it confirmed the presences of the following water-soluble anions and cations: sulfate (SO42−), nitrate (NO3), chloride (Cl), sodium (Na+), potassium (K+), magnesium (Mg2+), and calcium (Ca2+). Among the anions, SO42− had the highest concentration (59 ppm), followed by Cl (17 ppm) and NO3 (5.2 ppm). Sulfate and NO3 are related to anthropogenic emissions. Generally, S-bearing particles exist in the forms of SO42−, HSO4, and/or H2SO4 with or without NH4+ [26]. In fact, studies have concluded that atmospheric SO42− can either be emitted directly as primary particles or result from gas-to-particle conversion reactions in the atmosphere [15,42]. Sulfur dioxide from anthropogenic sources is oxidized into H2SO4, which in turn accumulates to form condensation nuclei [43]. Sulfur-bearing particles are often observed in airborne PM samples [25,44,45,46]. Sulfate has been found as the dominant chemical species in aerosol particles in urban atmospheres [47,48,49]. For example, a study by Zhang et al. [47] indicates the dominance of SO42− (>70%) in fine particles from the urban area of Beijing during non-dust-storm periods. Bassett and Seinfeld [50] reported that NO3 is hardly formed on fine particles owing to its volatility. Therefore, NO3 may be formed on soot particles through heterogeneous conversions of nitrogen oxides. Our observation is supported by an aerosol particle study by Ganor et al. [51] at Haifa Bay, which has revealed that SO42− and NO3 concentrations were 5–10 times higher in the land breeze than in sea breeze, as a consequence of the emissions from local industries or the long-range transportation of pollutants. The high abundance of Cl is likely to be linked to Fe, Na, Ca, K, and Mg, and may have been transported long-range by way of sea [52].
As evidenced earlier, the black sand particles have very different morphologies and microstructures compared to the white sand and volcanic sand. An important finding in our study is the predominance of fine and ultrafine particles (50 to 500 nm ranges). Anthropogenic and natural sources have been implicated for the observed particles. It should be pointed out that Badr is situated 83 km southeast of Yanbu (Figure 2), which was established in 1975 as one of the country’s two industrial centers, and has several oil-fueled power plants, three oil refineries, heavy petrochemical industries, a large cement factory, desalination plants, mineral and metal industries, and several other small industries and workshops. There are naturally occurring lava fields and iron deposits located upwind, near and around Badr. Also, Badr is about 800 km southeast of Haifa’s (Figure 2) extensive industrial zone [52]. In fact, Badr is at a crossroads where PM from different sources may converge: long-range transported polluted air masses from Yanbu and Bay of Haifa, sea spray from the Red Sea itself, and mineral components from the deserts of North Africa (Sahara) and the Arabian Peninsula. Occasionally, Saudi Arabia and nearby countries are hit by sandstorms. The opaque mass of dust, debris, and fine particles in suspension is usually transported by strong winds to high mountains [32]. Backward-in-time trajectories using NOAA HYSPLIT model [53] suggest that the dominant air mass movement is northwesterly from the highly industrialized areas (Yanbu and Haifa) towards the area of concern (Badr). Thus, the morphological analysis, composition, proximity to the site, and air mass movements all suggest that emissions by these industries have contributed to particulate air pollution. They were formed as cloud condensation nuclei were readily long-range transported by northwesterly air currents, and finally settled on Douf Mountain.

4. Conclusions

High resolution electron microscopy, viz. optical stereo microscope (OSM), scanning electron microscopy with energy dispersive X-ray spectrometry (SEM/EDS), and laser scanning microscopy (LSM), was a powerful tool for in-depth analysis and identification of particles by revealing details of the microstructure, morphology, emission source types, size, and elemental composition of each type of sand particles. The physical and chemical characterization of sand samples from Badr, Saudi Arabia by different complimentary techniques has contributed to our knowledge and understanding of the sand particles. These particles could have long-term health consequences to the residents of Badr, but a dedicated health analysis would be needed to investigate this possibility.
White sand contained silicates (alumino-silicates), quartz (SiO2, clean crystalline structure, milky, rose), calcite, olivine, feldspar, and magnetite. Compared to white sand and volcanic sand, the black sand particles exhibited very different morphologies and microstructures (surface roughness). Morphological SEM and LSM analyses showed that the black sand contained fine and ultrafine particles (50 to 500 nm ranges) and there was a thin surface layer (1 μm) embedding a large number of particles from the atmospheric deposition. Ion chromatography analyses confirmed the presence of the following water-soluble anions and cations in variable concentrations in magnetic black sand: SO42−, NO3, Cl, Na+, K+, Mg2+, Ca2+.
X-ray energy dispersive microanalyses of sand samples revealed varying weight concentrations of C, O, Na, Mg, Al, Si, S, Ca, Ti, V, and Fe, ranging from 0.1% to 55% in all four samples. The predominant elements in black sand were Fe, C, O, Ti, Si, Al, V, and S. Enrichment factor (EF) analysis results demonstrated that Na, Mg, Al, Si, K, and Ca in black sand originated from natural sources, while Fe, C, Ti, V, and S were linked to anthropogenic sources. Fossil-fuel combustion and industrial emissions in Haifa and Yanbu can be significant sources of carbon and other contaminant particles, which can be easily adhered to soil particles during long-range transport.
This study presents the first in-depth characterization of black sand particles from sand dunes of Saudi Arabia. Reliable baseline data on particulate air pollution are needed for setting standards and objectives of air pollution controls, and to investigate the role of local and long-range transported anthropogenic emissions. Examining the types, dimensions, and the amount of carbon and other contaminant particles deposited in the coming years will indicate effectiveness of the pollution control devices which have been installed on industries producing energy from fossil-fuels. A comprehensive study should be considered to cover the whole area, trace wind pathways from source regions, and outreach to local people to locate other areas where black sand has been deposited. Future research into the issues such as the real size of the ultrafine particles, mechanisms of long-range transport in the region and mechanisms of adhesion of the ultrafine particles to the larger sand grains would help explain these issues more fully. Further research into health outcomes (respiratory diseases, cardiovascular) in the general population and susceptible groups in Badr and other major cities of Saudi Arabia should also be performed.

Supplementary Files

Supplementary File 1

Acknowledgments

The authors express their appreciation to Abdul Rahman Al Youbi, Vice President for Academic Affairs, King Abdulaziz University and Abdullah Ahmad A. Ghamdi, Dean Research and Consulting Institute, King Abdulaziz University for their support. We gratefully acknowledge the support by the Wadsworth Center, New York State Department of Health. We also thank Curtis Boynton, a summer intern with the NYS DEC, for his help. The authors wish to thank to Tara Nylese of EDAX Inc. for providing the results for confirmation purposes. The authors also wish to thank Brian Frank, Katherine Alben, Simeen Tabatabai, and Jessica Stark for valuable comments and editing the manuscript.

Author Contributions

The study was completed with the cooperation between all the authors. Haider A. Khwaja, Omar S. Aburizaiza, Azhar Siddique, Abdullah J. Aburiziza, and Donald Blake conceived and designed the experiment. The corresponding authors Jahan Zeb, Mohammad Abbass, and Azhar Siddique were in-charge of sampling and collected the relevant data. Daniel Hershey was instrumental in the design of the study, sample analyses by SEM and LSM, and interpretation of the images and X-ray diffraction spectra. David Guerrieri performed all the LSM analyses and data interpretation. Malissa Kramer analyzed the sample by SEM, checked and reported the results. Mirza M. Hussain was in-charge of inorganic anions and cations analyses by Ion Chromatography. Isobel Simpson interpreted the results and critical revision. Paper was written by Haider A. Khwaja with a significant contribution by Omar Aburizaiza, Daniel Hershey and David Guerrieri.

Conflicts of Interest

The authors declare no conflict of interest.

References

  1. D’Almeida, G.A.; Koepke, P.; Shettle, E.P. Atmospheric Aerosols: Global Climatology and Radiative Characteristics; A Deepak Publishing: Hampton, VA, USA, 1991. [Google Scholar]
  2. Jaenicke, R. Physical properties of atmospheric particulate sulfur compounds. Atmos. Environ. 1978, 12, 161–169. [Google Scholar] [CrossRef]
  3. Goyer, R. Issue Paper on the Human Health Effects of Metals; U.S. Environmental Protection Agency: Lexington, MA, USA, 2004. [Google Scholar]
  4. Jarup, L.; Akesson, A. Current status of cadmium as an environmental health problem. Toxicol. Appl. Pharmacol. 2009, 238, 201–208. [Google Scholar] [CrossRef] [PubMed]
  5. Mamtani, R.; Stren, P.; Dawood, I.; Cheema, S. Metals and Disease: A Global Primary Health Care Perspective. J. Toxicol. 2011, 2011. [Google Scholar] [CrossRef] [PubMed]
  6. Yaman, M. Comprehensive comparison of trace metal concentrations in cancerous and non-cancerous human tissues. Curr. Med. Chem. 2006, 13, 2513–2525. [Google Scholar] [CrossRef] [PubMed]
  7. U.S. Environmental Protection Agency (US EPA). Third External Review Draft of Air Quality Criteria for Particulate Matter (April 2002); U.S. Environmental Protection Agency: Research Triangle Park, NC, USA, 2002; Volume 1.
  8. Dockery, D.W.; Pope, C.A. Acute respiratory effects of particulate air pollution. Ann. Rev. Public Health 1994, 15, 107–132. [Google Scholar] [CrossRef] [PubMed]
  9. Donaldson, K.; MacNee, W. The mechanism of lung injury caused by PM10. In Air Pollution and Health, Issues in Environmental Science and Technology; Hester, R.E., Harrison, R.M., Eds.; Royal Society of Chemistry: Cambridge, UK, 1998; Volume 10, pp. 21–32. [Google Scholar]
  10. Lipmann, M.; Ito, K.; Nadas, A.; Burnett, R.T. Association of Particulate Matter Components with Daily Mortality and Morbidity in Urban Populations; Research Report 95; Health Effects Institute: Cambridge, MA, USA, 2000. [Google Scholar]
  11. Environmental Protection Agency (EPA). Air Quality Criteria for Particulate Matter; EPA 600/P-651001CF; National Center for Environmental Assessment: Research Triangle Park, NC, USA, 1996; Volume III.
  12. HEI Perspectives. In Understanding the Health Effects of Components of the Particulate Matter Mix: Progress and Next Steps; Health Effects Institute: Cambridge, MA, USA, 2002.
  13. Aust, A.; Smith, K.R.; Veranth, J.M.; Hu, A.; Lightly, J.S.; Ball, J.C.; Stracci, A.M.; Young, W.C. Particle Characteristics Responsible for Effects on Human Lung Epithelial Cells; Health Effects Institute: Cambridge, MA, USA, 2002. [Google Scholar]
  14. Oberdorster, G.; Finkelstein, J.N.; Johnston, C.; Gelein, R.; Cox, C.; Baggs, R.; Elder, A.C.P. Acute Pulmonary Effects of Ultrafine Particles in Rats and Mice; Research Report 96; Health Effects Institute: Cambridge, MA, USA, 2000. [Google Scholar]
  15. Post, J.E.; Buseck, P.R. Characterization of individual particles in the Phoenix urban aerosol using electron-beam instruments. Environ. Sci. Technol. 1984, 18, 35–42. [Google Scholar] [CrossRef] [PubMed]
  16. Clark, M.D. Geological Map of the Al Hamra Quadrangle, Sheet 23 C, Kingdom of Saudi Arabia; Directorate General of Mineral Resources: Jeddah, Saudi Arabia, 1981. [Google Scholar]
  17. Henry, W.M.; Knapp, K.T. Compound forms of fossil fuel fly ash emissions. Environ. Sci. Technol. 1980, 14, 450–456. [Google Scholar] [CrossRef] [PubMed]
  18. Conny, J.M.; Norris, G.A. Scanning electron microanalysis and analytical challenges of mapping elements in urban atmospheric particles. Environ. Sci. Technol. 2011, 45, 7380–7386. [Google Scholar] [CrossRef] [PubMed]
  19. Perrone, M.R.; Turnone, A.; Buccolieri, A.; Buccolieri, G. Particulate matter characterization at a coastal site in south-eastern Italy. J. Environ. Monit. 2006, 8, 183–190. [Google Scholar] [CrossRef] [PubMed]
  20. McCrone, W.C. The Particle Atlas. Edition Two; Ann Arbor Science Publishers Inc.: Ann Arbor, MI, USA, 1980. [Google Scholar]
  21. Friedlander, S.K. A review of the dynamics of sulfate containing aerosols. Atmos. Environ. 1978, 12, 187–195. [Google Scholar] [CrossRef]
  22. Kleefeld, S.; Hoffer, A.; Krivacsy, Z.; Jennings, S.G. Importance of organic and black carbon in atmospheric aerosols at Mace Head, on the West Coast of Ireland (53°19′ N, 9°54′ W). Atmos. Environ. 2002, 36, 4479–4490. [Google Scholar] [CrossRef]
  23. Chen, Y.; Shah, N.; Huggins, F.E.; Huffman, G.P. Investigation of the microcharacteristics of PM2.5 in residual oil fly ash (ROFA) by analytical transmission electron microscopy. Environ. Sci. Technol. 2004, 38, 6553–6560. [Google Scholar] [CrossRef] [PubMed]
  24. Chen, Y.; Shah, N.; Huggins, F.E.; Huffman, G.P. Transmission electron microscopy investigation of ultrafine coal fly ash particles. Environ. Sci. Technol. 2005, 39, 1144–1151. [Google Scholar] [CrossRef] [PubMed]
  25. Chen, Y.; Shah, N.; Huggins, F.E.; Huffman, G.P. Microanalysis of ambient particles from Lexington, KY by electron microscopy. Atmos. Environ. 2006, 40, 651–663. [Google Scholar] [CrossRef]
  26. Zhang, D.; Iwasaka, Y.; Shi, G. Soot particles and their impacts on the mass cycle in the Tibetan atmosphere. Atmos. Environ. 2001, 35, 5883–5894. [Google Scholar] [CrossRef]
  27. Ali-Mohamed, A.Y.; Matter, H.A. Determination of inorganic particulates: (Cationic, anionic and heavy metals) in the atmosphere of some areas in Bahrain during the Gulf crisis in 1991. Atmos. Environ. 1996, 30, 3497–3503. [Google Scholar] [CrossRef]
  28. He, K.; Yang, F.; Ma, Y.; Zhang, Q.; Yao, X.; Chan, C.K.; Cadle, S.; Chan, T.; Mulawa, P. The characteristics of PM2.5 in Beijing, China. Atmos. Environ. 2001, 35, 4959–4970. [Google Scholar] [CrossRef]
  29. Hughes, L.S.; Cass, G.R.; Gone, J.; Ames, M.; Olmez, I. Physical and chemical characterization of atmospheric ultrafine particles in the Los Angeles area. Environ. Sci. Technol. 1998, 32, 1153–1161. [Google Scholar] [CrossRef]
  30. Katrinak, K.A.; Anderson, J.R.; Buseck, P.R. Individual particles types in the aerosol of Phoenix Arizona. Environ. Sci. Technol. 1995, 29, 321–329. [Google Scholar] [CrossRef] [PubMed]
  31. Chow, J.C.; Watson, J.G.; Lowenthal, D.H.; Solomon, P.A.; Magliano, K.L.; Ziman, S.D.; Richards, L.W. PM10 and PM2.5composition in California’s San Joaquin Valley. Aerosol Sci. Technol. 1993, 18, 105–128. [Google Scholar]
  32. Tazaki, K.; Wakimoto, R.; Minami, Y.; Yamamoto, M.; Miyata, K.; Sato, K.; Saji, I.; Chaerun, S.K.; Zhou, G.; Morishita, T.; et al. Transport of carbon-bearing dusts from Iraq to Japan during Iraq’s war. Atmos. Environ. 2004, 38, 2091–2109. [Google Scholar] [CrossRef]
  33. Posfai, M.; Anderson, J.R.; Buseck, P.R.; Shattuck, T.W.; Tindale, N.W. Constituents of a remote Pacific marine aerosol: A TEM study. Atmos. Environ. 1994, 28, 1747–1756. [Google Scholar] [CrossRef]
  34. Murr, L.E.; Bang, J.J. Electron microscope comparisons of fine and ultra-fine carbonaceous and non-carbonaceous, airborne particulates. Atmos. Environ. 2003, 37, 4795–4806. [Google Scholar] [CrossRef]
  35. Linak, W.P.; Wendt, J.O.L. Trace metal transformation mechanisms during coal combustion. Fuel Process. Technol. 1994, 39, 173–198. [Google Scholar] [CrossRef]
  36. Pitchford, M.; Flocchini, R.G.; Draftz, R.G.; Cahill, T.A.; Ashbaugh, L.L.; Eldred, R.A. Silicon in submicron particles in the Southwest. Atmos. Environ. 1981, 15, 321–333. [Google Scholar] [CrossRef]
  37. Gomes, L.; Bergametti, G.; Coude-Gaussen, G.; Rognon, P. Submicron desert dusts: A sandblasting process. J. Geophys. Res. 1990, 95, 13927–13935. [Google Scholar] [CrossRef]
  38. Hindy, K.T. Silicon, aluminum, iron, copper, and zinc levels in desert soil-related dust in Cairo. Atmos. Environ. 1991, 25, 213–217. [Google Scholar] [CrossRef]
  39. Paoletti, L.; de Berardis, B.; Diociaiuti, M. Physico-chemical characterization of the inhalable particulate matter (PM10) in an urban area: An analysis of the seasonal trend. Sci. Total Environ. 2002, 292, 265–275. [Google Scholar] [CrossRef]
  40. Taylor, S.R. Abundance of chemical elements in the continental crust: A new Table. Geochim. Cosmochim. Acta 1964, 28, 1273–1285. [Google Scholar] [CrossRef]
  41. Tang, X. Atmospheric Chemistry; Higher Education Publisher: Beijing, China, 1990. (In Chinese) [Google Scholar]
  42. Kulmala, M.; Vehkamaki, H.; Petaya, T.; dal Maso, M.; Lauri, A.; Kerminem, V.M.; Birmili, W.; McMurry, P.H. Formation growth rates of ultrafine atmospheric particles: A review of observations. Aerosol Sci. 2004, 35, 143–176. [Google Scholar] [CrossRef]
  43. Seinfeld, J.H.; Pandis, S.N. Atmospheric Chemistry and Physics; Wiley: New York, NY, USA, 1998. [Google Scholar]
  44. Buseck, P.R.; Posfai, M. Airborne minerals and related aerosol particles: Effects on climate and the environment. Proc. Natl. Acad. Sci. USA 1999, 96, 3372–3379. [Google Scholar] [CrossRef] [PubMed]
  45. Zhang, D.; Shi, G.-Y.; Iwasaka, Y.; Hu, M. Mixture of sulfate and nitrate in coastal atmospheric aerosols: Individual particle studies in Qingdao. Atmos. Environ. 2000, 34, 2669–2679. [Google Scholar] [CrossRef]
  46. Posfai, M.; Simonics, R.; Li, J.; Hobbs, P.V.; Buseck, P.R. Individual aerosol particles from biomass burning in southern Africa: 1. Compositions and size distributions of carbonaceous particles. J. Geophys. Res. Atmos. 2003, 104, 15941–15954. [Google Scholar] [CrossRef]
  47. Zhang, D.; Tang, X.; Qin, Y.; Iwasaka, Y.; Gai, X. Tests for individual sulfate containing particles in urban atmosphere in Beijing. Adv. Atmos. Sci. 1995, 12, 343–350. [Google Scholar]
  48. Tsitouridou, R.; Voutsa, D.; Kouimtzis, T. Ionic composition of PM10 in the area of Thessaloniki, Greece. Chemosphere 2003, 52, 883–891. [Google Scholar] [CrossRef]
  49. Horng, C.L.; Cheng, M.T. Distribution of PM2.5, acidic and basic gases near highway in Central Taiwan. Atmos. Res. 2008, 88, 1–12. [Google Scholar] [CrossRef]
  50. Bassett, M.E.; Seinfeld, J.H. Atmospheric equilibrium model of sulfate and nitrate aerosols—II: Particle size analysis. Atmos. Environ. 1984, 18, 1163–1170. [Google Scholar] [CrossRef]
  51. Ganor, E.; Levin, Z.; Grieken, R.V. Composition of individual aerosol particles above the Israelian Mediterranean coast during the summer time. Atmos. Environ. 1998, 32, 1631–1642. [Google Scholar] [CrossRef]
  52. Gilmour, P.S.; Brown, D.M.; Lindsay, T.G.; Beswick, P.H.; MacNee, W.; Donaldson, K. Adverse health effects of PM10 particles: Involvement of iron in generation of hydroxyl radical. Occup. Environ. Med. 1996, 53, 817–822. [Google Scholar] [CrossRef] [PubMed]
  53. Draxler, R.R.; Rolph, G.D. HYSPLIT (HYbrid Single-Particle Lagrangian Integrated Trajectory); NOAA Air Resources Laboratory: College Park, MD, USA, 2013. [Google Scholar]

