Article

Effect of the Standard Nomenclature for Air Pollution (SNAP) Categories on Air Quality over Europe

by
Efthimios Tagaris
1,
Rafaella Eleni P. Sotiropoulou
1,2,*,
Nikos Gounaris
1,
Spyros Andronopoulos
1 and
Diamando Vlachogiannis
1
1
Environmental Research Laboratory, NCSR Demokritos, 15310 Athens, Greece
2
Department of Mechanical Engineering, University of Western Macedonia, 50100 Kozani, Greece
*
Author to whom correspondence should be addressed.
Atmosphere 2015, 6(8), 1119-1128; https://doi.org/10.3390/atmos6081119
Submission received: 18 May 2015 / Revised: 2 July 2015 / Accepted: 23 July 2015 / Published: 31 July 2015
(This article belongs to the Special Issue Indoor and Outdoor Air Quality)

Abstract

:
The contribution of different anthropogenic source-sectors on ozone mixing ratios and PM2.5 concentrations over Europe is assessed for a summer month (July 2006) using the US Environmental Protection Agency’s (EPA’s) Models-3 framework and the Netherlands Organization for Applied Scientific Research (TNO) anthropogenic emissions for 2006. Anthropogenic emission sources have been classified into 10 different Standard Nomenclature for Air Pollution (SNAP) categories. The road transport category, which is mainly responsible for NOX emissions, is estimated to have the major impact on Max8hrO3 mixing ratio suggesting an increase of 6.8% on average over Europe, while locally it is more than 20%. Power generation category is estimated to have the major impact on PM2.5 concentrations since it is the major source of SO2 emissions, suggesting an increase of 22.9% on average over Europe, while locally it is more than 60%. Agriculture category is also contributing significantly on PM2.5 concentrations, since agricultural activities are the major source of NH3 emissions, suggesting an increased by 16.1% on average over Europe, while in regions with elevated NH3 emissions the increase is up to 40%.

1. Introduction

Air pollution is a major environmental problem due to its known or suspected harmful effects on human health and the environment, e.g., [1,2]. Although air quality management strategies have been applied over recent years to reduce atmospheric pollutant concentrations, ozone and particulate matter pollution are still an issue.
The sources of air pollutant emissions can be categorized as anthropogenic and natural emissions. While natural emissions have an important role in regulating the atmospheric composition (e.g., over 90% of the total Volatile Organic Compounds (VOCs) entering the atmosphere are biogenic [3]) anthropogenic emissions are the source of air quality degradation [4]. Since only the anthropogenic part can be influenced by abatement measures, assessing the effect of different anthropogenic emission sectors on gaseous and particle concentrations is very important for more effective adaptation and implementation guidelines in air quality planning.
Anthropogenic emission sources have been classified into different categories according to the Standard Nomenclature for Air Pollution (SNAP). Ten SNAP categories are used by the European Monitoring and Evaluation Programme (EMEP) [5] and the Netherlands Organization for Applied Scientific Research (TNO) [6]. While current studies assess ozone and aerosols responses to their precursor emissions in Europe, e.g., [7,8], there are no similar studies, to the best of our knowledge, assessing air pollutant responses to different anthropogenic emission sources. The objective of this study is to assess the impact of each SNAP category on ozone mixing ratios and PM2.5 concentrations over Europe and quantify their relative importance in air quality degradation. Results will contribute to an integrated assessment for air quality management in Europe since air pollutants released in one country can be transported in the atmosphere over thousands of kilometers affecting the air quality of other countries.

2. Method

Following the same methodology as described in details by Tagaris et al. [9], and summarized below, we use the Penn State/NCAR Mesoscale Model (MM5) [10], TNO emissions [6] and the Community Multiscale Air Quality model (CMAQ) [11,12] to simulate air quality.

Meteorology

Vautard et al. [13] have provided the meteorological fields in the framework of the Air Quality Modelling Evaluation International Initiative (AQMEII) exercise [14] using the Penn State/NCAR Mesoscale Model (MM5) [10]. Briefly, they found that the seasonal cycle of the 10 m wind speed as well as the spatial distribution of the surface wind speed is well reproduced. The Planetary Boundary Layer (PBL) height at noon is simulated quite well, however, the modeled height is much lower than the observed at 18 UTC. The diurnal cycle of 2 m temperature is slightly underestimated while the relative humidity above the surface is overestimated.
The Meteorology Chemistry Interface Processor (MCIP) [15] is used to convert MM5 output to the emissions and air quality models compatible format.

Emissions

Gridded anthropogenic emissions for the year 2006 over Europe are provided by TNO at a 0.1 × 0.1 degree resolution [6]. The available data include annual total emissions of CO, NH3, NMVOC, NOX, PM10, PM2.5, and SO2 for both area and point sources classified in the following 10 SNAP categories: (1) power generation; (2) residential-commercial and other combustion; (3) industrial combustion; (4) industrial processes; (5) extraction distribution of fossil fuels; (6) solvent use; (7) road transport; (8) other mobile sources; (9) waste treatment and disposal; (10) agriculture. Emissions are processed by the Sparse Matrix Operator Kernel Emissions (SMOKE) v2.6 modeling system [16] to convert their resolution to the resolution needed by the air quality model using monthly, weekly, and hourly time profiles provided by TNO [17].
The Biogenic Emission Inventory System, version 3 (BEIS3) is used for processing biogenic source emissions. An extensive analysis and discussion of biogenic emissions and their impact on air quality over Europe can be found elsewhere [18]. Briefly, they found that biogenic emissions are predicted to increase the daily average maximum 8 h ozone (Max8hrO3) mixing ratio by about 6% and to decrease PM2.5 concentration by about 2% on average over Europe due to their interactions with anthropogenic emissions.

Air Quality Modeling

The Community Multiscale Air Quality (CMAQ) v4.7 Modeling System [11,12] with the Carbon Bond mechanism (CB05) [19] and the default parameterization schemes are used here for the regional air quality modeling over Europe at 35 km × 35 km spatial resolution (Figure 1). An extensive evaluation and discussion of the base line air quality predictions has been presented by Tagaris et al. [9]. Briefly, they found that higher ozone mixing ratios are modeled in southern Europe and elevated PM2.5 concentrations over eastern and western Europe, locally. The results suggested that the daily average Max8hrO3 mixing ratio is overpredicted for low mixing ratios and is underpredicted for the higher ones, while PM2.5 concentrations were underpredicted.
Figure 1. Modeling domain.
Atmosphere 06 01119 g001
Source sensitivity approaches provide information about how modeled estimates of ozone and PM would change based on emissions changes in an identified source or group of sources [20]. Extending the works of Tagaris et al. [9,18] this study assesses the impact of each SNAP category on ozone mixing ratios and PM2.5 concentrations. A simulation where all SNAP categories are included is defined as the base case simulation. Source sensitivities are estimated using the brute-force zero-out method where a specific emissions input (SNAP category in our case) is set zero [21]. Therefore, in order to assess the impact of each SNAP category on ozone mixing ratio and PM2.5 concentration 10 sets of simulations are performed. In each simulation emissions from one SNAP category over the European land is excluded. The impact of the emissions of a SNAP category is computed as the difference between the base case and the simulation without this emissions category. However, given that zero-out modeling is a sensitivity method, it does not provide source apportionment for non-linear systems as the sum of zero-out impacts over all sources will not equal the total concentration. The simulations are performed for July 2006 using a spin up time of 10 days (i.e., 21–30 June). To be consistent with our previous published results [9,18], here we present changes in the daily average Max8hrO3 mixing ratio and PM2.5 concentration. According to the Directive 2008/50/EC of the European Parliament and of the Council of 21 May 2008 on ambient air quality and cleaner air for Europe [22], the daily average Max8hrO3 is selected by examining eight-hour running averages, calculated from hourly data and updated each hour. This Directive sets the daily average Max8hrO3 mixing ratio as the target value for avoiding, preventing or reducing harmful effects on human health and/or the environment and points out that the results of modeling and/or indicative measurement shall be taken into account for the assessment of air quality with respect to the target values.

3. Results and Discussion

Road transport (SNAP 7) is the major source of NOX and CO emissions over the European land in July 2006, contributing about 42% and 50% of the total NOX and CO emissions, respectively (Figure 2). Power generation (SNAP 1) is the major source of SO2 emissions (about 66%), while agricultural activities (SNAP 10) are dominant in NH3 emissions (about 93%). Solvent use (SNAP 6) is the major source of anthropogenic NMVOC emissions (about 41%) while industrial sources (SNAP 4) emit the highest particles amount (about 24% for primary PM2.5 and 21% for primary PM10).
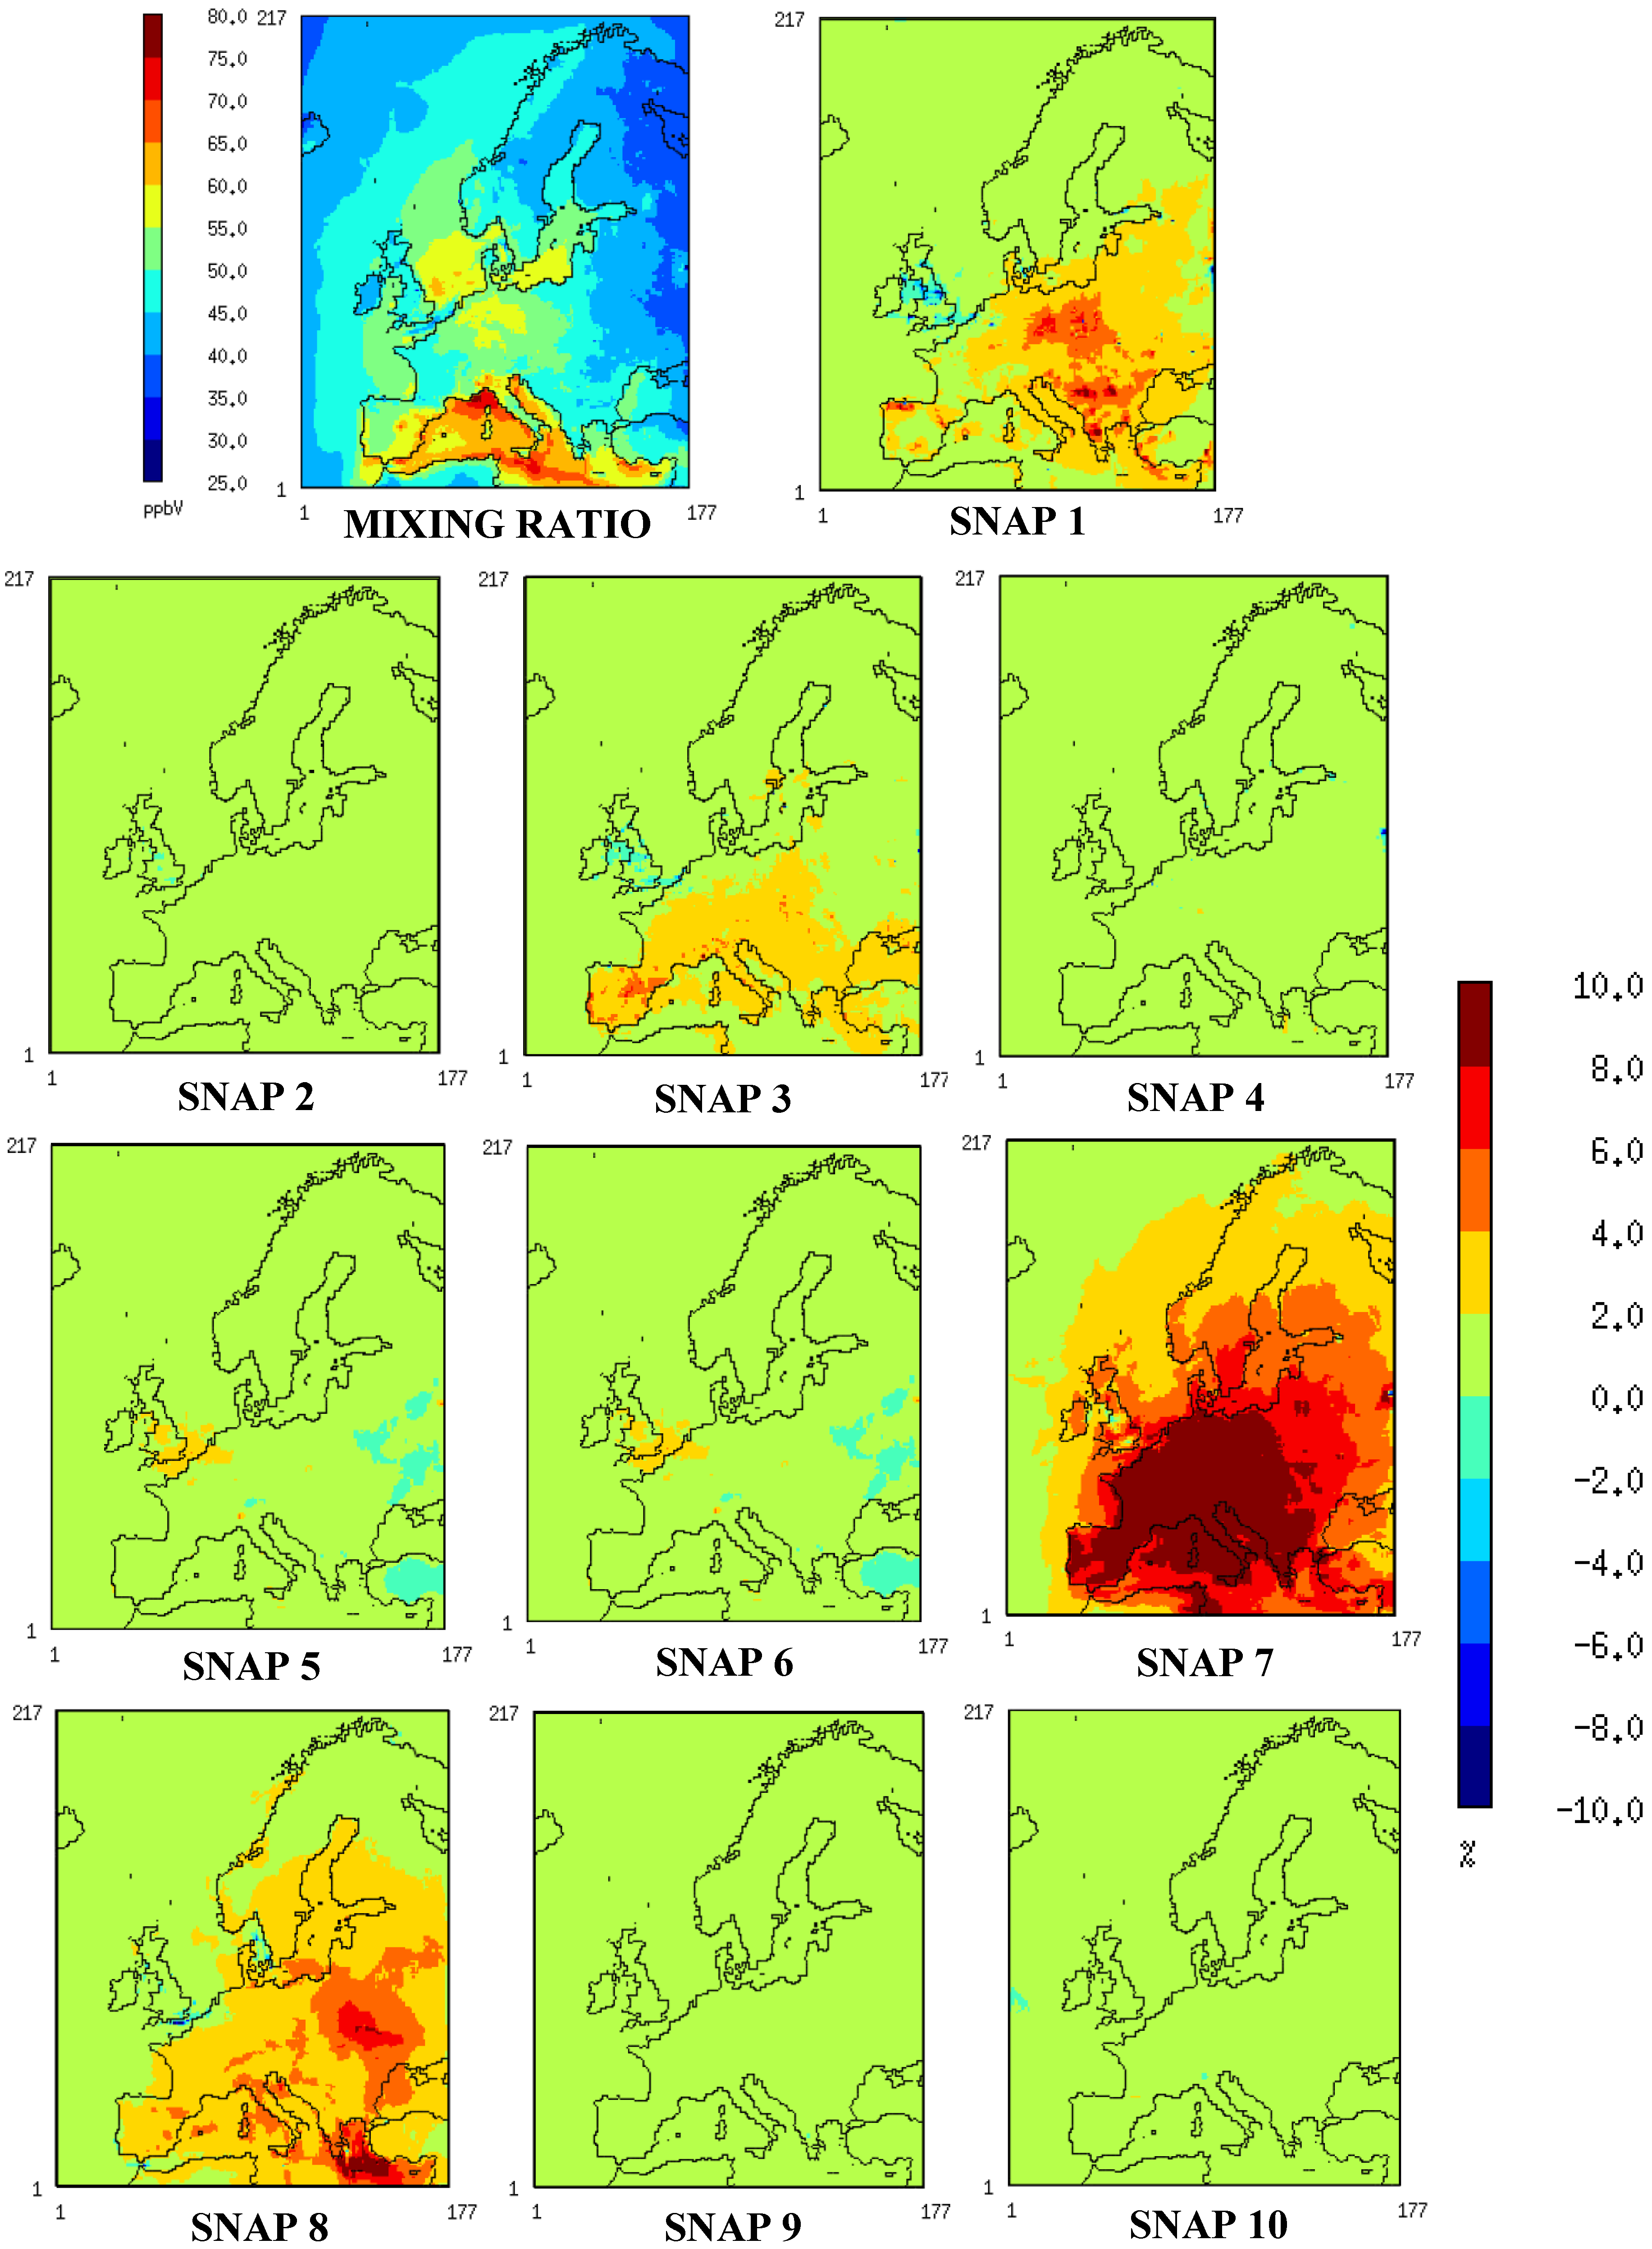
SNAP 7 (road transport) is estimated to have the major impact on Max8hrO3 mixing ratio for July 2006 (Figure 3), since ozone is formed from the photochemical oxidation of VOCs in the presence of nitrogen oxides, and road transport is mainly responsible for the NOX emissions (Figure 2). Max8hrO3 mixing ratio is increased by 6.8% on average over Europe when emissions from SNAP 7 are included. However, an increase more than 10% is simulated over most of Europe while locally (i.e., northern Italy and southern Germany) it is more than 20%. Ranking the importance of the rest of the SNAP categories on Max8hrO3 mixing ratio, an increase by 2.9%, 2.1%, 1.7% on average over Europe is simulated when emissions from SNAP 8 (other mobile sources), SNAP 1 (power generation) and SNAP 3 (industrial combustion), respectively, are included. However, the increase could be a little bit higher than 10%, locally. A minor impact is simulated for the rest of the SNAP categories since Max8hrO3 mixing ratio is simulated to increase up to 0.5% on average over Europe (locally up to 4%) when emissions from each of these SNAP categories are included.
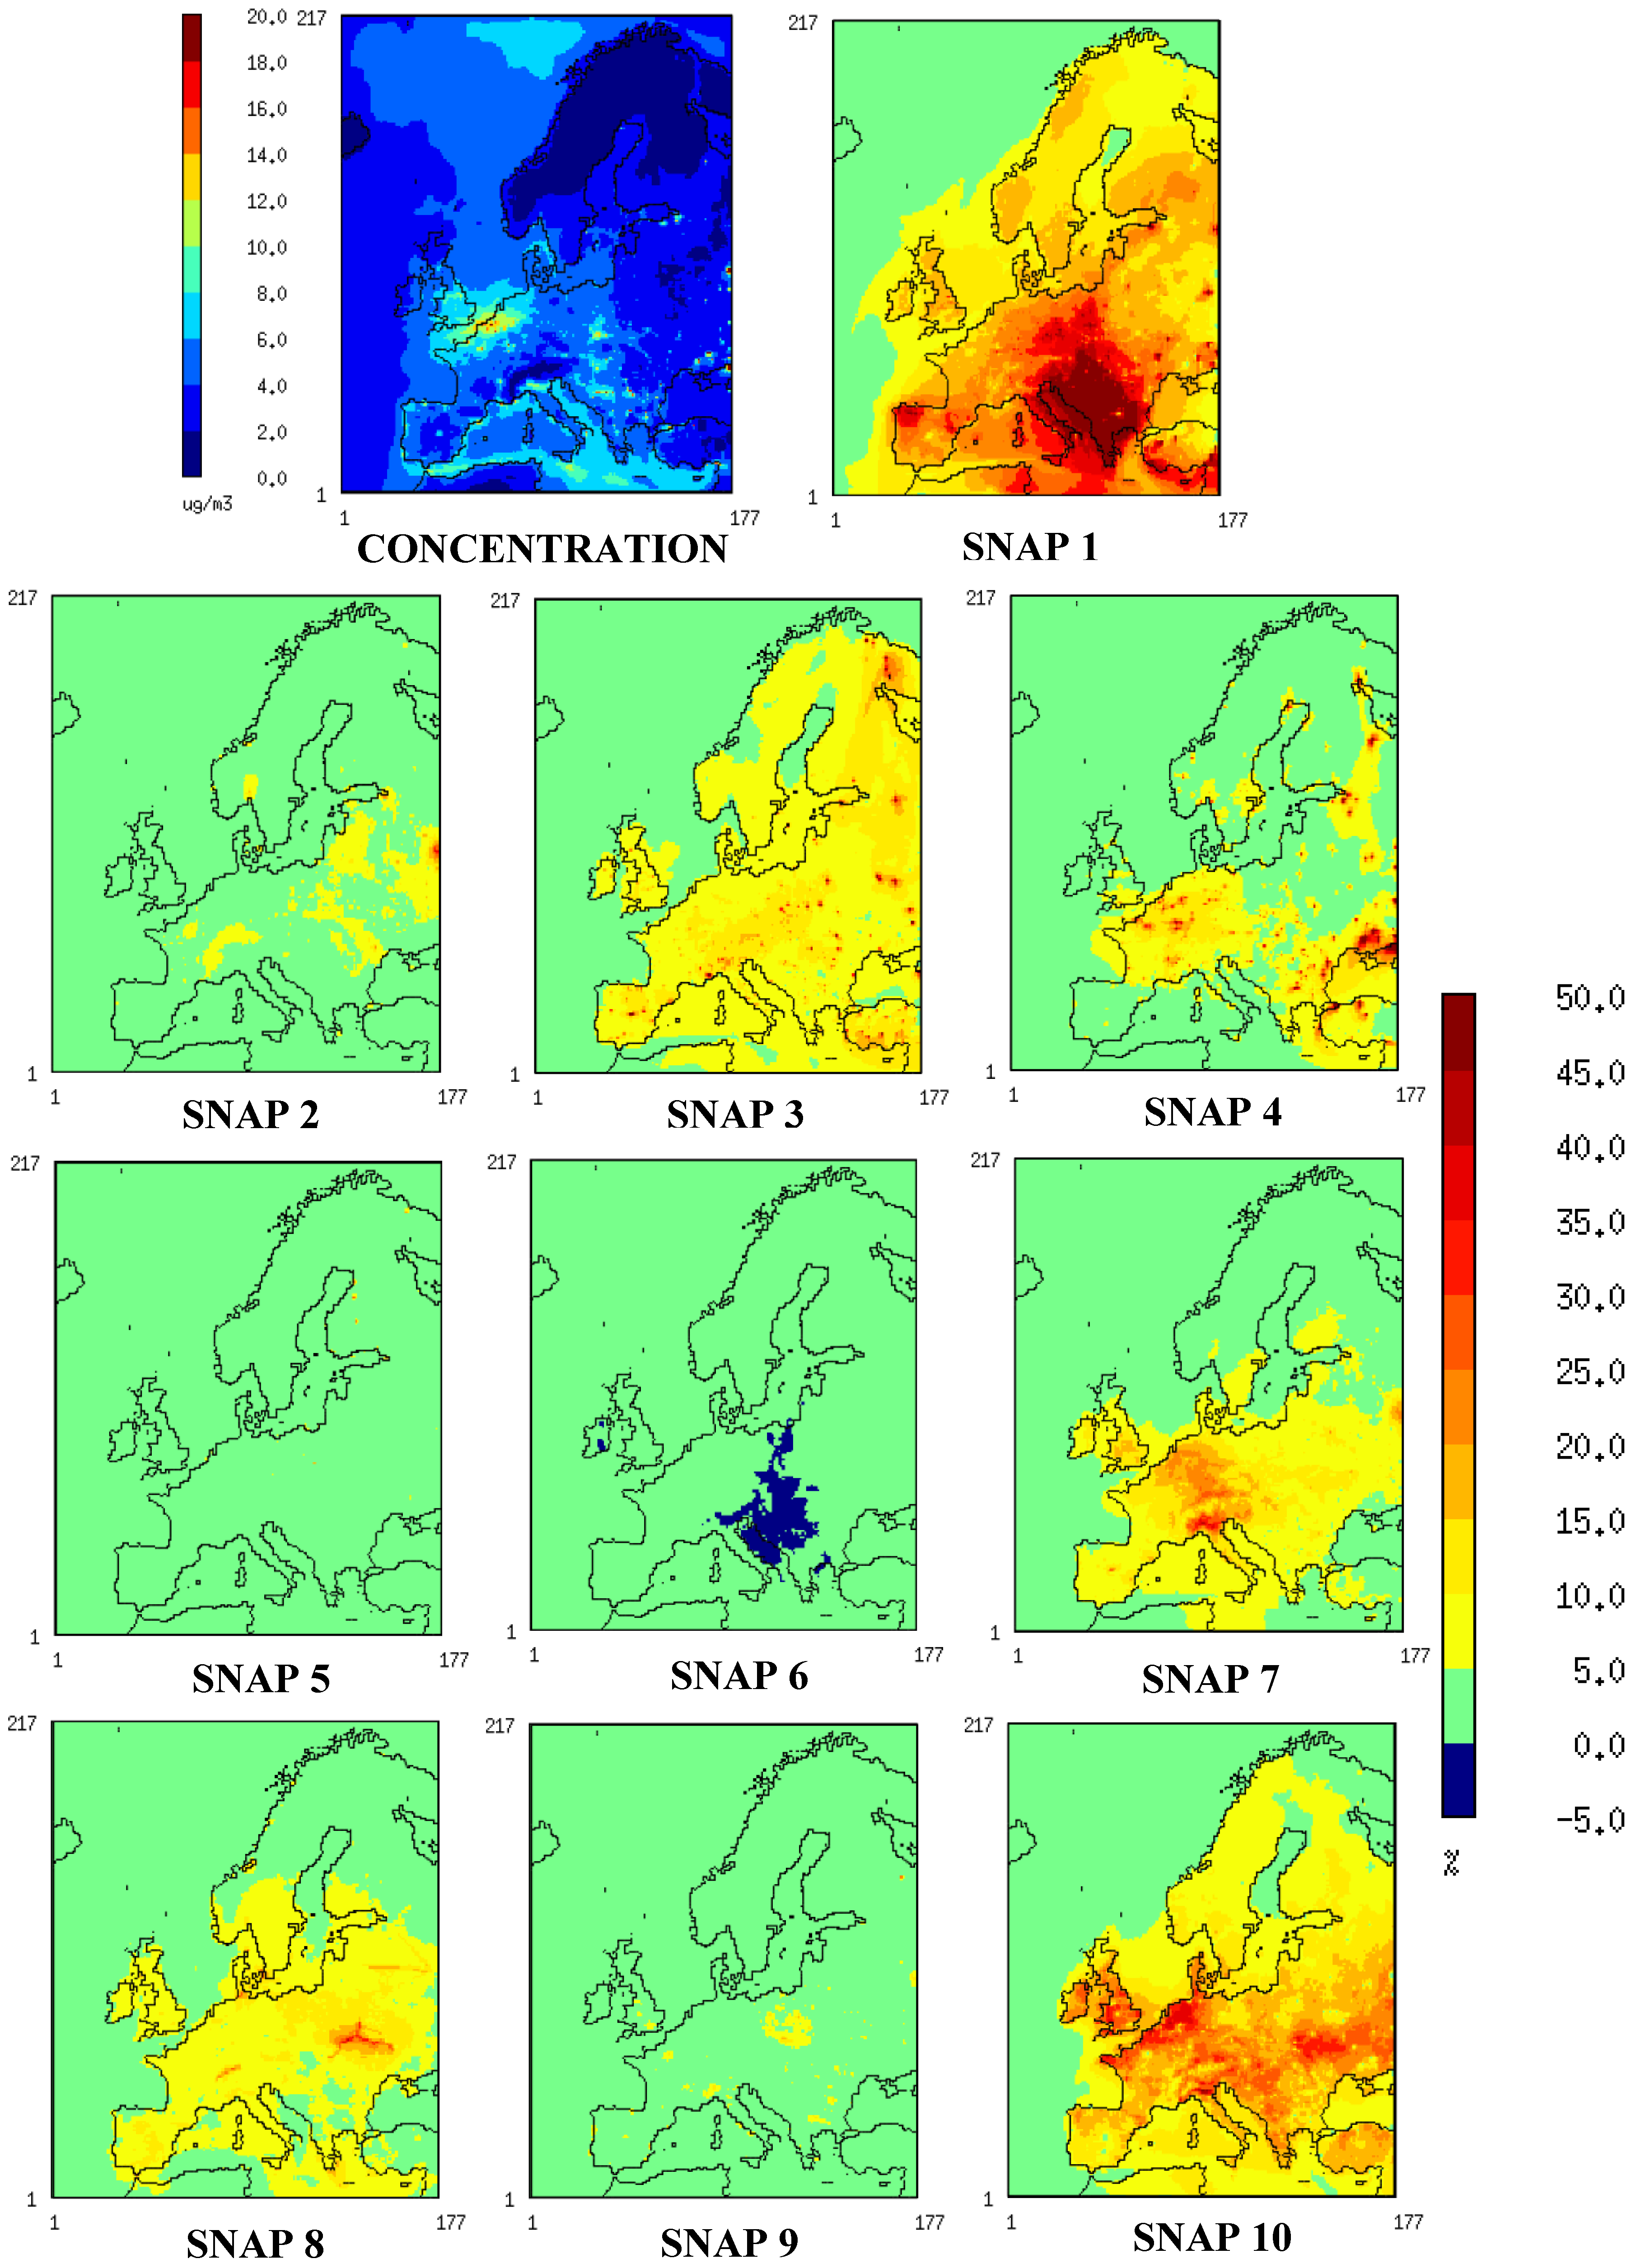
Atmospheric SO2 is oxidized to sulfuric acid which reacts with ammonia to form ammonium sulfate, while gas-phase NOX oxidizes to nitric acid which reacts with ammonia to form ammonium nitrate. Therefore, SNAP 1 (power generation) is estimated to have the major impact on PM2.5 concentrations for July 2006 (Figure 4), since power generation is the major source of the emitted SO2 (Figure 2). PM2.5 concentration is increased by 22.9% on average over Europe when emissions from SNAP 1 are included. However, an increase more than 40% is simulated over most of Europe while locally in southeastern Europe it is more than 60%. SNAP 10 (agriculture) is also playing an important role on PM2.5 concentrations, since agriculture is the major source of NH3 emissions. An increase of 16.1% on average over Europe is simulated when emissions from SNAP 10 are included, while in regions with elevated NH3 emissions (e.g., Belgium, the Netherlands, and northern Italy), the increase is up to 40%. Ranking the importance of the rest of the SNAP categories on PM2.5 concentrations: SNAP 3 (industrial combustion) contributes 18% and 13% of the total SO2 and NOX emissions, respectively; SNAP 7 (road transport) contributes 42% of the total NOX emissions; SNAP 4 (industrial processes) contributes 24% of primary PM2.5 emissions; SNAP 8 (other mobile sources) contributes 20% of the total NOX emissions. Therefore, an increase by 8.9%, 8.6%, 7.3%, 7.1% on average over Europe is simulated when emissions from SNAP 3, SNAP 7, SNAP 4 and SNAP 8, respectively, are included. A minor impact is simulated for the rest of the SNAP categories (increase up to 3% on average over Europe when emissions from each of these SNAP categories are included), while the inclusion of SNAP 6 (solvent use) leads to a minor decrease (up to 1.2%) on PM2.5 concentrations, locally. Given that SNAP 6 is mainly responsible for anthropogenic NMVOC emissions (41% of the total anthropogenic NMVOCs) their inclusion leads to a reduction of OH, slowing down the gas phase formation of sulfate (through SO2 oxidation).
Figure 2. Contribution of each Standard Nomenclature for Air Pollution (SNAP) category to the pollutants emitted over the European land for July 2006.
Atmosphere 06 01119 g002
Figure 3. Daily average Max8hrO3 mixing ratio for July 2006 and the impact of each SNAP category.
Atmosphere 06 01119 g003
Figure 4. Daily average PM2.5 concentration for July 2006 and the impact of each SNAP category.
Atmosphere 06 01119 g004
In a recent study [23], the health-related economic externalities of air pollution resulting from the different emission sectors are assessed. They found that power production, agriculture, road traffic and non-industrial domestic combustion are the major contributors to health-related external costs. Although an analytic comparison could not be performed since we assess the impact of each emission sector on ozone and PM2.5, there is an agreement for the role of power generation (SNAP1), agriculture (SNAP 10) and road transport (SNAP 7) categories. On the other hand, residential-commercial and other combustion (SNAP 2) have a minor impact in our analysis since we focus on a summer month during which emissions from this category are low [17].

4. Conclusions

Road transport (SNAP 7) is estimated to have the major impact on Max8hrO3 mixing ratio for simulations performed for July of 2006. The importance of the rest of the SNAP categories on Max8hrO3 mixing ratio is ranked as: other mobile sources (SNAP 8), power generation (SNAP 1) and industrial combustion (SNAP 3). A minor impact is simulated for the rest of the SNAP categories. Power generation (SNAP 1) is estimated to have a major impact on PM2.5 concentration while agriculture (SNAP 10) also plays an important role for simulations performed for July of 2006. The importance of the rest of the SNAP categories on PM2.5 concentrations is ranked as: industrial combustion (SNAP 3), road transport (SNAP 7), industrial processes (SNAP 4) and other mobile sources (SNAP 8). A minor impact is simulated for the rest of the SNAP categories. These results can contribute to an integrated assessment for air quality management in Europe.

Acknowledgments

Financial support from the EnTeC FP7 Capacities programme (REGPOT-2012-2013-1, FP7, ID: 316173), is kindly acknowledged.

Author Contributions

Efthimios Tagaris and Rafaella Eleni P. Sotiropoulou prepared the manuscript. Nikos Gounaris worked on the emission inventories. Spyros Andronopoulos and Diamando Vlachogiannis contributed to the discussion.

Conflicts of Interest

The authors declare no conflict of interest.

References

  1. Karnosky, D.F.; Skelly, J.M.; Percy, K.E.; Chappelka, A.H. Perspectives regarding 50 years of research on effects of tropospheric ozone air pollution on US forests. Environ. Pollut. 2007, 147, 489–506. [Google Scholar] [CrossRef] [PubMed]
  2. Raaschou-Nielsen, O.; Andersen, Z.J.; Beelen, R.; Samoli, E.; Stafogia, M.; Weinmayr, G.; Hoffmann, B.; Fischer, P.; Nieuwenhuijsen, M.J.; Brunekreef, B.; et al. Air pollution and lung cancer incidence in 17 European cohorts: Prospective analyses from the European Study of Cohorts for Air Pollution Effects (ESCAPE). Lancet Oncol. 2013, 14, 813–822. [Google Scholar] [CrossRef]
  3. Greenberg, J.P.; Guenther, A.; Zimmermann, P.; Baugh, W.; Geron, C.; Davis, K.; Helmig, D.; Klinger, L.F. Tethered balloon measurements of biogenic VOCs in the atmospheric boundary layer. Atmos. Environ. 1999, 33, 855–867. [Google Scholar] [CrossRef]
  4. Seinfeld, J.; Pandis, S.N. Atmospheric Chemistry and Physics; John Wiley: Hoboken, NJ, USA, 2006; p. 720. [Google Scholar]
  5. SNAP—Standard Nomenclature for Air Pollution categories. Available online: www.emep.int/UniDoc/node7.html (accessed on 28 July 2015).
  6. Kuenen, J.; van der Gon, H.D.; Visschedijk, A.; Dröge, R.; van Gijlswijk, R. MACC European Emission Inventory for the Years 2003–2007; The Netherlands Organisation Report, TNO-060-UT-2011-00588; Utrecht, The Netherlands, 2011; p. 49. [Google Scholar]
  7. Aksoyoglu, S.; Keller, J.; Oderbolz, D.C.; Barmpadimos, I.; Prevot, A.S.H.; Baltensperger, U. Sensitivity of ozone and aerosols to precursor emissions in Europe. Int. J. Environ. Pollut. 2012, 50, 451–459. [Google Scholar] [CrossRef]
  8. Megaritis, A.G.; Fountoukis, C.; Charalampidis, P.E.; Pilinis, C.; Pandis, S.N. Response of fine particulate matter concentrations to changes of emissions and temperature in Europe. Atmos. Chem. Phys. 2013, 13, 3423–3443. [Google Scholar] [CrossRef]
  9. Tagaris, E.; Sotiropoulou, R.E.P.; Gounaris, N.; Andronopoulos, S.; Vlachogiannis, D. Air quality over Europe: Modeling gaseous and particulate pollutants. Atmos. Chem. Phys. 2013, 13, 9661–9673. [Google Scholar] [CrossRef]
  10. Grell, G.; Dudhia, J.; Stauffer, D.R. A Description of the Fifth Generation Penn State/NCAR Mesoscale Model (MM5); NCAR Tech. Note, NCAR/TN-398+STR; NCAR: Boulder, CO, USA, 1994; p. 128. [Google Scholar]
  11. Byun, D.W.; Schere, K.L. Review of the governing equations, computational algorithms, and other components of the Models-3 Community Multscale Air Quality CMAQ) modeling system. App. Mech. Rev. 2006, 59, 51–77. [Google Scholar] [CrossRef]
  12. Foley, K.M.; Roselle, S.J.; Appel, K.W.; Bhave, P.V.; Pleim, J.E.; Otte, T.L.; Mathur, R.; Sarwar, G.; Young, J.O.; Gilliam, R.C.; et al. Incremental testing of the Community Multiscale Air Quality (CMAQ) modeling system version 4.7. Geosci. Model Dev. 2010, 3, 205–226. [Google Scholar] [CrossRef]
  13. Vautard, R.; Moran, M.D.; Solazzo, E.; Gilliam, R.C.; Matthias, V.; Bianconi, R.; Chemel, C.; Ferreira, J.; Geyer, B.; Hansen, A.B.; et al. Evaluation of the meteorological forcing used for the Air Quality Model Evaluation International Initiative (AQMEII) air quality simulations. Atmos. Environ. 2012, 53, 15–37. [Google Scholar] [CrossRef] [Green Version]
  14. AQMEII - Air Quality Modelling Evaluation International Initiative. Available online: http://aqmeii.jrc.ec.europa.eu (accessed on 28 July 2015).
  15. Byun, D.W.; Pleim, J.E.; Tang, R.T.; Bourgeois, A. Meteorology-Chemistry Interface Processor (MCIP) for Models-3 Community Multiscale Air Quality (CMAQ) Modeling System. In Science algorithms of the EPA Models-3 Community Multiscale Air Quality (CMAQ) Modeling System. US Environmental Protection Agency Report; EPA-600/R-99/030, 12-1-12-91; EPA: Washington, DC, USA, 1999. [Google Scholar]
  16. SMOKE—Sparse Matrix Operator Kernel Emissions modeling system. Available online: www.smoke-model.org/index.cfm (accessed on 28 July 2015).
  17. van der Gon, H.D.; Hendriks, C.; Kuenen, J.; Segers, A.; Visschedijk, A. Description of Current Temporal Emission Patterns and Sensitivity of Predicted AQ for Temporal Emission Patterns; TNO Report, EU FP7 MACC Deliverable Report D_D-EMIS_1.3; Utrecht, The Netherlands, 2011; p. 22. [Google Scholar]
  18. Tagaris, E.; Sotiropoulou, R.E.P.; Gounaris, N.; Andronopoulos, S.; Vlachogiannis, D. Impact of biogenic emissions on ozone and fine particles over Europe: Comparing effects of temperature increase and a potential anthropogenic NOx emissions abatement strategy. Atmos. Environ. 2014, 98, 214–223. [Google Scholar] [CrossRef]
  19. Yarwood, G.; Rao, S.; Yocke, M.; Whitten, G.Z. Updates to the Carbon Bond Chemical Mechanism: CB05; Final Report to the US Environmental Protection Agency, RT-0400675; Research Triangle Park, NC, USA, 2005; p. 246. [Google Scholar]
  20. Baker, K.R.; Kelly, J.T. Single source impacts estimated with photochemical model source sensitivity and apportionment approaches. Atmos. Environ. 2014, 96, 266–274. [Google Scholar] [CrossRef]
  21. Kwok, H.F.; Baker, K.R.; Napelenok, S.L.; Tonnesen, G.S. Photochemical grid model implementation and application of VOC, NOx, and O3 source apportionment. Geosci. Model Dev. 2015, 8, 99–114. [Google Scholar] [CrossRef]
  22. Directive 2008/50/EC of the European Parliament and of the Council of 21 May 2008 on ambient air quality and cleaner air for Europe. Available online: http://eur-lex.europa.eu/legal-content/EN/TXT/PDF/?uri=CELEX:32008L0050&from=%20EN (accessed on 28 July 2015).
  23. Brandt, J.J.; Silver, D.; Christensen, J.H.; Andersen, M.S.; Bønløkke, J.; Sigsgaard, T.; Geels, C.; Gross, A.; Hansen, A.B.; Hansen, K.M.; et al. Contribution from the ten major emission sectors in Europe to the Health-Cost Externalities of Air Pollution using the EVA Model System-an integrated modelling approach. Atmos. Chem. Phys. 2013, 13, 7725–7746. [Google Scholar] [CrossRef]