Article

Chemical Composition of Water Soluble Inorganic Species in Precipitation at Shihwa Basin, Korea

1
National Institute of Environmental Research, 404-708 Inchon, Korea
2
National Institute of Meteorological Research, 697-845 Seogwipo, Korea
3
Department of Environmental Science, Hankuk University of Foreign Studies, 449-791 Yongin, Korea
4
Korea Institute of Ocean Science and Technology, 426-744 Ansan, Korea
*
Author to whom correspondence should be addressed.
Atmosphere 2015, 6(6), 732-750; https://doi.org/10.3390/atmos6060732
Submission received: 24 February 2015 / Accepted: 15 May 2015 / Published: 25 May 2015
(This article belongs to the Special Issue Atmospheric Composition Observations)

Abstract

:
Weekly rain samples were collected in coastal areas of the Shihwa Basin (Korea) from June 2000 to November 2007. The study region includes industrial, rural, and agricultural areas. Wet precipitation was analyzed for conductivity, pH, Cl, NO3, SO42, Na+, K+, Mg2+, NH4+, and Ca2+. The major components of precipitation in the Shihwa Basin were NH4+, volume-weighted mean (VWM) of 44.6 µeq∙L−1, representing 43% of all cations, and SO42, with the highest concentration among the anions (55%) at all stations. The pH ranged from 3.4 to 7.7 with a VMM of 4.84. H+ was weakly but positively correlated with SO42 (r = 0.39, p < 0.001) and NO3 (r = 0.38, p < 0.001). About 66% of the acidity was neutralized by NH4+ and Ca2+. The Cl/Na+ ratio of the precipitation was 37% higher than seawater Cl/Na+. The high SO42/NO3 ratio of 2.3 is attributed to the influence of the surrounding industrial sources. Results from positive matrix factorization showed that the precipitation chemistry in Shihwa Basin was influenced by secondary nitrate and sulfate (41% ± 1.1%), followed by sea salt and Asian dust, contributing 23% ± 3.9% and 17% ± 0.2%, respectively. In this study, the annual trends of SO42 and NO3 (p < 0.05) increased, different from the trends in some locations, due to the influence of the expanding power generating facilities located in the upwind area. The increasing trends of SO42 and NO3 in the study region have important implications for reducing air pollution in accordance with national energy policy.

1. Introduction

Rain is the most effective process transporting soluble gases and particles from the atmosphere to the ground [1,2]. Precipitation chemistry plays an important role in understanding the air quality in a study area, because the concentrations and distribution of chemical components in rain depend on a variety of emission sources including sea spray, soil particles, and industrial pollutants [3,4,5,6,7].
In coastal areas, the Na+/Cl ratio, SO42, Mg2+, and Ca2+ are useful for evaluating both anthropogenic and natural influences [8]. Soil particles in northern China, Africa, and the Middle East play an important role in neutralizing the acidic components of rain [9]. The concentrations of anthropogenic components are related to energy consumption and the use of fertilizers [10,11].
Some anthropogenic acidic ions may greatly contribute to acidification and eutrophication of aquatic ecosystems [12]. Numerous long-term observations of precipitation have been carried out in Europe, North America, and Asia [13,14,15,16,17]. These studies have reported that SO42 concentrations have decreased commensurate with reductions in SO2 emissions. NO3 concentrations have also shown decreasing trends in regions where NO2 emissions have decreased [18,19,20].
In many regions of Asia, rapid economic growth has led to an increase in pollutant emissions and seriously compromised air quality [21]. In addition, air quality has also been affected by wind-blown soil particles originating from the deserts of Mongolia and northern China [22,23,24]. Several studies conducted in this region have found that the rain is acidic, with H+ concentration ranges similar to that reported for Europe [25,26,27,28].
In Korea, previous studies have shown that most precipitation events are acidic and even in background areas of Korea precipitation pH is <4.9 [29,30,31]. Some studies have suggested that air masses from the Asian continent increase the concentration of anthropogenic components of rainwater in Korea [31,32]. Choi et al. (2015) [33] studied precipitation chemistry in the area near Shihwa Lake (located in the mid-western area of the Korean peninsula), using both urban and background stations to compare precipitation chemistry. To date, precipitation chemistry in the industrial area has not been studied yet.
This study aimed to provide a detailed evaluation of the chemical composition of precipitation in the Shihwa Basin and to evaluate the relative contributions of various sources. Because the Shihwa Basin includes areas with industrial, agricultural, and coastal land use, the study are has experienced serious problems with air pollution [34,35,36,37].

2. Material and Methods
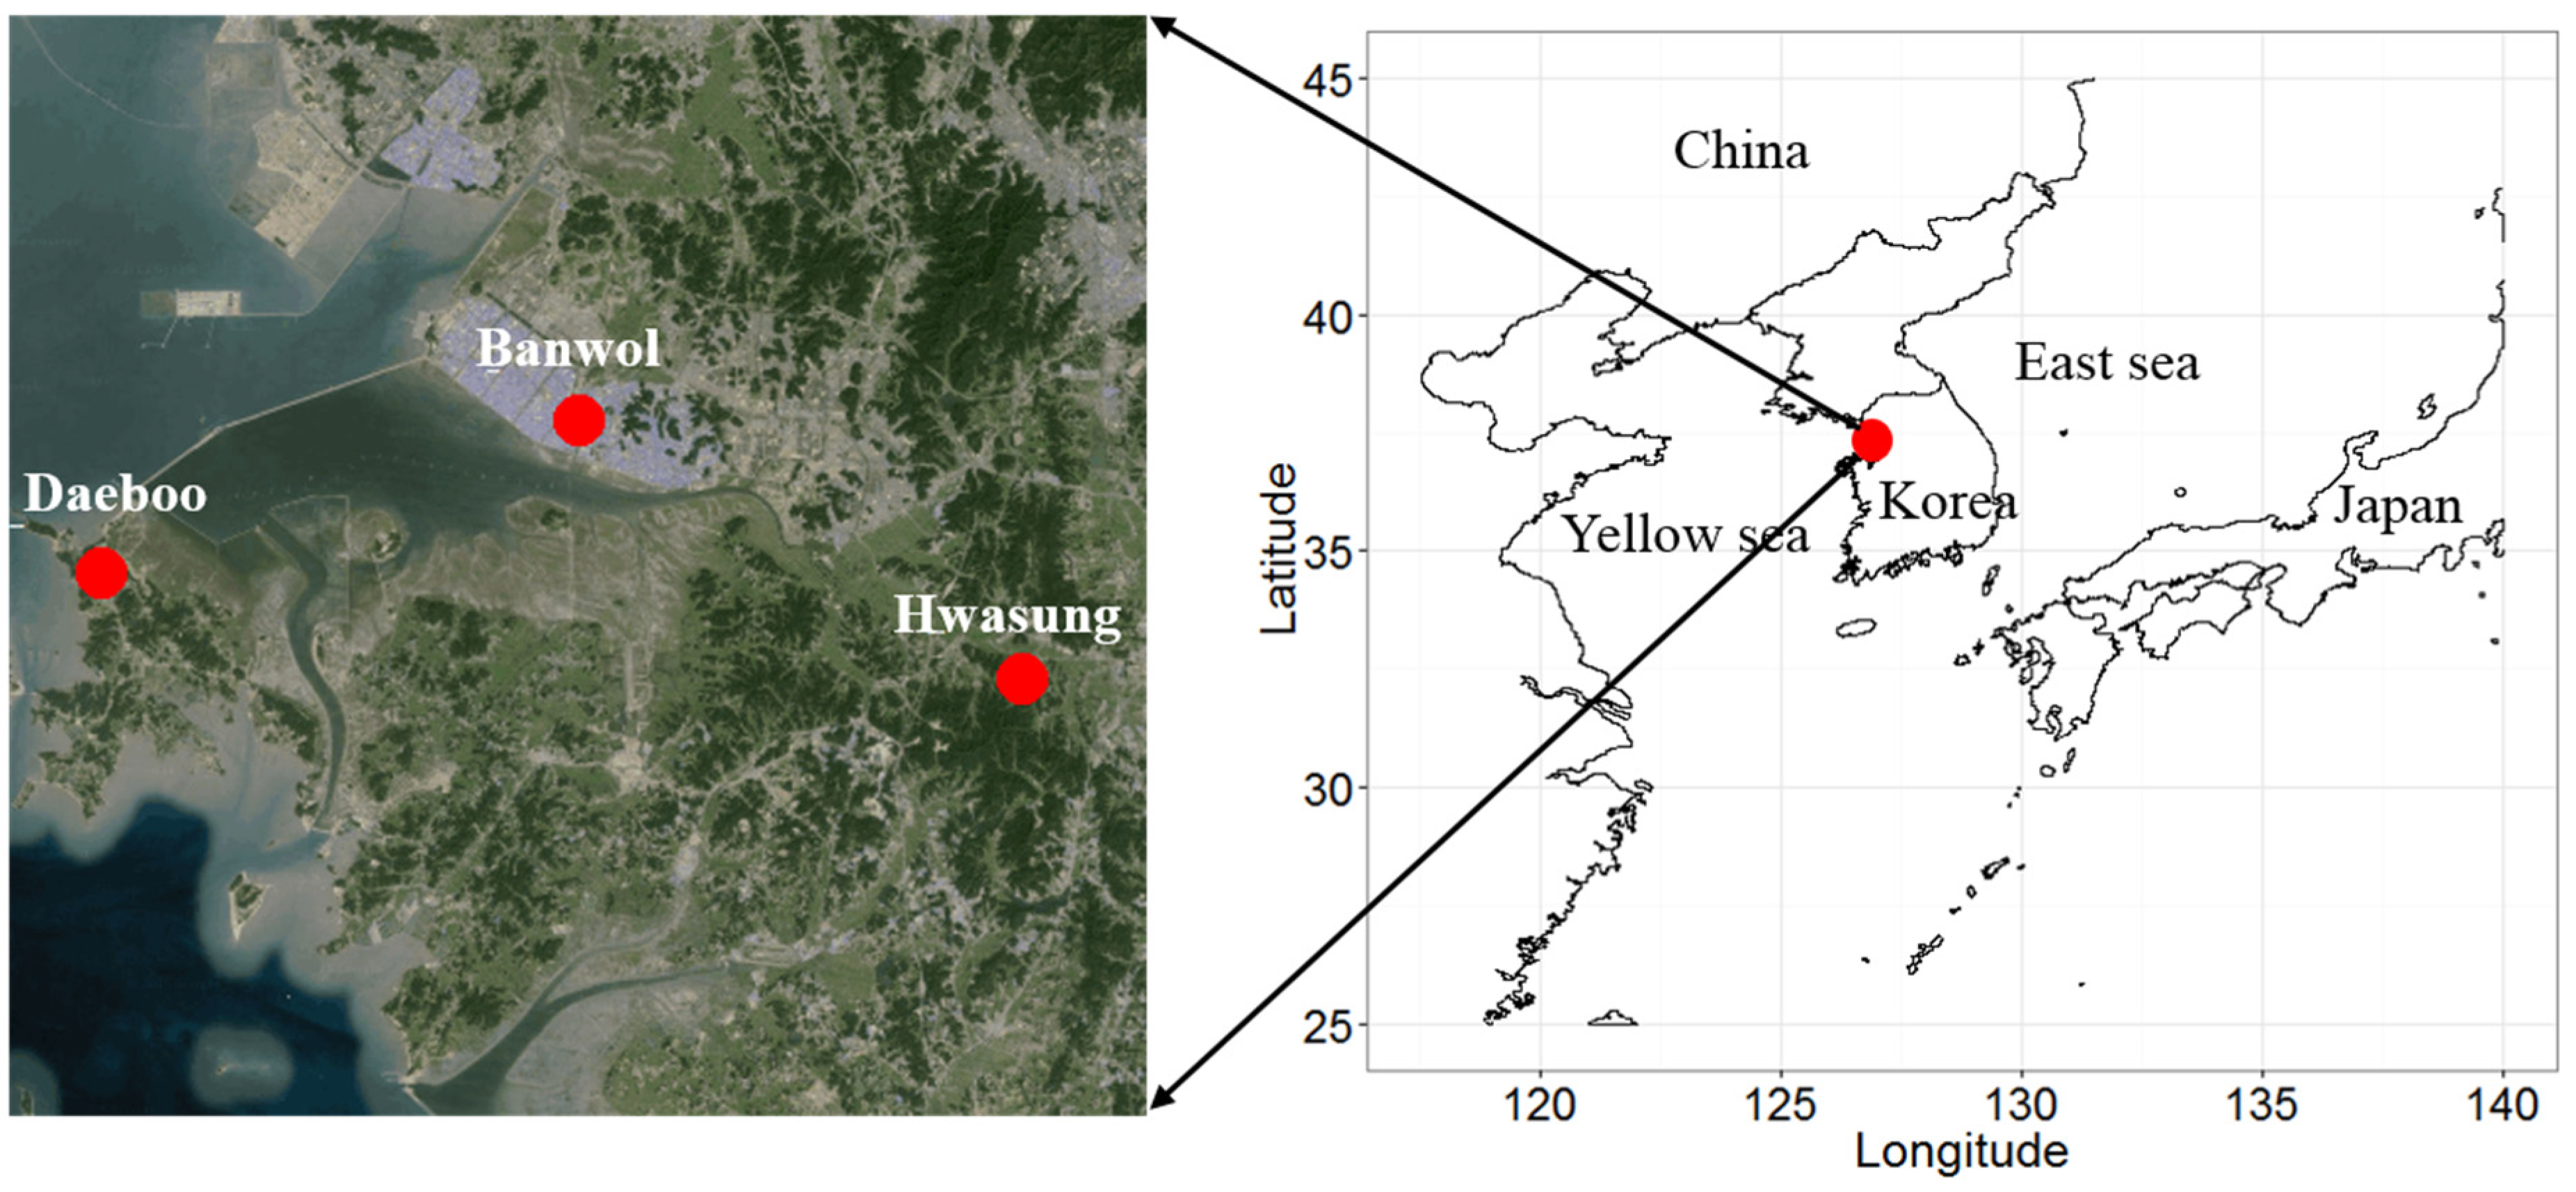
2.1. Sampling Sites

The Shihwa Basin is located 60 km southwest of Seoul, the capital of South Korea. The basin of Shihwa Lake has an area of about 475 km2 and a population of more than 0.8 million people. The Shihwa and Banwol industrial complexes are located in Shihwa Basin. Three sampling stations were selected for precipitation monitoring, covering the southern (Hwasung), northern (Banwol), and western (Daeboo) areas of the Shihwa Basin (Table 1). Hwasung station is located inland about 20 km east of Shihwa Lake, in a residential and rural area. Banwol station is located 5 km east of Shihwa Lake and is important because the Banwol industrial complex is located there. This complex is a site for intensive chemical, leather, and metal processing industries, which have led to air pollution episodes, including pollutants such as ammonia, amines, hydrogen sulfide (H2S) and mercaptans. Daeboo station is located on an island, about 2 km west of Shihwa Lake. The locations of the Shihwa Basin and the three sampling stations are shown in Figure 1.
Table 1. Characteristics of sampling stations in the Shihwa Basin.
Shihwa BasinLatitudeLongitudeElevation (m)Land Type
Hwasung37.236126.91831Rural and residential
Banwol37.315126.75056Industrial
Daeboo37.268126.56825Agricultural
Figure 1. Locations of the study area and sampling stations.
Atmosphere 06 00732 g001
The Shihwa Basin is strongly influenced by air masses driven by westerly winds. According to data from the Incheon meteorological administration (about 20 km north of Shihwa Lake), the average annual rainfall from June 2000 to November 2007 was 1187 mm·year−1. The average temperature and wind speed were 15 °C and 2 m·s−1, respectively. In the summer (June to August), the mean temperature was 24.5 °C and about 61% of the annual precipitation occurred during this season. In winter, the average temperature was 3.5 °C with only 5% of the annual precipitation occurring during winter. The spring season is characterized by the influence of Asian dust, with an average wind speed of 3.67 m·s−1, 58% higher than that in winter. According to AWS data from Korea Meteorological Administration near the three sites, the prevailing wind directions were north and south at Hwasung station, east and west at Banwol station and northwest at Daeboo station. At Hwasung, the wind during spring and summer was north, but south during fall and winter. At Banwol and Daeboo stations, the prevailing wind was constant throughout the year.

2.2. Sample Collection

Precipitation samples were collected weekly using wet and dry collectors from June 2000 to November 2007. Butler and Likens (1998) [38] found that daily samples may provide a better estimate of actual rain chemistry than weekly samples. Gilliland et al. (2002) [39] also suggested that considerable monthly variation existed between daily and weekly data for H+, NH4+ and SO42. All of the samplers were placed 1 m from the ground, and the wet sample collector was covered with a lid to prevent any contamination from dry deposition. The wet collector uses a conductivity sensor, which automatically opens at the onset of each precipitation event and closes again when a rain event stops. The automated samplers consisted of two Teflon buckets 28 cm in diameter. The average precipitation intensity for onset was 40 ± 59 mm/week during the study period. Before sampling, the buckets were carefully rinsed with deionized water several times until the conductivity of the water was <1.5 µS·cm−1. Precipitation samples were collected in a 30-mL high-density polyethylene bottle. The samples were unrefrigerated during sampling but stored in a freezer at −20 °C until chemical analysis. Prior to analysis, the precipitation samples were filtered using 0.45-µm membrane filters (Millipore).

2.3. Sample Analysis

After the precipitation samples were collected, the weight of the bucket was measured to calculate the volume-weighted mean (VWM) concentrations of the atmospheric components. The pH and conductivity of the unfiltered precipitation were also measured immediately with a pH and conductivity meters (Fisher Scientific) [40]. The pH meter was calibrated before each measurement using standard 4.00 and 7.01 buffer solutions. The conductivity meter was also calibrated with a standard solution. For this study, 528 rain samples were analyzed. Major anion and cation concentrations were determined using ion chromatography (Waters, USA). For anions (Cl, NO3, and SO42), AS14 or AS11 columns were used; CS12A or CS14 columns were used to measure cations (Na+, NH4+, K+, Mg2+, and Ca2+). The detection limits were 0.08 µeq∙L−1 for Cl, 0.12 µeq∙L−1 for NO3, 0.11 µeq∙L−1 for SO42, 0.54 for Na+, 2.32 µeq∙L−1 for NH4+, 0.2 µeq∙L−1 for K+, 0.44 µeq∙L−1 for Mg2+ and 2.87 µeq∙L−1 for Ca2+. Detection limits were calculated by dividing the standard deviation of the response by the slope of the calibration and then multiplying by 3.3.

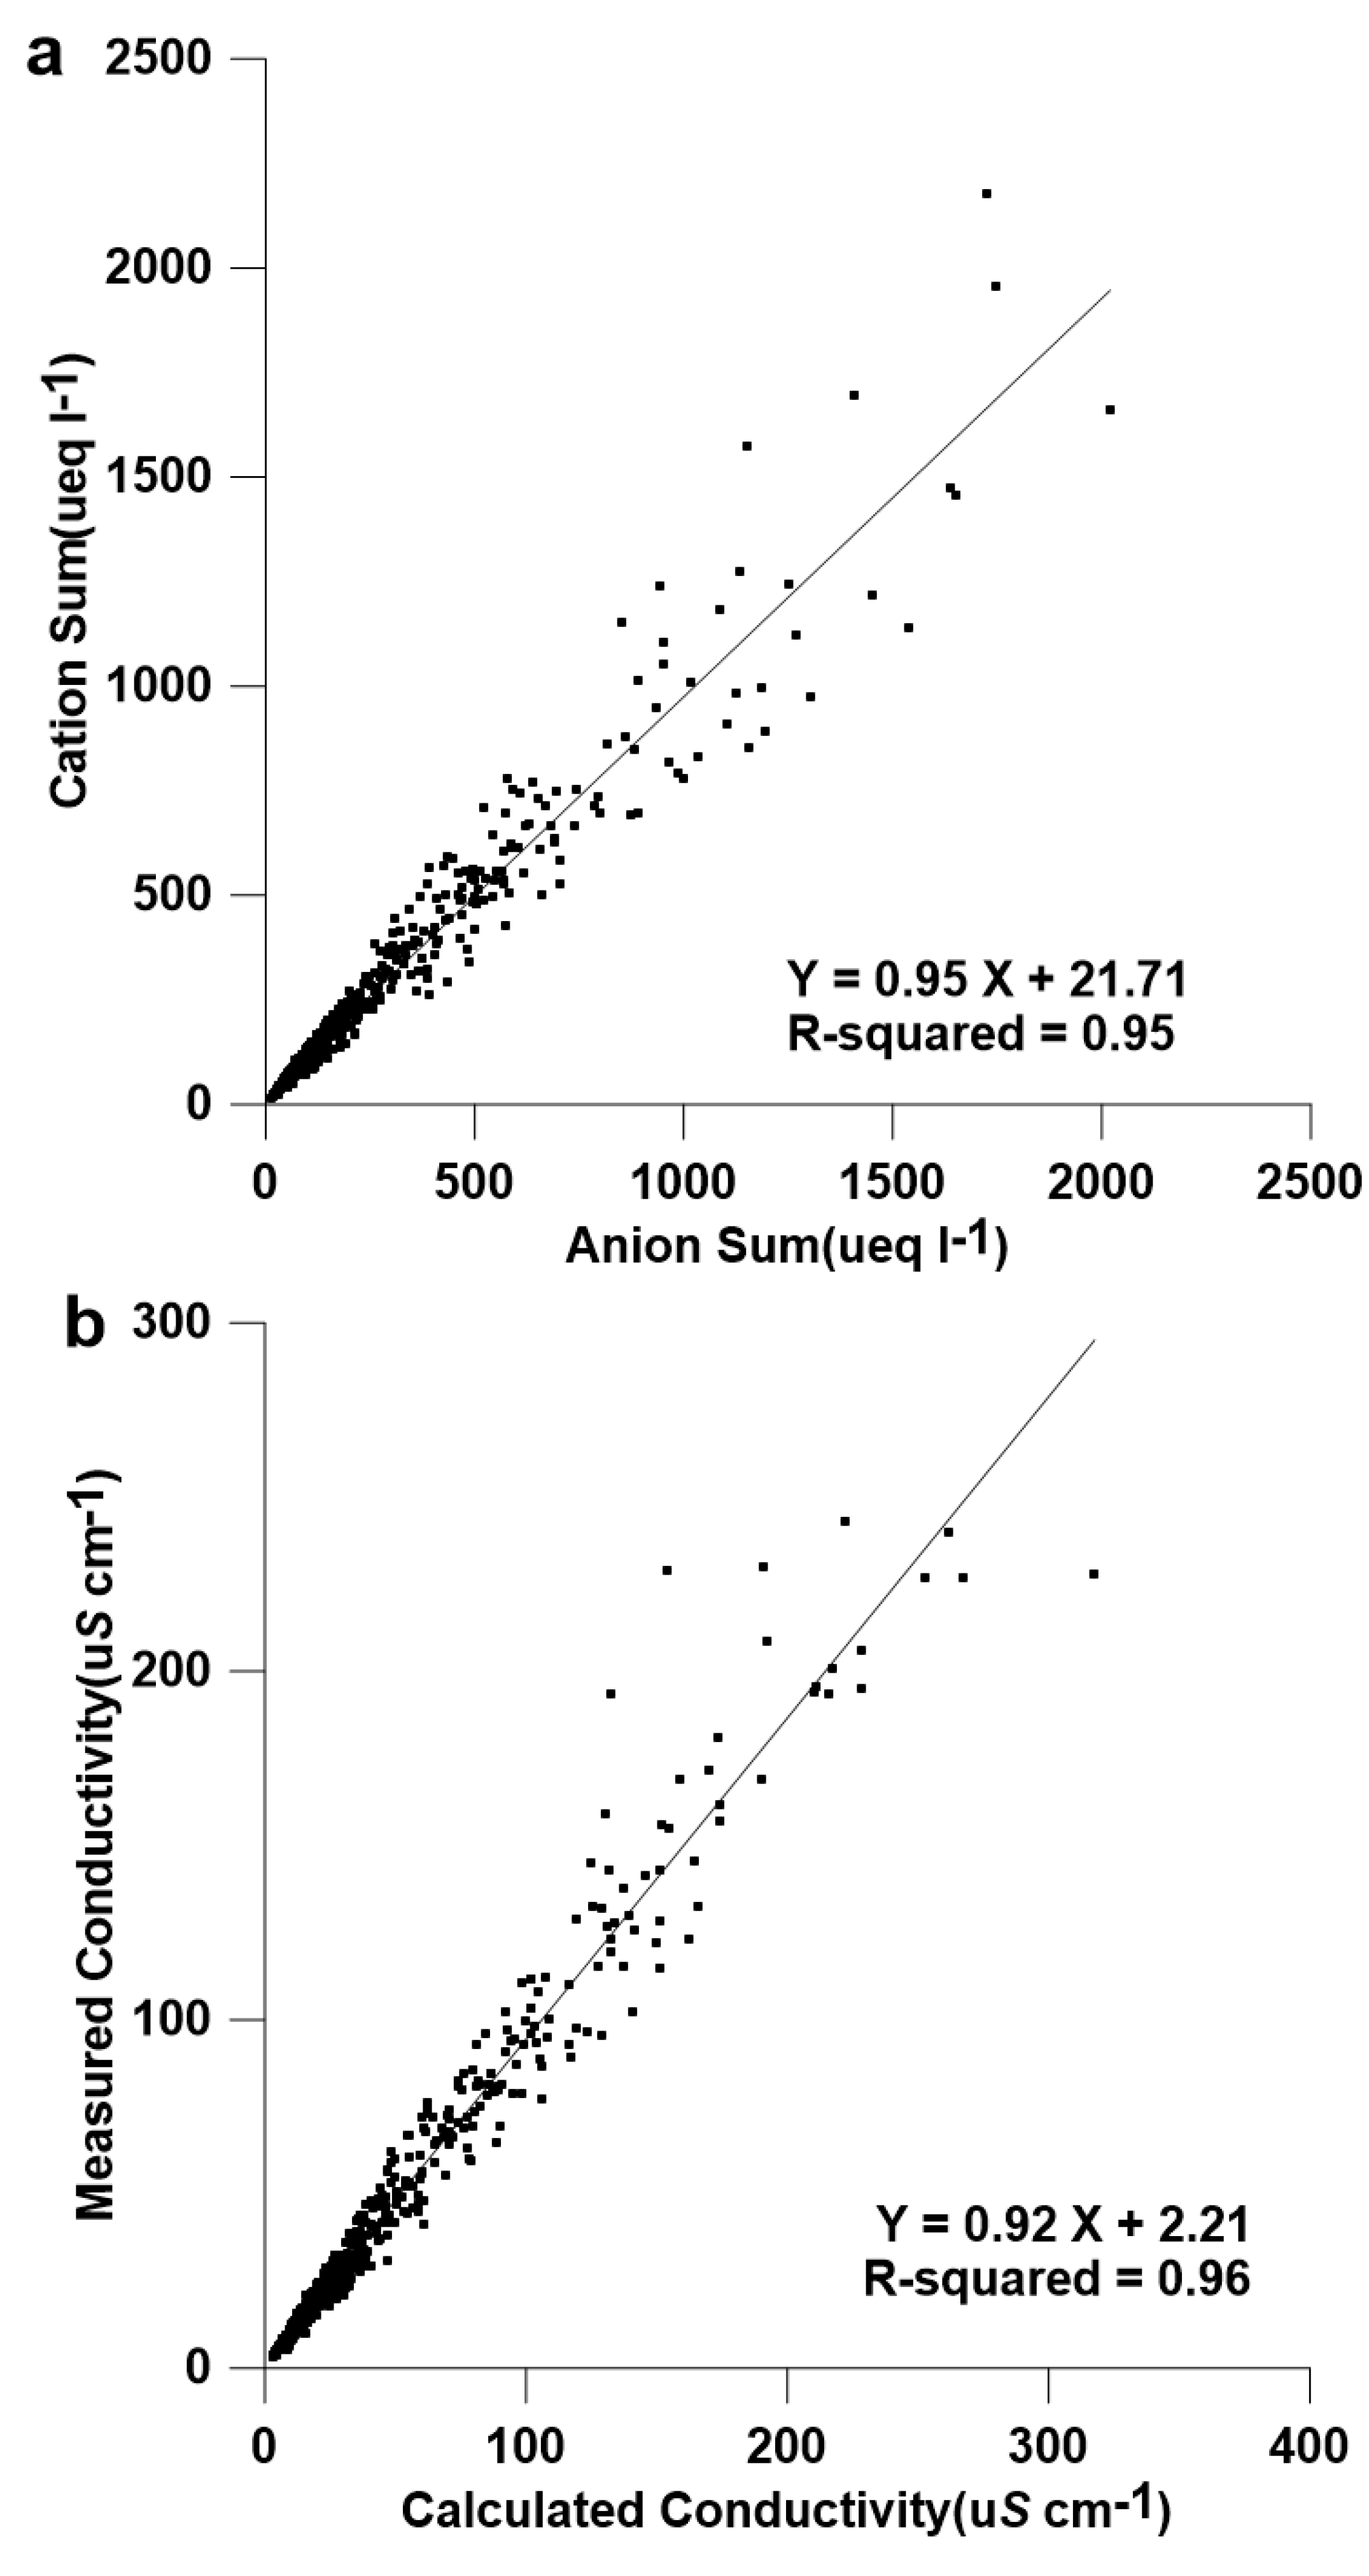
2.4. Quality Assurance

Of the 678 precipitation samples collected, about 7% were discarded because the amount of precipitation was insufficient to perform the chemical analyses. An additional 12% of the rain samples were discarded due to noticeable contamination by dry deposition (soil, leafs and insects) or because of sampler malfunction [41]. The remaining samples were subjected to a quality check based on ionic balance and conductivity balance. When the pH was above 5.6, the concentration of HCO3 (in µeq∙L−1) was calculated using the formula (HCO3) = 10(pH − 11.24) [42,43,44]. According to Okuda et al. (2005) [15], the acceptable ion range (∑ cation/∑ anion) and conductivity (∑ measured conductivity/∑ anion conductivity) ratio for a rain sample is 0.67–1.5. Data points outside this range were excluded. The percentage of samples excluded at each sampling station was 38% at Hwasung, 21% at Banwol, and 32% at Daeboo, averaging 30% overall. Linear regression of the relationship between cation sum vs. the anion sum showed an r2 = 0.95 and slope of 0.95 (Figure 2a,b). Edmonds et al. (1991) [45] suggested that anion deficit means of the amount of unmeasured organic acids. Kim et al. (2013) [32] found that the organic acids (CH3COO, HCOO) contributed to 12.4% of the acidity in precipitation at Jeju Island in Korea. The relationship between the calculated and measured conductivity was also highly correlated with a r2 = 0.96 and slope of 0.92.
Figure 2. Linear regression (a) between the sum of cations and anions, and (b) between measured and calculated conductivity.
Atmosphere 06 00732 g002

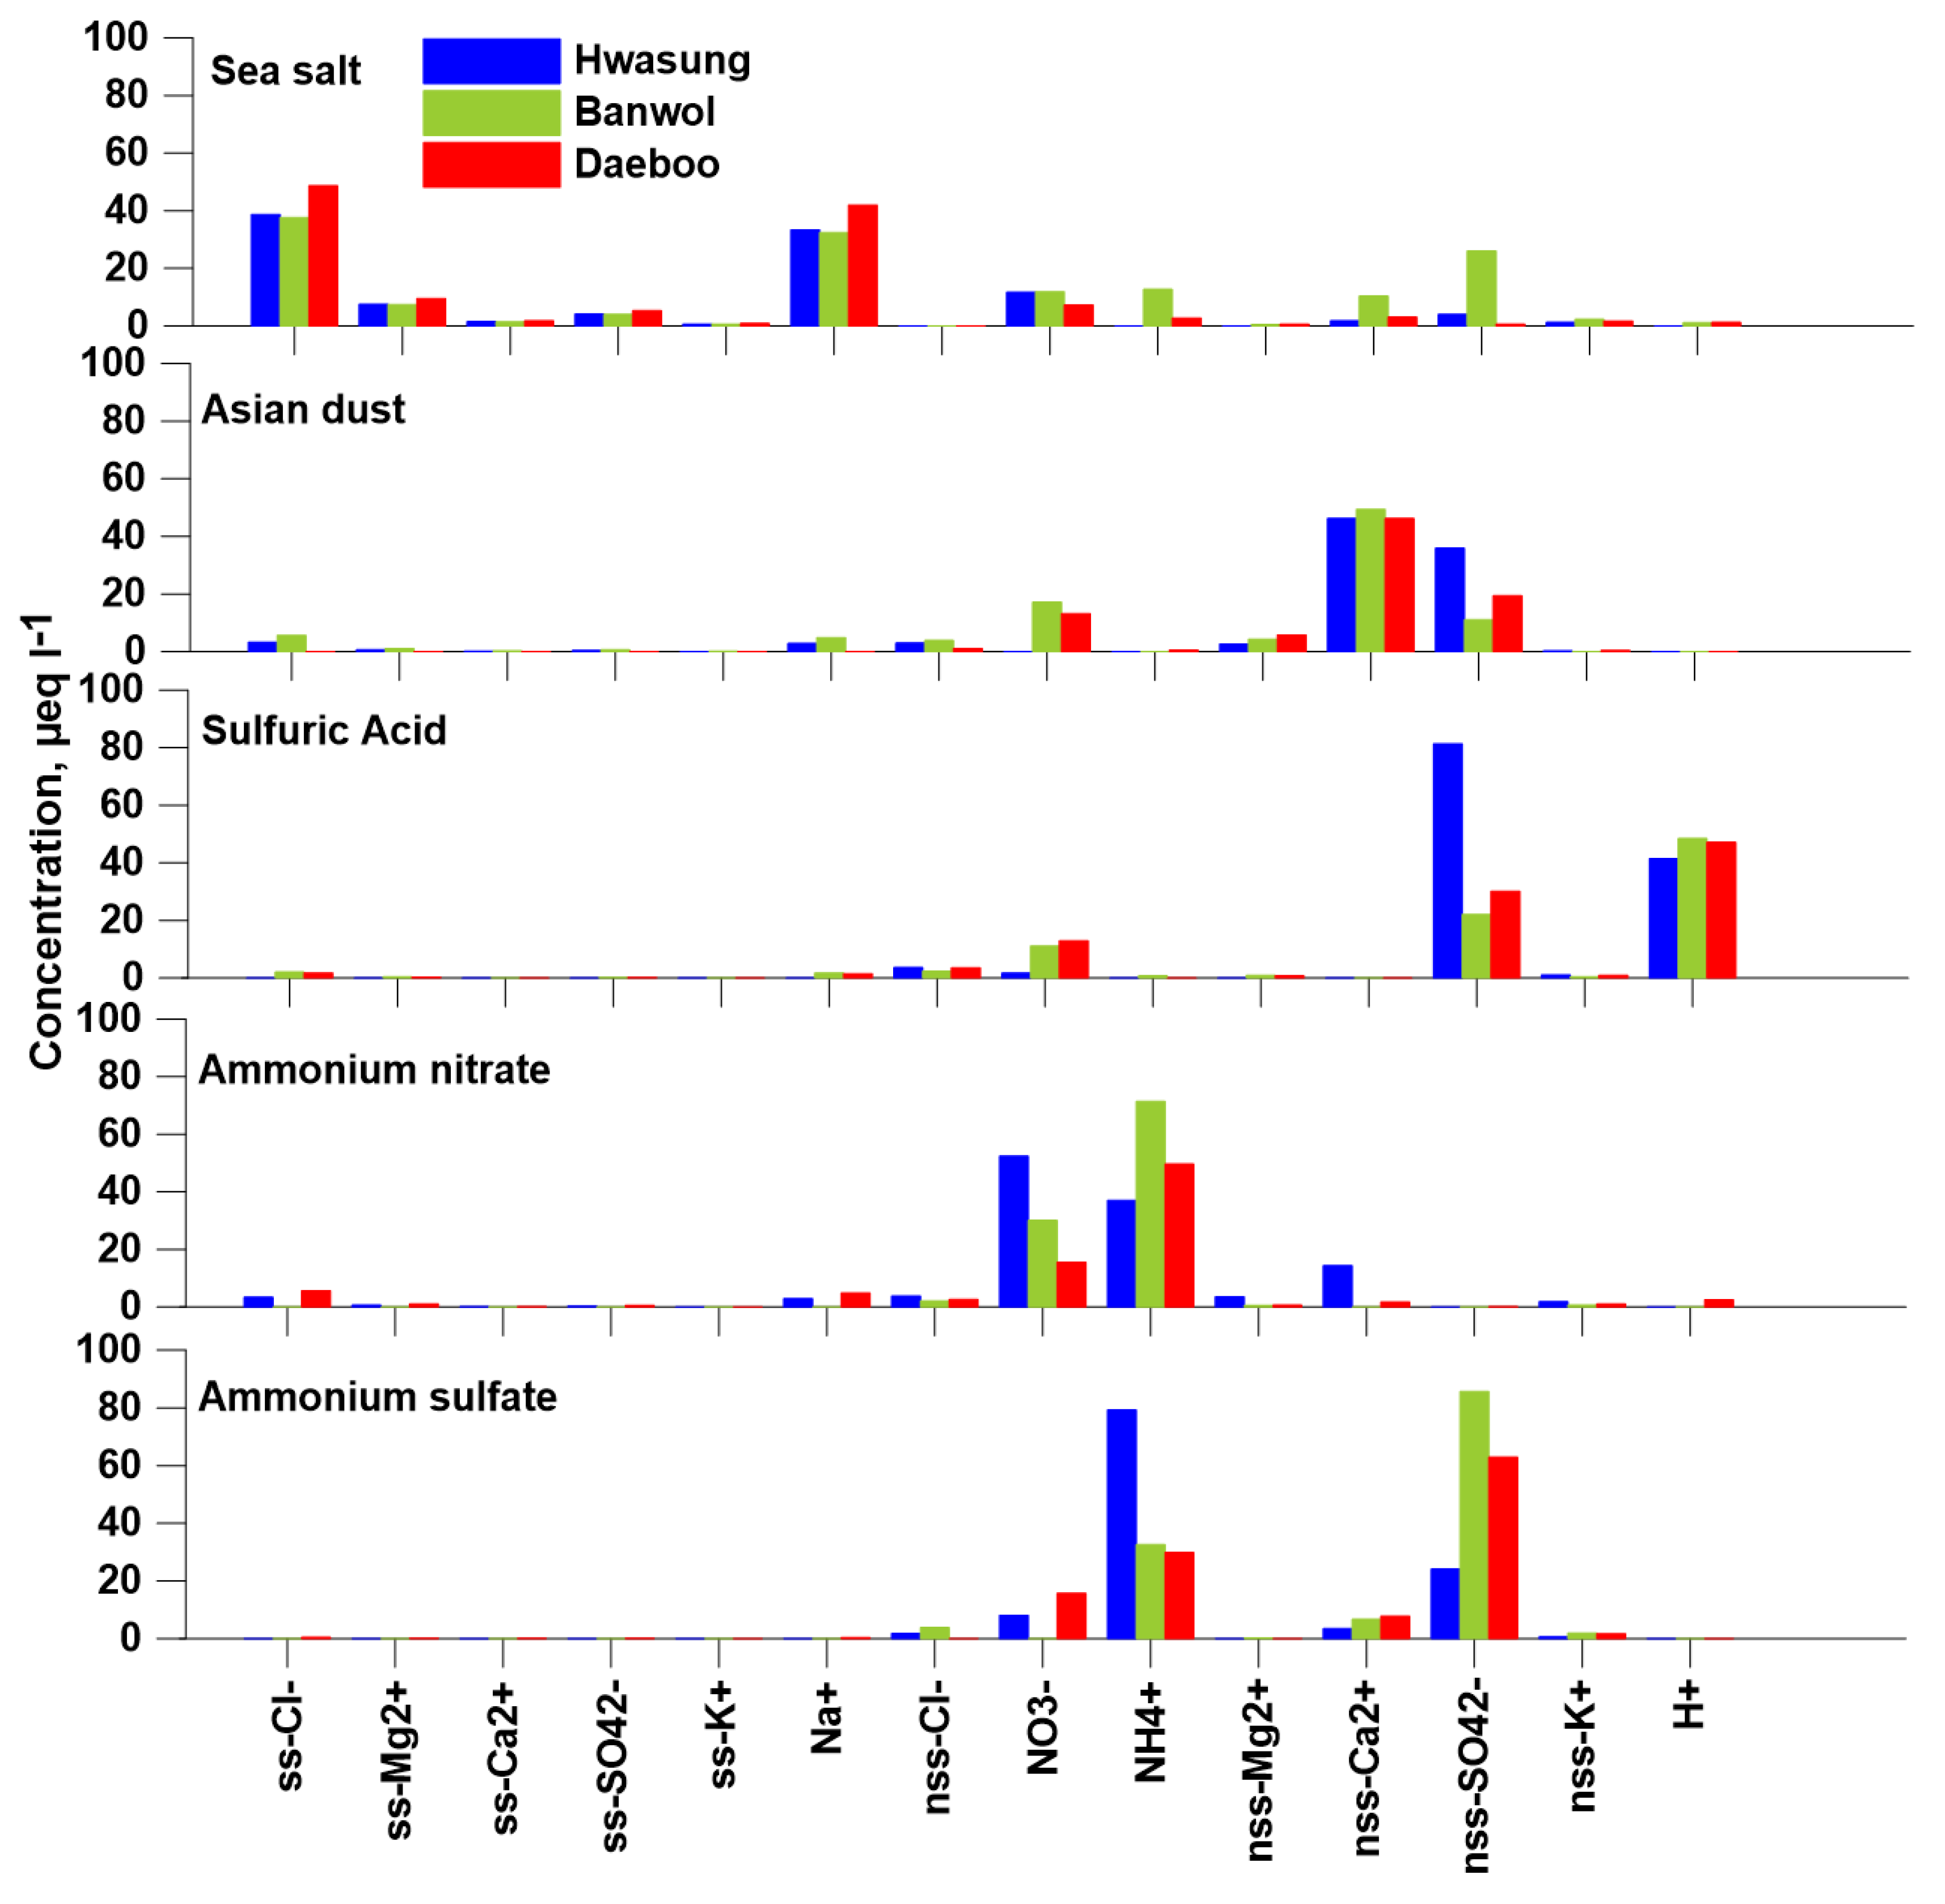
2.5. Positive Matrix Factorization (PMF)

Positive Matrix Factorization is a multivariable factor analysis tool to identify the contributions of various emission sources. PMF decomposes a speciated data matrix X of n by m dimensions (n number of samples and m chemical species) into factor profiles (g) and factor contributions (f) based on the correlation between the different components (Equation (1)). The objective of the PMF solution is to minimize the object function Q based on the uncertainties (u) as follows [46]:
Q = i = 1 n j = 1 m [ X i j k = 1 p g i k f k j u i j ] 2
where xij are the measured concentrations (in µeq∙L−1), uij are the estimated uncertainty values (in µeq∙L−1), n is the number of samples, m is the number of species and p is the number of factors included in the analysis [47].
PMF needs two input files: one for the measured concentrations of the species and the other for the estimated uncertainties of the concentrations. The uncertainty greater than the detection limit was calculated using the concentration and detection limit (Equation (2)). If the concentration was less than or equal to the detection limit, the uncertainty was calculated with a fixed fraction (Equation (3)). Missing data and their uncertainty value were replaced with the value of the species-species median and four times the median value, respectively [48].
u n c e r t a i n t y =   ( Error fraction  × Concentration ) 2 + ( 0.5   × Detection limit ) 2
u n c e r t a i n t y =   5 6 × ( D e t e c t i o n   l i m i t )
A variable was defined to be weak if its S/N was between 0.2 and 2.0. Most of the scaled residuals were between −3.0 and 3.0. Fpeak values between −1 and 1 (in steps of 0.1) were examined to find out the most appropriate solution. Error estimate with bootstrap results showed 100% mapping for five factors at three sites.

3. Results and Discussion
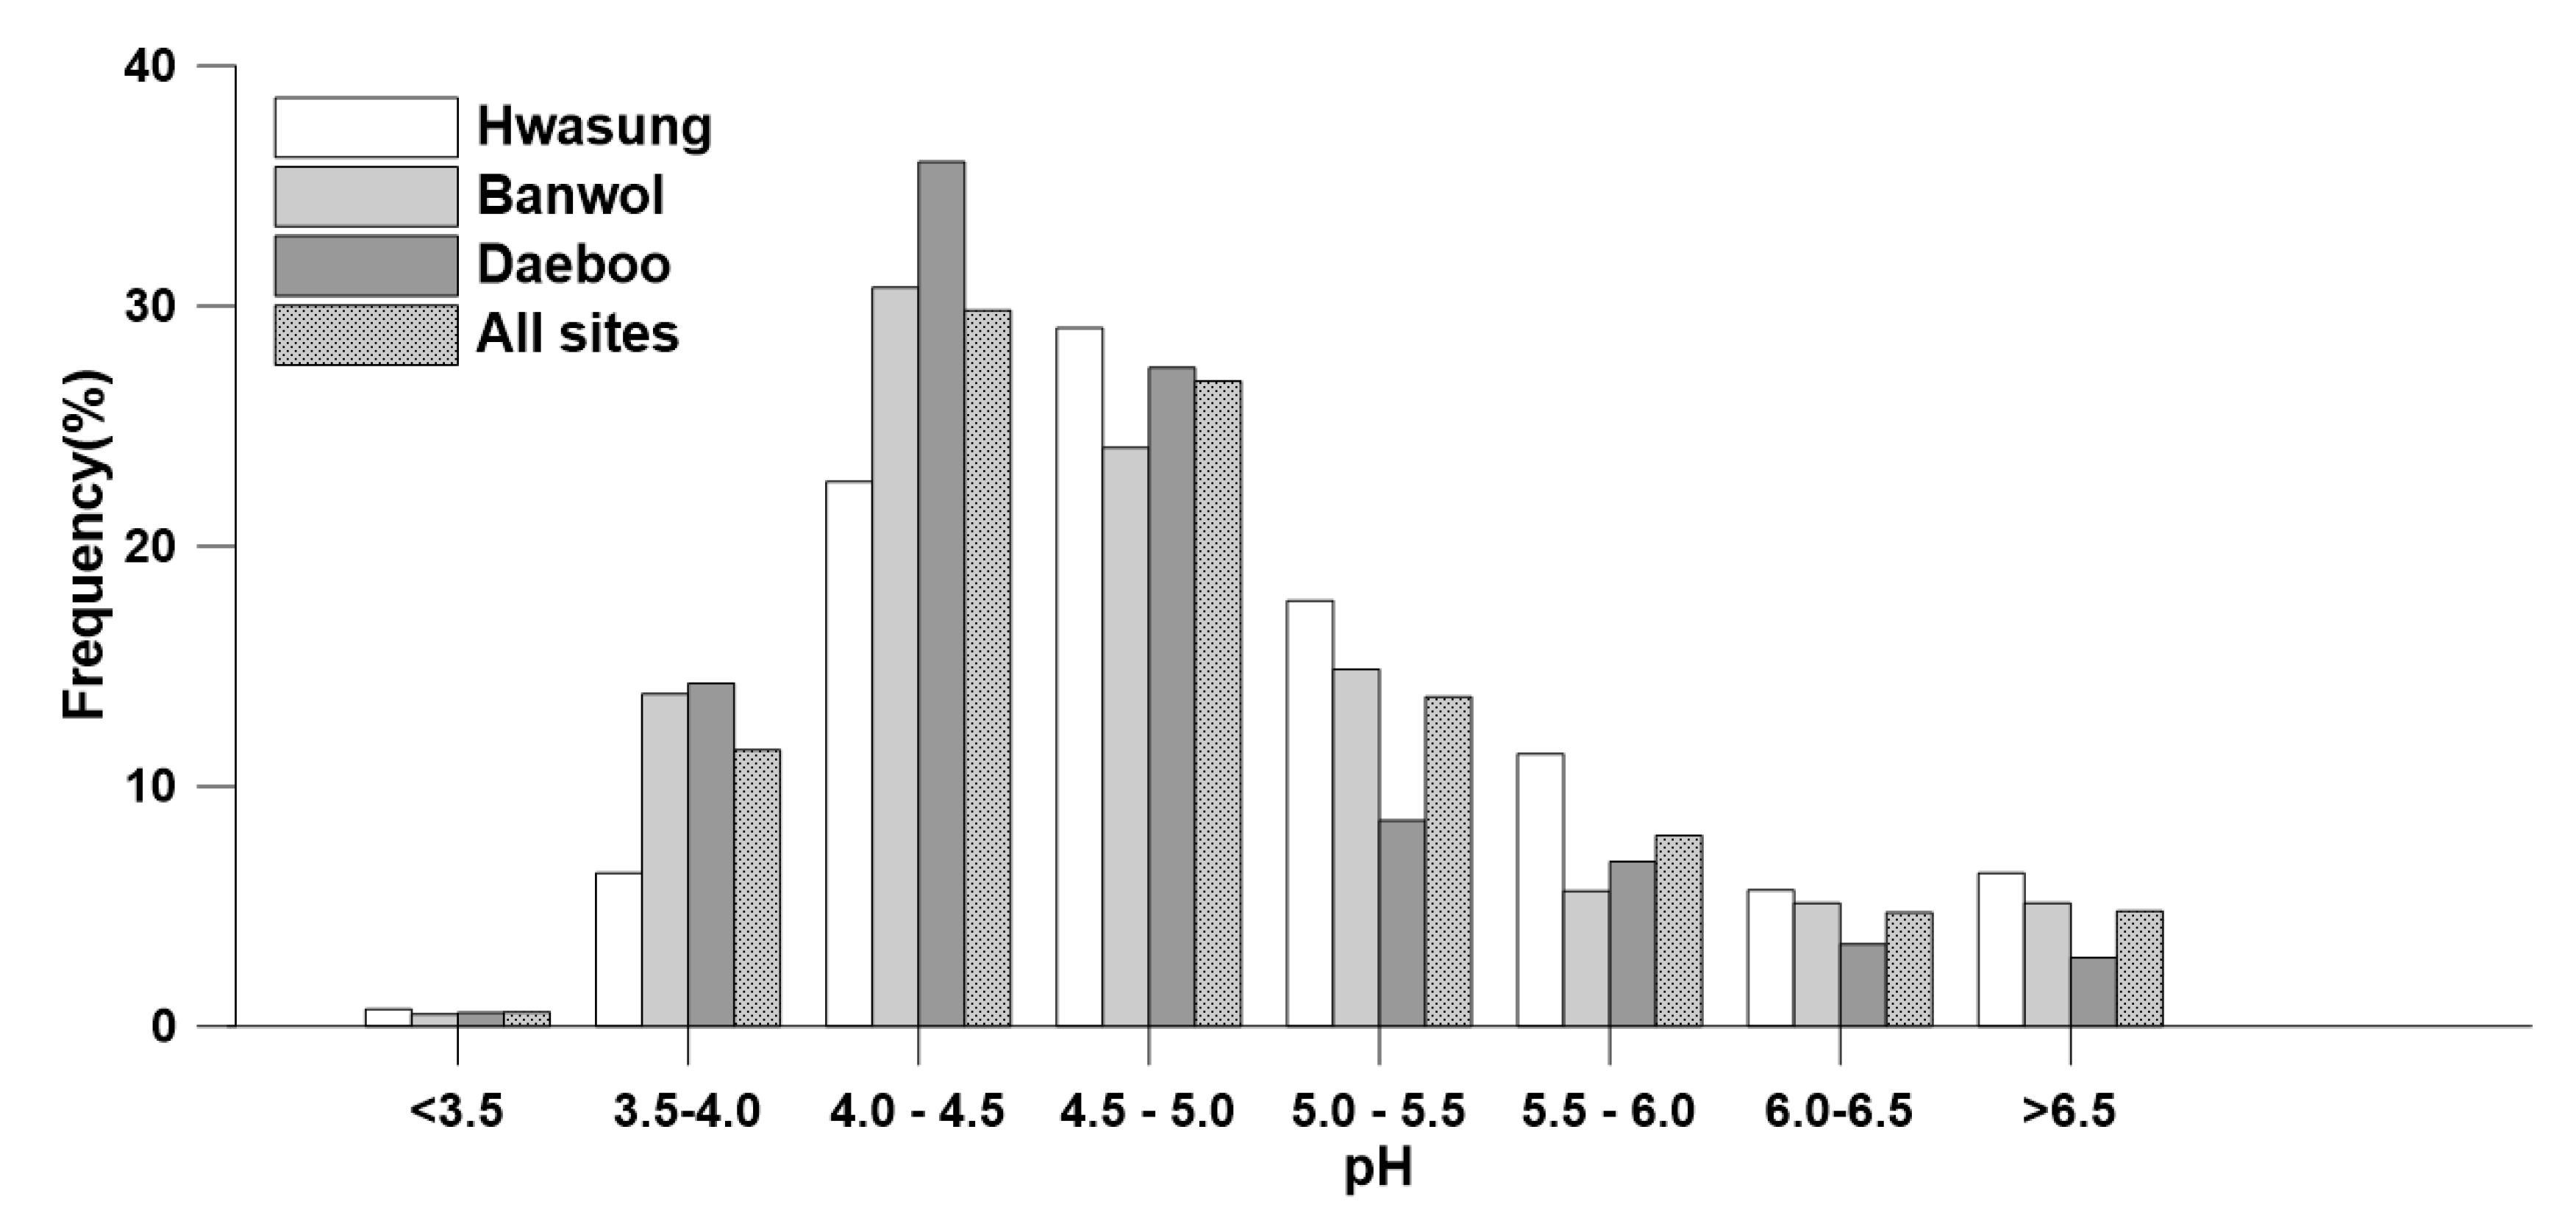
3.1. Acidity

SO2 and NOx are the major precursors of acidity in precipitation. Wind-blown soil particles and sea spray species atmosphere play an important role in neutralizing acidic constituents. In uncontaminated precipitation, the equilibrium concentration of CO2(aq) generates a pH of approximately 5.6, which serves as a reference value. Figure 3 shows the frequency distribution for pH in the Shihwa Basin. Among the samples, 84% of the pH values were <5.6. The pH of uncontaminated precipitation is considered to be 5.0–5.6; this acidity originates from natural levels of atmospheric CO2, NOx, and SOx [49]. About 66% of the rain samples had a pH < 5.0, indicating that the rain samples were affected by additional acidic components. At Banwol station in the center of two industrial complexes, 69% of the samples had a pH of <5.0 and 14% had a pH < 4.0. At Hwasung station, 59% of the samples had a pH of <5.0 and 7% had a pH < 4.0. At Daeboo, 78% of the samples had a pH lower than 5.0 and 15% of the samples had a pH < 4.0.
Figure 3. Frequency distribution for wet-only precipitation volume-weighted mean (VWM) pH.
Atmosphere 06 00732 g003
Overall, the pH of the precipitation ranged from 3.4 to 7.7 (Table 2). The VWM pH was 4.84, indicating slight acidity in the study area. For Hwasung, located east of Banwol, the VWM pH was 4.96, higher than at the other sites (p < 0.001). At Banwol, the pH was 4.77, lowest among all the stations (p < 0.001), reflecting its proximity in the industrial complex. Daeboo had the highest VWM pH (4.81), similar to the VWM pH at Banwol.
Table 2. Major ionic compositions of precipitation in the Shihwa Basin (µeq∙L−1 except pH).
StationParameterClNO3SO42−Na+NH4+K+Mg2+Ca2+pH
HwasungMin0.53.86.80.65.90.020.30.77.5
Max472482149556717581632977813.4
Mean456812733117915574.5
Standard deviation82101727912220321340.8
VWM13.919.645.29.343.63.64.513.54.7
BanwolMin1.42.04.70.55.70.030.40.67.7
Max6835988395065393081446393.5
Mean5871.314534.7116914654.3
Standard deviation93831606610412231080.8
VWM20235610514.44.6154.6
DaebooMin1.21.93.50.41.60.110.30.66.9
Max15055947531434588873207633.5
Mean707311859888.520614.4
Standard deviation11989134888920331150.7
VWM25224017405.16.6154.6

3.2. Concentration of Inorganic Species

The minimum and maximum concentrations of chemical components in the individual precipitation samples and their VWMs are shown in Table 2. SO42 and NH4+ were the most abundant ions in precipitation at the three stations. At Hwasung, the concentrations of anthropogenic species were lower than those at the other stations. The VWM concentration of sea salts was also lowest in Hwasung, as it is located farthest from the seashore. The highest concentrations of SO42, NH4+ and NO3 were measured at Banwol, related to anthropogenic sources associated with two industrial complexes and motor vehicles. The VWM concentration of H+ was also highest in Banwol. In Daeboo, the precipitation acidity was similar to that in Banwol due to the low concentration of NH4+. The VWM conductivities in Hwasung, Banwol, and Daeboo were 18, 24, and 23 µS·cm−1 with VWM total ions of 181, 253, and 235 µeq∙L−1, respectively.
For the combined data collected in the Shihwa Basin, the ion concentrations fell in the order SO42 > NH4+ > H+ > NO3 > Cl > Ca2+ > Na+ > Mg2+ > K+. Among the anions, SO42 had the highest concentrations at all stations (54%). The next most abundant anion was NO3 at nearly 24%. The precipitation chemistry in the Shihwa Basin was mainly dominated by NH4+ with an average VWM of µeq∙L−1, representing 40% of all cations. Considering the sampling period, the concentration of NH4+ can be as high as 49.5 µeq∙L−1 (10%). The next most abundant cations were H+, Ca2+, and Na+, representing 24%, 15%, and 12% of the total, respectively. NH4+ in the Shihwa Basin is associated with agricultural activities and an industrial wastewater treatment facility. Ca2+ is related to resuspension of dust from the soil and Asian dust originating from China mainly in the spring. [50]. These alkali components neutralize and decrease the acidity of the rainwater [51,52]. The ratios of individual ions to Na+ are higher than seawater ratios, which indicates that contributions from anthropogenic and soil sources are important, while the marine contribution is negligible [53,54]. The Cl/Na+ ratio in the combined precipitation samples over six years was 45% higher than that of seawater Cl/Na+ (1.165). This suggests that the Cl originated from industrial activities in the area such as coal combustion and incineration of polyvinyl chloride [55,56]. The SO42/Na+, K+/Na+, Mg2/Na+, and Ca2+/Na+ ratios for precipitation in the Shihwa Basin were 4.02, 0.32, 0.45, and 1.25, respectively, higher than the seawater ratios (0.12, 0.23, 0.04, and 0.02, respectively). This suggests that anthropogenic influences were present from local (two industrial complexes) or regional (Asian continent) sources.
The SO42/NO3 ratio has been used as an index to evaluate anthropogenic characteristic sources in rainfall samples [54,57]. SO42/NO3 ratios are diverse globally and temporally: 0.67 in the southwestern United States during 1995~2010 [58], 1.5 in Belgium in 2003 [41], 1.6 in Turkey in 2002 [51], 2.3 in central Pennsylvania during 1993~2001 [59], 2.4 in Mexico from 1994 to 2000 [60], 8.7 in Brazil in 2002 [55] and 18.6 in Costa Rica in 2009 [61]. Kulshrestha et al. (2003) [62] reported that the SO42/NO3 ratio in India increased as the degree of urbanization or industrialization increased. In Korea, SO42/NO3 ratios ranging from 0.6 to 3.6 have been reported (1990 to 2013) [30,33,63,64]. The mean SO42/NO3 at three EANET sites located in the western area of Korea averaged 0.97 during 2001~2007 (EANET). The average SO42/NO3 ratio of 2.3 in this study was attributed to the close proximity to industrial areas in Korea [30]. The H+/(NO3 + SO42) ratio can represent the relative contributions of H2SO4 and HNO3 to the acidity of rain, and deviations from unity indicate the degree of neutralization [65]. Earlier studies in Korea showed that acidity due to H+ was less than 7% in rural areas, while that in urban areas ranged from 18% to 34%. The combined contribution of H2SO4 and HNO3 to acidity in the Shihwa Basin was 0.36 ± 0.26, indicating that about 64% of the acidity was neutralized by cations [66]. The H+/(NO3 + SO42) ratios for China, Southeast Asia, Korea, and Japan are about 20%, 60%, 30%, and 37%, respectively. The mean pH for wet-only precipitation (4.84) in the Shihwa Basin is higher than or similar to the results from other major cities in Asia.

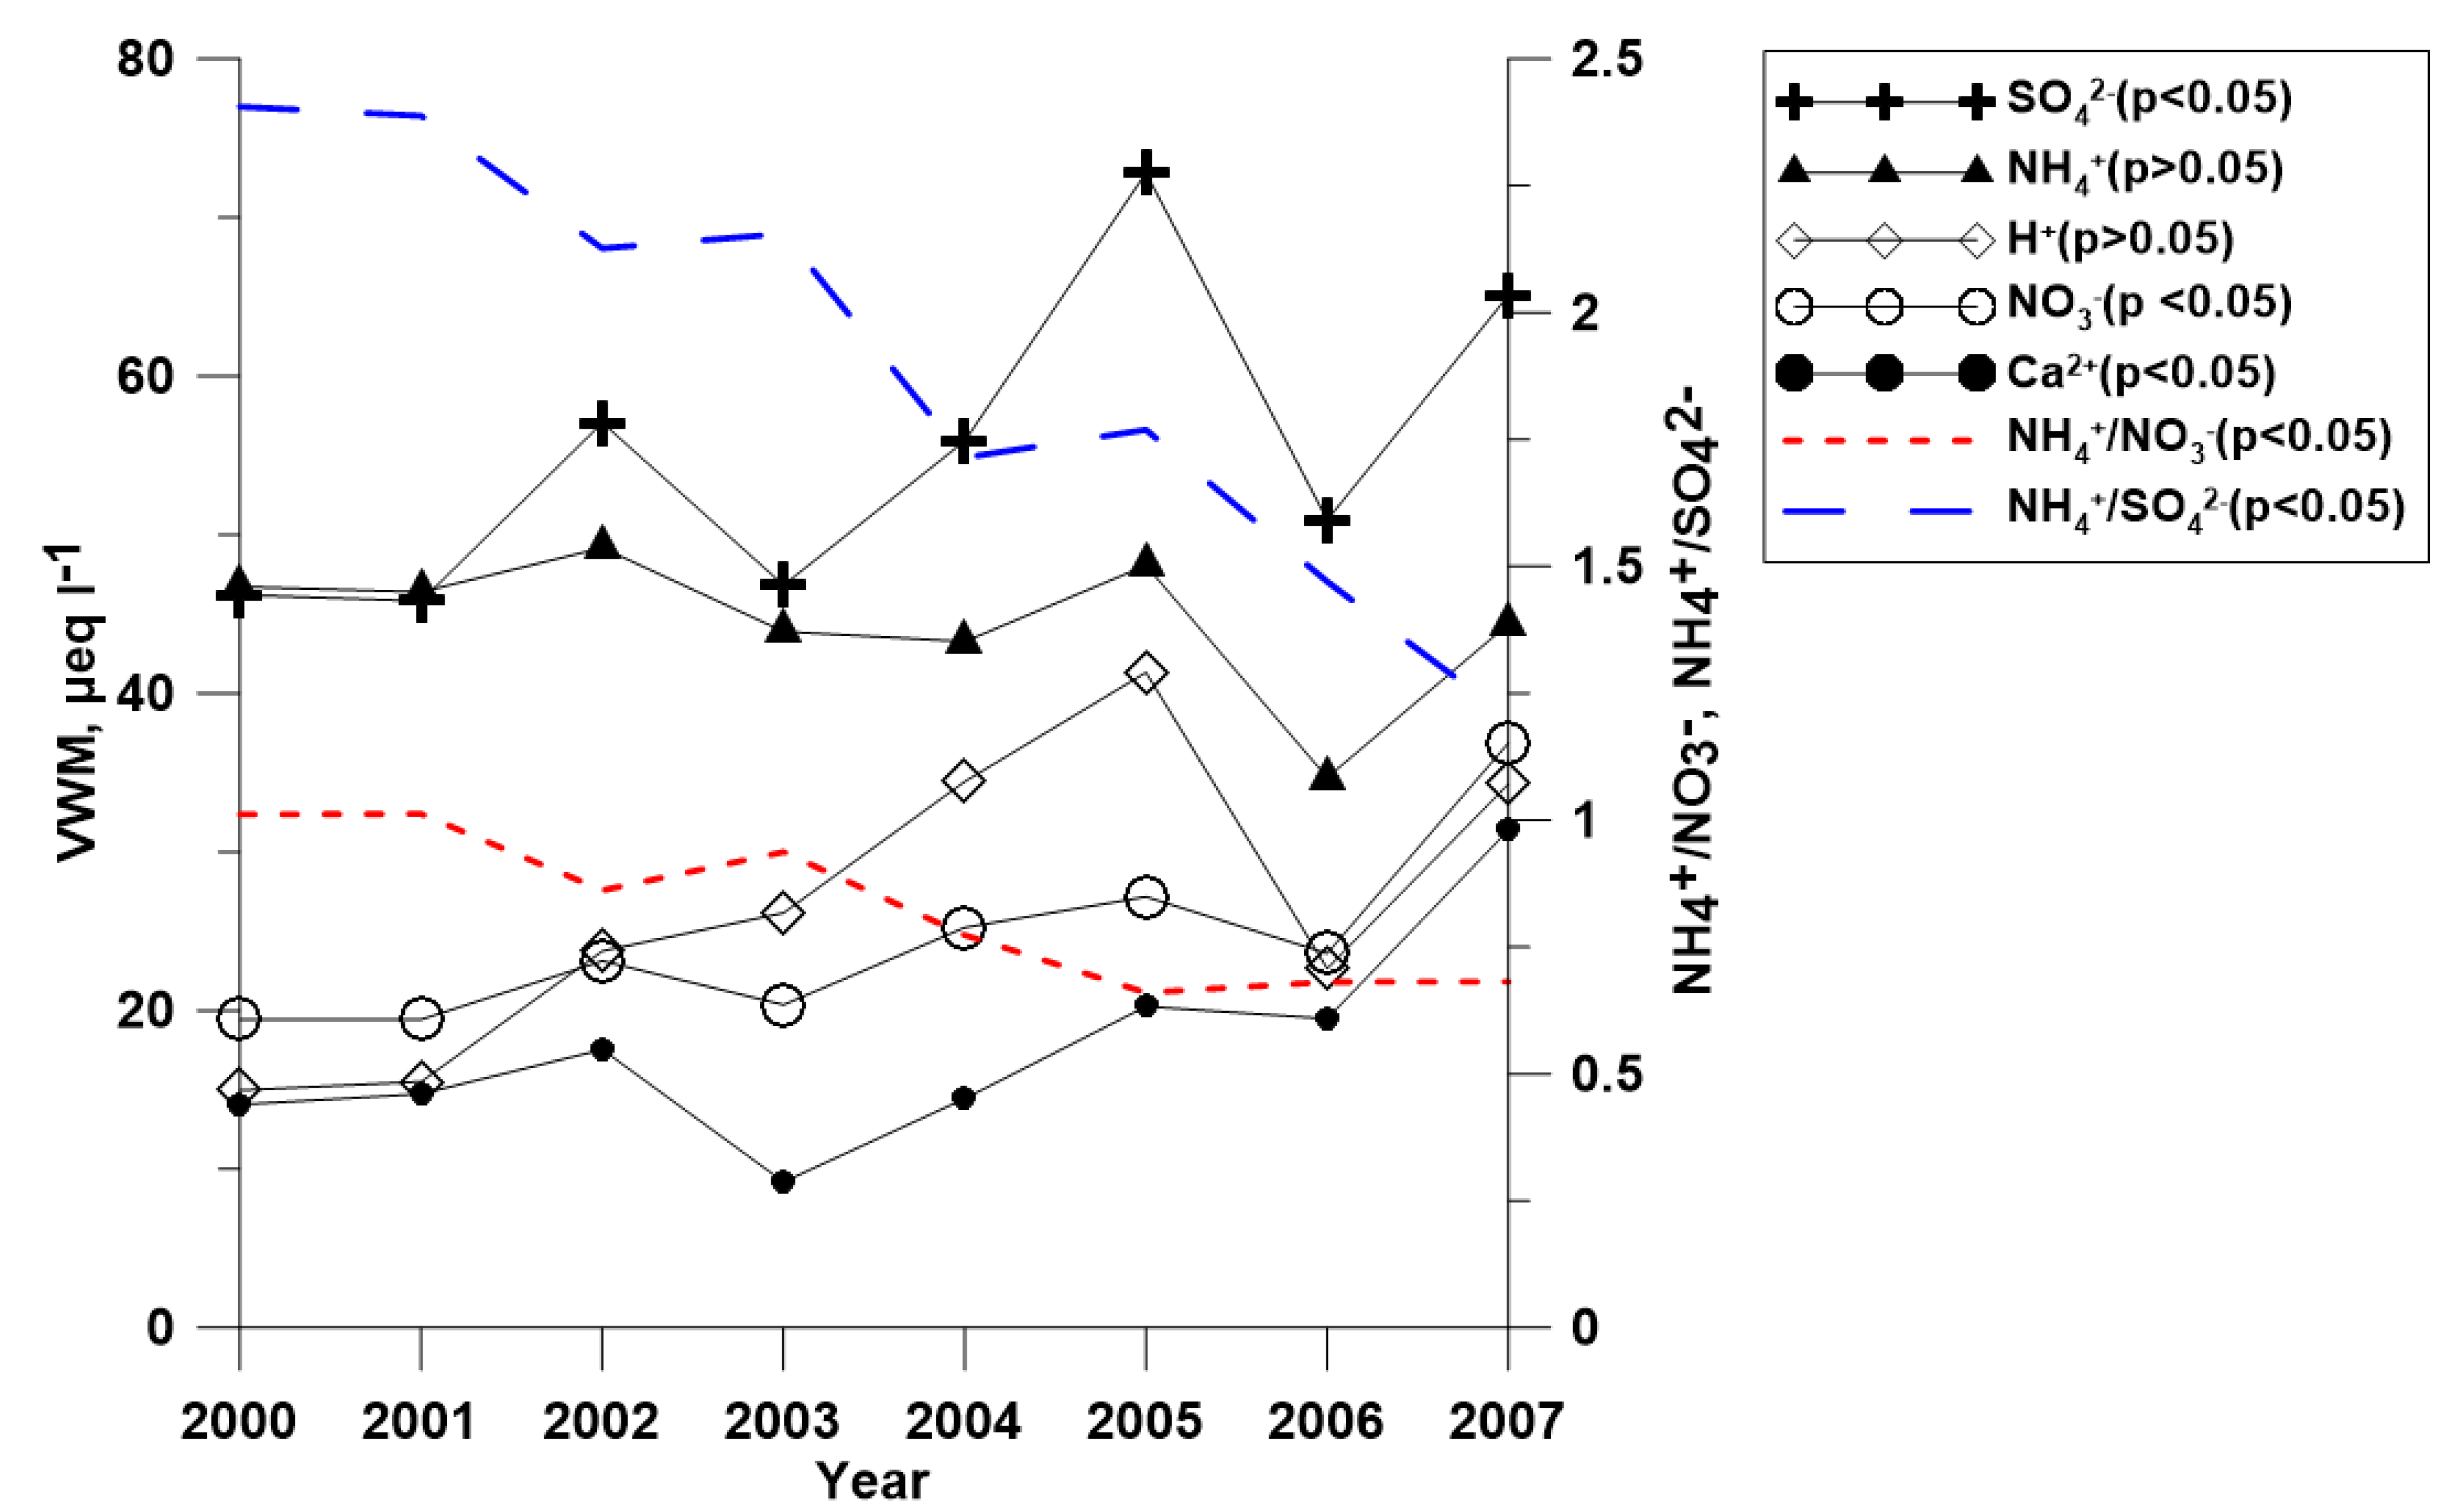
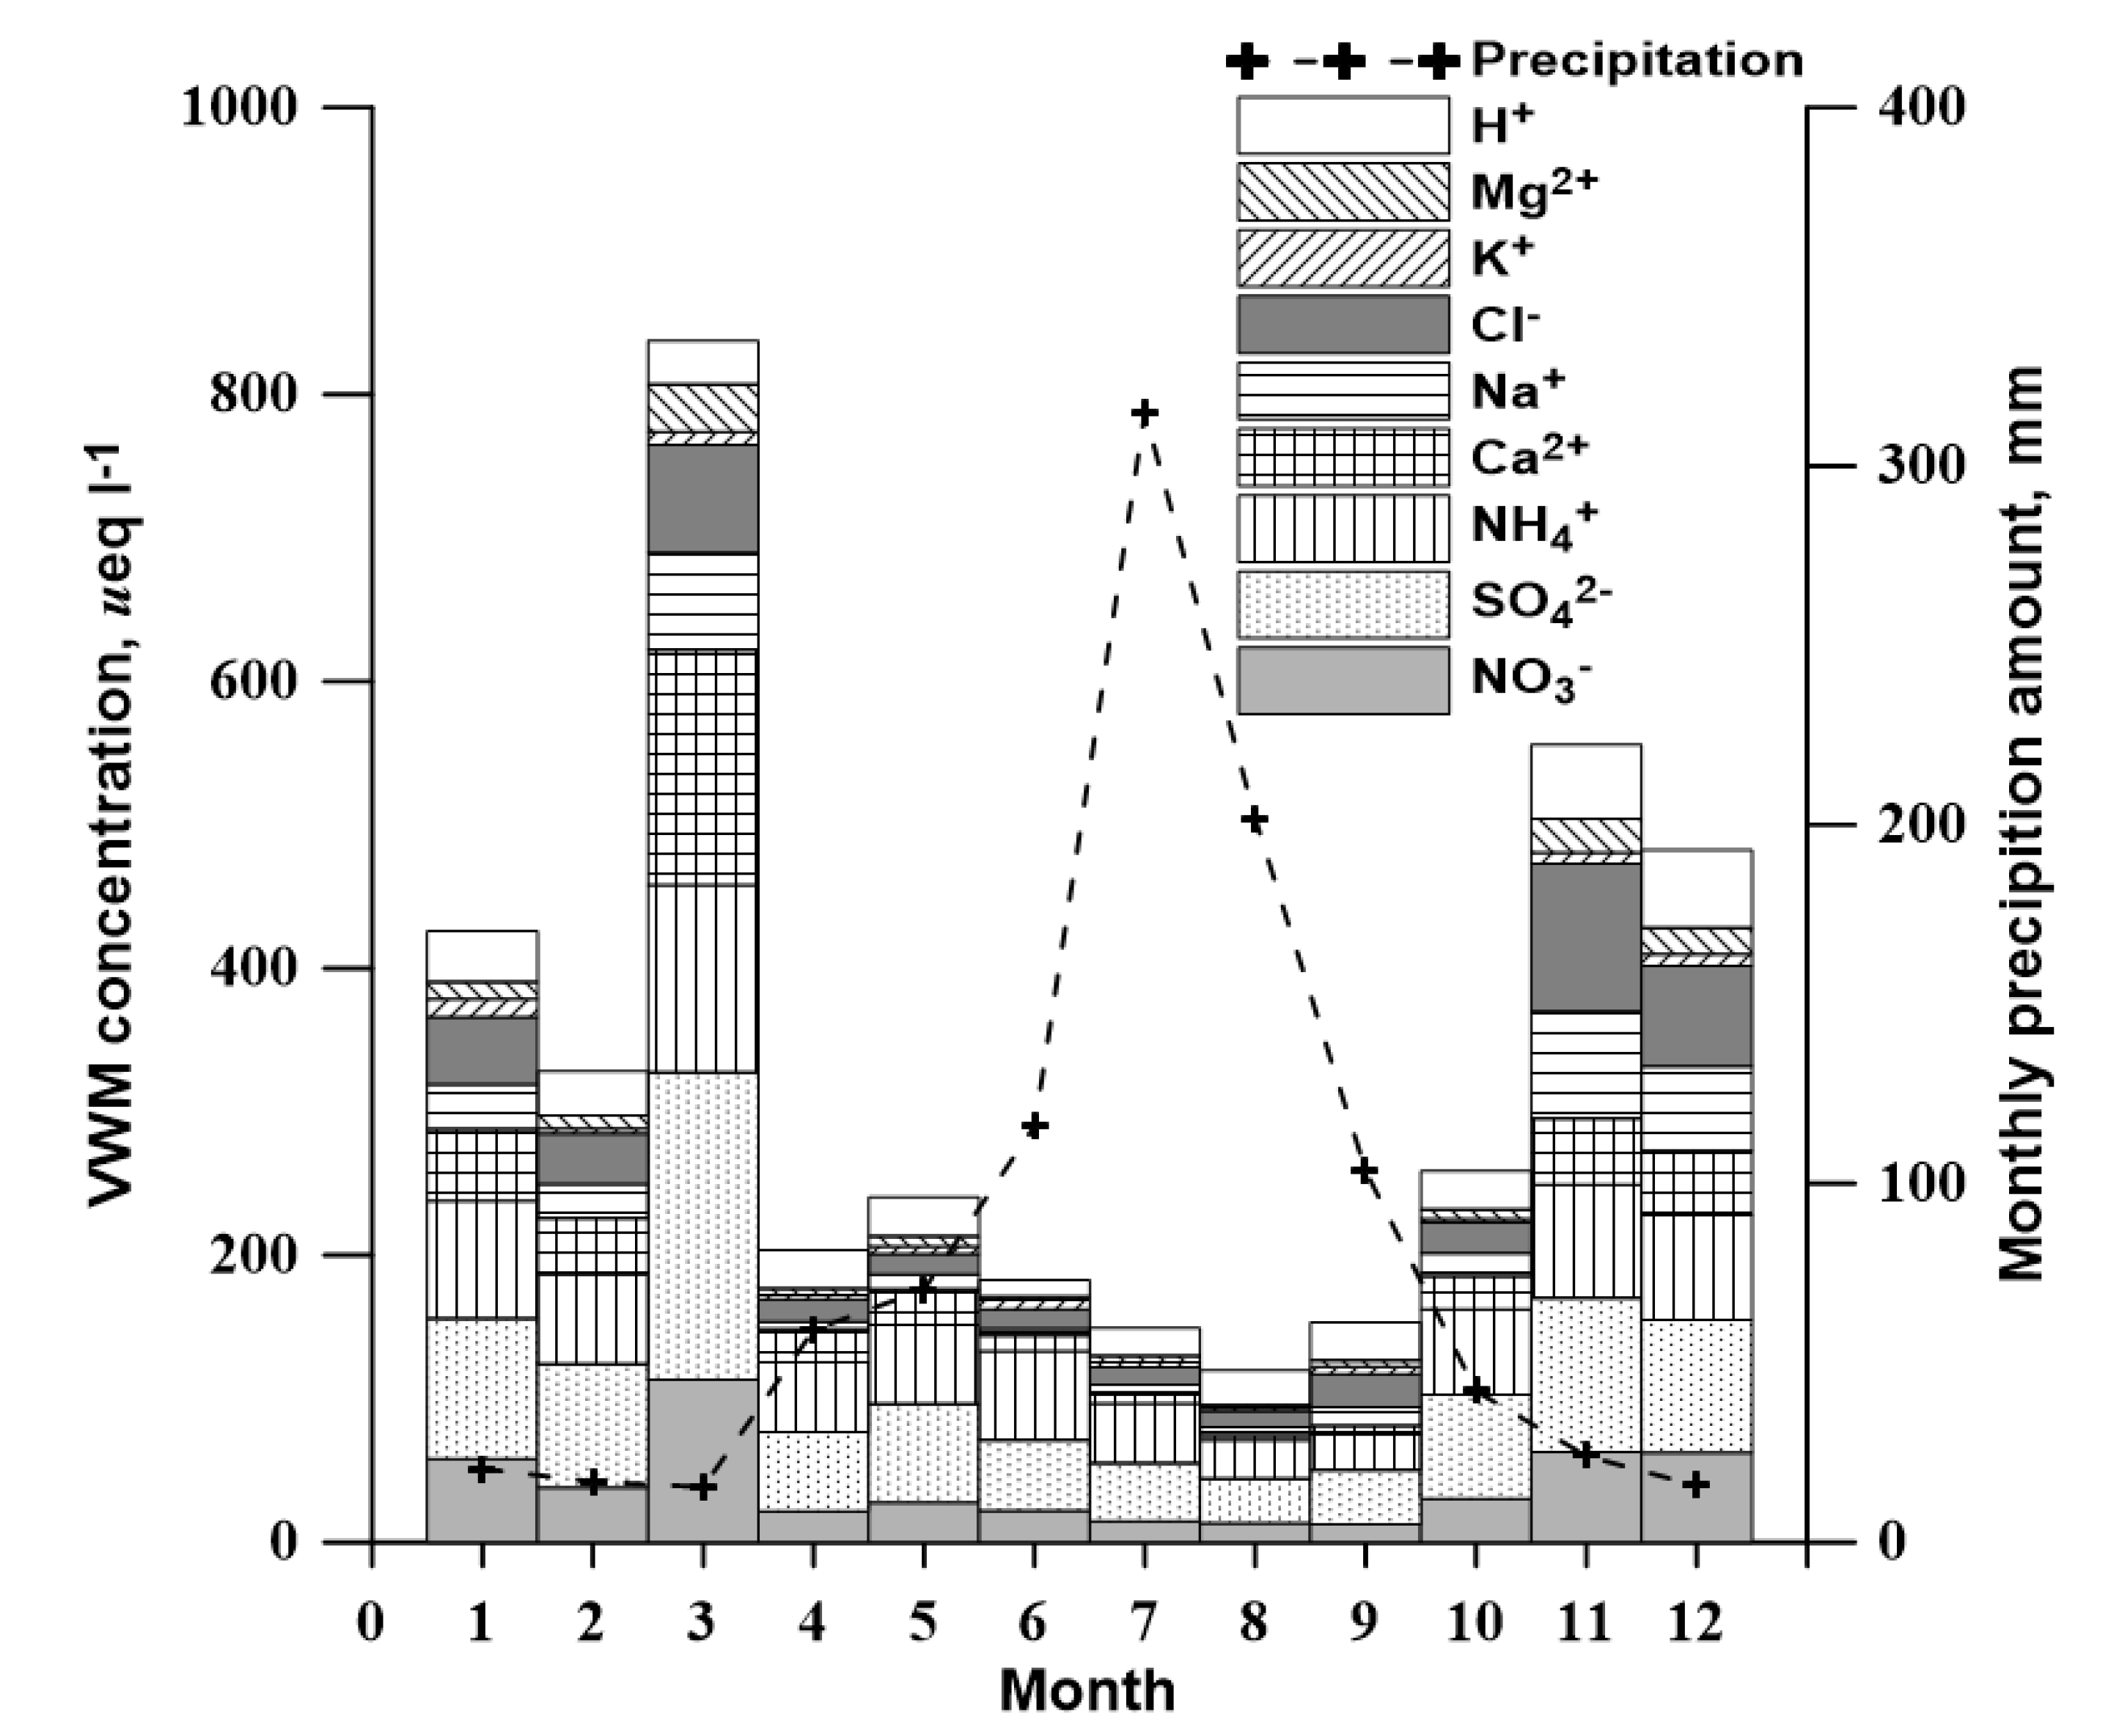
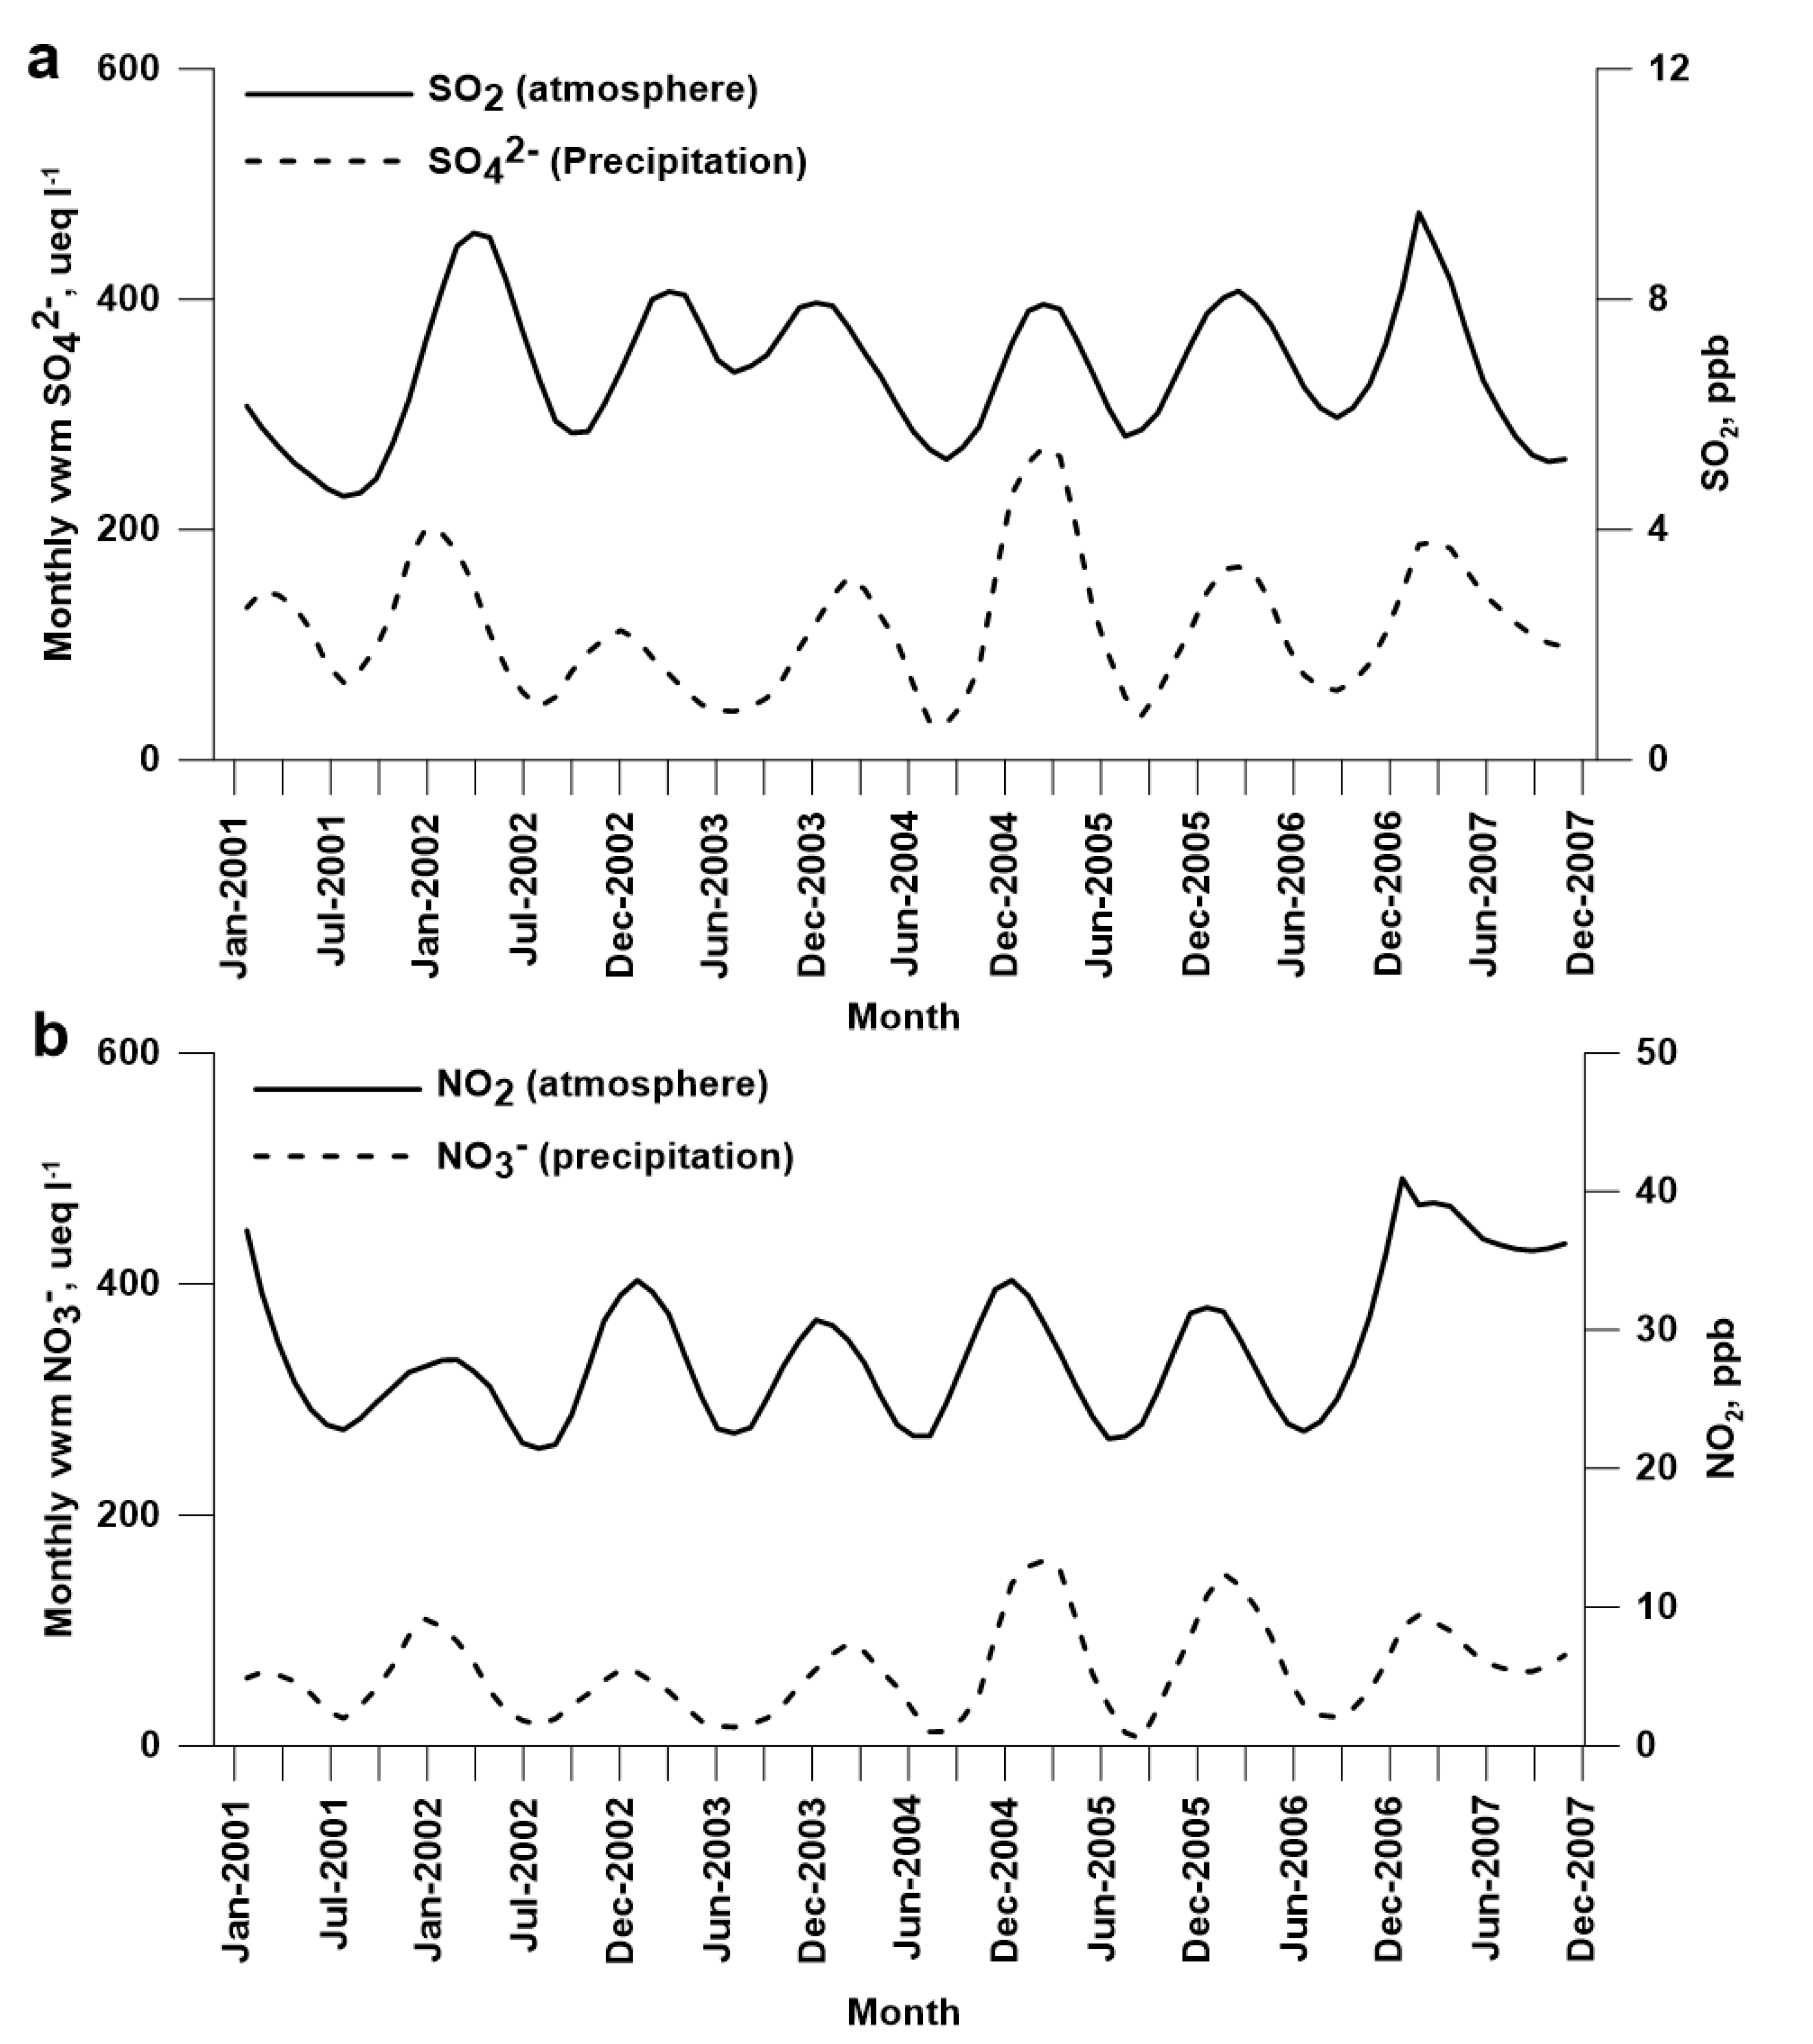
3.3. Temporal Variation

During the study period, there were 26 episodic events in which the total ion concentration precipitation was >2000 µeq∙L−1. There were 14 events in winter, 11 in spring, and one in autumn. In summer, there were no events when the total ion concentration was >2000 µeq∙L−1. Rastogi and Sarin (2007) [67] reported that low-solute events are associated with heavy amounts of rain or successive events. The concentrations of most of the chemical components in the wet-only samples were inversely related to precipitation amount. About 74% of the rain in the Shihwa Basin fell from June to September (Figure 4). Concentrations during the rainy period (June to August) were significantly lower (p < 0.05 for H+ and p < 0.01 for other ions) than those in the dry period (September to May). The concentrations of the inorganic species decreased due to dilution during the rainy period, thus ion concentrations were lower during the rainy period than ion concentrations in the dry period. The concentrations of soil-derived species (Ca2+ and Mg2+) in the dry season were about six times higher than those in the rainy season. In March, influenced by dust from Asian continental deserts such as the Taklamakan, Gobi, and Loess plateau, the concentrations of all chemical components were highest. The monthly VWM concentrations of SO42 and NO3 in the wet-only samples were correlated with concentrations of SO2 (r = 0.466, p < 0.001) and NO2 (r = 0.559, p < 0.001) in atmosphere (Figure 5). The NO2 and SO2 data are available from the National Institute of Environmental Research (NIER) in the same administrative district (Ansan city). Tu et al. (2005) [19] also reported that the SO42 concentration had a temporal trend corresponding to SO2 in atmosphere in China. Similar results have been found in a number of studies [15,68].
Figure 4. Monthly VWM concentrations of ions in rainfall and rainfall amount.
Atmosphere 06 00732 g004
Figure 5. Trends with Lowess smoothing (span = 0.2): (a) monthly VWM SO42 concentration in wet-only precipitation and the monthly mean atmospheric SO2 concentration and (b) monthly VWM NO3 concentration in wet-only precipitation and the monthly mean atmospheric NO2 concentration.
Atmosphere 06 00732 g005
Figure 6 shows the annual VWM concentrations of the major components in precipitation. Anthropogenic SO2 and NO2 emitted from mobile and power plant sources contributed to the increasing of SO42− and NO3 in the wet-only samples [69]. In 2002, power plants (450 MW) near the study area expanded to Boryeong thermal power plant located about 100 km south of Daebudo station. Thermal power facilities (1600 MW) were also added to the Yeungheung thermal power plant located 13 km west from Daebudo station in 2004. In 2005, the Incheon thermal power plants located 20 km north of the Banwol industrial complex expanded to a 342 MW power plant facility. Additional power generating capacity (5275 MW) has been added to these three power plants between 2008 and 2014. During the study period, the NH4+/SO42− ratio decreased from 1.01 to 0.68. The NH4+/NO3 ratio also decreased from 2.39 to 1.20. Results from studies of wet-only precipitation in Austria, Brazil, Canada, USA, Japan, and China have shown significant decreasing trends in the concentrations of SO42− and H+ over long-term periods [15,16,70,71,72]. Table 3 shows VWM concentrations in recent precipitation studies in East Asia. The concentrations of water-soluble components in the Shihwa Basin were lower than those found in other Asian continental countries. The average concentrations of NO3 and SO42− ranged from 1.8 to 2.0 and were 2.0 to 2.4 times higher than average concentrations in Seoul [33].
Figure 6. Annual variations of major inorganic VWM concentrations in the precipitation.
Atmosphere 06 00732 g006
Table 3. Volume-weighted mean (VWM) concentrations of the chemical components in wet-only precipitation in East Asia (µeq∙L−1 except pH).
East AsiaYear(s)ClNO3SO42−Na+NH4+K+Mg2+Ca2+pH
Beijing a (N China)2003-118380-211--1596.48
China b (SE China)20049319568153484.54
Cai Jia Tang c (S China)2003116015571121010604.33
Hong Kong d1999–2000432774372247164.20
Singapore e1999–2000342284331977164.20
Japan f (Tokyo)1990–20025531503740312254.52
Jeju g (Korea)2000-2007402322244021395.37
This study2000–2007232354134446174.84
a Tang et al. (2005); b Zhang et al. (2007b); e Hu et al. (2003); f Okuda et al. (2005); g EANET(2013).

3.4. Statistical Analysis

Table 4 shows the correlation coefficients among chemical species for this study. Significant and strong correlations were found among Na+, Cl, Mg2+ and Ca2+, indicating that this region is heavily affected by sea salts and soil. Ca2+ and Mg2+ correlations with Cl, NO3, and SO42 indicate that CaCl2, MgCl2, Ca(NO3)2, Mg(NO3)2, CaSO4, and MgSO4 were the primary soil-derived components in the wet-only precipitation [73]. The correlation among NH4+, NO3, and SO42 indicate that they originated from similar anthropogenic sources. The significant correlation between NH4+ and NO3 (r = 0.76, p < 0.001) and between NH4+ and SO42 (r = 0.83, p < 0.001) indicate that NH4NO3, (NH4)HSO4, and (NH4)2SO4 were the major forms of NH4+ in precipitation. Although positive correlations between acidic anions and H+ were observed, their correlations were weaker due to neutralization effect by basic soils components [74].
Table 4. Correlations between ionic components in wet-only precipitation over seven years in the Shihwa Basin (p < 0.001 for all correlation).
ClNO3SO42−Na+NH4+K+Mg2+
NO30.56
SO42−0.620.82
Na+0.890.580.64
NH4+0.520.760.830.48
K+0.660.430.540.610.55
Mg2+0.740.670.690.820.490.47
Ca2+0.630.710.820.680.600.490.80
Additional details on the patterns in the chemical constituents were analyzed using PMF. Similar studies have also used this technique to identify sources of air pollutants. Anttila et al. (1995) [75] determined the sources of bulk wet deposition in Finland using PMF analysis. Recently, Kitayama et al. (2010) [76] used PMF to identify the sources of SO2 in Japan. The number of factors was determined by the optimized values. Five factors were chosen (Figure 7). The factors were identified as sea salts (Na+, ss-Cl), Asian dust (Mg2+, Ca2+), sulfuric acid (H+, SO42), ammonium salt with nitrate (NH4NO3), and ammonium salt with sulfate (NH4HSO4 and (NH4)2SO4)components. The first factor was characterized by high concentrations of sea salts and its contribution to ions in precipitation was 18%–26%. At the Banwol site, some anthropogenic components (NO3, NH4+, and SO42) were also included in this factor. The second factor, accounting for 17% of the total ions, was dominated by Asian dust at all three sites, indicated by high concentrations of Mg2+ and Ca2+. This factor explained 70%–79% of the variation in Ca2+ and 42%–74% of that in Mg2+. The average contribution of the Asian dust factor was especially high during the spring. The third factor represents H+ and SO42, accounting for 16%–23% of the total. The acidity of the precipitation is largely affected by the dissolution of SO2 and NO2 as precursors of the acidic components. As noted above, the high SO42/NO3 ratio in the Shihwa basin indicates that emissions of SO2 from the industrial complex were dominant sources for acidity. SO42 accounted for 93%, 52%, and 57% of this acidity factor at Hwasung, Banwol, and Daeboo, respectively. The fourth factor was characterized by ammonium nitrate, which explained 17%–21% of the total and originated from either local industrial or farmland sources. The presence of nitrate with ammonium ions indicates dissolutions of ammonium nitrate from aerosols. The fifth factor represents high loadings of NH4+ and SO42. The highest NH4+ concentrations were found in Hwasung where sizeable NH3 sources, such as farmland, exist. The relative contributions of five factors to measured components varied largely by the month of year (Figure 8). The acidity and secondary aerosol factors were mainly associated with the temperature and precipitation amount. Their contribution was highest in summer. However, Asian dust influences were dominant during the spring.
Figure 7. Source contributions of factors 1–5 at the three stations.
Atmosphere 06 00732 g007
Figure 8. Temporal variations in the five source contributions.
Atmosphere 06 00732 g008

4. Conclusions

The composition of precipitation at three sites in the Shihwa Basin was studied from June 2000 to November 2007. A total of 532 wet-only precipitation samples were used to characterize features of the precipitation and to evaluate the influence of anthropogenic sources.
The VWM for pH for all sites combined was 4.84, with pH < 5.0 in 66% of the precipitation samples, confirming that precipitation in the Shihwa Basin is acidic. The chemical composition of the precipitation was influenced by both natural (sea salt and soil components) and anthropogenic (acidic and alkali components) sources. SO42 and NH4+ were the dominant ions, followed by NO3 and sea salts. Based on the H+/(NO3 + SO42) ratio, 66% of the acidity in the Shihwa Basin was neutralized by alkaline particles. The SO42/NO3 ratio showed that the contribution of SO42 to acidity was twice as high as that of NO3. Seventy-four percent of the rain fell during the summer, when the concentrations of all of the ions were significantly lower than those in other seasons.
Although the mean concentrations of the anthropogenic components (NO3 + SO42 + NH4+) in the Shihwa basin were 1.8~2.2 times higher than those in Seoul, the VWM concentrations of most of the chemical components were lower than those in other areas of East Asia. To identify the sources of the inorganic species in wet-only precipitation, the components were evaluated using statistical analysis. The moderate correlations of H+ with NO3 and SO42 and the strong correlations of NO3 and SO42 with NH4+, Mg2+, and Ca2+ suggest that neutralization reactions have a strong effect on acidity in the Shihwa Basin. Power generating facilities have expanded in the vicinity of the Shihwa basin from 2002 to 2013. This trend may have impacted the trend of increasing SO42 concentrations during the study period. The results from PMF indicated that the main contributors to the wet-only precipitation chemical components in this study were secondary aerosols (40%–42%) followed by acidity (16%–23%), while sea salts and Asian dust contributed 19%–26% and 17%–18%, respectively.

Acknowledgments

This work was supported by the National Research Foundation of Korea (NRF-2009-413-B00004) and funded by the Korean Ministry of Education, Science and Technology.

Author Contributions

Seung-Myung Park: Sampling, Data analysis, Drafting of Manuscript
Beom-Keun Seo: Sampling, Data analysis
Gangwoong Lee: Study conception and design, Research performance, Critical revision
Sung-Hyun Kahang: Study conception and design
Yu Woon Jang: Sampling, Data analysis, Drafting of Manuscript

Conflicts of Interest

The authors declare no conflict of interest.

References

  1. Draaijers, G.; Erisman, J.; Lövblad, G.; Spranger, T.; Vel, E. Quality and Uncertainty Aspects of Forest Deposition Estimation using Throughfall, Stemflow and Precipitation Measurements; TNO-MEP Report 98/093; TNO Institute of Environmental Sciences, Energy Research and Process Innovation: Apeldoorn, The Netherlands, 1998. [Google Scholar]
  2. Duhanyan, N.; Roustan, Y. Below-cloud scavenging by rain of atmospheric gases particulates. Atmos. Environ. 2011, 39, 7201–7217. [Google Scholar] [CrossRef]
  3. Saxena, A.; Kulshrestha, U.C.; Kumar, N.; Kumari, K.M.; Srivastava, S.S. Characterization of precipitation at Arga. Atmos. Environ. 1996, 30, 3405–3412. [Google Scholar] [CrossRef]
  4. Hara, H. Acid deposition chemistry in Asia, Europe, and North America. Progress Nuclear Energy 1998, 32, 331–338. [Google Scholar] [CrossRef]
  5. Akkoyunlu, B.O.; Tayanç, M. Analyses of wet and bulk deposition in four different regions of Istanbul, Turkey. Atmos. Environ. 2003, 37, 3571–3579. [Google Scholar] [CrossRef]
  6. Vázquez, A.; Costoya, M.; Peña, R.M.; García, S.; Herrero, C. A rainwater quality monitoring network: A preliminary study of the composition of rainwater in Galicia (NW Spain). Chemosphere 2003, 51, 375–386. [Google Scholar] [CrossRef] [PubMed]
  7. Wai, K.M.; Wang, S.H.; Taner, P.A.; Lin, N.H. A dual site study of the rainwater chemistry within the western Pacific region. J. Atmos. Chem. 2007, 57, 85–103. [Google Scholar] [CrossRef]
  8. Santos, M.A.; Illanes, C.F.; Fornaro, A.; Pedrotti, J.J. Acid rain in downtown São Paulo City, Brazil. Water Air Soil Pollut. Focus 2007, 7, 85–92. [Google Scholar] [CrossRef]
  9. Avila, A.; Alarcó, M.; Queralt, I. The chemical composition of dust transported in red rains-its contribution to the biogeochemical cycle of a holm oak forest in Catalonia (Spain). Atmos. Environ. 1997, 32, 179–191. [Google Scholar] [CrossRef]
  10. Galloway, J.N. Acidification of the world: Natural and anthropogenic. Water Air Soil Pollut. 2001, 130, 17–24. [Google Scholar] [CrossRef]
  11. Bashkin, V.N.; Radojevic, M. Acid rain and its mitigation in Asia. Int. J. Environ. Stud. 2003, 60, 205–214. [Google Scholar] [CrossRef]
  12. Luo, J.; Wang, X.; Yang, H.; Yu, J.Z.; Yang, L.; Qin, B. Atmospheric phosphorous in the northern part of Lake Taihu, China. Chemosphere 2011, 84, 785–791. [Google Scholar] [CrossRef] [PubMed]
  13. Munger, J.W.; Eisenreich, S. Continental-scale variations in precipitation chemistry. Environ. Sci. Technol. 1983, 17, 32A–42A. [Google Scholar] [CrossRef]
  14. Downing, C.E.H.; Vincent, K.J.; Campbell, G.W.; Fowler, D.; Smith, R.I. Trends in wet and dry deposition of sulphur in the United Kingdom. Water Air Soil Pollut. 1995, 85, 659–664. [Google Scholar] [CrossRef]
  15. Okuda, T.; Iwase, T.; Ueda, H.; Suda, Y.; Tanaka, S.; Dokiya, Y.; Fushimi, K.; Hosoe, M. Long-term trend of chemical constituents in precipitation in Tokyo metropolitan area, Japan, from 1990 to 2002. Sci. Total Environ. 2005, 339, 127–141. [Google Scholar] [CrossRef] [PubMed]
  16. Tu, J.; Wang, H.; Zhang, Z.; Jin, X.; Li, W. Trends in chemical composition of precipitation in Nanjing, China, during 1992–2003. Atmos. Res. 2005, 73, 283–298. [Google Scholar] [CrossRef]
  17. Noguchi, I.; Hara, H. Ionic imbalance due to hydrogen carbonate from Asian dust. Atmos. Environ. 2004, 38, 6969–6976. [Google Scholar] [CrossRef]
  18. Fowler, D.; Smith, R.I.; Muller, J.B.A.; Hayman, G.; Vincent, K.J. Changes in the atmospheric deposition of acidifying compounds in the UK between 1986 and 2001. Environ. Pollut. 2005, 137, 15–25. [Google Scholar] [CrossRef] [PubMed]
  19. Sicard, P.; Coddeville, P.; Sauvage, S.; Galloo, J.C. Trends in chemical composition of wet-only precipitation at rural French monitoring stations over the 1990–2003 period. Water Air Soil Pollut. Focus 2007, 7, 49–58. [Google Scholar] [CrossRef]
  20. Zbieranowski, A.; Aheme, J. Long-term trends in atmospheric reactive nitrogen across Canada: 1899–2007. Atmos. Environ. 2011, 45, 5853–5862. [Google Scholar] [CrossRef]
  21. Larssen, T.; Seip, H.M.; Semb, A.; Mulder, J.; Muniz, I.P.; Vogt, R.D.; Lydersen, E.; Angell, V.; Dagang, T.; Eilertsen, O. Acid deposition and its effects in China: An overview. Environ. Sci. Policy 1999, 2, 9–24. [Google Scholar] [CrossRef]
  22. Park, S.U.; Kim, J.W. Aerosol size distributions observed at the Seoul National University campus in Korea during the Asian dust and non-Asian dust periods. Atmos. Environ.t 2006, 40, 1772–1730. [Google Scholar]
  23. Fu, P.; Huang, J.; Li, C.; Zhong, S. The properties of dust aerosol and reducing tendency of the dust storms in northwest China. Atmos. Environ. 2008, 42, 5896–5904. [Google Scholar] [CrossRef]
  24. Kim, J. Transport routes and source regions of Asian dust observed in Korea during the past 40 years (1965–2004). Atmos. Environ. 2008, 42, 4778–4789. [Google Scholar] [CrossRef]
  25. Zhao, D.; Xiong, J.; Xu, Y.; Chan, W.H. Acid rain in southwestern China. Atmos. Environ. 1988, 22, 349–358. [Google Scholar] [CrossRef]
  26. Herut, B.; Starinsky, A.; Katz, A.; Rosenfeld, D. Relationship between the acidity and chemical composition of rainwater and climatological conditions along a transition zone between large deserts and Mediterranean climate, Israel. Atmos. Environ. 2000, 34, 1281–1292. [Google Scholar] [CrossRef]
  27. Basak, B.; Alagha, O. The chemical composition of rainwater over Büyüqkçekmece Lake, Istanbul. Atmos. Res. 2004, 71, 275–288. [Google Scholar] [CrossRef]
  28. Wei, H.; Wang, J.L. Characteristics of acid rain in Jinyun Mountain, Chongqing, China. Appl. Ecol. Environ. Res. 2005, 3, 29–37. [Google Scholar] [CrossRef]
  29. Park, C.J.; Noh, H.R.; Kim, B.G.; Kim, S.Y.; Jung, I.U.; Cho, C.R.; Han, J.S. Evaluation of acid deposition in Korea. Water Air Soil Pollut. 2001, 130, 445–450. [Google Scholar] [CrossRef]
  30. Kang, G.; Collettjr, J.L.; Shin, D.Y.; Fujita, S.I.; Kim, H.K. Comparison of the chemical composition of precipitation on the western and eastern coasts of Korea. Water Air Soil Pollut. 2004, 151, 11–34. [Google Scholar] [CrossRef]
  31. Kim, S.B.; Choi, B.C.; Oh, S.Y.; Kim, S.; Kang, G.U. Acidity and chemical composition of precipitation at background area of the Korean Peninsula (Anmyeon, Uljin, Gosan). J. Korean Soc. Atmos. Environ. 2006, 22, 15–24. [Google Scholar]
  32. Kim, K.J.; Bu, J.-O.; Kim, W.H.; Lee, Y.S.; Hyeon, D.R.; Kang, C.H. Pollution characteristics of rainwater at Jeju Island during 2009~2010. J. Korean Soc. Atmos. Environ. 2013, 29, 818–829. [Google Scholar] [CrossRef]
  33. Choi, J.S.; Park, J.S.; Ahn, J.Y.; Oh, J.; Son, J.S.; Kim, H.J.; Sung, M.Y.; Lee, Y.H.; Lee, S.D.; Hong, Y.D.; et al. The characteristics of long-term variation of acid deposition in Korea. J. Korean Soc. Environ. Anal. 2015, 1, 26–37. [Google Scholar]
  34. Lee, S.I.; Kim, B.C.; Oh, H.J. Evaluation of lake modification alternatives for Lake Sihwa. Korea Environ. Manag. 2002, 29, 57–66. [Google Scholar] [CrossRef]
  35. Kim, K.T.; Kim, E.S.; Cho, S.R.; Chung, K.H.; Park, J.K. Distribution and pollution of heavy metals in the environmental samples of the Lake Sihwa. J. Korean Soc. Marine Environ. Eng. 2005, 8, 148–157. [Google Scholar]
  36. Im, M.S.; Kim, K.H.; Choi, Y.J.; Jeon, E.C. Emission characteristics of VOC due to major industrial activities in the Banwol industrial complex. J. Korean Soc. Atmos. Environ. 2006, 22, 325–336. [Google Scholar]
  37. Jung, J.; Jang, Y.W.; Arimoto, R.; Uematsu, M.; Lee, G. Atmospheric nitrogen deposition and its impact to Lake Sihwa in South Korea. Geochem. J. 2009, 43, 305–314. [Google Scholar] [CrossRef]
  38. Butler, T.J.; Likens, G.E. Weekly and daily precipitation chemistry network comparisons in the eastern U.S.: NADP/NTN vs. MAP3S/AIRMoN. Atmos. Environ. 1998, 32, 3749–3765. [Google Scholar] [CrossRef]
  39. Gilliland, A.B.; Butler, T.J.; Likens, G.E. Monthly and annual bias in weekly (NADP/NTN) vs. daily (AIRMoN) precipitation chemistry data in the Eastern USA. Atmos. Environ. 2002, 36, 5197–5206. [Google Scholar] [CrossRef]
  40. Sequeira, R.; Lung, F. A critical data analysis and interpretation of the pH, ion loadings and electrical conductivity of rainwater from the territory of Hong Kong. Atmos. Environ. 1995, 29, 2439–2447. [Google Scholar] [CrossRef]
  41. Staelens, J.; Schrijver, A.D.; Avermaet, P.V.; Genouw, G.; Verhoest, N. A comparison of bulk and wet-only deposition at two adjacent sites in Melle (Belgium). Atmos. Environ. 2005, 39, 7–15. [Google Scholar] [CrossRef]
  42. Satsangi, G.S.; Khare, L.P.; Singh, S.P.; Kumari, K.M.; Srivastava, S.S. Composition of rain water at a semi-arid rural site in India. Atmos. Environ. 1998, 32, 3783–3793. [Google Scholar] [CrossRef]
  43. Jain, M.; Kulshrestha, U.C.; Sarkar, A.K.; Parashar, D.C. Influence of crustal aerosols on wet deposition at urban and rural sites in India. Atmos. Environ. 2000, 34, 5129–5137. [Google Scholar] [CrossRef]
  44. Al-Khashman, O.A. Ionic composition of wet precipitation in the Petra Region, Jordan. Atmos. Environ. 2005, 78, 1–12. [Google Scholar]
  45. Edmonds, R.L.; Thomas, T.B.; Rhodes, J.J. Canopy and Soil Modification of Precipitation Chemistry in a Temperate Rain Forest. Soil Sci. Soc. Am. J. 1991, 55, 1685–1693. [Google Scholar] [CrossRef]
  46. Environmental Protection Agency (EPA). EPA Positive Matrix Factorization (PMF) 3.0 Fundamentals and User Guide; USEPA Office of Research and Development: Research Triangle Park, NC, USA, 2008. [Google Scholar]
  47. Gugamstty, B.; Wei, H.; Liu, C.N.; Awasthi, A.; Hsu, S.C.; Tsai, C.J.; Roam, G.D.; Wu, Y.C.; Chen, C.F. Source characterization and apportionment of PM10, PM2.5 and PM0.1 by using positive matrix factorization. Aerosol Air Qual. Res. 2012, 12, 476–491. [Google Scholar]
  48. Environmental Protection Agency (EPA). EPA Positive Matrix Factorization (PMF) 5.0 Fundamentals and User Guide; Environmental Protection Agency: Washington, DC, USA, 2014. [Google Scholar]
  49. García, R.; Ma, D.T.; Padilla, H.; Belmont, R.; Azpra, E.; Arcega-Cabrera, F.; Báez, A. Measurement of chemical elements in rain from Rancho Viejo, a rural wooded area in the State of Mexico, Mexico. Atmos. Environ. 2006, 40, 6088–6100. [Google Scholar] [CrossRef]
  50. Kai, Z.; Huiwang, G. The characteristics of Asian-dust storms during 2000–2002: From the source to the sea. Atmos. Environ. 2007, 41, 9136–9145. [Google Scholar] [CrossRef]
  51. Topcu, S.; Incecik, S.; Atimtay, A.T. Chemical composition of rainwater at EMEP station in Ankara, Turkey. Atmos. Res. 2002, 65, 77–92. [Google Scholar] [CrossRef]
  52. Hegde, P.; Sudheer, A.K.; Sarin, M.M.; Manjunatha, B.R. Chemical characteristics of atmospheric aerosols over southwest coast of India. Atmos. Environ. 2007, 41, 7751–7766. [Google Scholar] [CrossRef]
  53. Das, R.; Das, S.N.; Misra, V.N. Chemical composition of rainwater and dustfall at Bhubaneswar in the east coast of India. Atmos. Environ. 2005, 39, 5908–5916. [Google Scholar] [CrossRef]
  54. Tanner, P.A. Analysis of Hong Kong daily bulk and wet deposition data from 1994 to 1995. Atmos. Environ. 1999, 33, 1757–1766. [Google Scholar] [CrossRef]
  55. Migliavacca, D.M.; Teixeira, E.C.; Wiegand, F.; Machado, A.C.M.; Sanchez, J. Atmospheric precipitation and chemical composition of an urban site, Guaíba hydrographic basin, Brazil. Atmos. Environ. 2005, 39, 1829–1844. [Google Scholar] [CrossRef]
  56. Sanusi, A.; Wortham, H.; Millet, M.; Mirabel, P. Chemical composition of rainwater in eastern France. Atmos. Environ. 1996, 30, 59–71. [Google Scholar] [CrossRef]
  57. Al-Khashman, O.A. Study of chemical composition in wet atmospheric precipitation in Eshidiya area, Jordan. Atmos. Environ. 2005, 39, 6175–6183. [Google Scholar] [CrossRef]
  58. Sorooshian, A.; Shingler, T.; Harpold, C.; Feagles, C.W.; Meixner, T.; Brooks, P.D. Aerosol and precipitation chemistry in the southwestern United States: Spatiotemporal trends and interrelationship. Atmos. Chem. Phys. 2013, 13, 7361–7379. [Google Scholar] [CrossRef] [PubMed]
  59. Dayan, U.; Lamb, D. Meteorological indicators of summer precipitation chemistry in central Pennsylvania. Atmos. Environ. 2003, 37, 1045–1055. [Google Scholar] [CrossRef]
  60. Báez, A.P.; Belmont, R.D.; García, R.M.; Torres, M.C.B.; Padilla, H.G. Rainwater chemical composition at two sites in Central Mexico. Atmos. Res. 2006, 80, 67–85. [Google Scholar] [CrossRef]
  61. Herrera, J.; Rodriguez, S.; Baez, A.P. Chemical composition of bulk precipitation in the metropolitan area of Costa Rica, Central America. Atmos. Res. 2009, 94, 151–160. [Google Scholar] [CrossRef]
  62. Kulshrestha, U.C.; Kulshrestha, M.J.; Sekar, R.; Sastry, G.S.R.; Vairamani, M. Chemical characteristics of rainwater at an urban site of south-central India. Atmos. Environ. 2003, 37, 3019–3026. [Google Scholar] [CrossRef]
  63. Acid Deposition Monitoring Network in East Asia (EANET). Data report on the acid deposition in the East Asian region 2001–2012; Network Center for EANET: Nigata-si, Japan, 2013.
  64. Kang, G.U.; Lim, J.H.; Kim, H.K. An analysis of long-term trends in precipitation acidity of Seoul, Korea. J. Korea Air Pollut. Res. Assoc. 1997, 13, 9–18. [Google Scholar]
  65. Safai, P.D.; Rao, P.S.P.; Momin, G.A.; Ali, K.; Chate, D.M.; Praveen, P.S. Chemical composition of precipitation during1984–2002 at Pune, India. Atmos. Environ. 2004, 38, 1705–1714. [Google Scholar] [CrossRef]
  66. Zhang, G.S.; Zhang, J.; Liu, S.M. Chemical composition of atmospheric wet depositions from the Yellow Sea and East China Sea. Atmos. Res. 2007, 85, 84–97. [Google Scholar] [CrossRef]
  67. Rastogi, N.; Sarin, M.M. Chemistry of precipitation events and inter-relationship with ambient aerosols over a semi-arid region. J. Atmos. Chem. 2007, 56, 149–163. [Google Scholar] [CrossRef]
  68. Aikawa, M.; Hiraki, T.; Tamaki, M. Comparative field study on precipitation, throughfall, stemflow, fog water, and atmospheric aerosol and gases at urban and rural sites in Japan. Sci. Total Environ. 2006, 366, 275–285. [Google Scholar] [CrossRef]
  69. Hand, J.L.; Gebhart, K.A.; Schichtel, B.A.; Malm, W.C. Increasing trends in wintertime particulate sulfate and nitrate ion concentrations in the great Plains of the United States (2000–2010). Atmos. Environ. 2012, 55, 107–110. [Google Scholar] [CrossRef]
  70. Aherne, J.; Farrell, E.P. Deposition of sulphur, nitrogen and acidity in precipitation over Ireland: Chemistry, spatial distribution and long-term trends. Atmos. Environ. 2002, 36, 1379–1389. [Google Scholar] [CrossRef]
  71. Fornaro, A.; Gutz, I.G.R. Wet deposition and related atmospheric chemistry in the São Paulo metropolis, Brazil, Part 3: Trends in precipitation chemistry during 1983–2003. Atmos. Environ. 2006, 40, 5893–5901. [Google Scholar] [CrossRef]
  72. Puxbaum, H.; Simeonov, V.; Kalina, M.; Tsakovski, S.; Löffler, H.; Heimburger, G.; Biebl, P.; Weber, A.; Damm, A. Long-term assessment of the wet precipitation chemistry in Austria (1984–1999). Chemosphere 2002, 48, 733–747. [Google Scholar] [CrossRef] [PubMed]
  73. Zhang, M.; Wang, S.; Wu, F.; Yuan, X.; Zhang, Y. Chemical compositions of wet precipitation and anthropogenic influences at a developing urban site in southeastern China. Atmos. Res. 2007, 84, 311–322. [Google Scholar] [CrossRef]
  74. Báez, A.; Belmont, R.; García, R.; Padilla, H.; Torres, M.C. Chemical composition of rainwater collected at a southwest site of Mexico City, Mexico. Atmos. Res. 2007, 86, 61–75. [Google Scholar] [CrossRef]
  75. Anttila, P.; Paatero, P.; Tapper, U.; Järvinen, O. Source identification of bulk wet deposition in Finland by positive matrix factorization. Atmos. Environ. 1995, 29, 1705–1718. [Google Scholar] [CrossRef]
  76. Kitayama, K.; Murao, N.; Hara, H. PMF analysis of impacts of SO2 from Miyakejima and Asian continent on precipitation sulfate in Japan. Atmos. Environ. 2010, 44, 95–105. [Google Scholar] [CrossRef]

