Article

In-Situ Aircraft Measurements of the Vertical Distribution of Black Carbon in the Lower Troposphere of Beijing, China, in the Spring and Summer Time

1
Beijing Weather Modification Office, Beijing, 100089, China
2
Beijing Key Laboratory of Cloud, Precipitation and Atmospheric Water Resources, Beijing 100089, China
3
Institute of Urban Meteorology, Chinese Meteorological Administration, Beijing 100089, China
4
Key Laboratory of Aerosol Science and Technology, SKLLQG, Institute of Earth Environment, Chinese Academy of Sciences, Xi'an 710061, China
5
National Center for Atmospheric Research, Boulder, CO 80303, USA
6
Development Research Center of China Meteorological Administration, Beijing 100081, China
*
Authors to whom correspondence should be addressed.
Atmosphere 2015, 6(5), 713-731; https://doi.org/10.3390/atmos6050713
Submission received: 4 March 2015 / Revised: 5 May 2015 / Accepted: 11 May 2015 / Published: 20 May 2015
(This article belongs to the Special Issue Sources, Formation and Impacts of Secondary Aerosol)

Abstract

:
Due to rapid economic development in recent years, China has become a major global source of refractory black carbon (rBC) particles. However, surface rBC measurements have been limited, and the lower troposphere suffers from a complete lack of measurements, especially in heavily rBC-polluted regions such as China’s capital, Beijing (BJ). In this study, we present the first concentration measurements using an airborne Single Particle Soot Photometer (SP2) instrument, including vertical distributions, size distributions, and the mixing state of rBC particles in the lower troposphere in BJ and its surrounding areas. The measurements were conducted from April to June 2012 during 11 flights. The results show that the vertical rBC distributions had noticeable differences between different air masses. When an air mass originated from the south of BJ (polluted region), the rBC particles were strongly compressed in the planetary boundary layer (PBL), and showed a large vertical gradient at the top of the PBL. In contrast, when an air mass originated from the north of BJ (clean region), there was a small vertical gradient. This analysis suggests that there was significant regional transport of rBC particles that enhanced the air pollution in BJ, and the transport not only occurred near the surface but also in the middle levels of the PBL (around 0.5 to 1 km). The measured size distributions show that about 80% of the rBC particles were between the diameters of 70 and 400 nm, and the mean diameter of the peak rBC concentrations was about 180–210 nm. This suggests that the rBC particles were relatively small particles. The mixing state of the rBC particles was analyzed to study the coating processes that occurred on the surface of these particles. The results indicate that the air mass strongly affected the number fraction (NF) of the coated particles. As for a southern air mass, the local air pollution was high, which was coupled with a lower PBL height and higher humidity. Consequently, hygroscopic growth occurred rapidly, producing a high NF value (~65%) of coated rBC particles. The correlation coefficient between the NF and the local relative humidity (RH) was 0.88, suggesting that the rBC particles were quickly converted from hydrophobic to hydrophilic particles. This rapid conversion is very important because it suggests a shorter lifetime of rBC particles under heavily polluted conditions. In contrast, under a northern air mass, there was no clear correlation between the NF and the local humidity. This suggests that the coating process occurred during the regional transport in the upwind region. In this case, the lifetime was longer than the southern air mass condition.

1. Introduction

Refractory black carbon (rBC) aerosol particles are emitted during incomplete combustion. Moreover, they serve as the most significant particulate absorbers of solar radiation in the atmosphere, significantly affecting the climate [1,2,3] as well as atmospheric photochemistry [4,5]. Airborne rBC can change the vertical temperature distributions in the atmosphere by absorbing more solar radiation [6,7,8], producing significant effects on the solar radiation at the Earth’s surface [9]. The particles also act as cloud condensation nuclei [10,11,12,13], leading to changes in cloud formation.
China is a major global source of rBC particles [14,15], and it is important to understand the horizontal and vertical distributions of rBC particles in this region. Several measurements of rBC particles have been conducted using mostly filter and/or optical methods in this region [16,17,18,19,20,21]. However, these measurements were performed only at ground stations and no measurements were conducted in the lower troposphere due to instrument limitations, for example, a low temporal resolution and an inability to be used in aircraft measurements. The development of the Single Particle Soot Photometer (SP2) by the Droplet Measurement Technologies Company (DMT, Boulder, CO, USA) provides high sensitivity for detecting the concentrations, size distributions, and mixing state of rBC particles, which enables the SP2 instrument to conduct in-situ airborne measurements. A number of airborne observations using SP2 were carried out in Europe [22,23,24], East Asia, North Pacific [15,25,26,27,28], and North America [6,7,8,29,30,31,32,33]. Measurements of rBC particles using the SP2 instrument in China are limited [34,35] and these data were primarily used for surface-based studies. As there are no airborne studies of rBC in China, there is a lack of information regarding the vertical distributions of rBC particles in this region.
In order to obtain vertical information on the concentrations, size distribution, and mixing state of rBC particles in the Beijing (BJ) region, we present the first in-situ aircraft measurement of rBC particles in this region, which was conducted using an SP2 instrument that was mounted on an aircraft (Yun-12). The experiment was conducted in BJ and its surrounding areas. In total, 11 flights took place between April, May, and June 2012. The detailed flight information and analysis of the results are described in the following sections.

2. Experimental Information

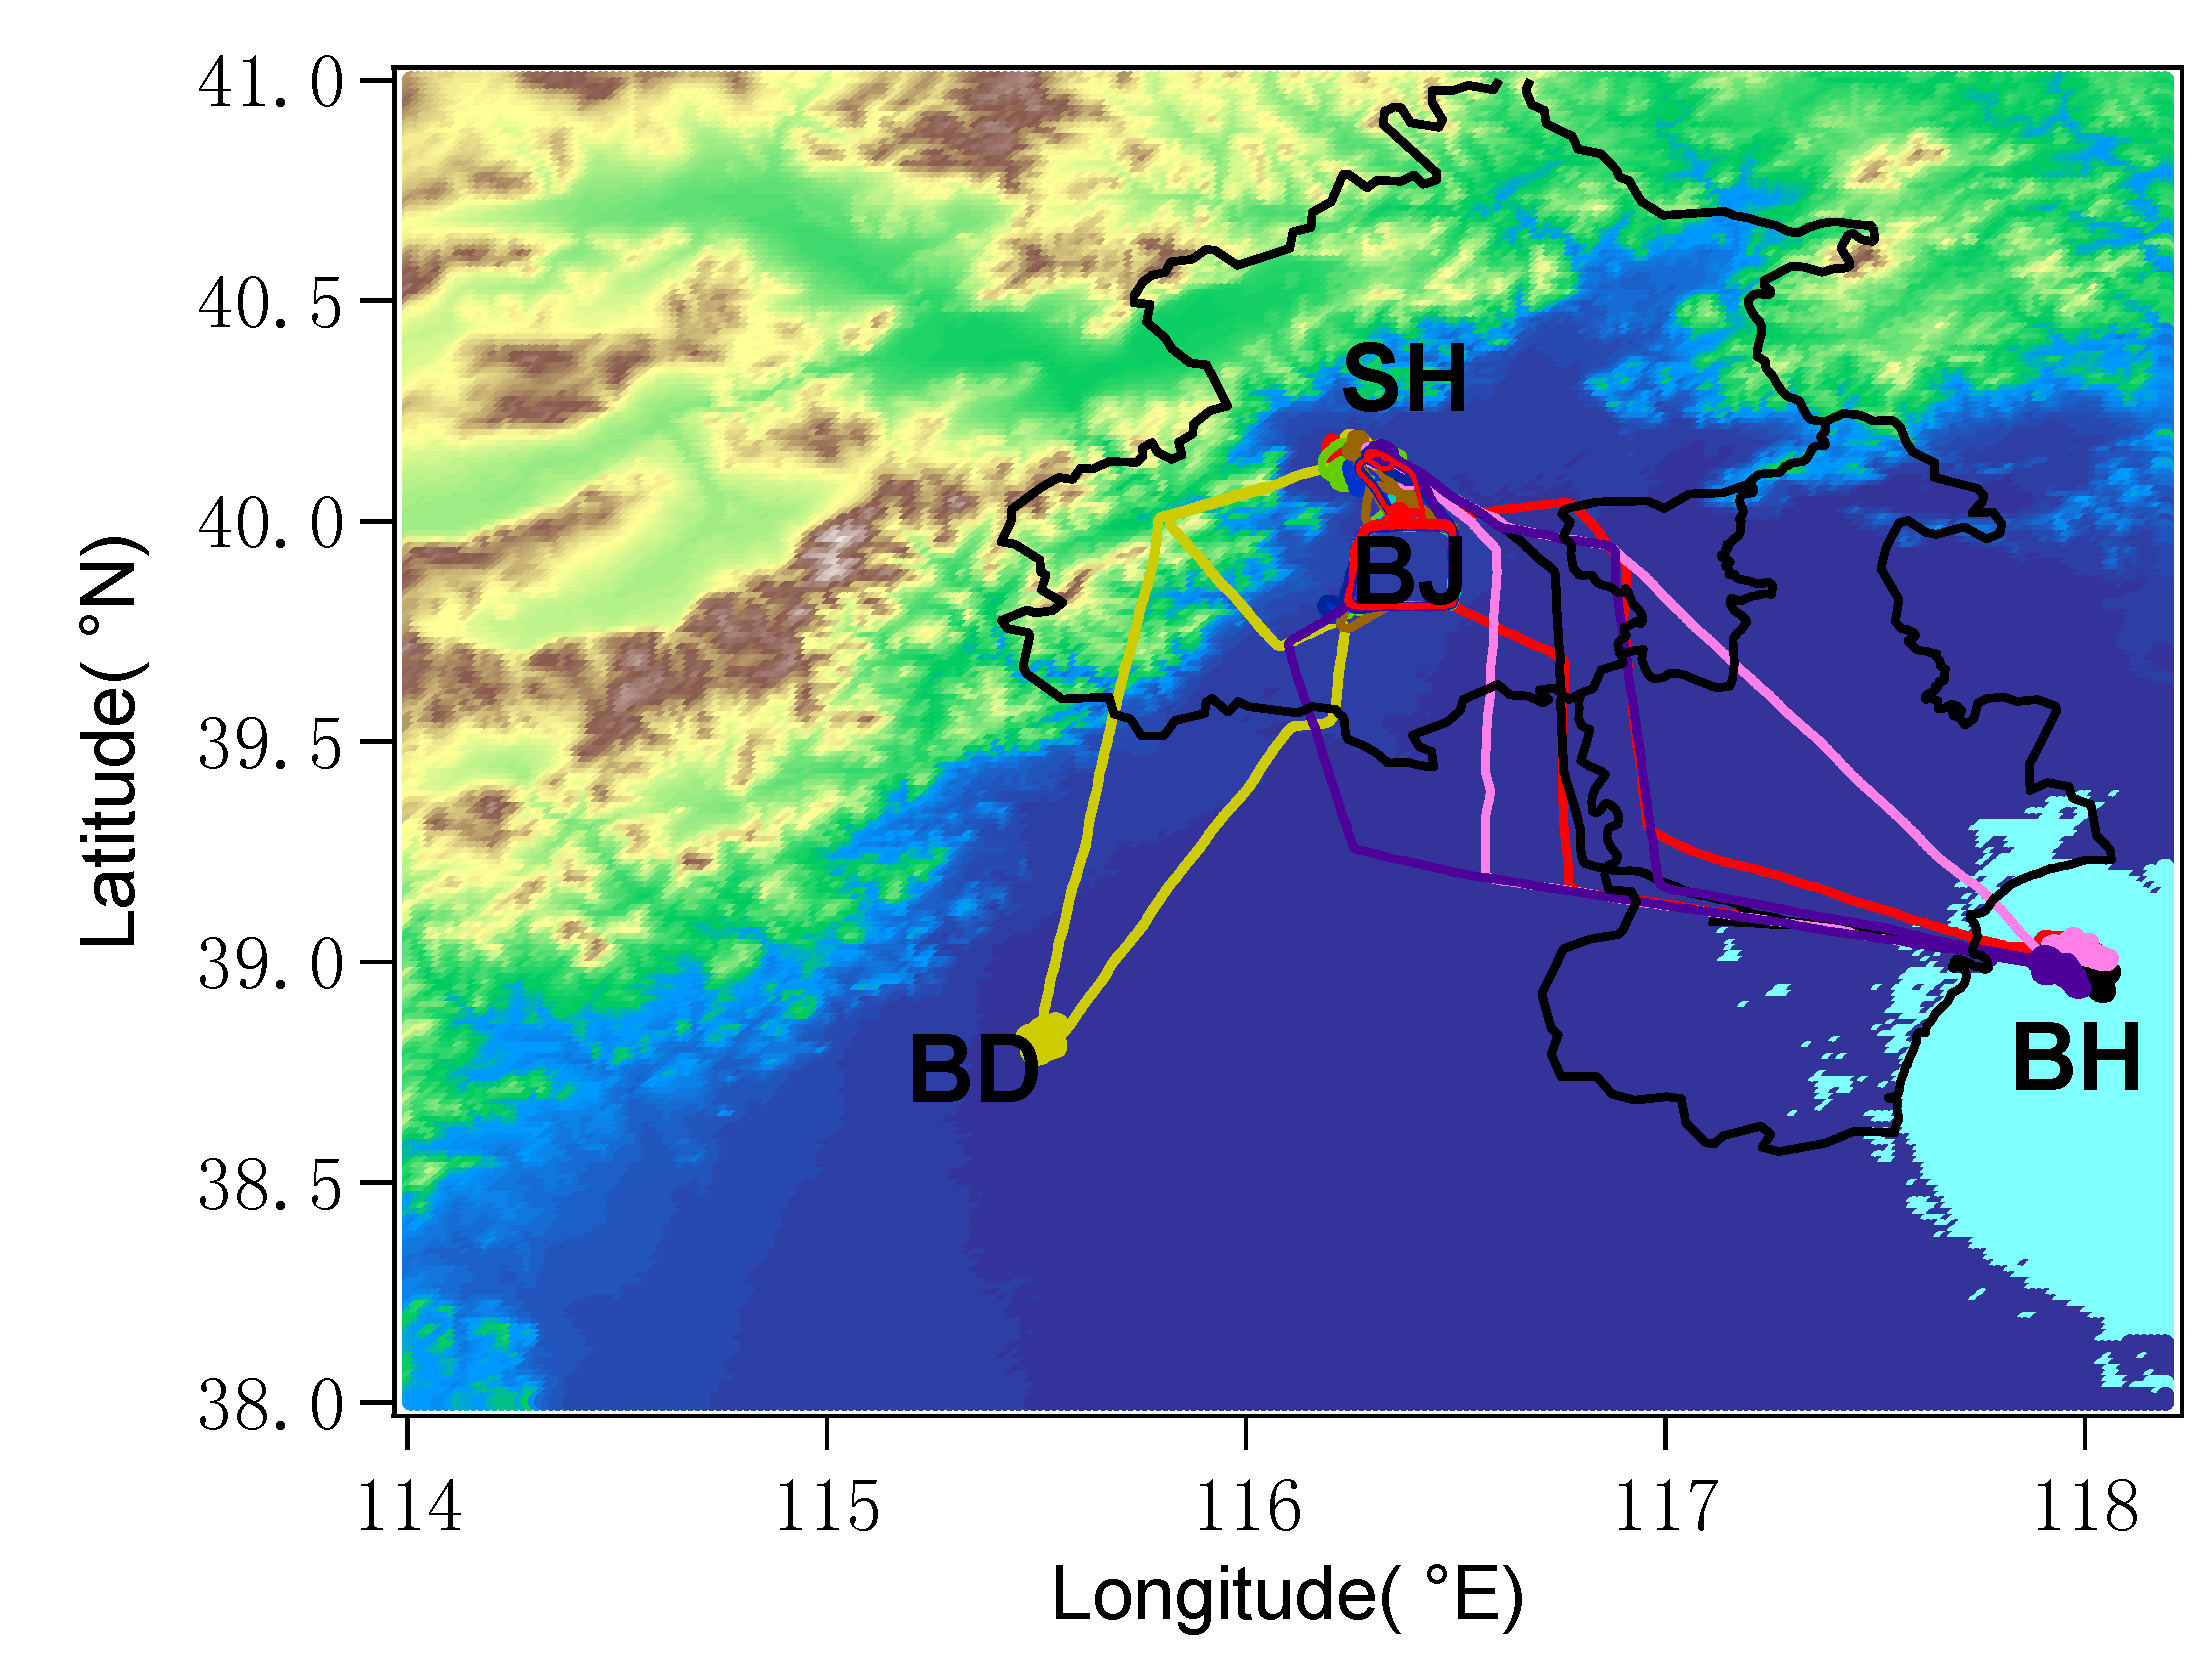
2.1. Flights and Instruments

The Yun-12 airplane was selected in this study. The Yun-12 is a small airplane that maintains an average flight speed of 200 km/h and is an unsealed turboprop airplane with a maximum flight altitude of 7000 m. The in-situ pressure and temperature inside the cabin is the same as the ambient pressure and temperature. An SP2 instrument was mounted inside this airplane with an external inlet, namely the Model 1200 (Passive) Isokinetic Aerosol Sampling Inlet (BMI, Brechtel Manufacturing Inc., Hayward, CA, USA). The inlet was designed to deliver a sample flow of 150 lpm with an air speed of 100 m/s. In addition, it transmits particles with diameters between 0.01 and 6 μm with more than 95% efficiency.
The airport chosen for this study was the Shahe (SH) Airport, which is located on the north edge of BJ. The major research flights around BJ (the BJ region) took place under cloud-free conditions from April to June 2012. Detailed information regarding the dates and flight times of all of the flights was recorded (see Table 1 and Table 2). There were four different flight routes during the 10 flights (see Figure 1). The vertical mass distributions, size distributions, and NF (number fraction of coated particles) of the rBC particles were measured during the flights. For more details on the flight route information, the study by Zhang et al. [36] is referenced, and their method was adopted for this study.
Table 1. Information about the flights.
StyleRegionDateSampling Time (Local Time)The Direction of Air Mass in the PBL
ABeijing City (BJ)3 May10:20 a.m.–1:50 p.m.Northwest
19 May9:30 a.m.–12:15 p.m.South and southwest
23 May9:15 a.m.–12:40 p.m.Northwest
31May9:35 a.m.–12:15 p.m.Southwest
11 June9:05 a.m.–12:00 p.m.Northwest
16 June9:30 a.m.–12:30 p.m.Northwest
BBaoding (BD)17 April12:24 p.m.–3:29 p.m.Southwest
CBohai Sea (BH)14 April9:50 a.m.–1:20 p.m.Southwest
25 May12:15 p.m.–3:30 p.m.Southwest
9 June10:00 a.m.–1:00 p.m.Southwest
15 June9:35 a.m.–1:25 p.m.North
Table 2. Summary of measured results from different flight locations a.
Site and DateRelative Humidity (%)Average BC Mass Concentration (ng/m3)Average BC Number Concentration (#/cm3)The Peak Diameter for BC Mass (nm)Number Fraction (NF) of Coated Particles (%)
BJ3 May10.3461.228217220.5
19 May73.14022.8161519362.2
23 May16.1236.513717511
11 June20.1440.324617914.7
16 June30.1482.628917214.5
BH14 April4.4208.710018943
25 May15.7315.613119726.5
9 June43.6617.822318650.4
15 June75.430316317227
BD17 April57.61618.553220642.2
SH14 April9.1901.937318530.7
17 April53.42670.699120063.2
3 May8.6369.223016120.3
23 May111909818513.7
a All data were collected in the boundary layer, except the average data on 31 May, which are not listed because the height of the boundary layer was lower than the minimum height of the flight. The SH measurements only occurred when the airplane took off and landed; furthermore, the airplane must descend from a height of 3600 m.
The rBC emission inventory of the region [37] was also recorded (see Figure 2). According to this inventory, there are very heavy rBC emissions located in the south of BJ. Under south wind conditions, polluted rBC air is transported to BJ (southern air mass condition). In contrast, in BJ, there are less polluted regions. Under north wind conditions, clean air is transported to BJ (northern air mass condition). In the following analysis, we study the effects of different air mass conditions by separating the air mass according to their wind directions.
Figure 1. Flight route information. All flight routes are indicated by different color lines, and the labels (Beijing (BJ), Shahe (SH), Baoding (BD), and Bohai Sea (BH)) represent different locations where the vertical profiles of rBC were measured. The terrain of the region is shown by the shaded colors.
Atmosphere 06 00713 g001
Figure 2. rBC emissions in the region (unit, ton/year in a 0.5° × 0.5° grid). The white arrow indicates the northern air mass from the remote region, and the orange arrow indicates the southern air mass from the polluted region.
Atmosphere 06 00713 g002
Two major flight types were designed and subsequently applied to this study (see Figure 3). The first flight type (see Figure 3a) was mainly designed for measuring the detailed vertical distribution of rBC particles at the SH Airport. Over the airport, the aircraft first climbed to a height of approximately 3.6 km and then spirally descended to the surface. The detailed vertical distributions were measured at different altitudes during the descending flights, with a total flight time of 30 min. The second flight type (see Figure 3b) was mainly designed for vertical distribution measurements in other areas. For example, the aircraft climbed from BJ to the Bohai Sea (BH), and then descended down to the BH. The vertical distributions of rBC were measured from 3.6 to 0.6 km at different altitudes on the downward descent of the aircraft.
The PBL height was calculated using atmospheric sounding data and dew point vertical profiles. The sounding measurements were conducted at the observation site of the Beijing Meteorological Bureau, which is close to both BJ and SH. Detailed information on the sounding measurements and the methodology for the PBL height calculation can be found in the study performed by Quan et al. [38]. The dew point data were measured on the aircraft using an AIMMES-20 instrument designed by Aventech Research Inc. (Barrie, ON, Canada), which recorded the relative humidity (RH) with a temporal resolution of one second.
Figure 3. The major flight types used in this study. The first flight type (a) was mainly designed for measuring the detailed vertical distribution of rBC particles at the SH Airport; The second flight type (b) was mainly designed for vertical distribution measurements in other areas. The colors indicate the flight altitude (m).
Atmosphere 06 00713 g003

2.2. Single Particle Soot Photometer (SP2)

The SP2 measured every single rBC particle. The methodology and setup of the SP2 have been described previously [7,25,31]. After each particle was measured and recorded, the instrument calculated the sum of all the particles to determine the total mass of rBC. The mass concentrations of rBC were then calculated as the total mass divided by the sample volume. The detection diameters of single rBC particles ranged from 45 to 470 nm. By fitting a lognormal distribution to the measurements, the amount of rBC mass outside the measurement range of the SP2 can be estimated. The SP2 was calibrated before every flight. The incandescence signals were calibrated with Aquadag samples provided by the SP2 research group. Mono-disperse polystyrene latex spheres (PSL) of different sizes were used to calibrate the scattering channels. The SP2 works at ambient pressure on the airplane and the SP2 data are processed under standard atmospheric pressure in the calculation. In the aircraft, the SP2 sampled the air using an external inlet. In order to maintain a constant volume flow of ambient air into the laser beam, the pressure in the optical head changed with the ambient air pressure. The sensitivity of the rBC mass was nearly independent of pressure (within a 10% range). The sample flow was controlled at 120 v ccm. The temporal resolution of the SP2 data collection was one second. All particle mass concentrations were reported as mass per volume of air at a standard temperature and pressure (denoted as ng/m3; temperature = 273.15 K; and pressure = 1013.25 hPa).

3. Results and Discussion

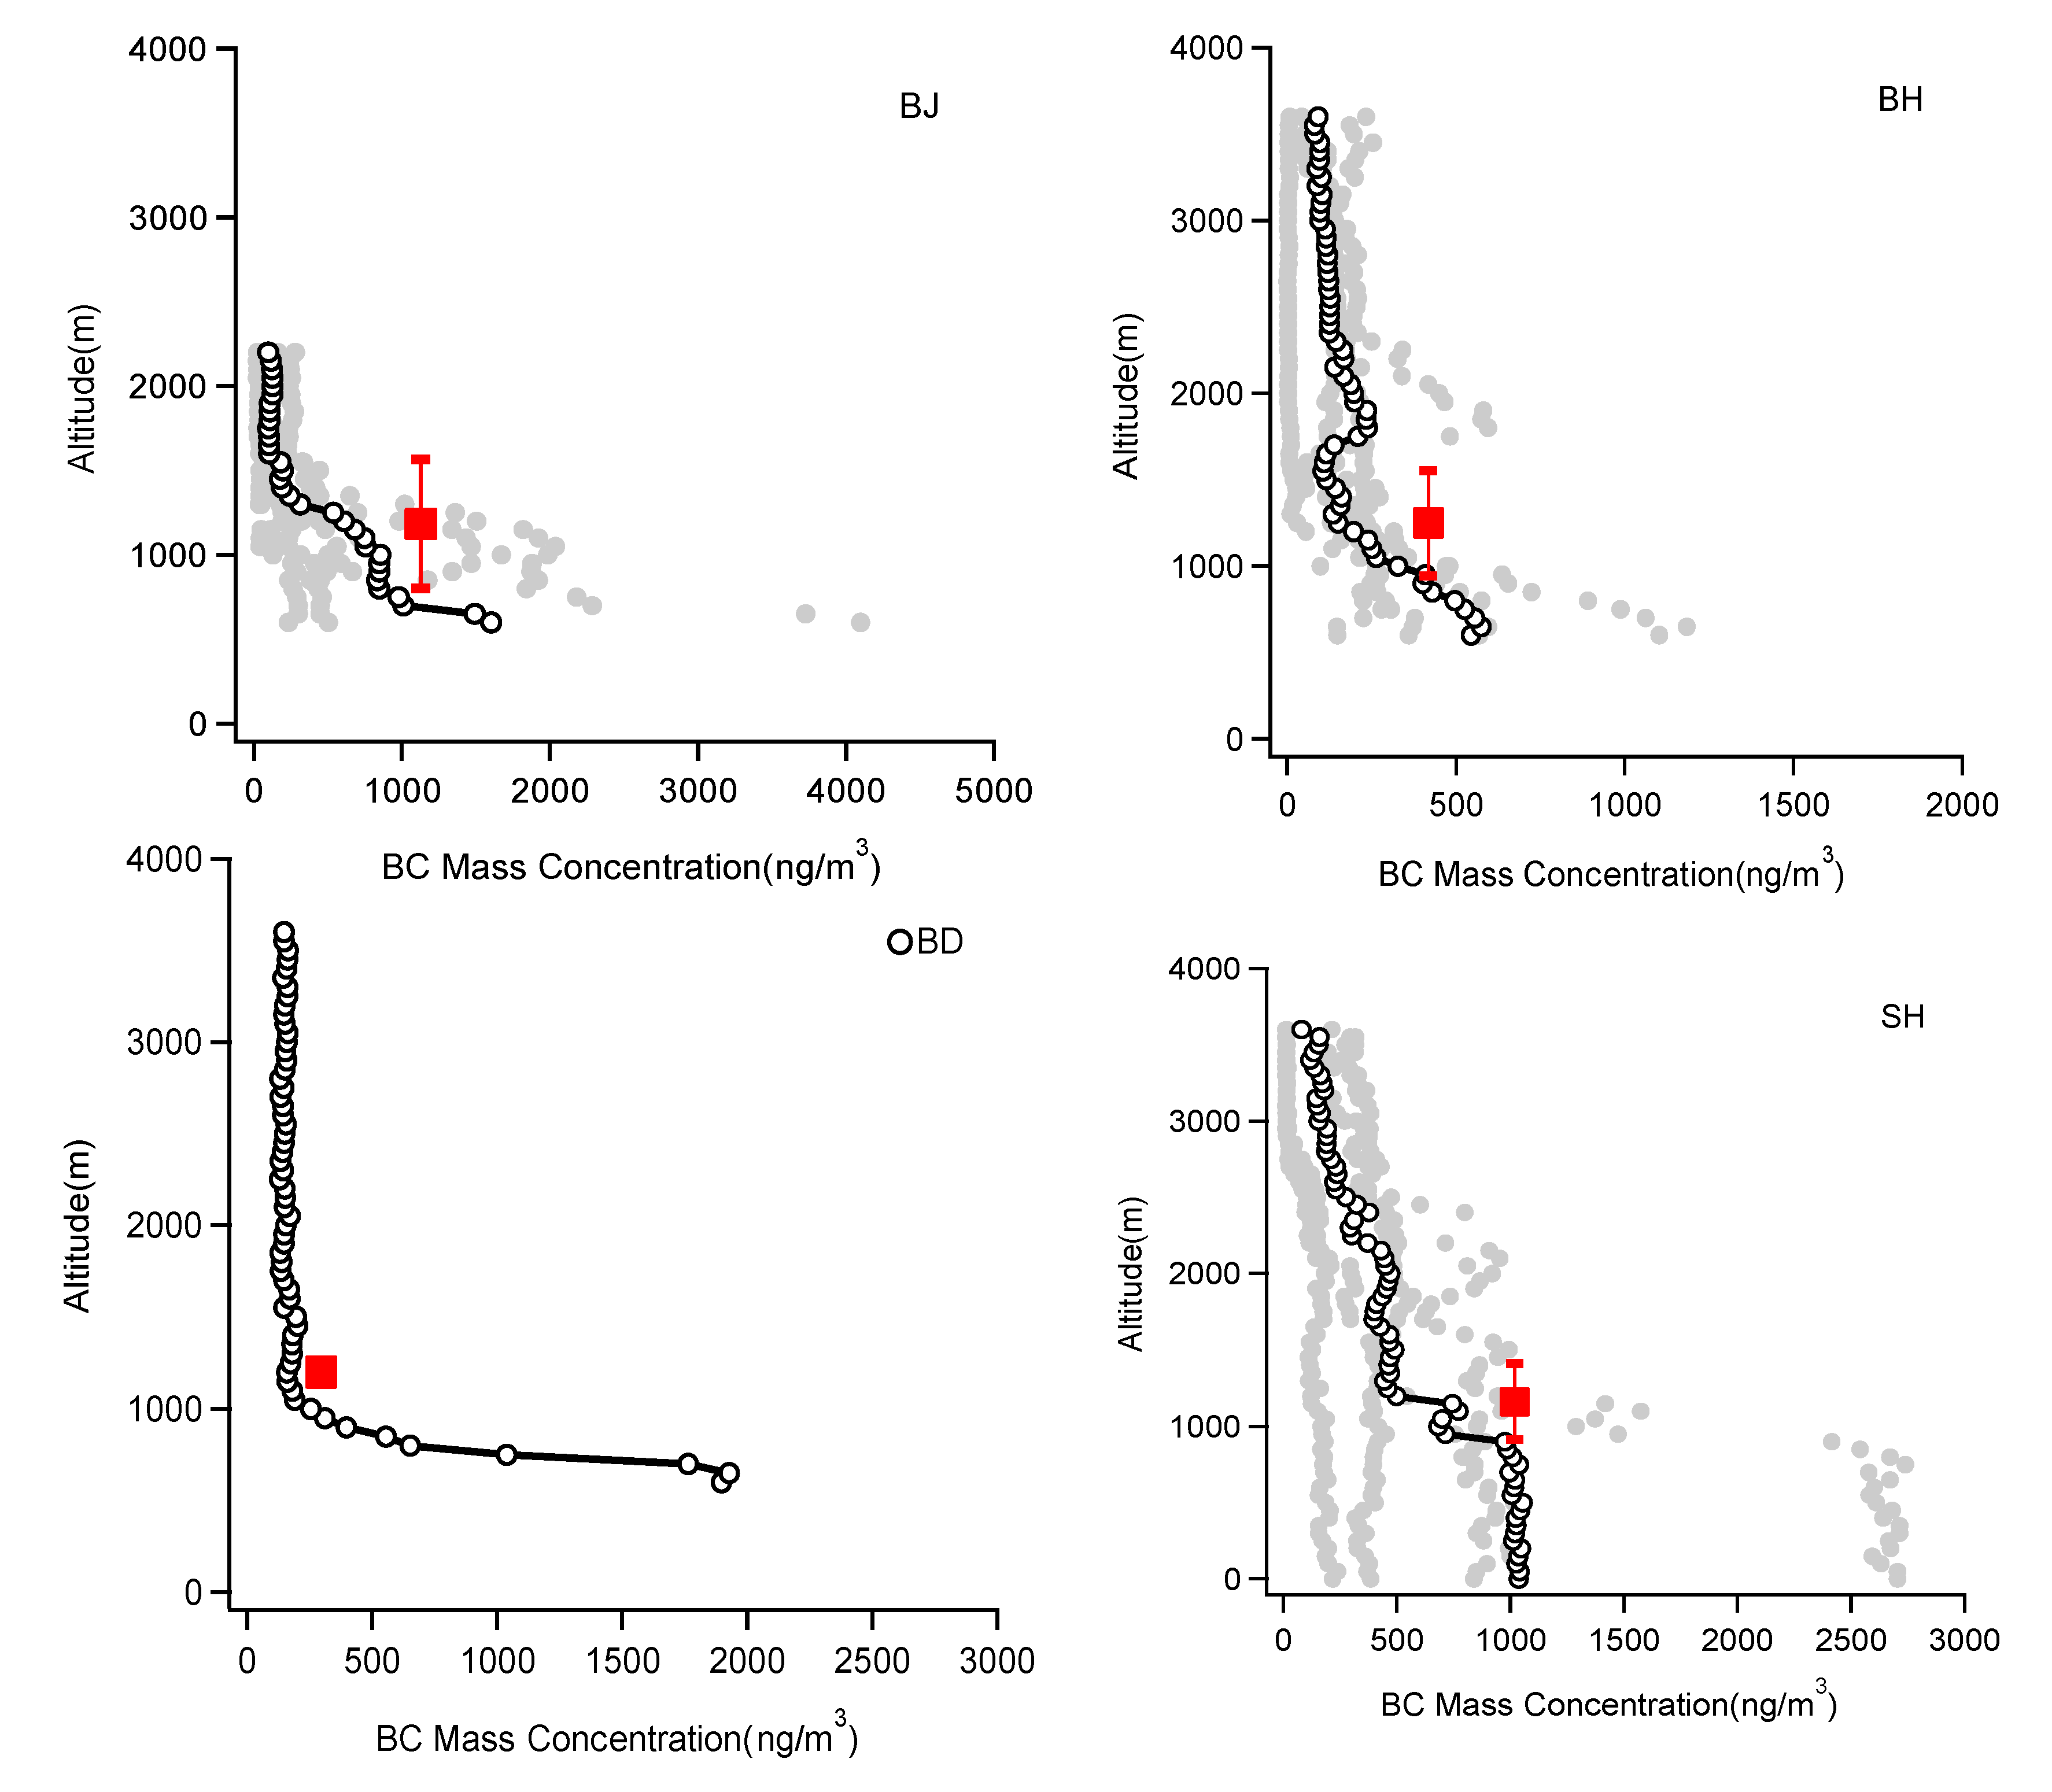
3.1. Vertical Distribution of rBC

The vertical distributions of the rBC mass concentrations in the four areas (BJ, SH, Baoding (BD), and BH) were recorded for all flights (see Figure 4). The results suggest that the vertical distributions had significant variability. In general, the rBC values were constrained below 1000 to 1200 m, showing the mean PBL height locations. This result suggests that the rBC was strongly compressed at the height of the PBL, especially in the heavily polluted urban areas (e.g., BJ and BD), which was also reported by Zhang et al. [36]. Inside the PBL, the rBC concentrations ranged from 500 to 4000 ng/m3, with the highest concentrations (4000 ng/m3) in the large city area (BJ). At an altitude of 600 m, the maxima concentrations were 4000 ng/m3 (BJ), 2600 ng/m3 (SH), 2000 ng/m3 (BD), and 1200 ng/m3 (BH) in the four areas, respectively. Above the height of the PBL, the rBC concentrations rapidly decreased. For example, at an altitude of 2500 m, the rBC concentrations were generally less than 500 ng/m3, with the lowest concentrations (<100 ng/m3) over the ocean region (BH). It is also worth noting that the large vertical gradient of the rBC concentrations inside and outside of the PBL occurred only under heavy polluted conditions.
Figure 4. The measured vertical distributions of the rBC mass concentrations in the four areas (BJ, SH, BD, and BH) for all the flights. The grey dots show the results from all of the flights, and the open circles and line show the average results. The red square shows the height of the PBL.
Atmosphere 06 00713 g004
In order to compare the rBC concentrations measured in other regions of the globe, airborne SP2-based measurements were recorded in different areas of the world (see Table 3). For example, Oshima et al. [26] reported that the rBC mass concentrations over China’s Yellow Sea were 460–510 ng/m3, showing the rBC outflow from China. Another important issue is that the rBC concentrations in BJ are several times higher than the concentrations in the US and European continental regions [22,23,30,39].
Table 3. Summary of rBC measurements by airborne SP2 in different regions of the globe.
SiteMeasurement PeriodPollution TypeAltituderBC Mass Concentration (μg/m3)Peak Mass Diameter (nmin VED)Number Fraction Of Coated Particles (%)Reference
Texas, USANovember 2004Continental America<5 km, >10 km0.05, 0.008-0.17~178~40Schwarz et al., 2006 [7]
San Jose, Costa RicaFebruary 2006Tropics1–5 km, 17.5–19.5 km0.65~20020–70, 75Schwarz et al., 2008b [31]
Texas, USASeptember 2006Urban outflow, Biomass burning outflowBoundary layer0.72–0.81, 1.8–3.59~170, ~210~10, ~70Schwarz et al., 2008a [30]
Nagoya, JapanMarch 2004Urban outflow0.3–4 km0.5–1.1182–20235 (±5)–63 (±9)Moteki et al., 2007 [25]
Yellow, East China Seas and the western Pacific Ocean18 March–25 April 2009Asian outflowBoundary layer and the free troposphere (<9 km)0.185–1.264--Oshima et al., 2012 [26]
The north of Europe23–28 November 2006Lower stratosphere0.2–2160–240-Baumgardner et al., 2008 [13]
EuropeApril and September 2008Continental Europe<3 km0.12 ± 0.08154–203-McMeeking et al., 2010 [22]
EnglandApril 2008 and June 2009Continental EuropeBoundary layer0.1–0.6-3–15, 40–50McMeeking et al., 2011 [23]
Palmdale, California17 June and 24 June 2008Biomass burning and Fossil fuelsBoundary layer0.513 ± 0.153, 0.243 ± 0.146175 ± 10, 193 ± 16-Sahu et al., 2012 [39]
Mexico City, MexicoMarch 2006Urban outflow2.6–5.4 km0.24–1.859, 0.375–1.070147–16717 ± 3Subramanian et al., 2010 [32]
Los Angeles Basin, USAMay 2010Urban outflowFree troposphere0.0167161 ± 4176 ± 13Metcalf et al., 2012 [33]
Beijing, ChinaMay–June 2012Urban outflowBoundary layer0.9 ± 0.3180–21031 ± 17%This study
In addition, there was large variability in the vertical distributions of the rBC concentrations (see Figure 4). To understand the causes of such variability, we showed the transport effects (inflow) from different air masses. The HYSPLIT [40] method was used to estimate the air mass direction in the PBL (see Table 1). The rBC vertical distributions were illustrated in two very different areas under different air mass directions (see Figure 5). An urban location (BJ) was used to represent a very polluted case, and an ocean location (BH) was used to represent a remote area. For the BJ location, there were noticeable differences in the vertical rBC mass and number distributions between different air mass conditions. Under the southern air mass conditions, a very large vertical gradient existed inside and outside of the PBL height, with the highest concentrations at lower PBL heights. In contrast, under the northern air mass conditions, a weak vertical gradient existed inside and outside of the PBL height, with a slightly higher concentration inside the PBL compared with the values outside the PBL. This result suggests that the air mass from the south contained a high rBC concentration and the air mass from the north contained clean air, which is consistent with the study conducted by Tie et al. [41]. According to their study, the northwest area of BJ has mountains and grasslands with a very small population. As a result, the northwest wind transports clean air to BJ. In contrast, in the south of BJ, the population is very dense with several mega/large cities. Thus, the south wind transports polluted air to BJ.
Figure 5. The rBC vertical distributions in two very different areas under different air mass directions. One is an urban location (BJ) that represents a very polluted case (left panels), and the other is an ocean location (BH) that represents a remote area (right panels). The red color shows the northern air mass, and the blue color shows the southern air mass. The horizontal gray bars showed the height of the PBL.
Atmosphere 06 00713 g005
Furthermore, the effects of regional transport were not only dependent on the wind directions but also the altitudes (see Figure 5). For example, regional transport occurred inside the PBL (around 1000 to 1200 m). At the lower PBL height (600 m), the rBC concentrations were 500 ng/m3 (north winds) and 4000 ng/m3 (south winds). At an altitude of 1000 m, the rBC concentrations were 500 ng/m3 (north winds) and 2000 ng/m3 (south winds). At an altitude of 2000 m, the difference in the rBC concentrations between the north and south winds was very small. This result suggests that (1) the regional transport played an important role in the enhancement of rBC concentrations in BJ; and (2) an important regional transport of polluted air occurred in the lower PBL. This result is consistent with previous studies [28,35].
For the ocean area (BH), the effects of the wind directions were very different compared with the urban area (BJ). The effect on the rBC concentrations that was attributed to different wind directions (north and south winds) was small. This is due to the fact that this area is located a far distance from heavy rBC emission regions. However, there is an indication that the air mass from the south contained slightly higher rBC concentrations than the air mass from the north. It is interesting to note that the difference occurred mostly at high altitudes (from 1500 to 3500 m), which were above the PBL height. This result suggests that the rBC emissions in the south of the BH were mainly from Shandong Province, where the emissions of rBC were high (see Figure 2). However, this is located several hundred kilometers from the observation area. As a result, the time to transport the rBC particles from the source region to the measurement area took several days. With a longer transport time, more rBC particles were diffused from the inside of the PBL to the outside of the PBL [42]. This result illustrates that the regional transport of rBC was not only limited to the inside of the PBL, but also significantly contributed to the outside of the PBL.

3.2. Size Distribution

The average size distribution was measured at the four locations (see Figure 6 and Table 2). The size is the “core” size, which refers to the mass equivalent diameter (MED). The result shows that the rBC particles were generally small, with a peak size of 180–210 nm in diameter. The majority of the rBC mass ranged from 70 to 500 nm in diameter. For example, at 70 and 400 nm, there was only 20% of the rBC mass compared with the rBC mass at the peak value. At 100 and 400 nm, there was only 50% of the rBC mass compared with the rBC mass at the peak value. The peak sizes also appeared to be the smallest in the urban region (BJ), with a size of 181 nm (see Figure 6). This suggests that there were more fresh rBC particles in nearby large cities, which resulted in smaller particles as compared to other areas.
The above measured size distributions are similar to previously measured results. For example, the measurements of Asian outflow by Sun et al. [35] and Shiraiwa et al. [27] showed that the peak sizes ranged from 190 to 210 nm, which were slightly higher than the measurement in the present study. According to Schwarz et al. [7,30,31], Moteki et al. [25,43], and McMeeking et al. [22], this suggests that the aged air mass had a slightly larger peak size.
The rBC size distributions for the urban (BJ) and ocean (BH) areas with different air mass directions were also recorded (see Figure 7). In the urban area (BJ), the size distribution showed a noticeable difference under different air masses. The southern air mass contained smaller rBC particles than the northern air mass. For example, with an 80 nm diameter, the rBC mass was 40% of the mass at the peak value under the southern air mass condition. In contrast, the rBC mass was only 20% of the mass at the peak value under the northern air mass condition. The peak sizes were 180 nm and 200 nm under the southern and northern air mass conditions, respectively. As we described before, in BJ, the southern air mass originated mainly from the local rBC anthropogenic emissions of large cities, while the northern air mass was generally an aged air mass with a mix of different sources. Schwarz et al. [30] suggested that the size of the rBC particles from urban sources is smaller than the biomass from burning sources. In contrast, the difference in the size distributions between the southern mass and the northern mass was small in the ocean area compared with the urban area, even though there was some indication that the particle size was smaller under the northern mass than under the southern air mass condition.
Figure 6. The average size distribution of rBC at the four locations (red for BJ, blue for BH, black for BD, and pink for SH) during the sampling.
Atmosphere 06 00713 g006
Figure 7. The average rBC size distributions for the urban area (BJ-a) and the ocean area (BH-b) under different air mass back trajectories. The red color represents the southern air mass, and the black color represents the northern air mass.
Atmosphere 06 00713 g007

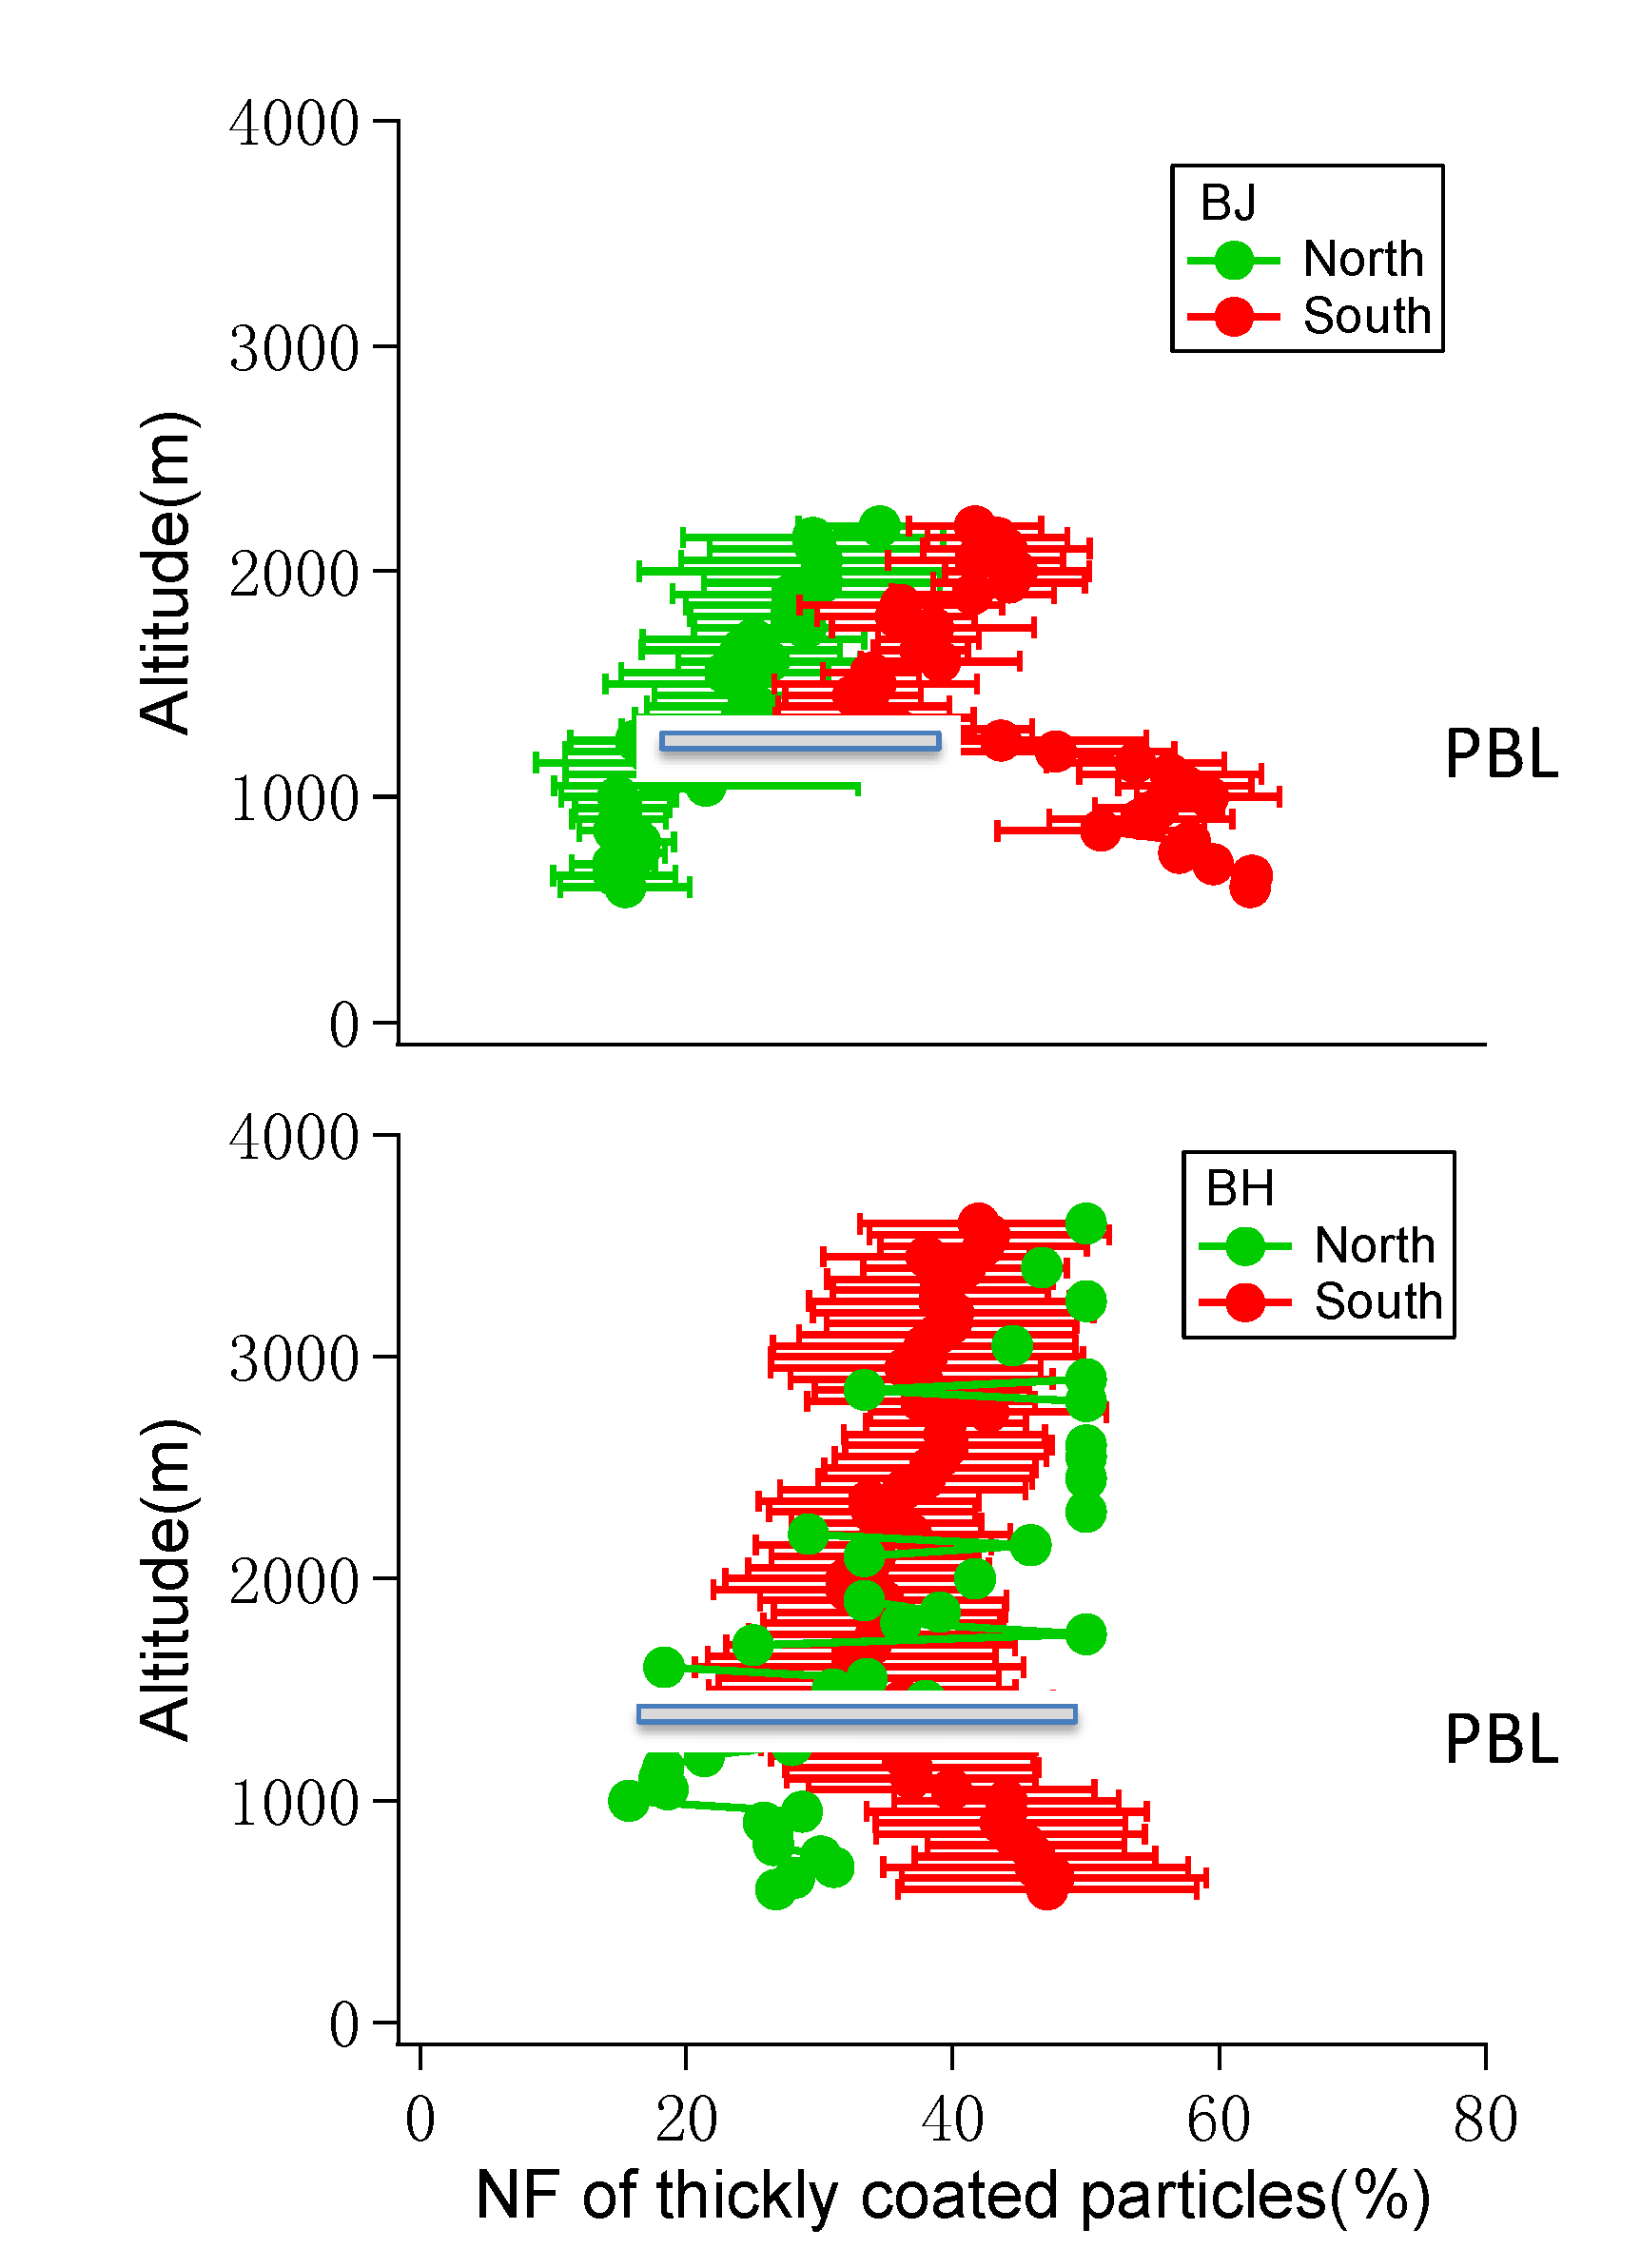
3.3. Mixing State of rBC Particles

When a part of the rBC particles is coated by non-refractory and non-light absorbing compounds, including sulfate, nitrate, and organics [44], the rBC particle mass is referred to as entering a “mixing state”. The rBC coated by hydrophilic compounds will become hydrophilic particles, which can be removed by wet deposition (i.e., washout by precipitation). The uncoated particles remain as hydrophobic particles, which cannot be removed by wet deposition [45]. Thus, it is important to understand the evolution of the “mixing state” of the rBC particles because it has important effects on the life of the rBC in the atmosphere. In this study, the number fraction (NF) of coated particles (%) was used to study the “mixing state” of the rBC particles. We used the incandescent lag time between the peaks in the scattered light signal and the incandescence signal to determine the mixing state of rBC, which was similar to the method employed by Moteki et al. [25]. This study classified a thickly coated rBC particle as one with a lag time ≥1.8 s.
The vertical distributions of the NF of coated rBC particles from BJ and the BH under different air mass conditions are presented (see Figure 8). It is interesting to note several important issues shown in the urban region (BJ). First, above the PBL height, both the NF values increased with altitude. This is consistent with the study conducted by Schwarz et al. [31], in which more coated rBC particles were found at higher altitudes. Their explanation was that the rBC particles increased in age (more coatings) along the regional transport process. Second, a significant difference in NF was shown under the different air mass conditions. In the northern air mass, NF increased with altitude, exhibiting an NF value of 17% in the PBL. This is consistent with the findings of several previous studies listed in Table 3 [25,27,28,30,32]. However, in the southern air mass, the coating process of rBC showed a very complex pattern. Inside the PBL, the NF values were very high, with an average of 52%. The NF values were highest (65%) at the lower PBL (500 m), decreased with altitude inside the PBL, and reached a minimum value (30%) at the top of the PBL. Above the height of the PBL, the NF values changed the shape of their vertical distribution and began to increase with altitude. The NF value increased from 30% at the top of the PBL to 40% at 2000 m. The noticeable transition of the NF vertical distributions inside and outside of the PBL indicates that two different processes may have controlled the coatings of the rBC particles. During a typical southern air mass in BJ, there is high relative humidity (RH) inside the PBL, which could produce fast hygroscopic growth on the surface of the rBC particles (see Figure 9). However, above the PBL, there is low humidity, and the hygroscopic growth of the rBC particles is less active compared with that inside the PBL. In contrast, during a typical northern air mass in BJ, RH values less than 20% are significantly lower than those for a southern air mass (60%–70%) inside the PBL. Above the height of the PBL, the RH increases slightly. Under low humidity, the hygroscopic growth cannot be significant, and the increased NF values are mainly due to an aging process during the regional transport of the rBC particles. This result suggests that under a southern air mass condition, the NF values are strongly affected by local conditions, such as high humidity values. Meanwhile, under the northern air mass condition, the NF values are not strongly dependent on the local conditions (such as humidity), but rather on the aging time during the regional transport.
The NF values measured by SP2 in different regions were summarized (see Table 3). The values suggest that high NF values normally occur in remote regions, while low NF values are close to large cities inside the PBL, such as the measurements in the US (Texas), Mexico, and Japan. This result is consistent with the case in BJ under the northern air mass condition, which suggests that aging occurred during the regional transport process. However, during a very polluted case (southern air mass in BJ), the aging process of the rBC particles was very different compared with the measurements in other large cities.
Figure 8. The measured vertical distributions of NF of the rBC particles from BJ and BH under different air masses. The red color represents the southern air mass, and the green color represents the northern air mass. The horizontal gray bars show the height of the PBL.
Atmosphere 06 00713 g008
Figure 9. The vertical distributions of relative humidity (RH) during a typical southern air mass (red) and northern air mass (green) in the urban area (BJ).
Atmosphere 06 00713 g009

3.4. Effect of Hygroscopic Growth of rBC Particles

The high NF values were highly correlated with the high values of RH (>60%) during the southern air mass inside of the PBL (see Figure 8 and Figure 9). This suggests that hygroscopic growth occurred on the rBC particles. This result was also found by Baumgardner et al. [13]. Their results suggest that the NF values increase as the RH increases. The correlation between the NF and RH is shown in two different regions (see Figure 10); i.e., a large city (BJ) and a remote ocean region (BH). The results show very different correlations between the two regions. In the city region (BJ), the correlation coefficient (R2) between NF and RH was 0.88, indicating that the rBC particles were coated by water vapors due to hygroscopic growth. This result suggests that the polluted region (BJ) is often coupled with high humidity (high RH), causing the surface of the rBC particles to be quickly coated. The water vapors were coated on the surface of the rBC particles, which converted hydrophobic rBC particles into hydrophilic rBC particles. The conversion time was short (less than one day) because it was a local event and occurred inside the PBL. This finding is very important because the hydrophilic rBC particles were larger than the uncoated rBC particles, resulting in a faster deposition on the surface. In addition, the hydrophilic rBC particles could be washed out by precipitation. As a result, the rapid hygroscopic growth could lead to a shorter lifetime of rBC particles during heavy haze in BJ.
Figure 10. The correlation between the NF and RH in the two different regions. One was the large city (BJ-upper panel), and the other was the remote ocean region (BH-lower panel).
Atmosphere 06 00713 g010

4. Summary

We presented in-situ aircraft measurements of rBC from a heavily polluted region around China’s capital (BJ). Using the SP2 instrument mounted on an aircraft (Y12), rBC measurements were analyzed from 11 flights that occurred between April and June 2012. The vertical distributions, size distributions, and “mixing state” of the rBC particles were also presented in this study. The results are highlighted as follows:
(1)
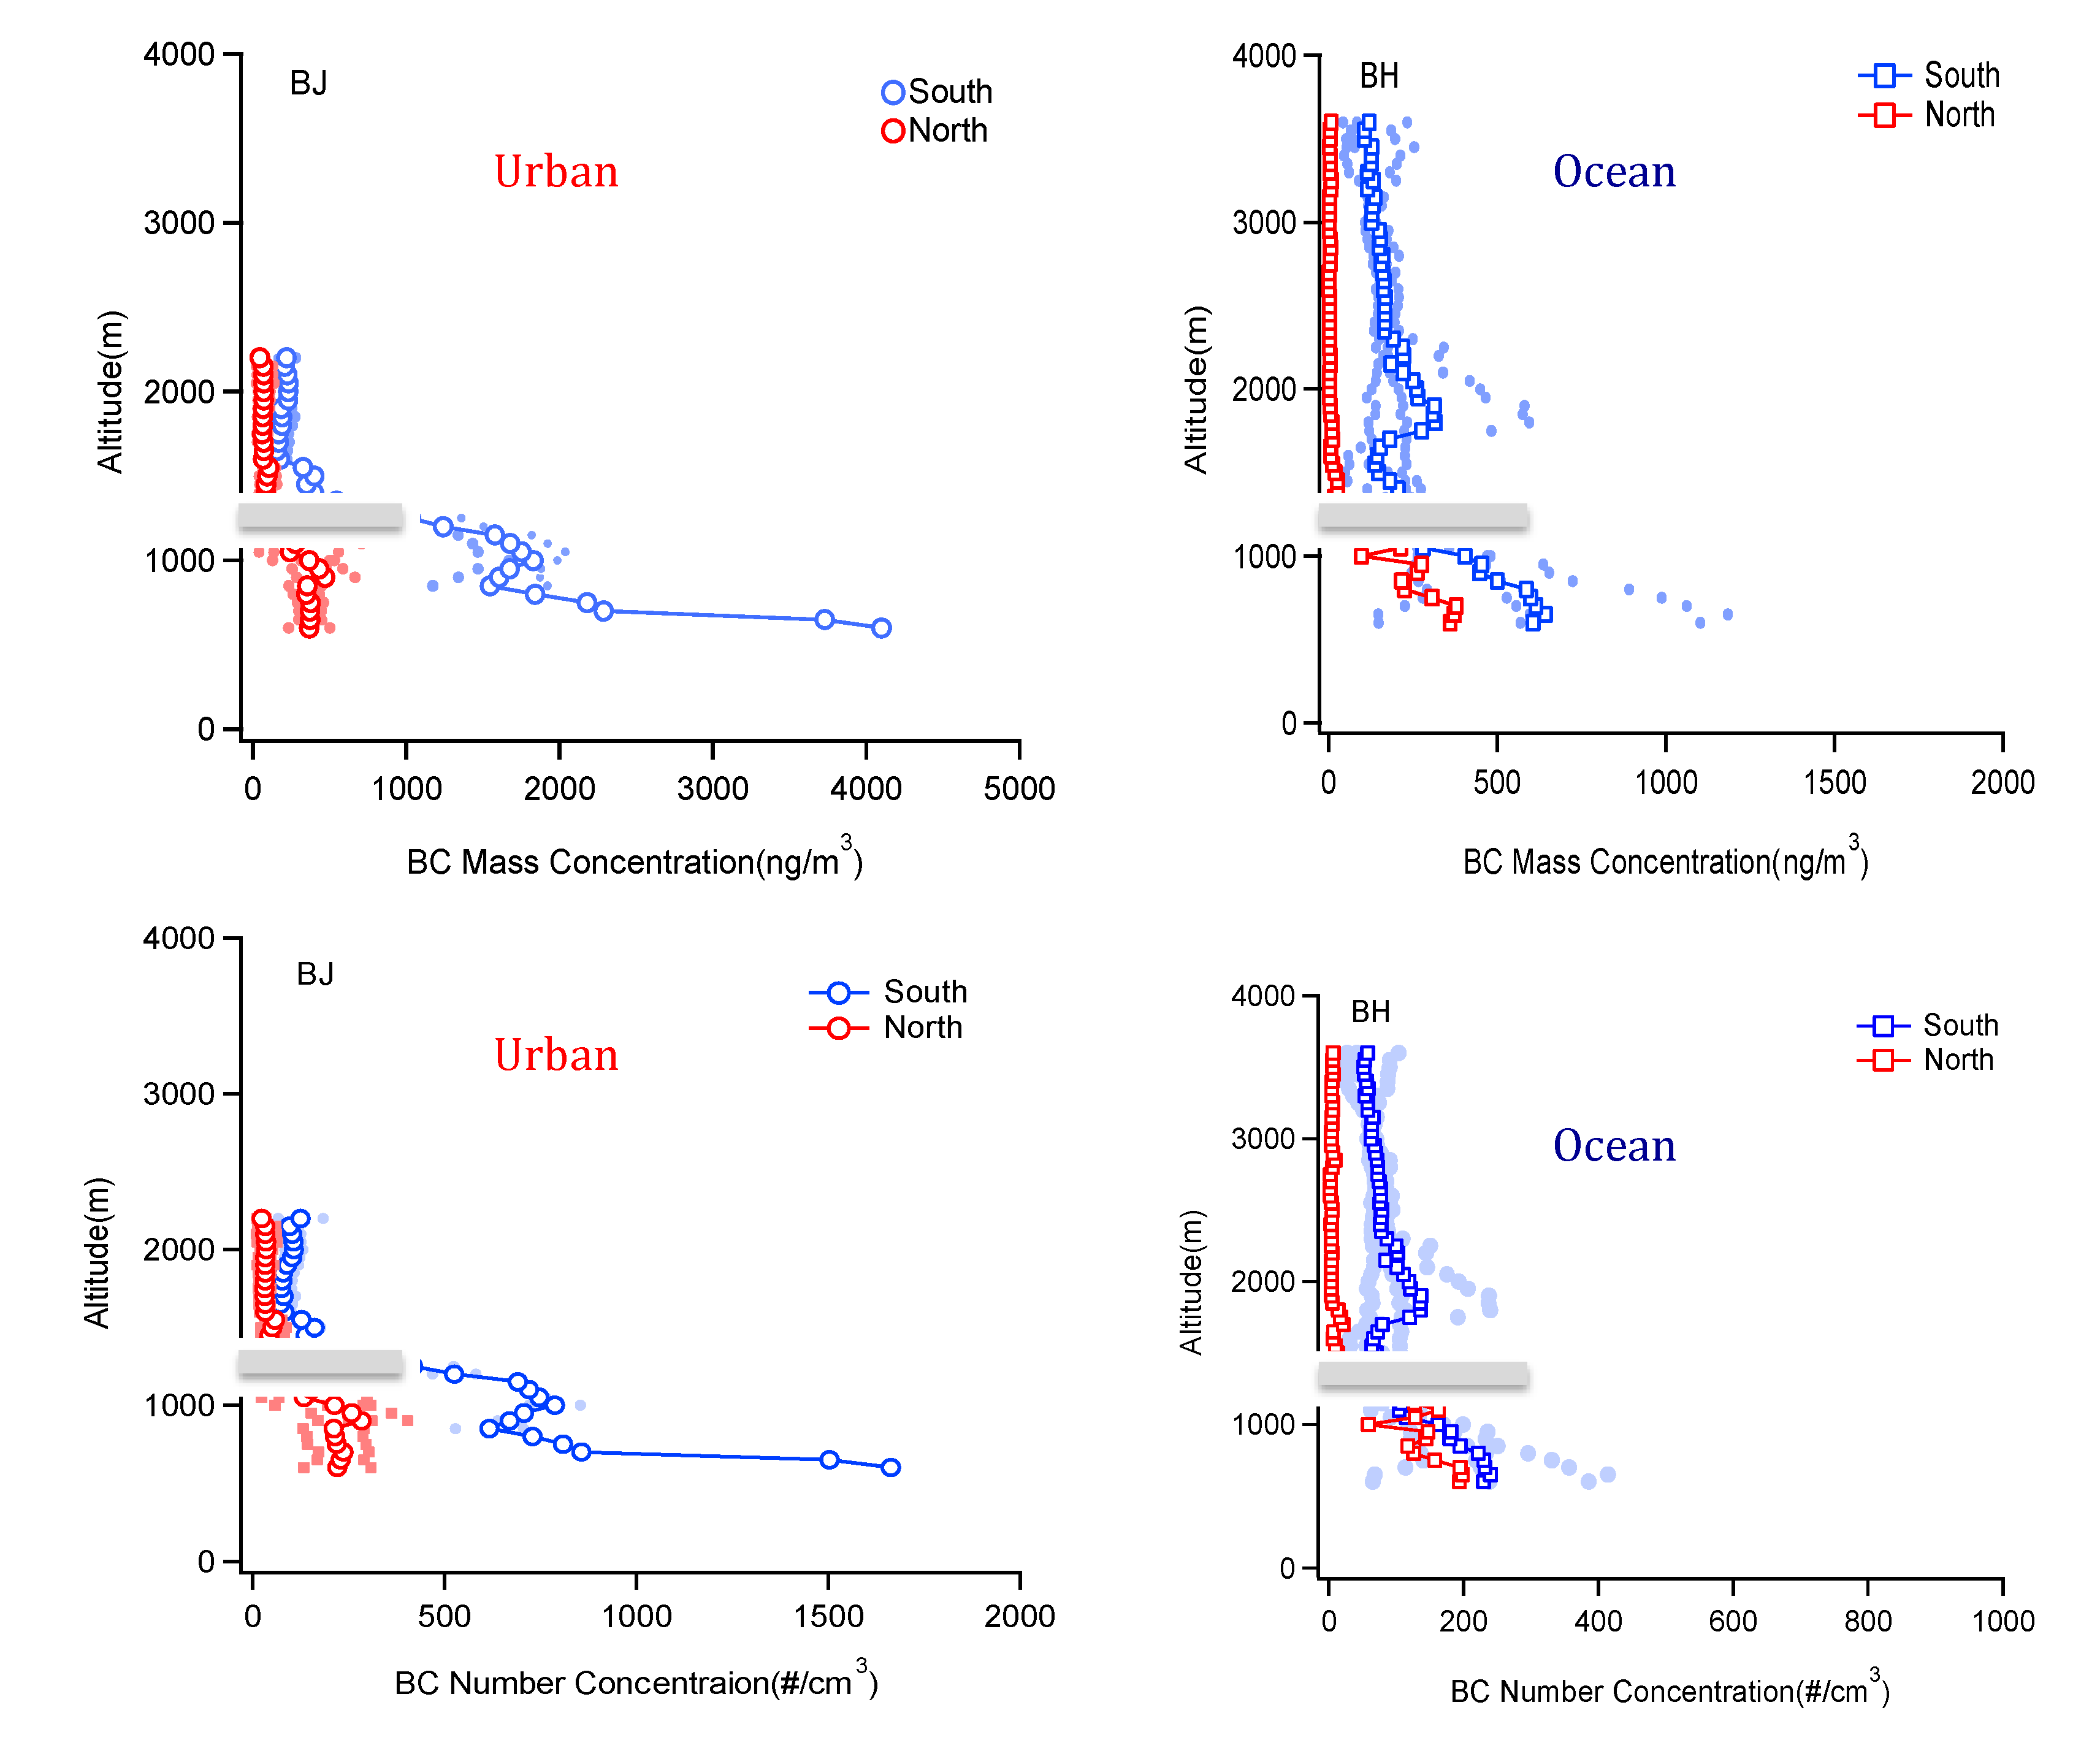
In the urban area (BJ), the average rBC mass concentration in the PBL was 1128 ng/m3, which was significantly higher than the value (361 ng/m3) in the ocean area (BH).
(2)
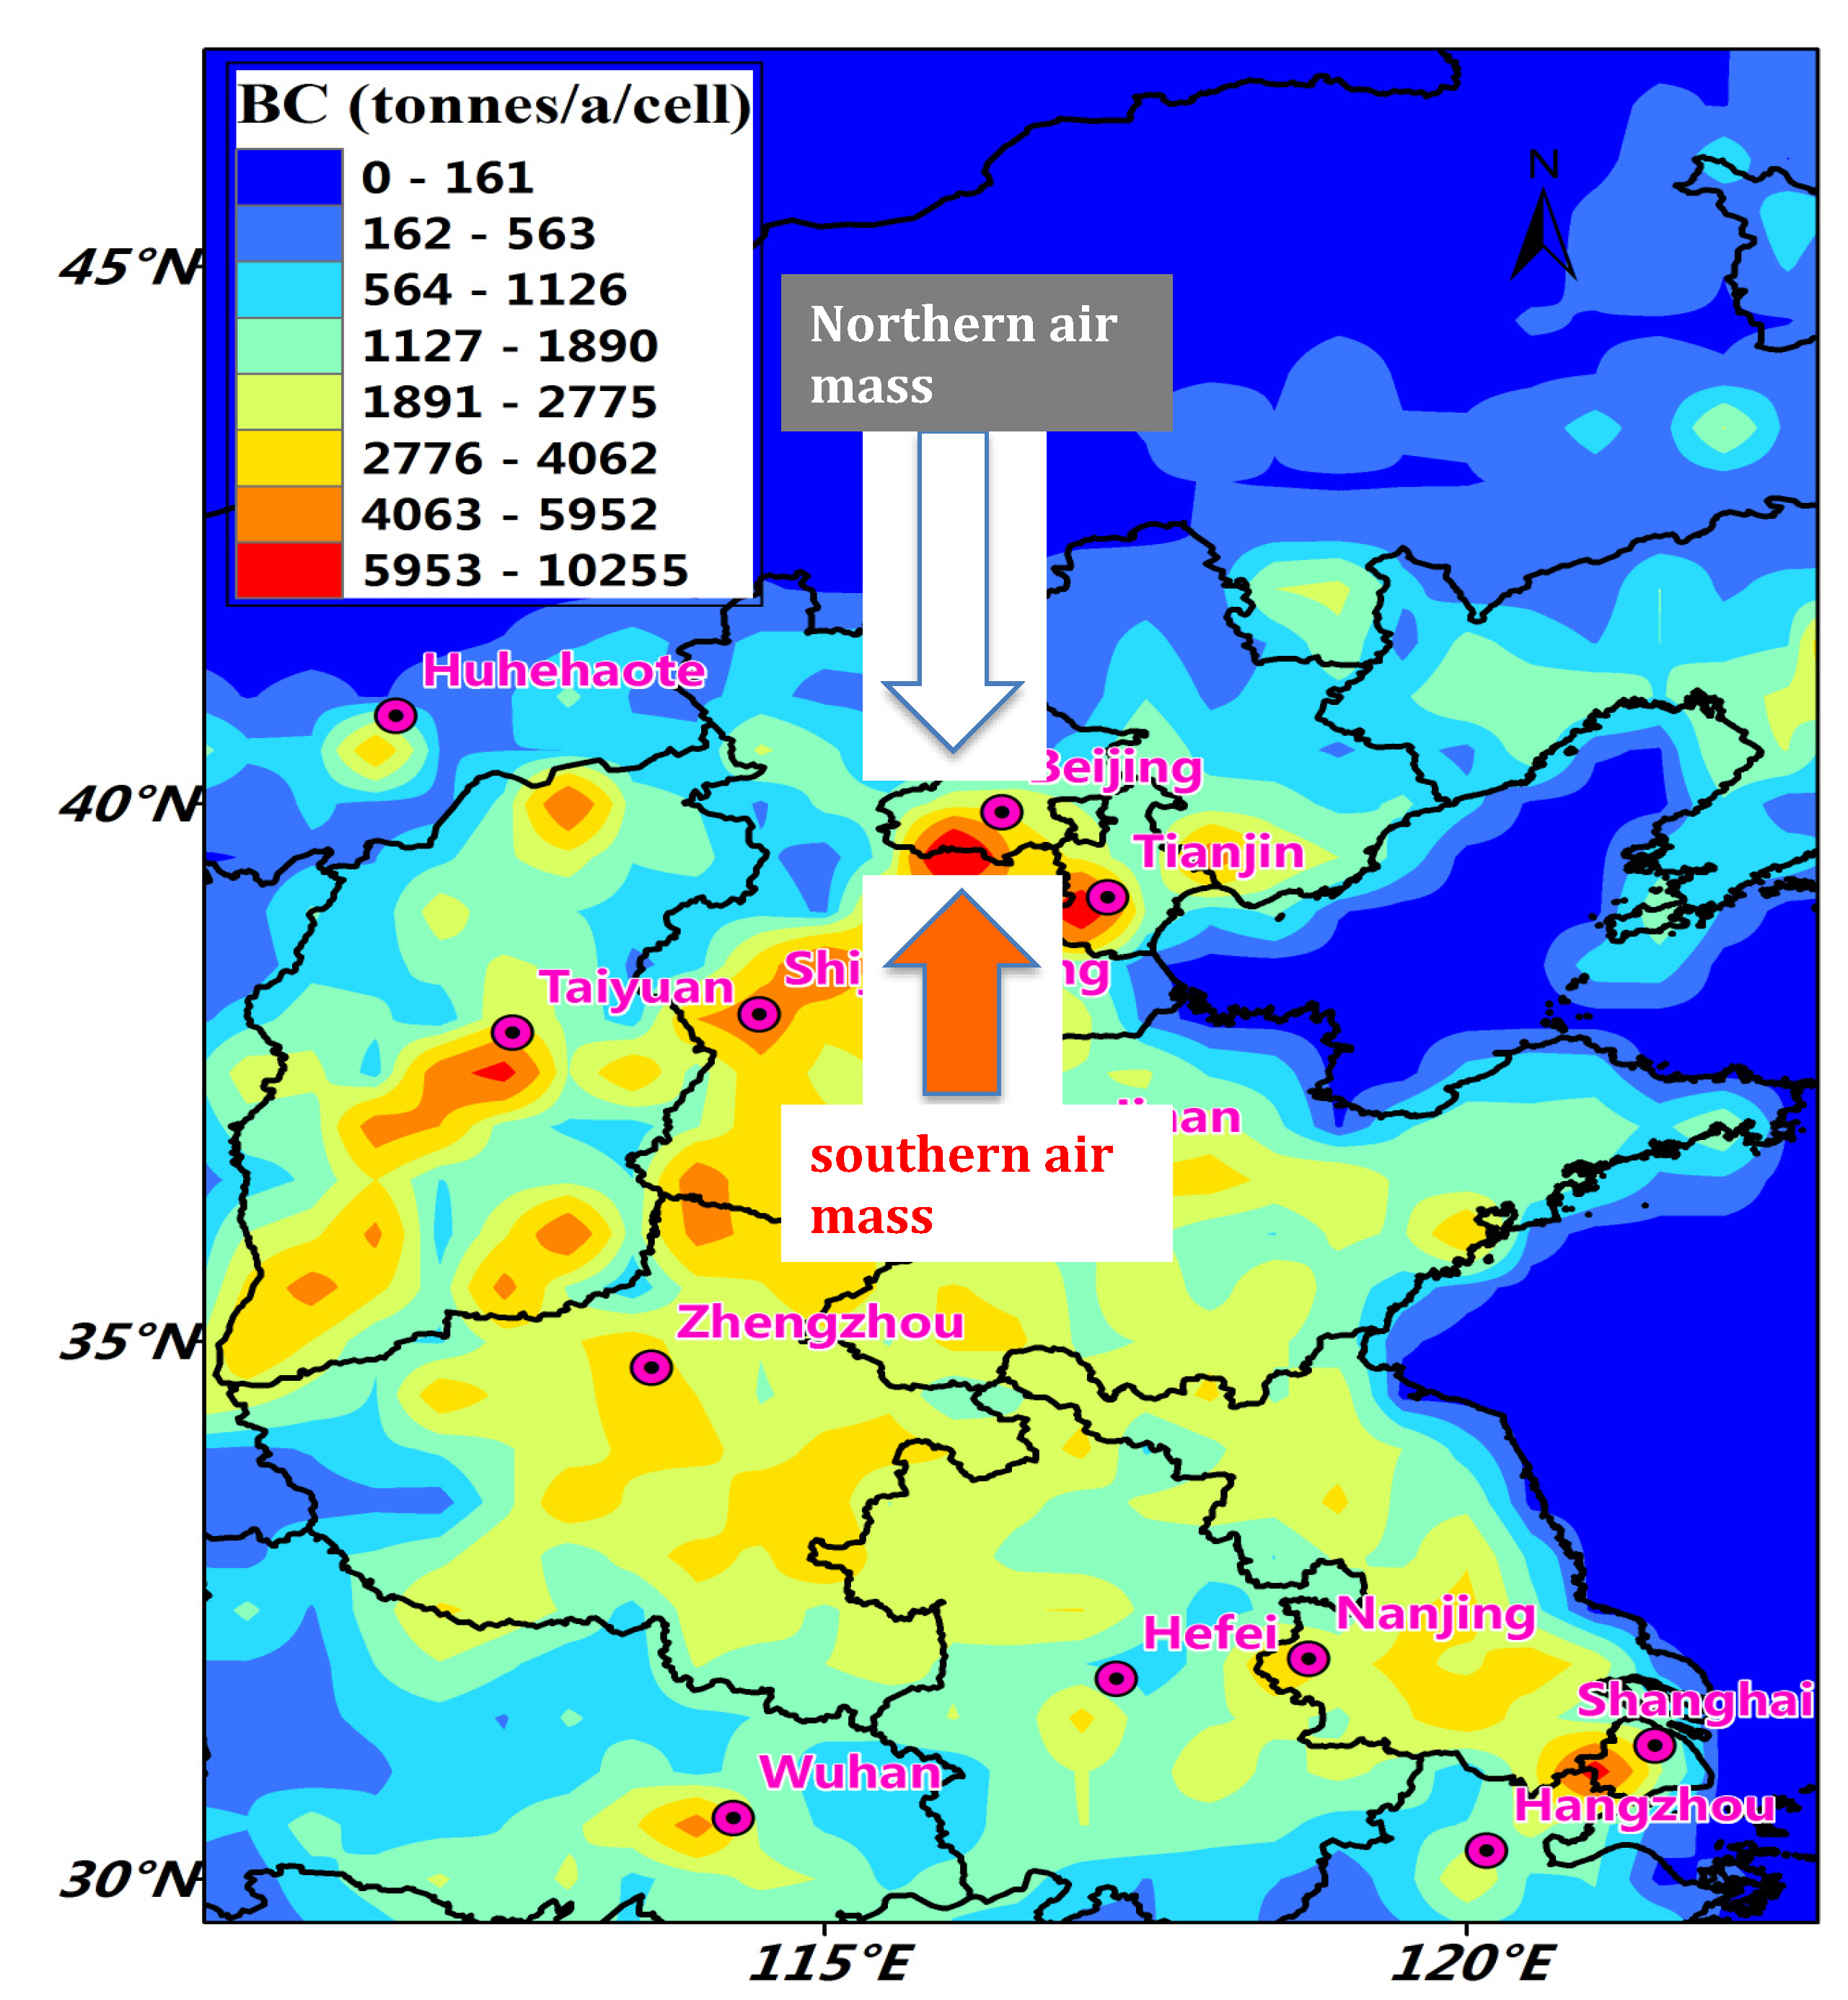
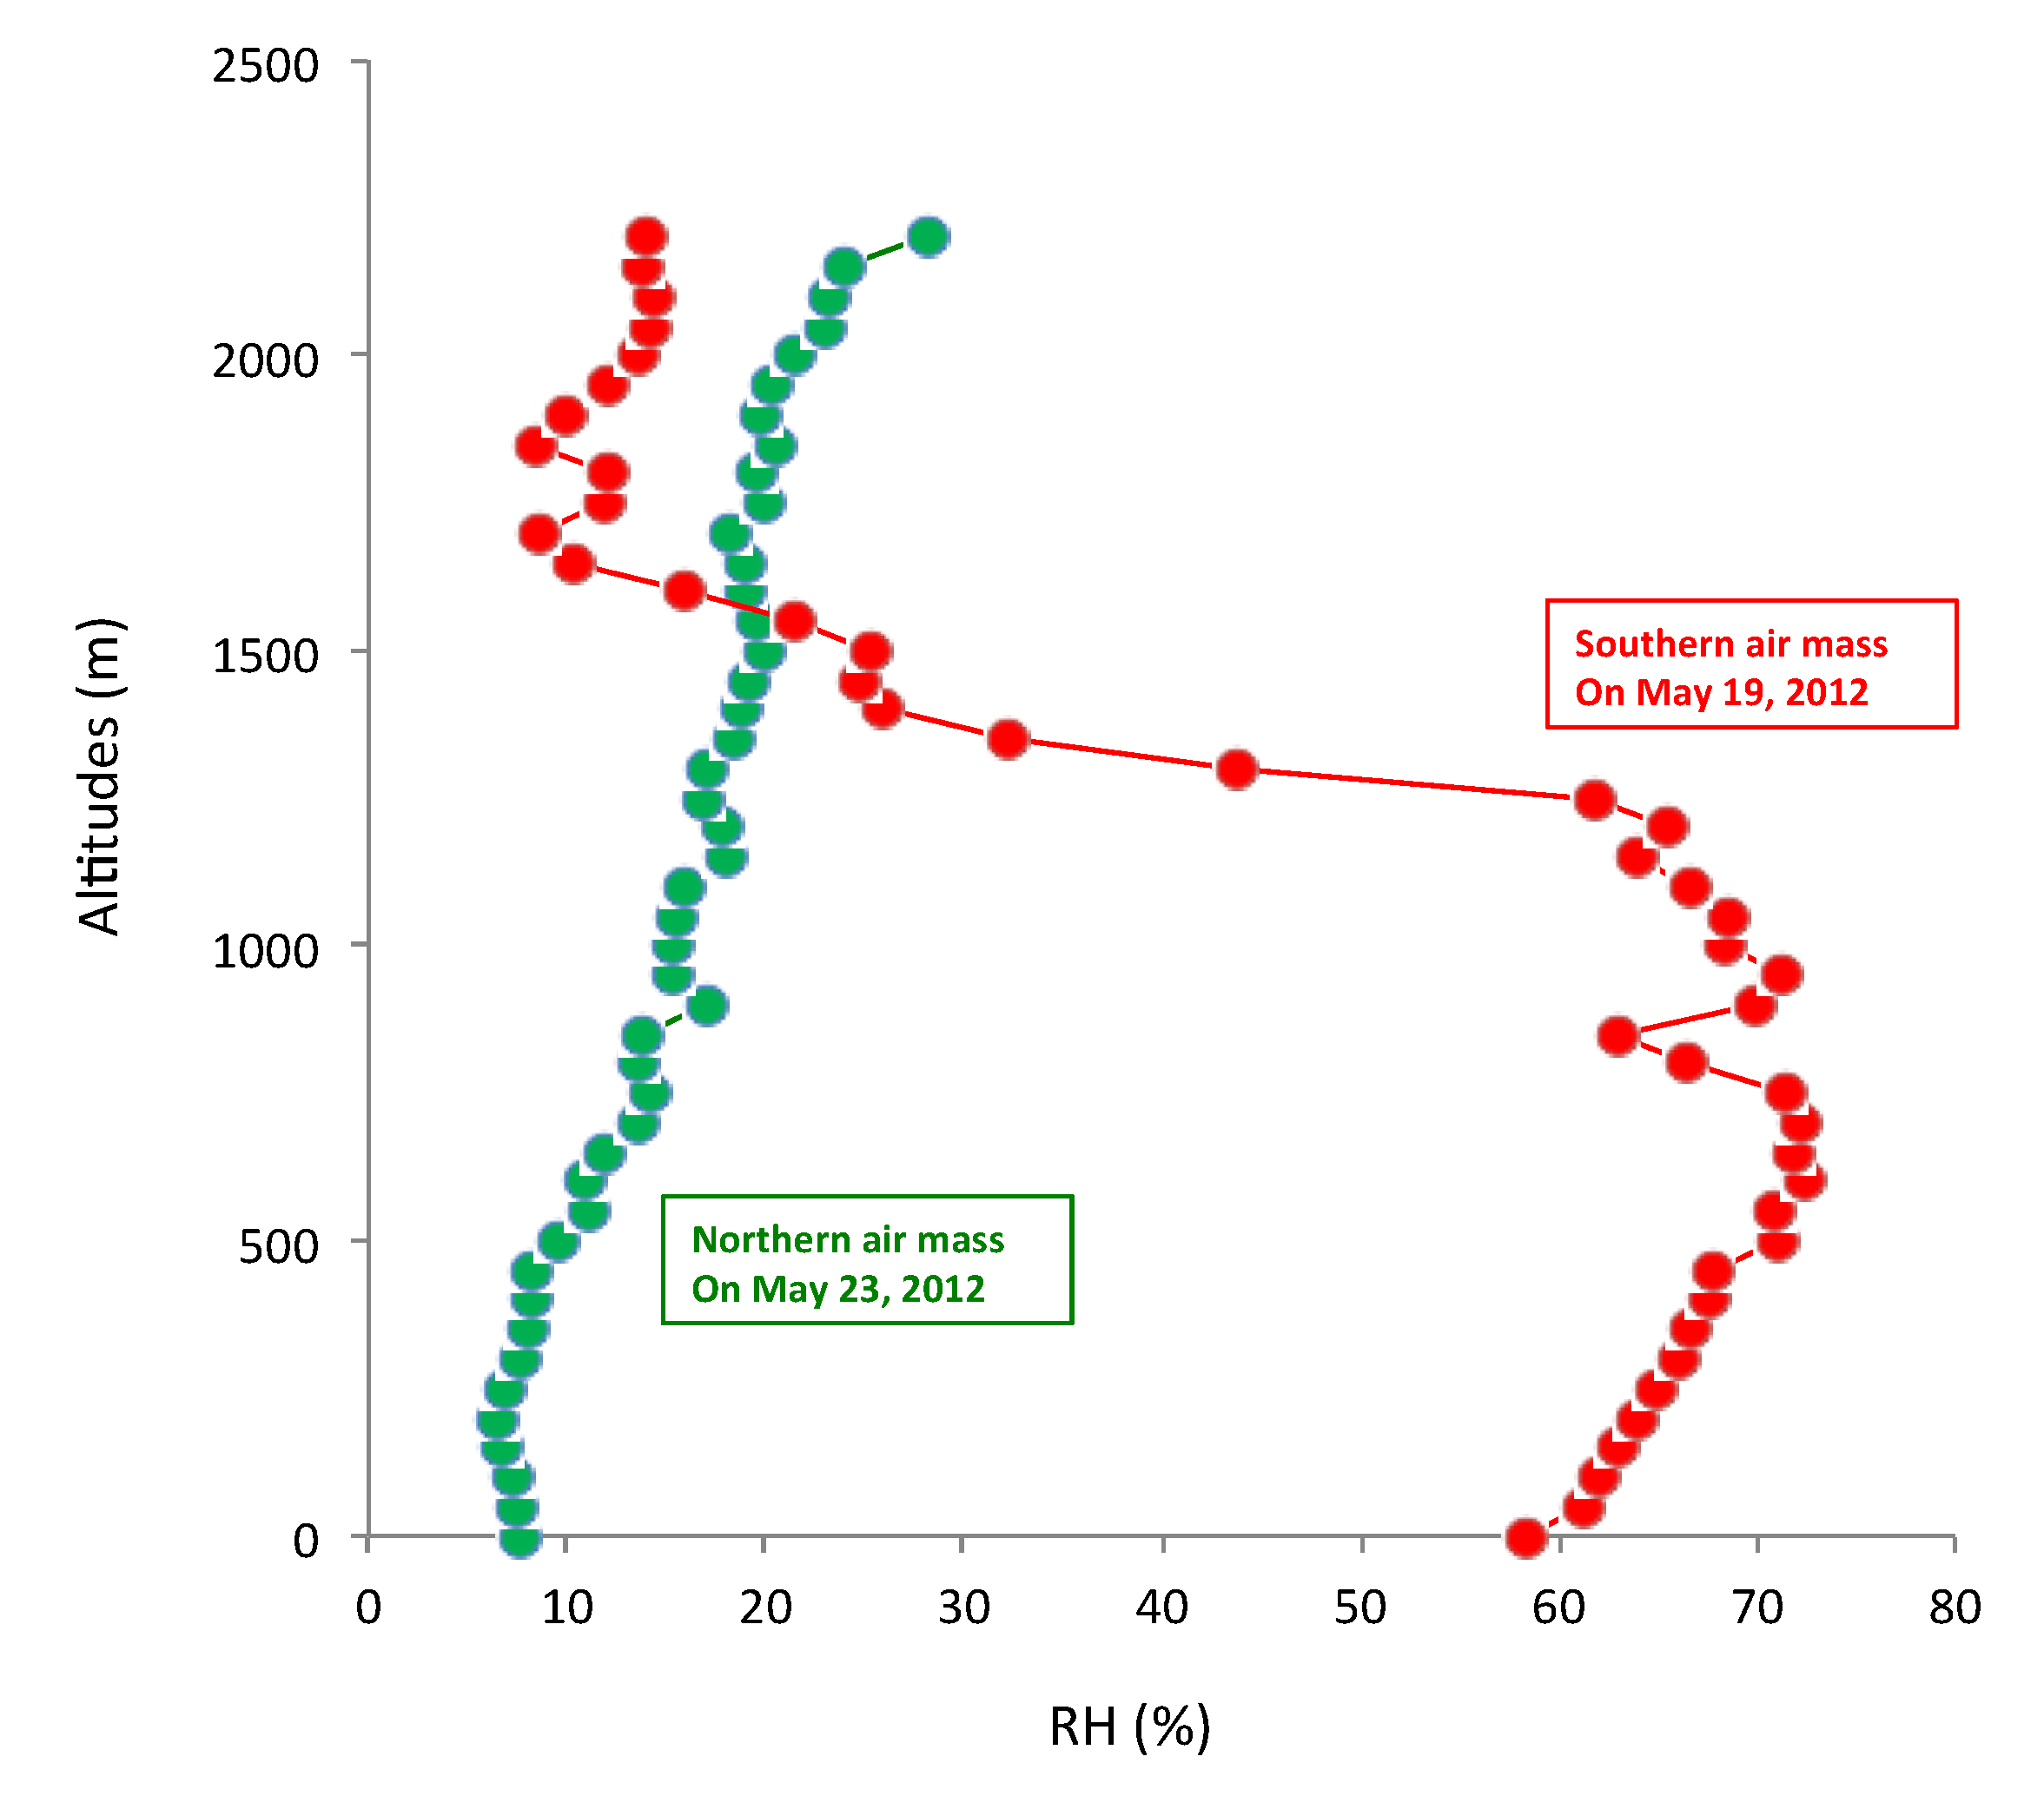
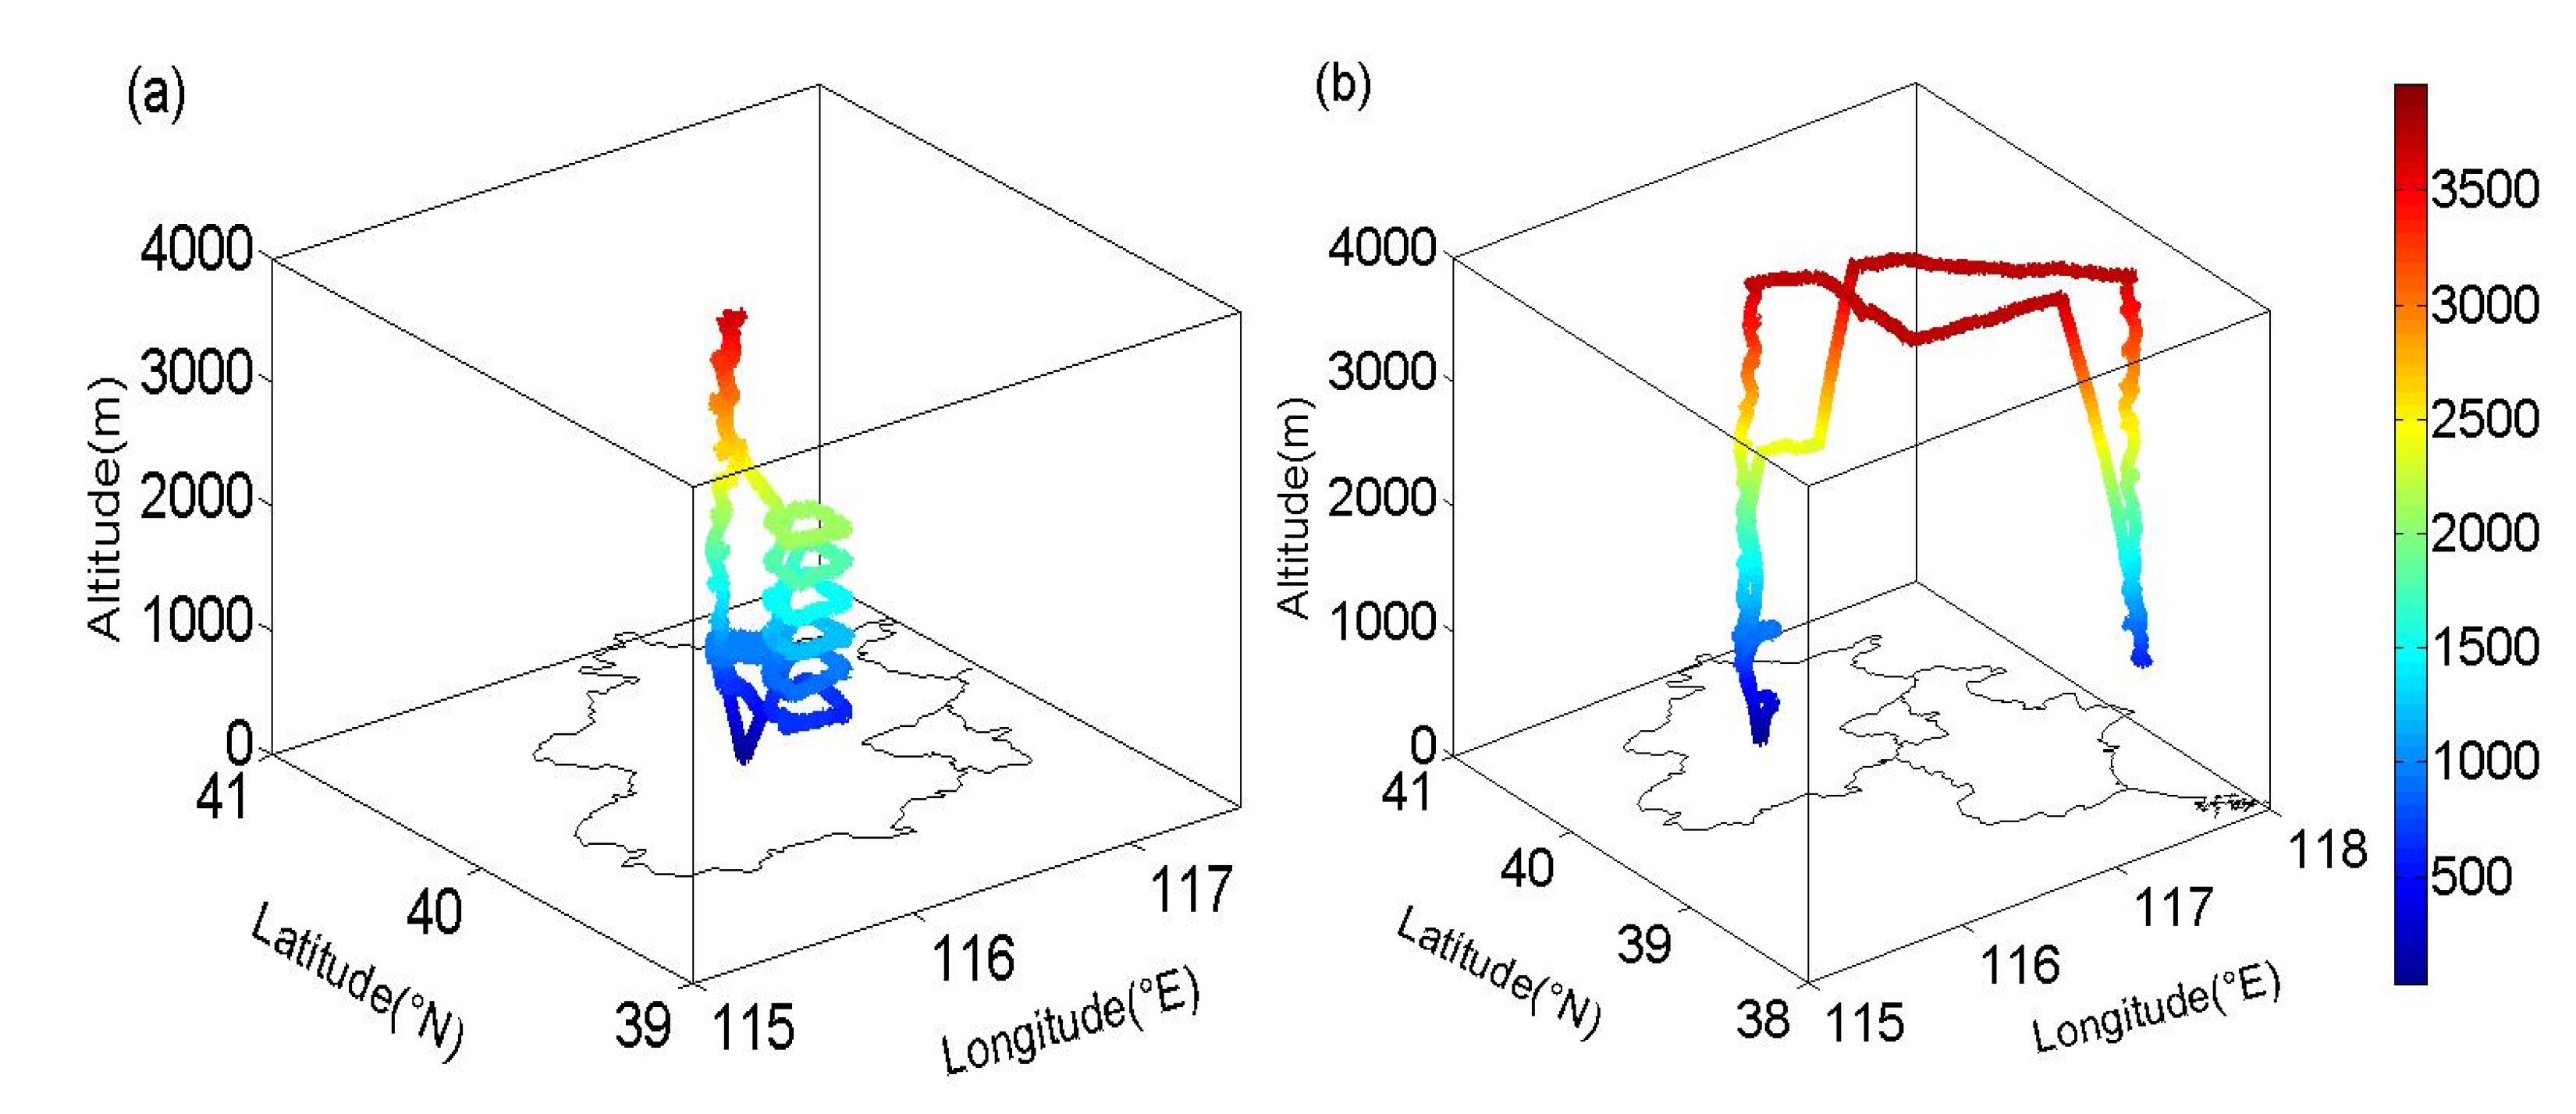
The vertical distributions had noticeable differences between different air masses in the urban region (BJ) and the remote region (BH). When the air mass originated from the south (the polluted region), the rBC particles were strongly compressed in the PBL, resulting in a large vertical gradient at the top of the PBL. In contrast, when the air mass originated from the north (the clean region), there was a small vertical gradient of rBC particles. This analysis suggests that there was significant regional transport of the rBC particles, which enhanced the air pollution in BJ. Moreover, this transport not only occurred near the surface but also in the middle level of the PBL (around 0.5 to 1 km).
(3)
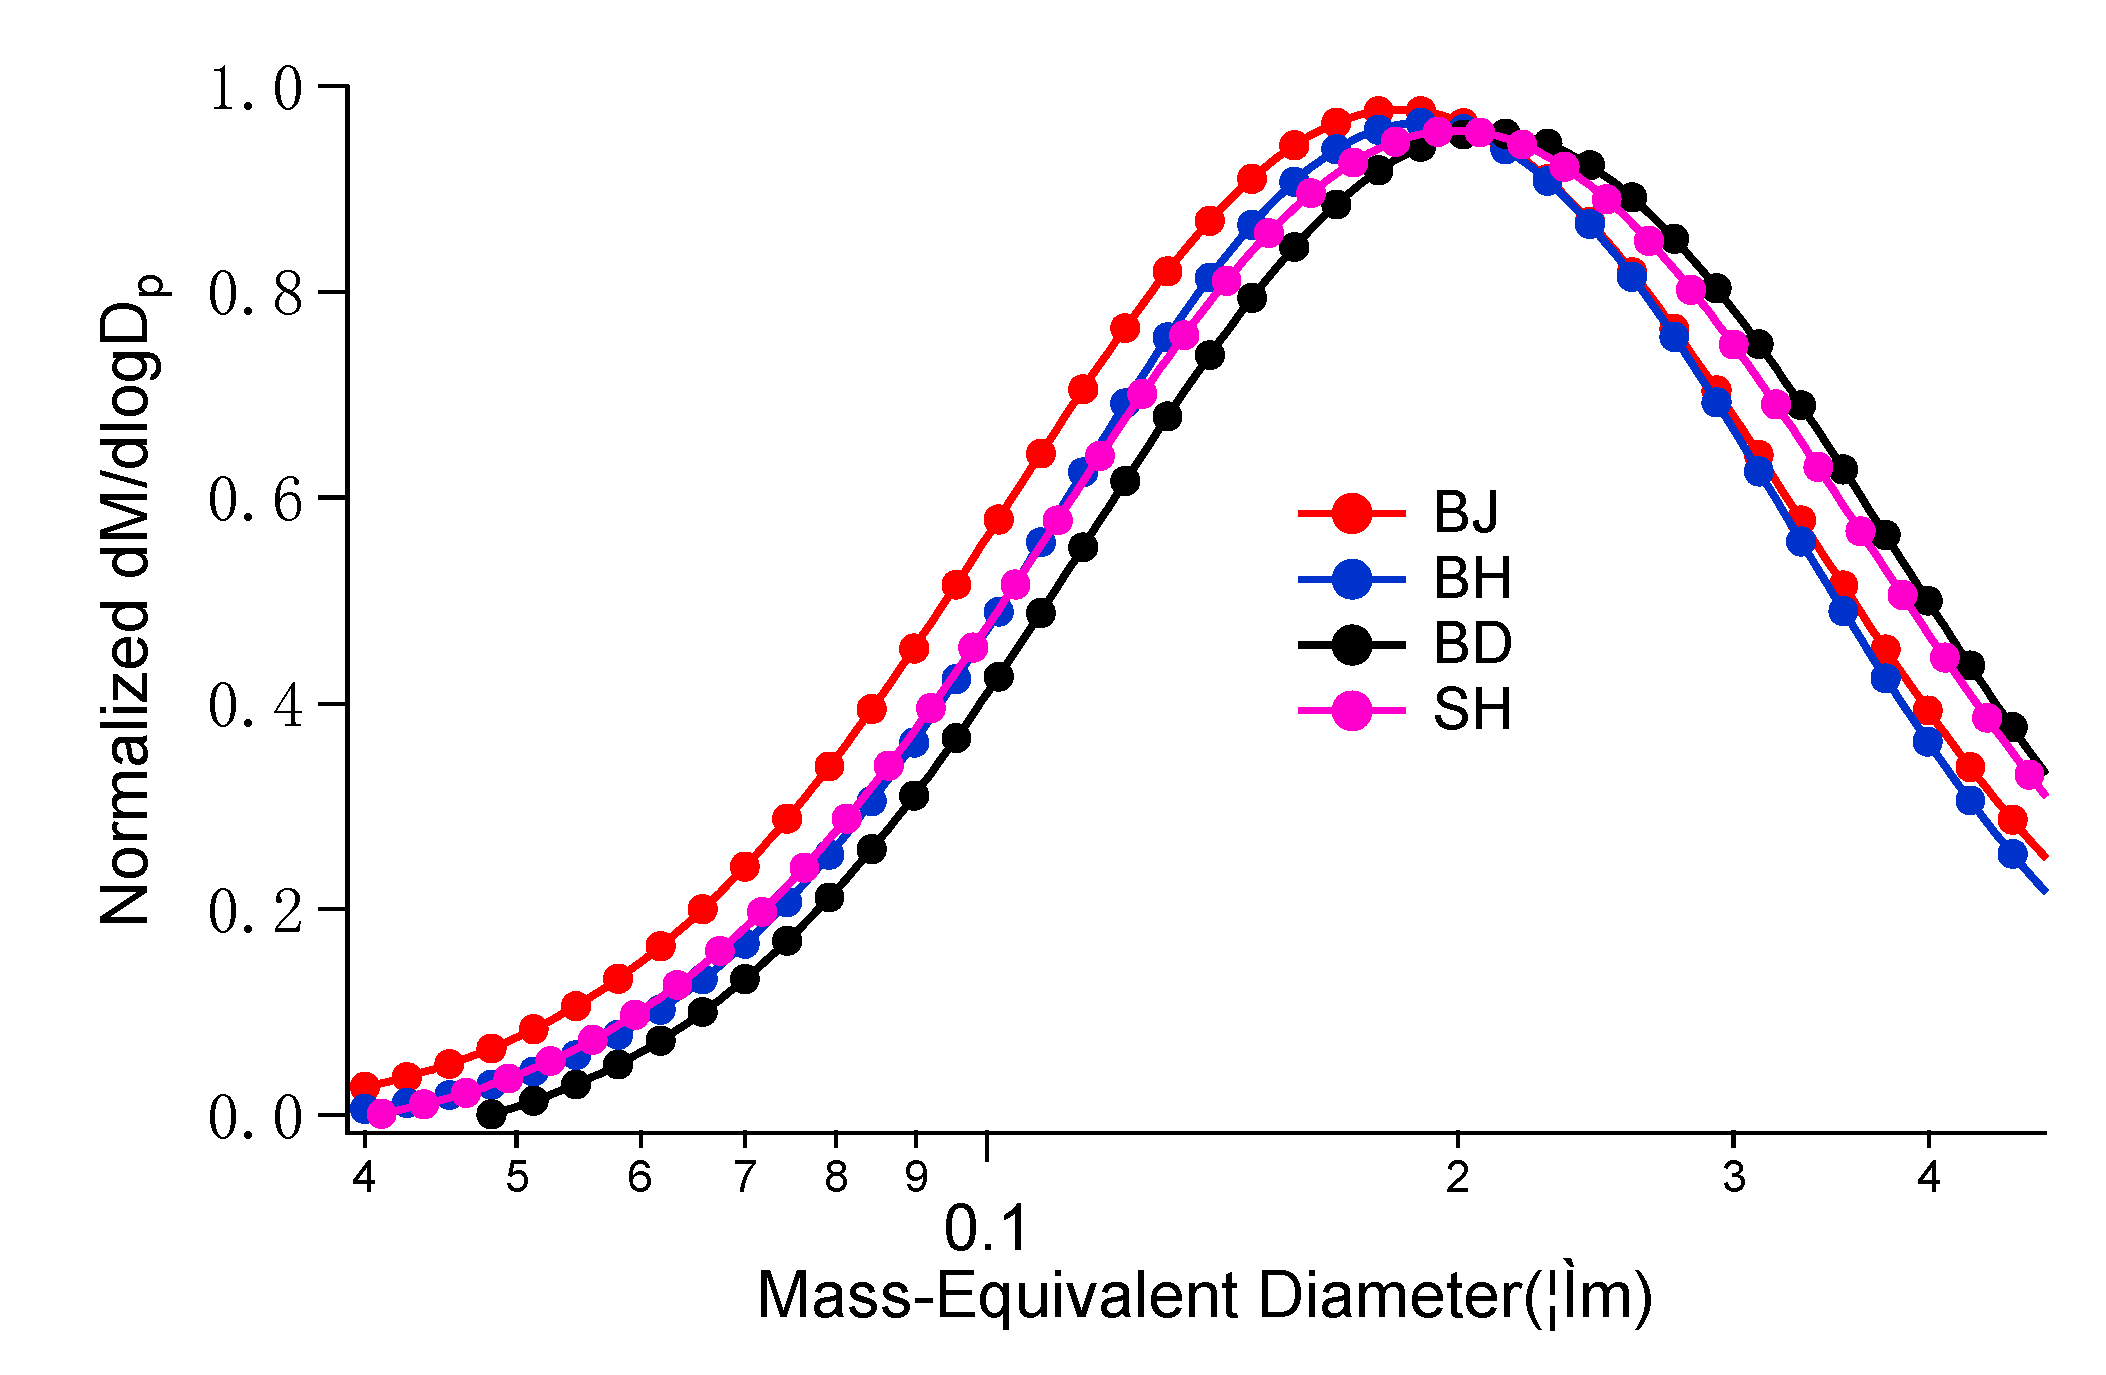
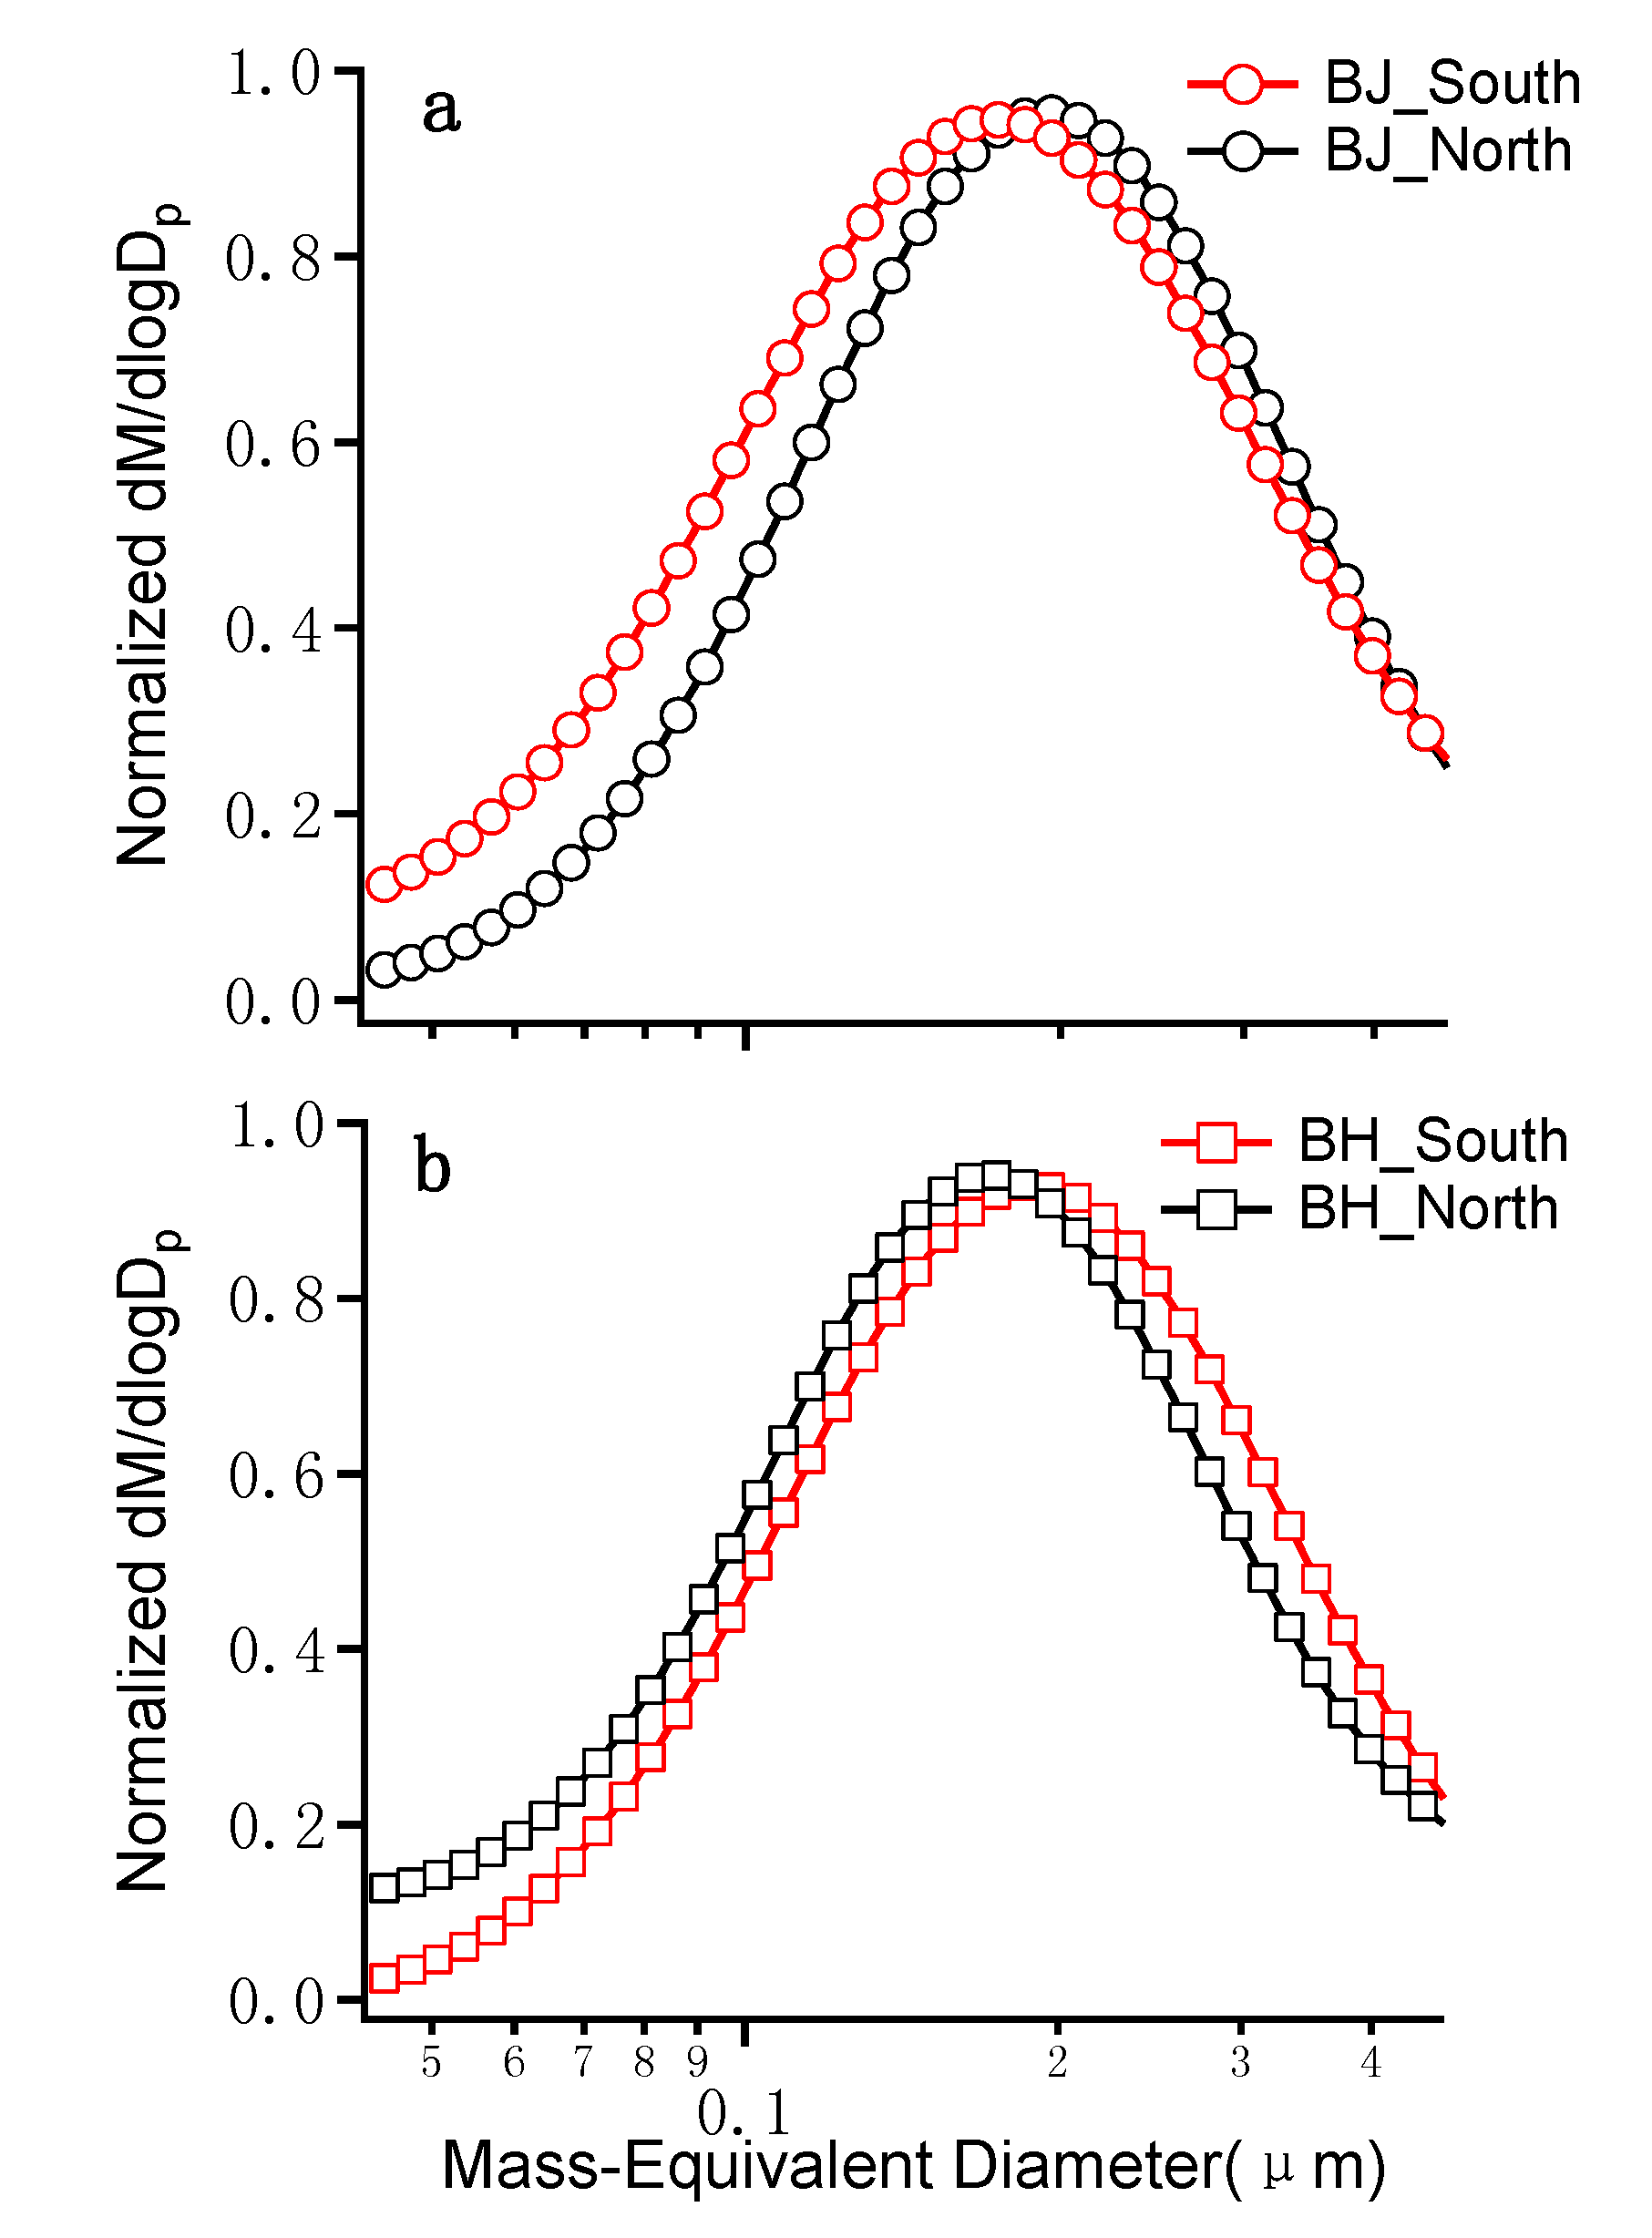
The analysis of the size distributions shows that about 80% of the rBC particles were in the diameter range from 70 to 400 nm, and the mean diameter at the peak rBC concentrations was about 180–210 nm. This suggests that the rBC particles were relatively small (less than 1 μm in diameter).
(4)
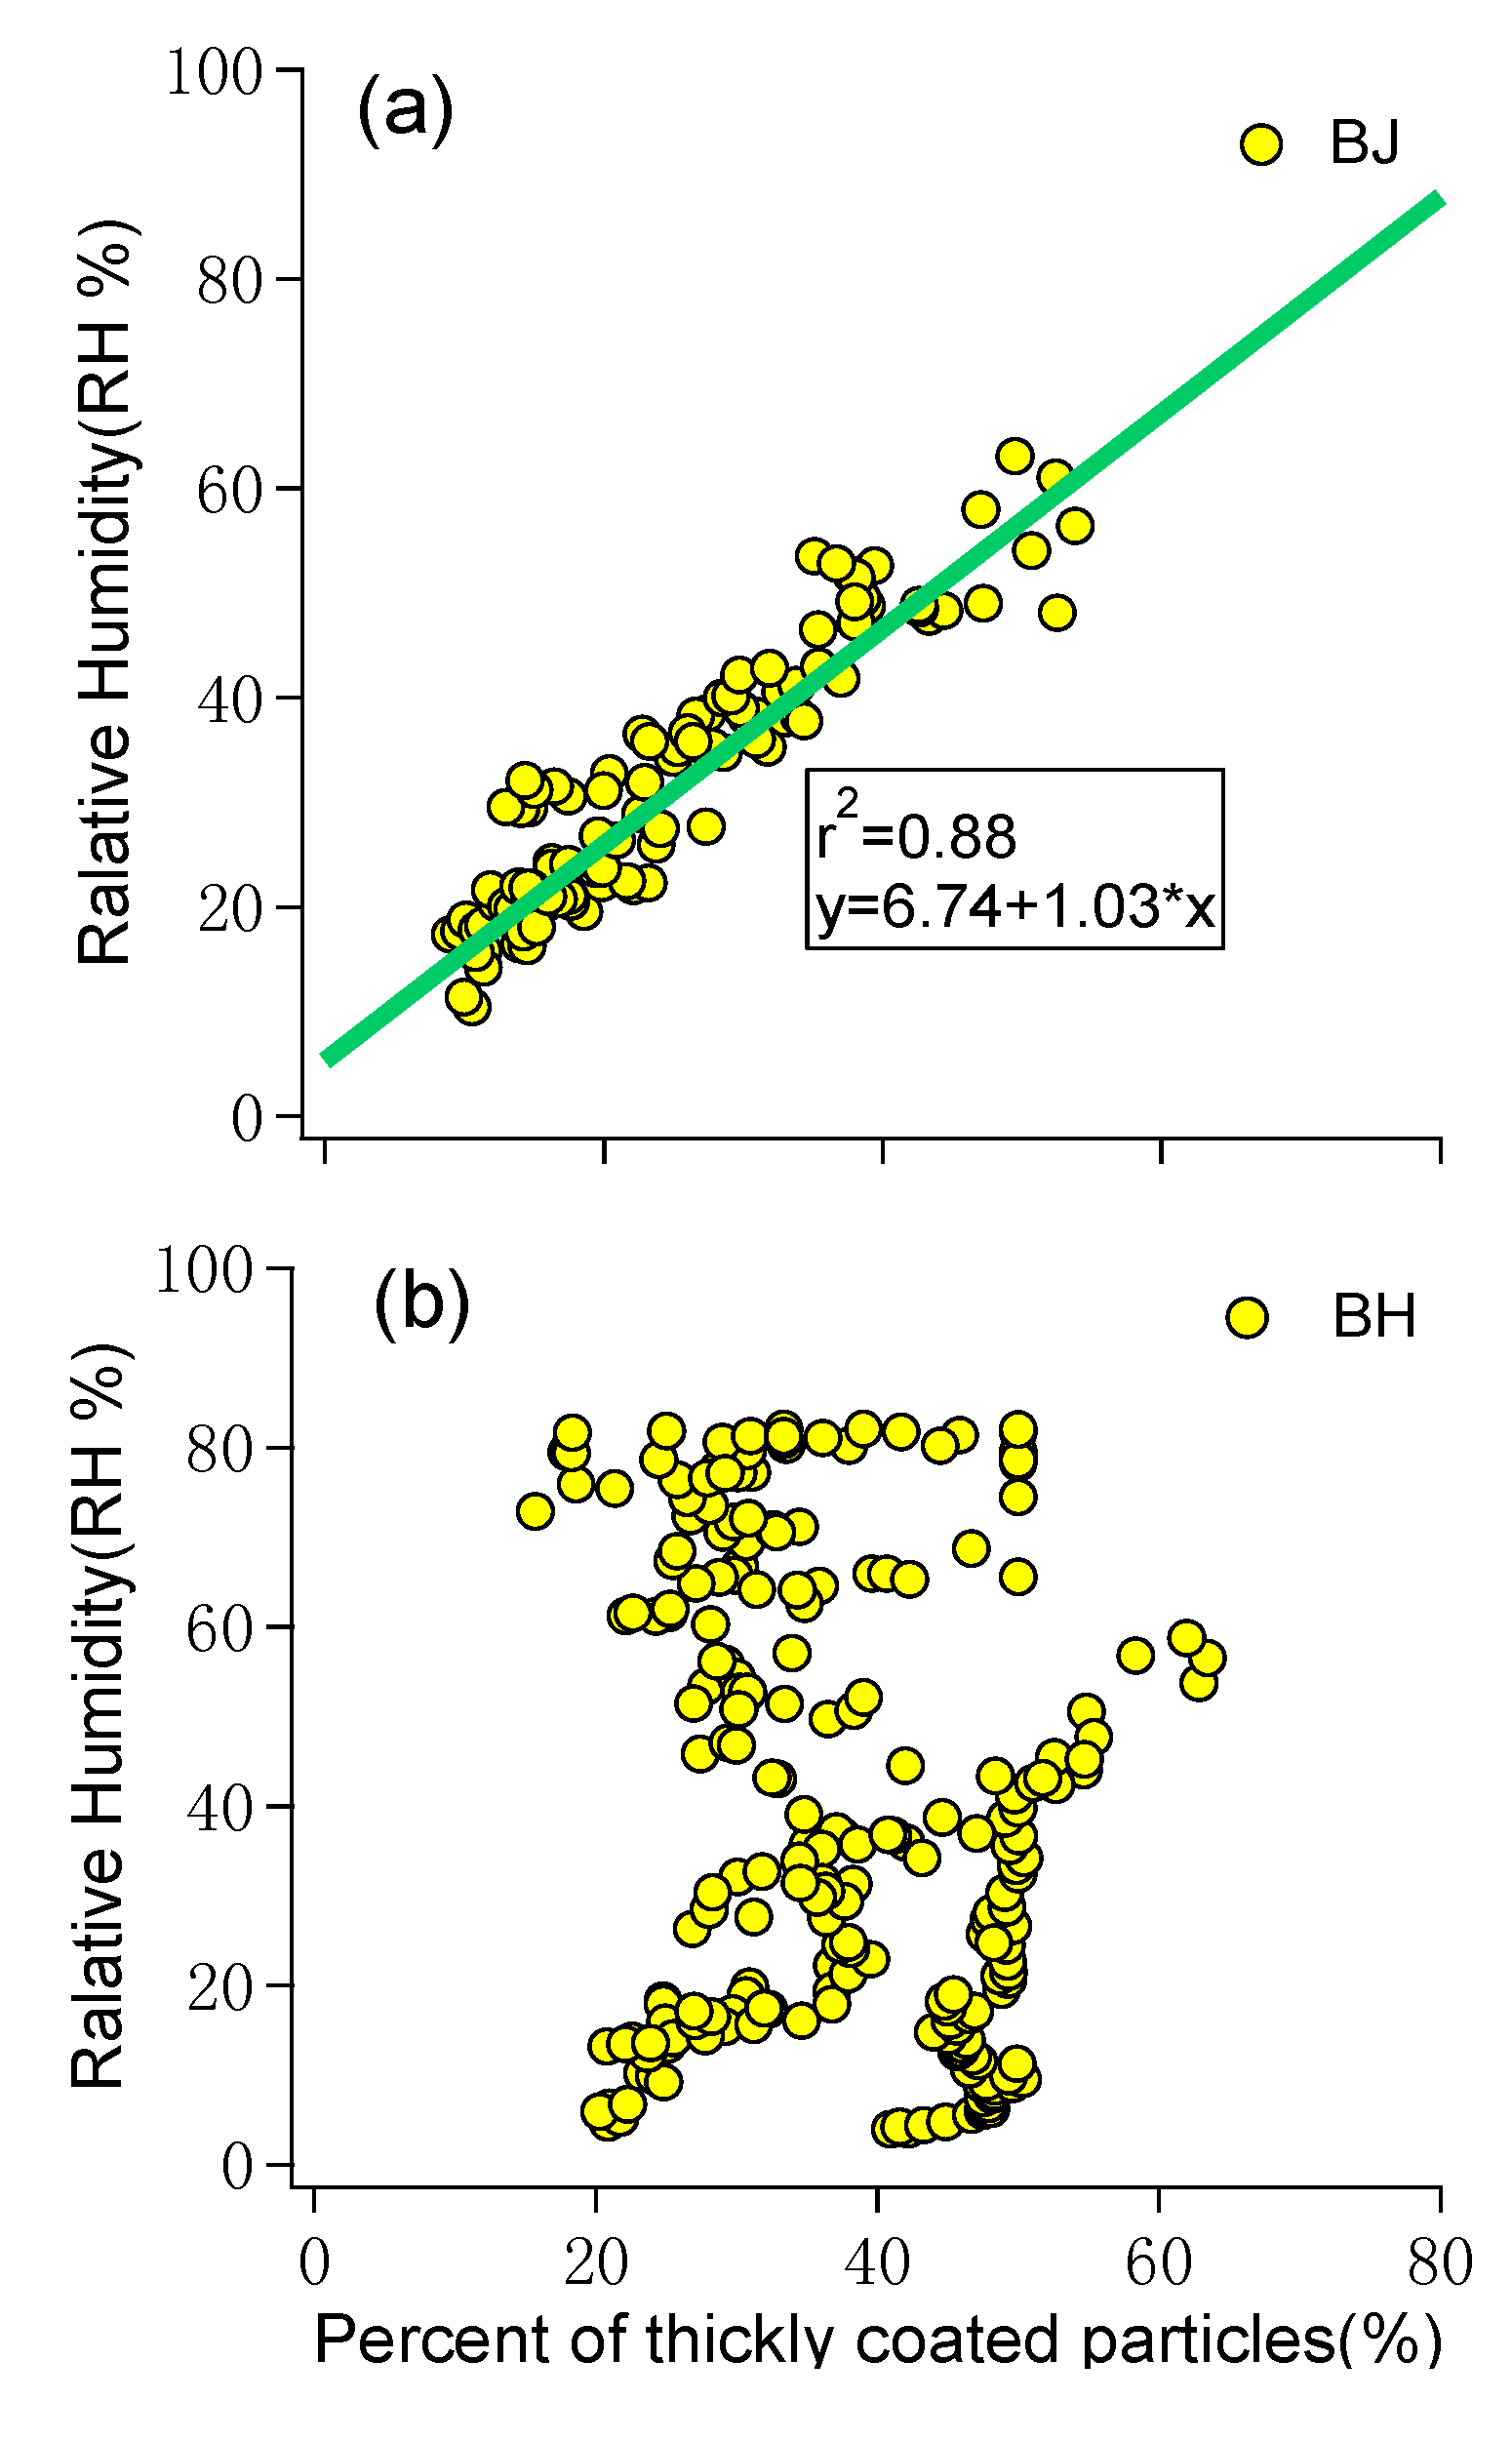
The “mixing state” of the rBC particles was analyzed to study the coating processes that occurred on the surface of the rBC particles. The results indicate that the air mass conditions strongly affected the number fraction (NF) of the coated particles. Under the southern air mass in BJ, the local air pollution was high at a lower height of the PBL and a higher humidity. As a result, the hygroscopic growth of rBC rapidly occurred, producing high NF values (~65%). The correlation coefficient between the NF and the local relative humidity (RH) was 0.88.
(5)
The findings of the rapid hygroscopic growth in BJ under the polluted condition has important implications for studying the rBC budget in the atmosphere. The rapid conversion from hydrophobic to hydrophilic rBC particles results in a shorter lifetime of rBC particles under heavy pollution and a lower residence time of the rBC particles in the atmosphere.

Acknowledgments

We sincerely wish to thank R.S. Gao at NOAA (USA), Gavin McMeeking at the DMT Company (USA), and Q.Y. Wang at Xi’an Jiaotong University (China) for their helpful discussions. This research was supported by the National Natural Science Foundation of China (NSFC) under Grant No. 41175007, 41375135, and 41430424. The National Center for Atmospheric Research is sponsored by the National Science Foundation.

Author Contributions

Xuexi Tie, Delong Zhao, and Qiang Zhang write the paper. Qiang Zhang takes in charge for the operation of allaircraft flights and measurements. Yang Gao, HaijunTian, Kai Bi, Yongli Jin, and Pengfei Chen help for the data analysis.

Conflicts of Interest

We declare that there is no conflict of interest.

References

  1. Ramanathan, V.; Ramana, M.V.; Roberts, G.; Kim, D.; Corrigan, C.; Chung, C.; Winker, D. Warming trends in Asia amplified by brown cloud solar absorption. Nature 2007, 448, 575–578. [Google Scholar] [CrossRef] [PubMed]
  2. Ramanathan, V.; Carmichael, G. Global and regional climate changes due to black carbon. Nat. Geosci. 2008, 1, 221–227. [Google Scholar] [CrossRef]
  3. Ramana, M.V.; Ramanathan, V.; Feng, Y.; Yoon, S.C.; Kim, S.W.; Carmichael, G.R.; Schauer, J.J. Warming influenced by the ratio of black carbon to sulphate and the black-carbon source. Nat. Geosci. 2010, 3, 542–545. [Google Scholar] [CrossRef]
  4. Tie, X.; Madronich, S.; Walters, S.; Edwards, D.P.; Ginoux, P.; Mahowald, N.; Zhang, R.Y.; Lou, C.; Brasseur, G. Assessment of the global impact of aerosols on tropospheric oxidants. J. Geophys. Res. 2005, 110, D03204. [Google Scholar]
  5. Li, G.; Zhang, R.; Fan, J.; Tie, X. Impacts of Black Carbon Aerosol on Photolysis Frequenciesand Ozone in the Houston Area. J. Geophys. Res. 2005, 110, D23206. [Google Scholar] [CrossRef]
  6. Baumgardner, D.; Kok, G.; Raga, G. Warming of the Arctic lower stratosphere by light absorbing particles. Geophys. Res. Lett. 2004, 31, L06117. [Google Scholar]
  7. Schwarz, J.P.; Gao, R.S.; Fahey, D.W.; Thomson, D.S.; Watts, L.A.; Wilson, J.C.; Reeves, J.M.; Darbeheshti, M.; Baumgardner, D.G.; Kok, G.L.; et al. Single particle measurements of mid-latitude black carbon and light-scattering aerosols from the boundary layer to the lower stratosphere. J. Geophys. Res. Atmos. 2006, 111, D16207. [Google Scholar] [CrossRef]
  8. Gao, R.S.; Hall, S.R.; Swartz, W.H.; Schwarz, J.P.; Spackman, J.R.; Watts, L.A.; Fahey, D.W.; Aikin, K.C.; Shetter, R.E.; Bui, T.P. Calculations of solar shortwave heating rates due to black carbon and ozone absorption using in situ measurements. J. Geophys. Res. 2008, 113, D14203. [Google Scholar] [CrossRef]
  9. Conant, W.C.; Nenes, A.; Seinfeld, J.H. Black carbon radiative heating effects on cloud microphysics and implications for aerosol indirect forcing, Extended Köhler theory. J. Geophys. Res. 2002, 107, D21. [Google Scholar]
  10. Dusek, U.; Reischl, G.P.; Hitzenberger, R. CCN activation of pure and coated carbon black particles. Environ. Sci. 2006, 40, 1223–1230. [Google Scholar] [CrossRef]
  11. Cozic, J.; Mertes, S.; Verheggen, B.; Cziczo, D.J.; Gallavardin, S.J.; Walter, S.; Baltensperger, U.; Weingartner, E. Black carbon enrichment in atmospheric ice particle residuals observed in lower tropospheric mixed phase clouds. J. Geophys. Res. 2008, 113, D15209. [Google Scholar] [CrossRef]
  12. Cozic, J.; Verheggen, B.; Mertes, S.; Connolly, P.; Bower, K.; Petzold, A.; Baltensperger, U.; Weingartner, E. Scavenging of black carbon in mixed phase clouds at the high alpine site Jungfraujoch. Atmos. Chem. Phys. 2007, 7, 1797–1807. [Google Scholar]
  13. Baumgardner, D.; Subramanian, R.; Twohy, C.; Stith, J.; Kok, G. Scavenging of black carbon by ice crystals over the northern Pacific. Geophys. Res .Lett. 2008, 35, L22815. [Google Scholar] [CrossRef]
  14. Cao, G.L.; Zhang, X.Y.; Zheng, F.C. Inventory of black carbon and organic carbon emissions from China. Atmos. Environ. 2006, 40, 6516–6527. [Google Scholar] [CrossRef]
  15. Song, W.W.; He, K.B.; Lei, Y. Black carbon emissions from on-road vehicles in China, 1990–2030. Atmos. Environ. 2011, 51, 320–328. [Google Scholar] [CrossRef]
  16. Westerdahl, D.; Wang, X.; Pan, X.C.; Zhang, K.M. Characterization of on-road vehicle emission factors and microenvironmental air quality in Beijing, China. Atmos. Environ. 2009, 43, 697–705. [Google Scholar] [CrossRef]
  17. Pan, X.L.; Wang, Z.A.; Wang, X.Q.; Dong, H.B.; Zhang, W.; Alex, G.; Huang, J.P. Characteristics of urban black carbon concentration around 2008 Beijing Olympic Games. Clim. Environ. Res. 2010, 15, 616–623. [Google Scholar]
  18. Pan, X.L.; Kanaya, K.; Wang, Z.F.; Liu, Y.; Pochanart, P.; Akimoto, H.; Sun, Y.L.; Dong, H.B.; Li, J.; Irie, H.; et al. Correlation of black carbon aerosol and carbon monoxide in the high-altitude environment of Mt. Huang in Eastern China. Atmos. Chem. Phys. 2011, 11, 9735–9747. [Google Scholar]
  19. Liu, S.D.; Xia, X.H.; Zhai, Y.; Wang, R.; Liu, T.; Zhang, S.W. Black carbon (rBC) in urban and surrounding rural soils of Beijing, China: Spatial distribution and relationship with polycyclic aromatic hydrocarbons (PAHs). Chemsphere 2011, 82, 223–228. [Google Scholar] [CrossRef]
  20. Zhang, F.W.; Zhao, J.P.; Chen, J.S.; Xu, Y.; Xu, L.L. Pollution characteristics of organic and elemental carbon in PM2.5 in Xiamen, China. J. Environ. Sci. 2011, 23, 1342–1349. [Google Scholar] [CrossRef]
  21. Song, S.J.; Wu, Y.; Xu, J.Y.; Ohara, T.; Hasegawa, S.C.; Li, J.Q.; Yang, L.; Hao, J.M. Black carbon at a roadside site in Beijing: Temporal variations and relationships with carbon monoxide and particle number size distribution. Atmos. Environ. 2013, 77, 213–221. [Google Scholar] [CrossRef]
  22. McMeeking, G.R.; Hamburger, T.; Liu, D.; Flynn, M.; Morgan, W.T.; Northway, M.; Highwood, E.J.; Krejci, R.; Allan, J.D.; Minikin, A.; et al. Black carbon measurements in the boundary layer over western and northern Europe. Atmos. Chem. Phys. 2010, 10, 9393–9414. [Google Scholar] [CrossRef]
  23. McMeeking, G.R.; Morgan, W.T.; Flynn, M.; Highwood, E.J.; Turnbull, K.; Haywood, J.; Coe, H. Black carbon aerosol mixing state, organic aerosols and aerosol optical properties over the United Kingdom. Atmos. Chem. Phys. 2011, 11, 9037–9052. [Google Scholar] [CrossRef]
  24. McMeeking, G.R.; Bart, M.; Chazette, P.; Haywood, J.M.; Hopkins, J.R.; McQuaid, J.B.; Morgan, W.T.; Raut, J.-C.; Ryder, C.L.; Savage, N.; et al. Airborne measurements of trace gases and aerosols over the London metropolitan region. Atmos. Chem. Phys. 2012, 12, 5163–5187. [Google Scholar] [CrossRef] [Green Version]
  25. Moteki, N.; Kondo, Y.; Miyazaki, Y.; Takegawa, N.; Komazaki, Y.; Kurata, G.; Shirai, T.; Blake, D.R.; Miyakawa, T.; Koike, M. Evolution of mixing state of black carbon particles: Aircraft measurements over the western Pacific in March 2004. Geophys. Res. Lett. 2007, 34, L11803. [Google Scholar] [CrossRef]
  26. Oshima, N.; Kondo, Y.; Moteki, N.; Takegawa, N.; Koike, M.; Kita, K.; Matsui, H.; Kajino, M.; Nakamura, H.; Jung, J.S.; et al. Wet removal of black carbon in Asian outflow: Aerosol Radiative Forcing in East Asia (A-FORCE) aircraft campaign. J. Geophys. Res. 2012, 117, D03204. [Google Scholar]
  27. Shiraiwa, M.; Kondo, Y.; Moteki, N.; Takegawa, N.; Miyazaki, Y.; Blake, D.R. Evolution of mixing state of black carbon in polluted air from Tokyo. Geophys. Res. Lett. 2007, 34, L16803. [Google Scholar]
  28. Shiraiwa, M.; Kondo, Y.; Moteki, N.; Takegawa, N.; Sahu, L.K.; Takami, A.; Hatakeyama, S.; Yonemura, S.; Blake, D.T. Radiative impact of mixing state of black carbon aerosol in Asian outflow. J. Geophys. Res. 2008, 113, D24210. [Google Scholar] [CrossRef]
  29. Baumgardner, D.; Kok, G.L.; Raga, G.B. On the diurnal variability of particle properties related to light absorbing carbon in Mexico City. Atmos. Chem. Phys. 2007, 7, 2517–2526. [Google Scholar] [CrossRef]
  30. Schwarz, J.P.; Gao, R.S.; Spackman, J.R.; Watts, L.A.; Thomson, D.S.; Fahey, D.W.; Ryerson, T.B.; Peischl, J.; Holloway, J.S.; Trainer, M.; et al. Measurement of the mixing state, mass, and optical size of individual black carbon particles in urban and biomass burning emissions. Geophys. Res. Lett. 2008, 35, L13810. [Google Scholar] [CrossRef]
  31. Schwarz, J.P.; Spackman, J.R.; Fahey, D.W.; Gao, R.S.; Lohmann, U.; Stier, P.; Watts, L.A.; Thomson, D.S.; Lack, D.A.; Pfister, L.; et al. Coatings and their enhancement of black carbon light absorption in the tropical atmosphere. J. Geophys. Res. 2008, 113, D03203. [Google Scholar]
  32. Subramanian, R.; Kok, G.L.; Baumgardner, D.; Clarke, A.; Shinozuka, Y.; Campos, T.L.; Heizer, C.G.; Stephens, B.B.; de Foy, B.; Voss, P.B.; et al. Black carbon over Mexico: The effect of atmospheric transport on mixing state, mass absorption cross-section, and rBC/CO ratios. Atmos. Chem. Phys. 2010, 10, 219–237. [Google Scholar] [CrossRef]
  33. Metcalf, A.R.; Craven, J.S.; Ensberg, J.J.; Brioude, J.; Angevine, W.; Sorooshian, A.; Duong, H.T.; Jonsson, H.H.; Flagan, R.C.; Seinfeld, J.H. Black carbon aerosol over the Los Angeles Basin during CalNex. J. Geophys. Res. 2012, 117, D00V13. [Google Scholar]
  34. Huang, X.F.; Sun, T.L.; Zeng, L.W.; Yu, G.H.; Luan, S.J. Black carbon aerosol characterization in a coastal city in South China using a single particle soot photometer. Atmos. Environ. 2012, 51, 21–28. [Google Scholar] [CrossRef]
  35. Sun, T.L.; He, L.Y.; Huang, X.F.; Zeng, L.W.; Hu, M.; Zhang, Y.H. Characteristics of the size distribution and mixing state of black carbon aerosol in Shenzhen in winter. Chin. Sci. Bull. (Chinese Ver) 2011, 56, 1703–1710. (in Chinese). [Google Scholar] [CrossRef]
  36. Zhang, Q.; Ma, X.C.; Tie, X.X.; Huang, M.Y.; Zhao, C.S. Vertical distribution of aerosols under different weather conditions: Analysis of in-situ aircraft measurements in Beijing, China. Atmos. Environ. 2009, 43, 5526–5535. [Google Scholar] [CrossRef]
  37. Streets, D.G.; Yu, C.; Wu, Y.; Chin, M.; Zhao, Z.C.; Hayasaka, T.; Shi, G.Y. Aerosol trends over China, 1980–2000. Atmos. Res. 2008, 88, 174–182. [Google Scholar] [CrossRef]
  38. Quan, J.N.; Gao, Y.; Zhang, Q.; Tie, X.; Cao, J.; Han, S.Q.; Meng, J.W.; Chen, P.F.; Zhao, D.L. Evolution of Planetary Boundary Layer under different weather conditions, and its impact on aerosol concentrations. Atmos. Environ. 2013, 11, 34–40. [Google Scholar]
  39. Sahu, L.K.; Kondo, Y.; Moteki, N.; Takegawa, N.; Zhao, Y.; Cubison, M.J.; Jimenez, J.L.; Vay, S.; Diskin, G.S.; Wisthaler, A.; et al. Emission characteristics of black carbon in anthropogenic and biomass burning plumes over California during ARCTAS-CARB 2008. J. Geophys. Res. 2012, 117, D16302. [Google Scholar] [CrossRef]
  40. Draxler, R.; Rolph, G. HYSPLIT (HYbrid Single-Particle Lagrangian Integrated Trajectory) Model Access Via NOAA ARL READY Website; NOAA Air Resources Laboratory: Silver Spring, MD, USA, 2003. Available online: http://www.arl.noaa.gov/ready/hysplit4.html (accessed on 14 May 2015).
  41. Tie, X.; Zhang; He, H.; Cao, J.J.; Han, S.Q.; Gao, Y.; Li, X.; Jia, X.C. A budget analysis on the formation of haze in Beijing. Atmos. Environ. 2015, 100, 25–36. [Google Scholar] [CrossRef]
  42. Tie, X.; Madronich, S.; Li, G.H.; Ying, Z.M.; Weinheimer, A.; Apel, E.; Campos, T. Simulation of Mexico City Plumes during the MIRAGE-Mex Field Campaign Using the WRF-Chem Model. Atmos. Chem. Phys. 2009, 9, 4621–4638. [Google Scholar] [CrossRef]
  43. Moteki, N.; Kondo, Y.; Oshima, N.; Koike, M.; Kita, K.; Matsui, H.; Kajino, M. Size dependence of wet removal of black carbon aerosols during transport from the boundary layer to the free troposphere. Geophys. Res. Lett. 2012, 39, L13802. [Google Scholar]
  44. Bond, T.C.; Habib, G.; Bergstorm, R.W. Limitations in the enhancement of visible light absorption due to mixing state. J. Geophys. Res. 2006, 111, D20211. [Google Scholar] [CrossRef]
  45. Tie, X.; Brasseur, G.; Emmons, L.; Horowitz, L.; Kinnison, D. Effects of aerosols on tropospheric oxidants: A global model study. J. Geophys. Res. 2001, 106, 22931–22964. [Google Scholar] [CrossRef]

