Article

Characteristics of Carbonaceous Species in PM2.5 in Wanzhou in the Hinterland of the Three Gorges Reservior of Northeast Chongqing, China

1
Key Laboratory of Water Environment Evolution and Pollution Control in Three Gorges Reservoir, Chongqing Three Gorges University, Wanzhou 404100, China
2
Chongqing Institute of Green and Intelligent Technology, Key Laboratory of Reservoir Aquatic Environment, Chinese Academy of Sciences, Chongqing 400714, China
*
Author to whom correspondence should be addressed.
Atmosphere 2015, 6(4), 534-546; https://doi.org/10.3390/atmos6040534
Submission received: 4 January 2015 / Revised: 30 March 2015 / Accepted: 3 April 2015 / Published: 13 April 2015
(This article belongs to the Special Issue Sources, Formation and Impacts of Secondary Aerosol)

Abstract

:
Daily PM2.5 samples were collected in the four consecutive seasons in 2013 in Wanzhou, the second largest city in Chongqing Municipality of China and in the hinterland of the Three Gorges Reservior on Yangtze River and analyzed for the mass concentrations and carbonaceous species of PM2.5 to investigate the abundance and seasonal characteristics of PM2.5, and organic carbon (OC) and elemental carbon (EC). The annual average PM2.5 concentrations were 125.3 μg·m−3, while OC and EC were 23.6 μg·m−3 and 8.7 μg·m−3, respectively. The total carbonaceous aerosol (TCA) accounted for 32.6% of the PM2.5 mass. On seasonal average, the OC and EC concentrations ranked in the order of winter > fall > spring > summer, which could be attributed to the combined effects of changes in local emissions and seasonal meteorological conditions. Strong OC-EC correlations were found in the winter and fall, suggesting the contributions of similar sources. The lowest OC-EC correlation occurred in the summer, probably due to the increases in biogenic emission and formation of secondary organic aerosol (SOA) through photochemical activity. Average secondary organic carbon (SOC) concentration was 9.0 μg·m−3, accounting for 32.3% of the total OC. The average ratios of SOA/PM2.5 of 3.8%~15.7% indicated that SOA was a minor fraction in fine particles of Wanzhou.

1. Introduction

In recent years, fine particulate matter (with aerodynamic diameter less than 2.5 μm, PM2.5) has drawn extensive attention in China because most Chinese regions are affected by the large-scale haze days [1]. In 2012, China’s state environmental protection department revised the original ambient air quality standards, the revised standard added limits to PM2.5 (annual average limit 35 μg·m−3, daily average limit 75 μg·m−3). Carbonaceous fractions, as air pollutants, climate agents and represent the complexity of aerosols, are major components in fine particles, contributing 10%~70% of PM2.5 mass in urban atmosphere [2,3]. Bond et al. [4] estimated that China contributes roughly one-fifth of the global carbonaceous emissions. Thus, it is necessary to conduct research in carbonaceous aerosol, especially in China.
Carbonaceous species are usually classified into elemental carbon (EC) and organic carbon (OC). EC, emitted mainly from the incomplete combustion, is the principal light-absorbing species in the atmosphere and plays an important role in visibility reduction and the aerosol radiative forcing. It was reported that global warming [5,6], variation of precipitation [7], and reduction of crop yield [8] are associated with EC aerosols. OC comes from both the primary emission and also the secondary origin to form secondary organic carbon (SOC) through gas-to-particle reactions. OC is composed of thousands of organic compounds, of which a significant fraction is potential mutagens or carcinogens, such as polycyclic aromatic hydrocarbons (PAHs) and polychlorinated biphenyls (PCBs) [9]. It is also known that OC is a major component in scattering light and cooling the atmosphere [3]. Consequently, studying OC and EC levels and tracking their changes with time are of great significance for identifying their emission sources, understanding their atmospheric transport/transformation mechanisms.
Wanzhou is a district of Chongqing Municipality of China, with a population of one million and vehicle numbers of about 0.16 million in 2013. Influenced by the mountainous topographic condition, Wanzhou is within the region of lowest wind speed over China, for example, the wind speed was in the range of 0.50–1.67 m·s−1 in 2013. Wanzhou, 327 km away from downtown Chongqing, is located in the northeastern part of Chongqing and the hinterland of the Three Gorges Reservior (TGR) on Yangtze River. In the light of the important and sensitive location in the Three Gorges Reservoir, many researches on environmental problems were reported about Wanzhou. For example, Xiao et al. [10,11] estimated the risk of infection with pathogens in Wanzhou watershed. Fu et al. [12] evaluated the quality status of the sediments in Wanzhou section of TGR. Lin et al. [13] investigated heavy metal contamination in the water-level fluctuating zone of TGR within Wanzhou section. However, to the best of our knowledge, no reports are available on atmospheric environment, especially growing concerned atmospheric fine particle concentrations and the compositions in Wanzhou. Consequently, the purpose of this study was to initiate PM2.5 monitoring at this location, and summarized some preliminary findings for the carbonaceous species in PM2.5 in Wanzhou. This information will provide an essential baseline to understand the level of carbonaceous particulate pollution and its trends, and has implications for local PM control effectiveness in Wanzhou.

2. Materials and Methods
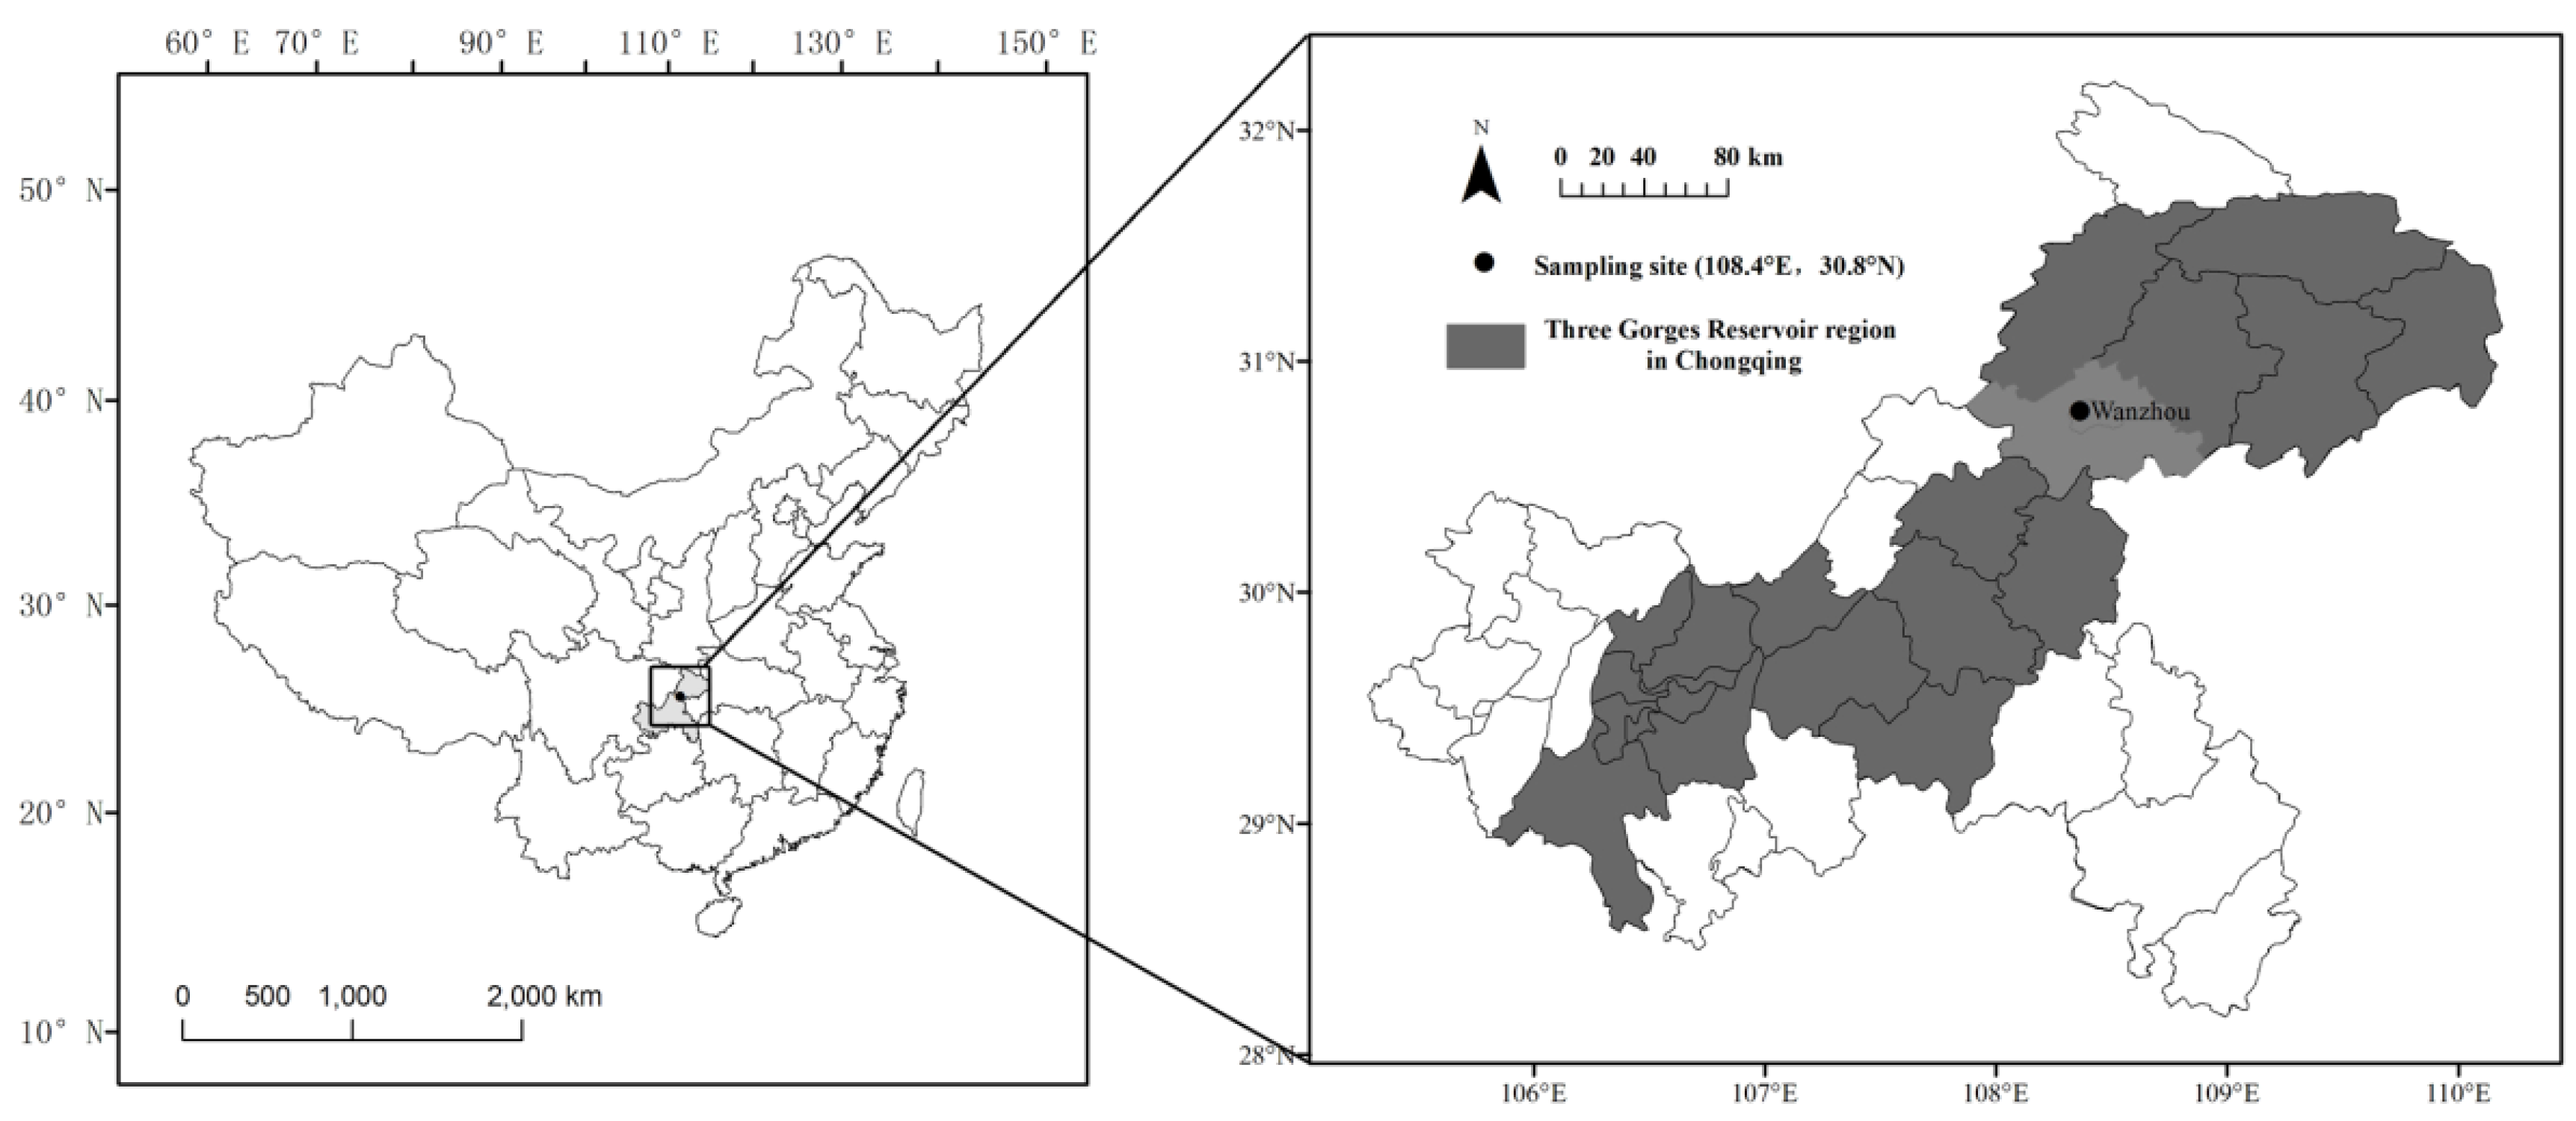
2.1. Sampling Site

Sampling of PM2.5 was performed on the rooftop of a 27 m tall experimental building on the campus of Congqing Three Gorges University (Figure 1). The campus, located in the main part of Wanzhou is surrounded by many restaurants and residential areas. A building construction site is situated about 300 m west of the sampling site, and Yangtze River is 600 m away from the site. This site represents a mixed residential, commercial and cultural environment of urban area.

2.2. Sampling and Analysis

Samples were taken during 24 h on pre-fire (2 h at 450 °C) pre-conditioned (48 h in a constant conditioned box at 20 °C and 45% ± 5% RH) and pre-weighted glass fiber filters (90 mm) using medium-volume sampler (Qingdao Heng Yuan Development Co. Ltd., China), the flow rate was 100 m3·min−1. Samples were collected every two/three days in January, April, July, and October in 2013, which were selected to represent winter, spring, summer, and autumn in Wanzhou, respectively, and a total of 48 valid samples were collected. After particle collection, the filters are re-conditioned for another 48 h in the constant conditioned box and subsequently analyzed for total mass. After re-weighing, the filters were stored in a freezer at 4 °C to limit losses of volatile components. The described PM2.5 measurement is in accordance with the national standard method [14], which is used in China to control the standards.
During the sampling period, meteorological data, including ambient temperature, relative humidity (RH), wind speed/direction, total solar radiation, and atmospheric pressure were also recorded by using weather monitoring (WS500-UMB). All samples were collected in a period of normal climatological conditions and the meteorological parameters during sampling period were listed in Table 1. Meteorological parameters between sampling period and seasonal period were compared in Figure S1, the similar trend of the climatological parameters indicated the representative of the samples.
Table 1. Meteorological parameters during sampling period.
Sampling PeriodTemperature (°C)Relative Humidity (%)Wind Speed (m·s−1)Wind Direction (°)Total Solar Radiation (w·m−2)Atmospheric Pressure (v)
January 20135.2–12.2 (8.3)57.6–97.8 (79.6)0.50–1.10 (0.67)97.3–261.9 (152.7)7.5–133.0 (58.2)974.5–994.9 (985.9)
April 201315.1–23.2 (18.9)66.1–98.0 (80.7)0.55–1.56 (0.85)91.5–168.0 (124.6)16.7–254.2 (125.3)968.6–976.0 (982.1)
July 201324.9–33.1 (30.2)55.2–98.9 (67.9)0.65–1.44 (0.98)92.1–162.3 (117.2)40.2–309.5 (216.6)961.0–967.6 (964.3)
October 201313.5–24.8 (19.6)50.0–98.0 (77.6)0.57–1.31 (0.72)89.5–182.2 (121.2)12.0–204.4 (112.0)975.1–988.5 (982.2)
Figure 1. Location map of the sampling site in Wanzhou.
Atmosphere 06 00534 g001
The samples were analyzed for OC and EC by thermal method with an elemental analyzer (Euro Vector, EA3000). The procedure performed in this study is similar to the method described by Chi et al. [15]. In this protocol, the carrier gas is always helium with 8% oxygen. A 0.5 cm2 punch from each sample was sealed in a tin container, and then fed into the elemental analyzer, and then heated to 500 °C to obtain the organic carbon content. Another 0.5 cm2 punch sample was sealed in another tin container and fed into the elemental analyzer, and then heated to 980 °C to obtain the total carbon concentration. The EC value was taken as the difference between TC and OC. Each sample was measured three times and we took the mean value as the final result. Ten blank filters were also analyzed and the sample results were corrected by the average of the blank concentrations.
Many analysis methods have been used to quantify carbonaceous aerosol, in which thermal and thermal-optical method are the most used method. However, there is no recognized standard method throughout the world [16]. Although lack of an optical pyrolysis correction in thermal method in the present work may underestimate OC and overestimate EC, the accuracy of this method was proved feasible by interlaboratory comparison in other places where the same method to determine OC and EC was employed [17,18].

3. Results and Discussion

3.1. PM2.5 Concentrations

The diurnal average PM2.5 concentration varied from 29.7 μg·m−3 to 483.8 μg·m−3 in 2013. Compared to the Ambient Air Quality Standard (AAQS) of Class II (75 μg·m−3) for PM2.5 applicable to residential and cultural regions and promulgated by State Environmental Protection Agency of China (SEPA) in 2012. During the sampling periods, 34 samples in 48 PM2.5 samples exceeded the standard of SEPA, with the pollution level of PM2.5 exceeding the standard by 1.0–6.5 times.
Seasonal variations of PM2.5 concentrations were distinct. On average, PM2.5 was 236.0 ± 104.5 μg·m3 in winter, 77.5 ± 48.0 μg·m−3 in spring, 73.4 ± 19.5 μg·m−3 in summer, and 114.3 ± 35.4 μg·m−3 in fall, respectively. The seasonal characteristics of PM2.5 concentrations in Wanzhou can be explained as the combined impact of climatic conditions and local emissions. The highest concentration of PM2.5 in winter could be attributed to the unfavorable meteorological conditions and enhanced local emissions. As can be seen from Table 2, the wind speed was lowest, RH and atmospheric pressure was relatively higher in winter, these meteorological conditions favored the formation of low mixing or inversion layer which limited the dilution and dispersion of pollutions. Additionally, enhanced residential wood and coal combustion, and conventional meat smoking to make bacon in Wanzhou added the concentration of PM2.5 in winter. However, in summer, the plentiful rainfall could efficiently remove PM2.5, and the highest wind speed and temperature in summer could increase the dispersion of fine particles as well. In spring, the windy weather was favorable for dispersion of PM2.5. In fall, the enhanced emission from biomass burning and relative lower wind speed mainly resulted in higher concentration of PM2.5.
Table 2. PM2.5 concentrations of four seasons in Wanzhou.
SeasonSample NumbersPM2.5 Concentration (μg·m−3)
MinMaxAverage
Winter14104.3483.8236.0 ± 104.5
Spring1029.7169.777.5 ± 48.0
Summer1441.798.773.4 ± 19.5
Fall1072.3188.9114.3 ± 35.4
Total4829.7483.8125.3 ± 76.1

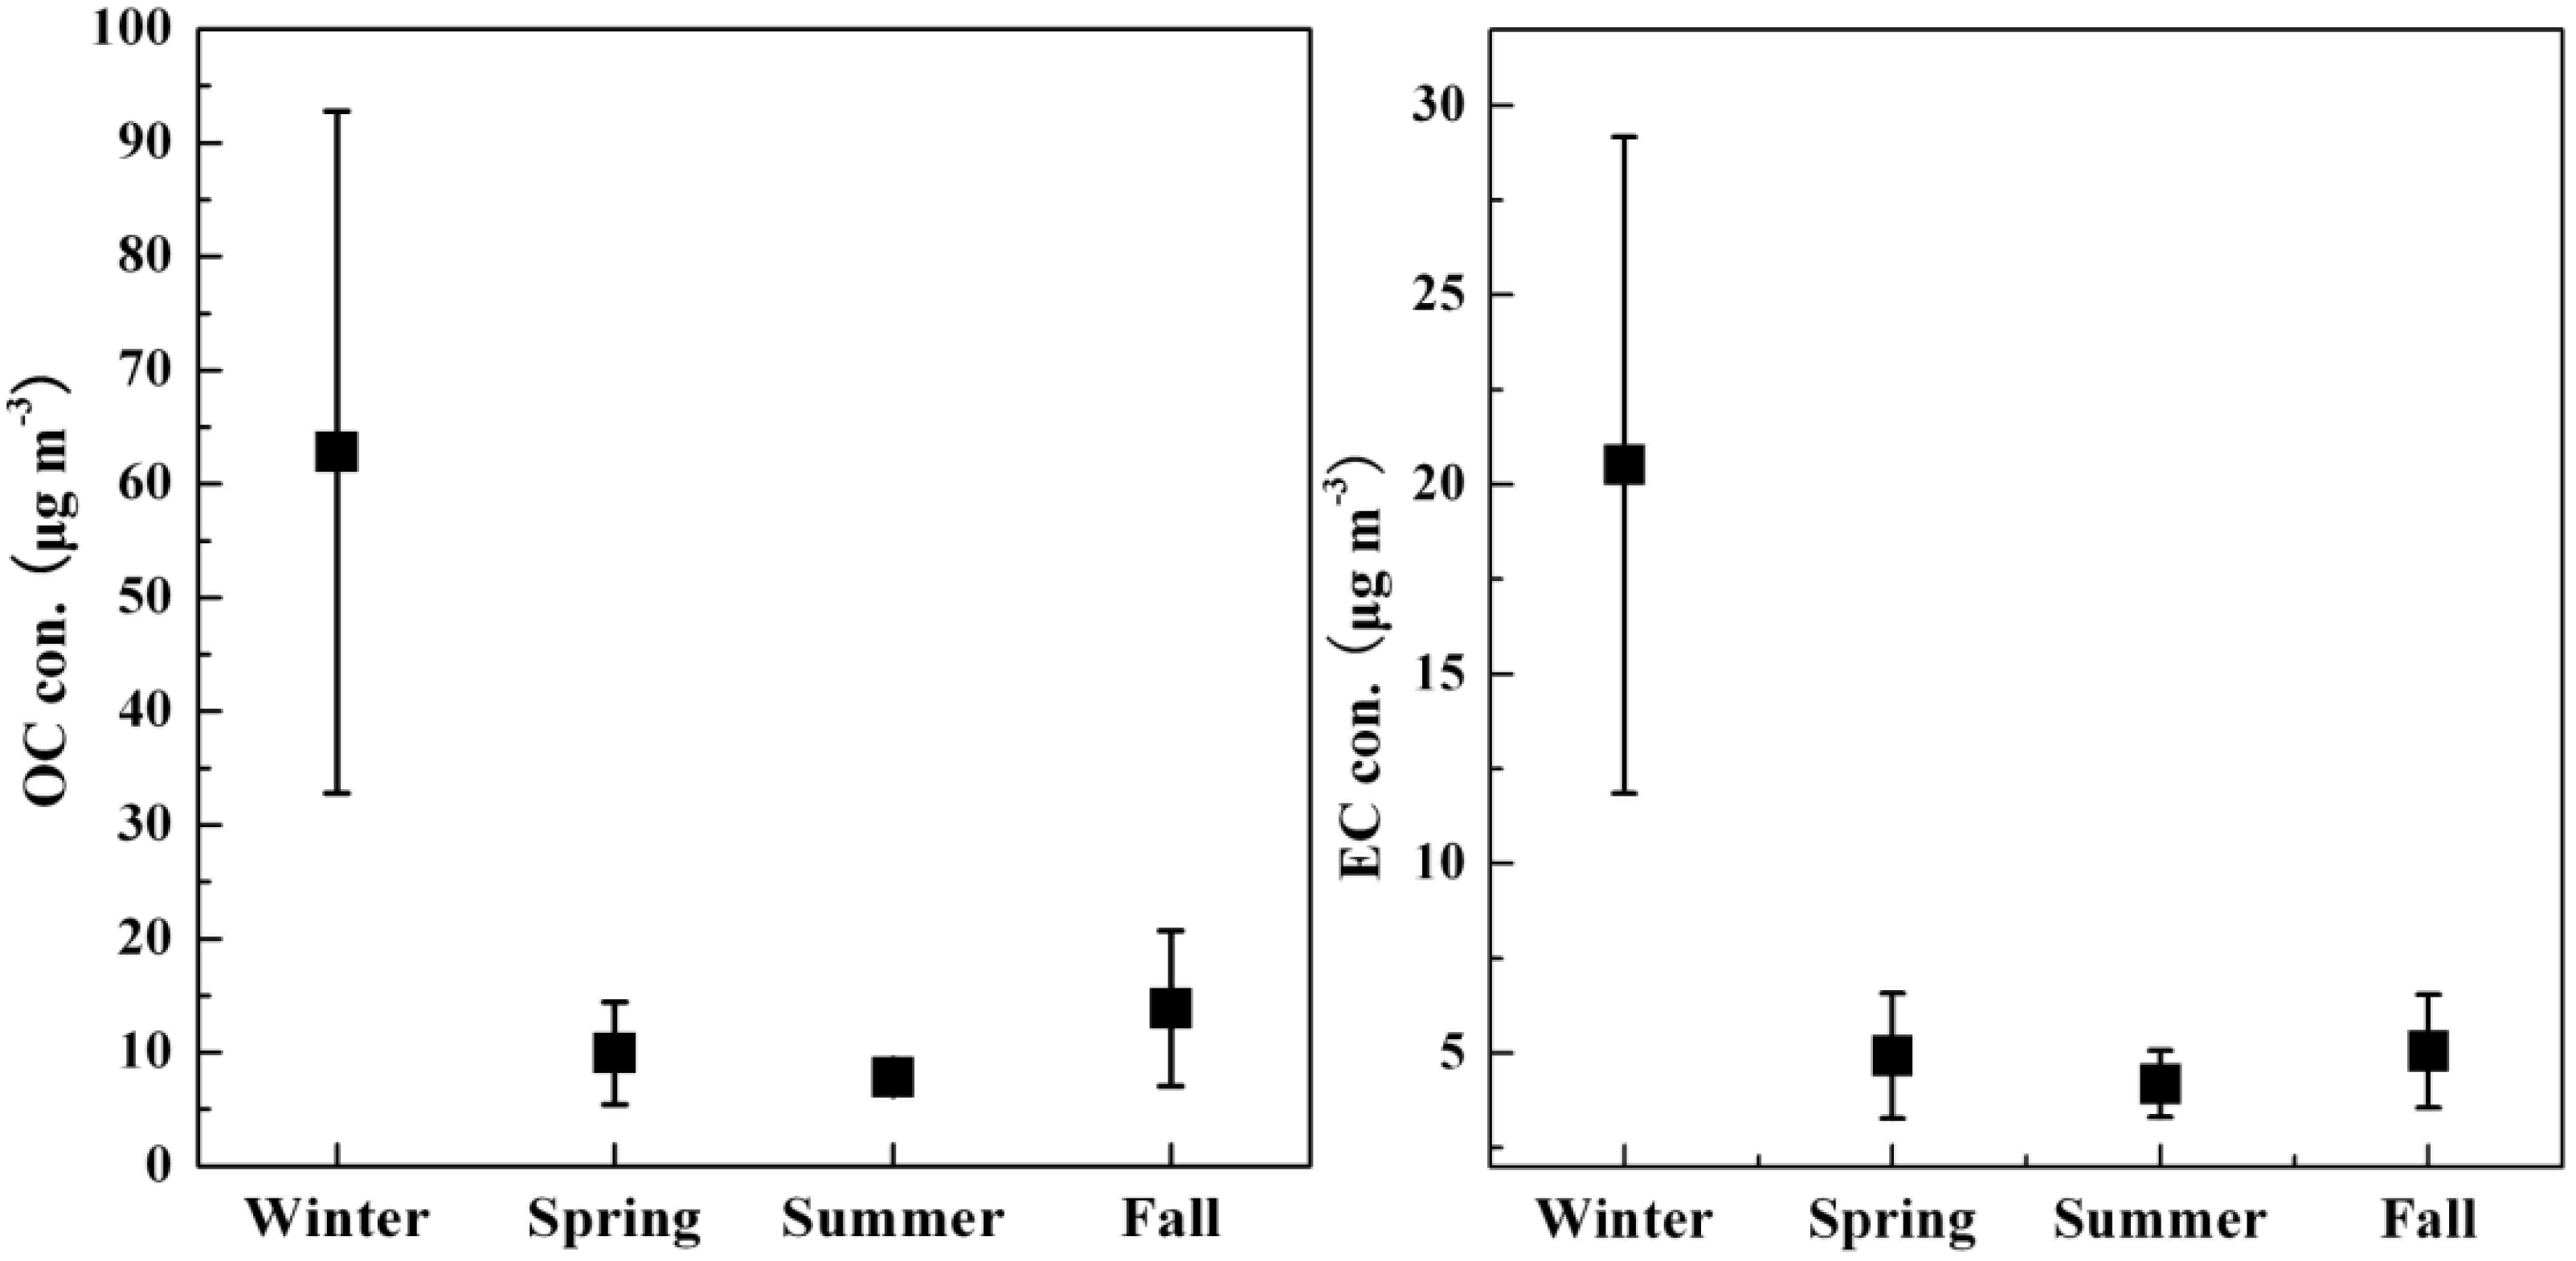
3.2. Concentrations and Seasonal Variations of OC, EC, and TC

As shown in Figure 2, the seasonal mean concentrations of OC were higher than those of EC, and both OC and EC had large fluctuation. The annual mean concentrations of OC and EC were 25.6 ± 29.2 μg·m−3 and 9.4 ± 8.6 μg·m−3 with their variation range from 5.2 to 131.1 and 2.1 to 41.6, respectively.
Figure 2. Average concentrations of organic carbon (OC) and elemental carbon (EC) in PM2.5 in Wanzhou.
Atmosphere 06 00534 g002
Seasonal variations of OC and EC concentrations were significant, with the descending order: winter > fall > spring > summer. The smallest concentrations of OC and EC both occurred in summer. The highest concentrations of carbonaceous species appeared in winter, and the mean OC and EC concentrations in winter were 6.9 times and 4.9 times as high as that in summer, respectively. In addition to the enhanced emissions from residential wood and coal combustion and unfavorable atmospheric dispersion as mentioned above, the smoke emitted from smolder of traditional bacon making was another important contributor. The concentrations of carbonaceous species in fall was higher than that in spring, this was ascribed to the contribution of biomass burning in fall.
OC, EC, and TC concentrations in this study were compared with those measured in other Chinese cities [19,20,21,22,23,24,25,26,27,28,29,30] in Table 3. In winter, the concentrations of carbonaceous species in PM2.5 in Wanzhou were much higher than that measured in other Chinese cities. In spring and summer, the OC concentrations in Wanzhou were lower than that in Beijing, Tianjin, Xiamen, and Zhengzhou. However, the EC concentrations were higher than those measured in Zhengzhou and Xiamen, but lower than those measured in Beijing and Tianjin. In fall, the OC concentration was lower than that in Beijing, Tianjin, Xi’an, Zhengzhou, and Xiamen. However, the EC concentration was lower than that in Beijing, Tianjin, Xi’an, and Zhengzhou, but lower than that in Xiamen. Therefore, several conclusions could be summarized: (1) In winter, the concentrations of carbonaceous species in PM2.5 in Wanzhou were at a much higher level; (2) In spring, summer, and fall, the OC concentrations in Wanzhou were at a lower level, and the EC concentrations of PM2.5 were at a moderate level; (3) For the full year, the carbonaceous species in PM2.5 in Wanzhou were at a higher level. However, this level in Wanzhou was lower than that measured in downtown Chongqing and Tongliang county of Chongqing.
Table 3. Comparison of TC (Total carbon), OC, and EC concentrations in PM2.5 in Wanzhou with those in other Chinese cities.
CityPeriodSite DescriptionOCECTCOC/ECReference
Wanzhou, ChongqingWinter 2013Urban commercial-residential-cultural62.820.583.33.0This study
Spring 20139.94.914.92.1This study
Summer 20137.94.212.91.6This study
Fall 201313.95.118.13.3This study
Year 201323.68.732.32.5This study
Downtown ChongqingMarch 2005~February 2006Urban residential30.16.436.54.7[19]
Tongliang, ChongqingMarch 2002~February 2003Urban commercial/residential30.8~42.69.70~12.240.5~54.73.2~3.5[20]
BeijingWinter, 24 September 1999~28 September 2000Urban kerbside31.511.142.62.8[21]
Spring, 24 September 1999~28 September 200018.26.724.92.7[21]
Summer, 24 September 1999~28 September 200013.46.319.72.1[21]
Fall, 24 September 1999~28 September 200028.810.239.02.8[21]
Year23.08.631.52.6[21]
TianjinWinter 2008Urban commercial-residential22.95.628.53.8[22]
Spring 200814.45.019.43.0[22]
Summer 200810.25.515.71.8[22]
Fall 200820.26.522.62.8[22]
Year16.95.721.62.9[22]
ZhengzhouSpring 2010Urban industrial15.43.018.45.1[23]
Summer 2010 10.01.811.85.6[23]
Fall 2010 18.75.424.13.5[23]
Winter 2010 27.14.731.85.8[23]
Year 2010 17.83.721.55.0[23]
XiamenSpring, April 2009Urban residential-traffic-commercial12.92.215.16.2[24]
Summer, July 2009 9.92.312.24.4[24]
Fall, October 2009 24.23.727.96.6[24]
Winter, January 2010 30.15.035.16.1[24]
Year 2009 19.33.322.65.8[24]
TaiyuanWinter, December 2005, January–February 2006Urban residential-traffic28.94.833.57.0[25]
Xi’anWinter 2003Urban residential61.912.374.25.1[26]
Fall 2003 34.111.345.43.3[26]
ShanghaiOctober 2005–February 2006Urban residential-traffic-commercial14.72.817.55.0[27]
GuangzhouJuly-November 2002Urban residential21.45.727.13.8[28]
NanjingFebruary–September 2001Urban core13.23.716.93.6[29]
Hong KongAugust 2004–March 2005Near city industrial12.03.415.43.5[30]

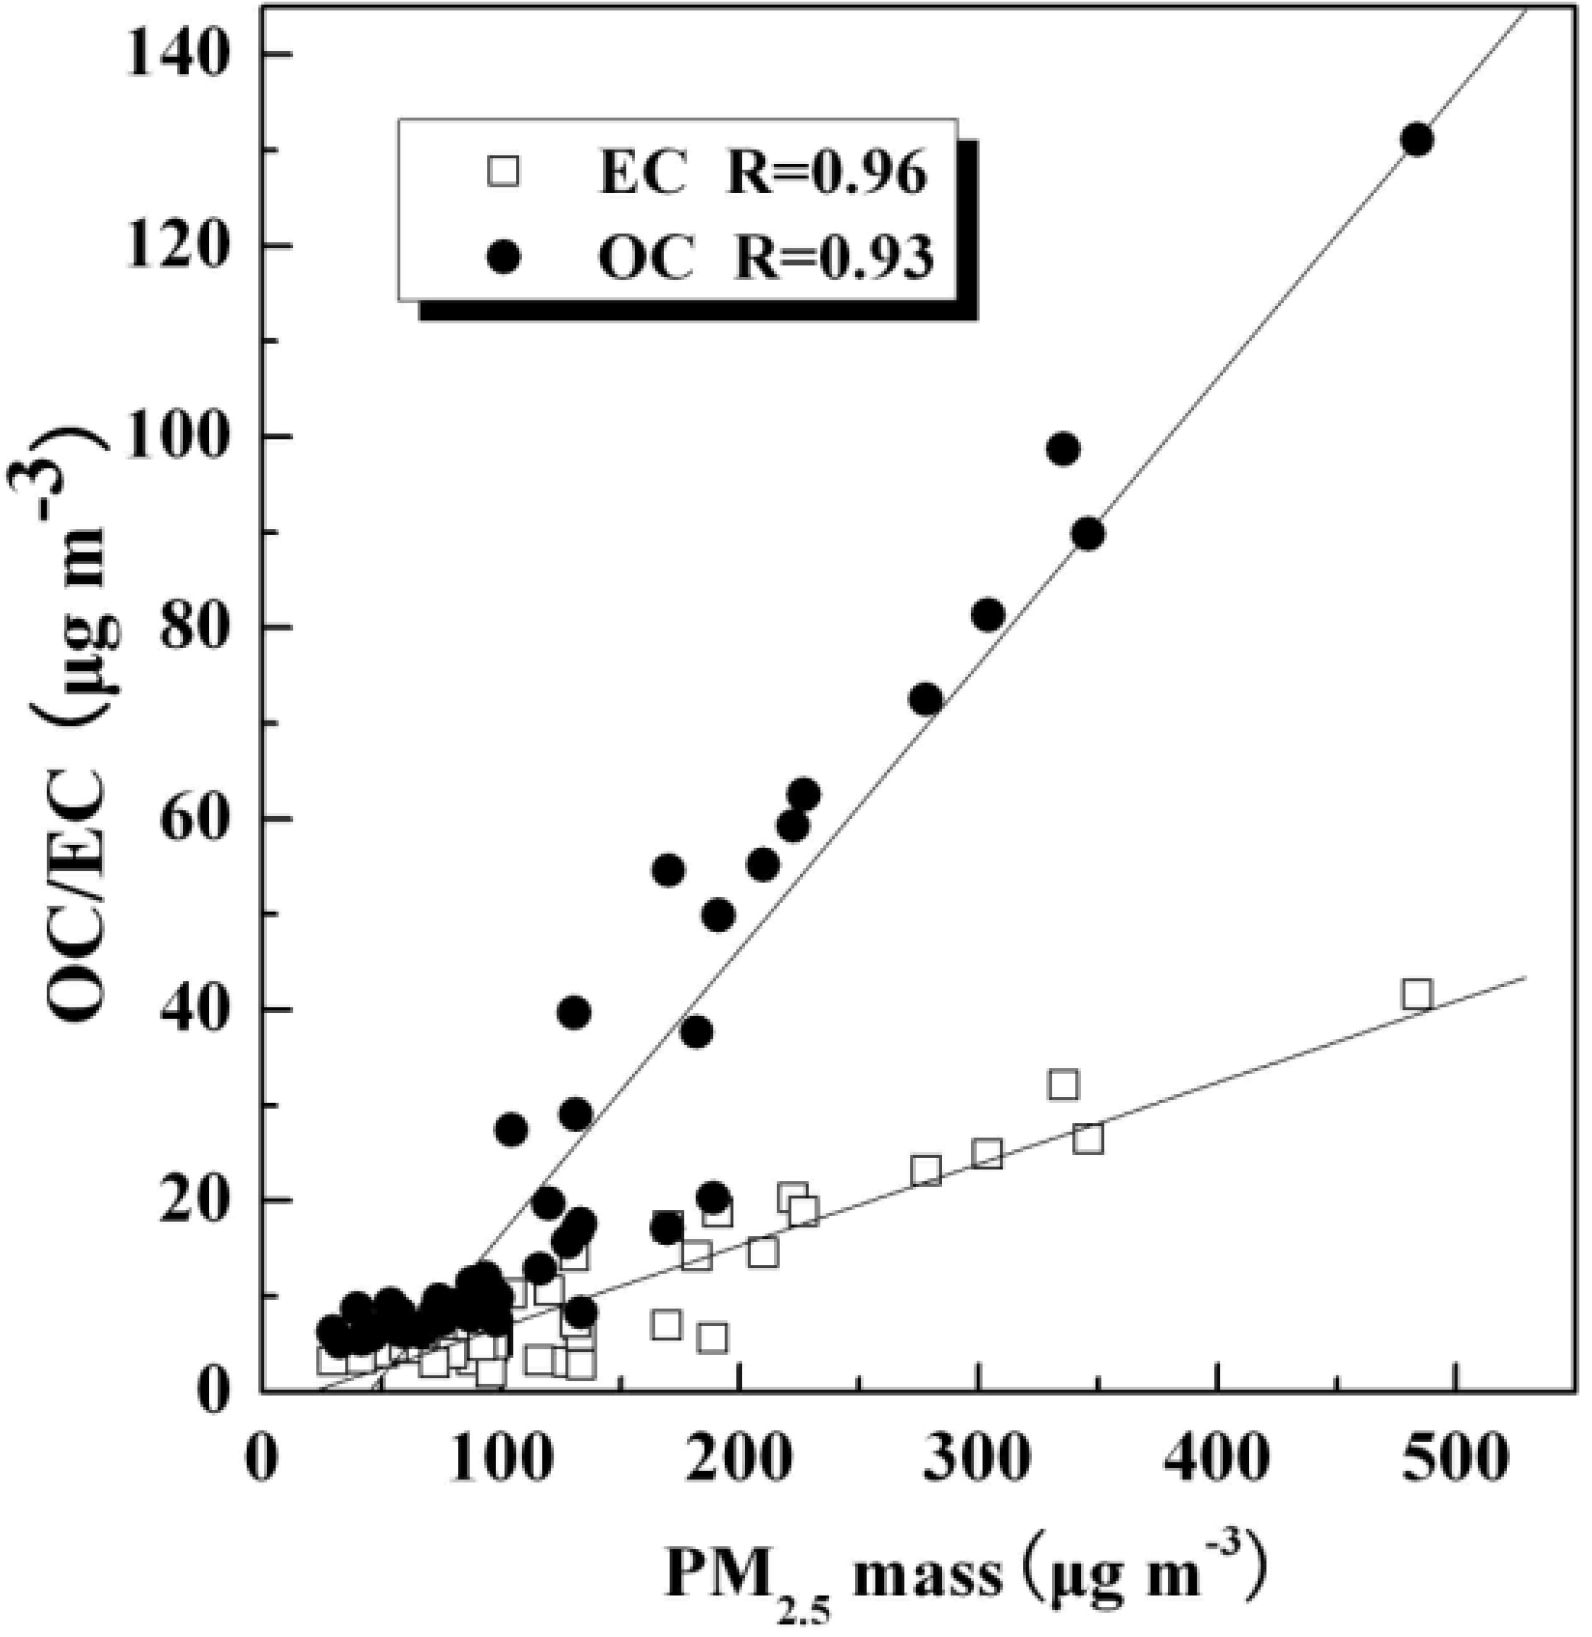
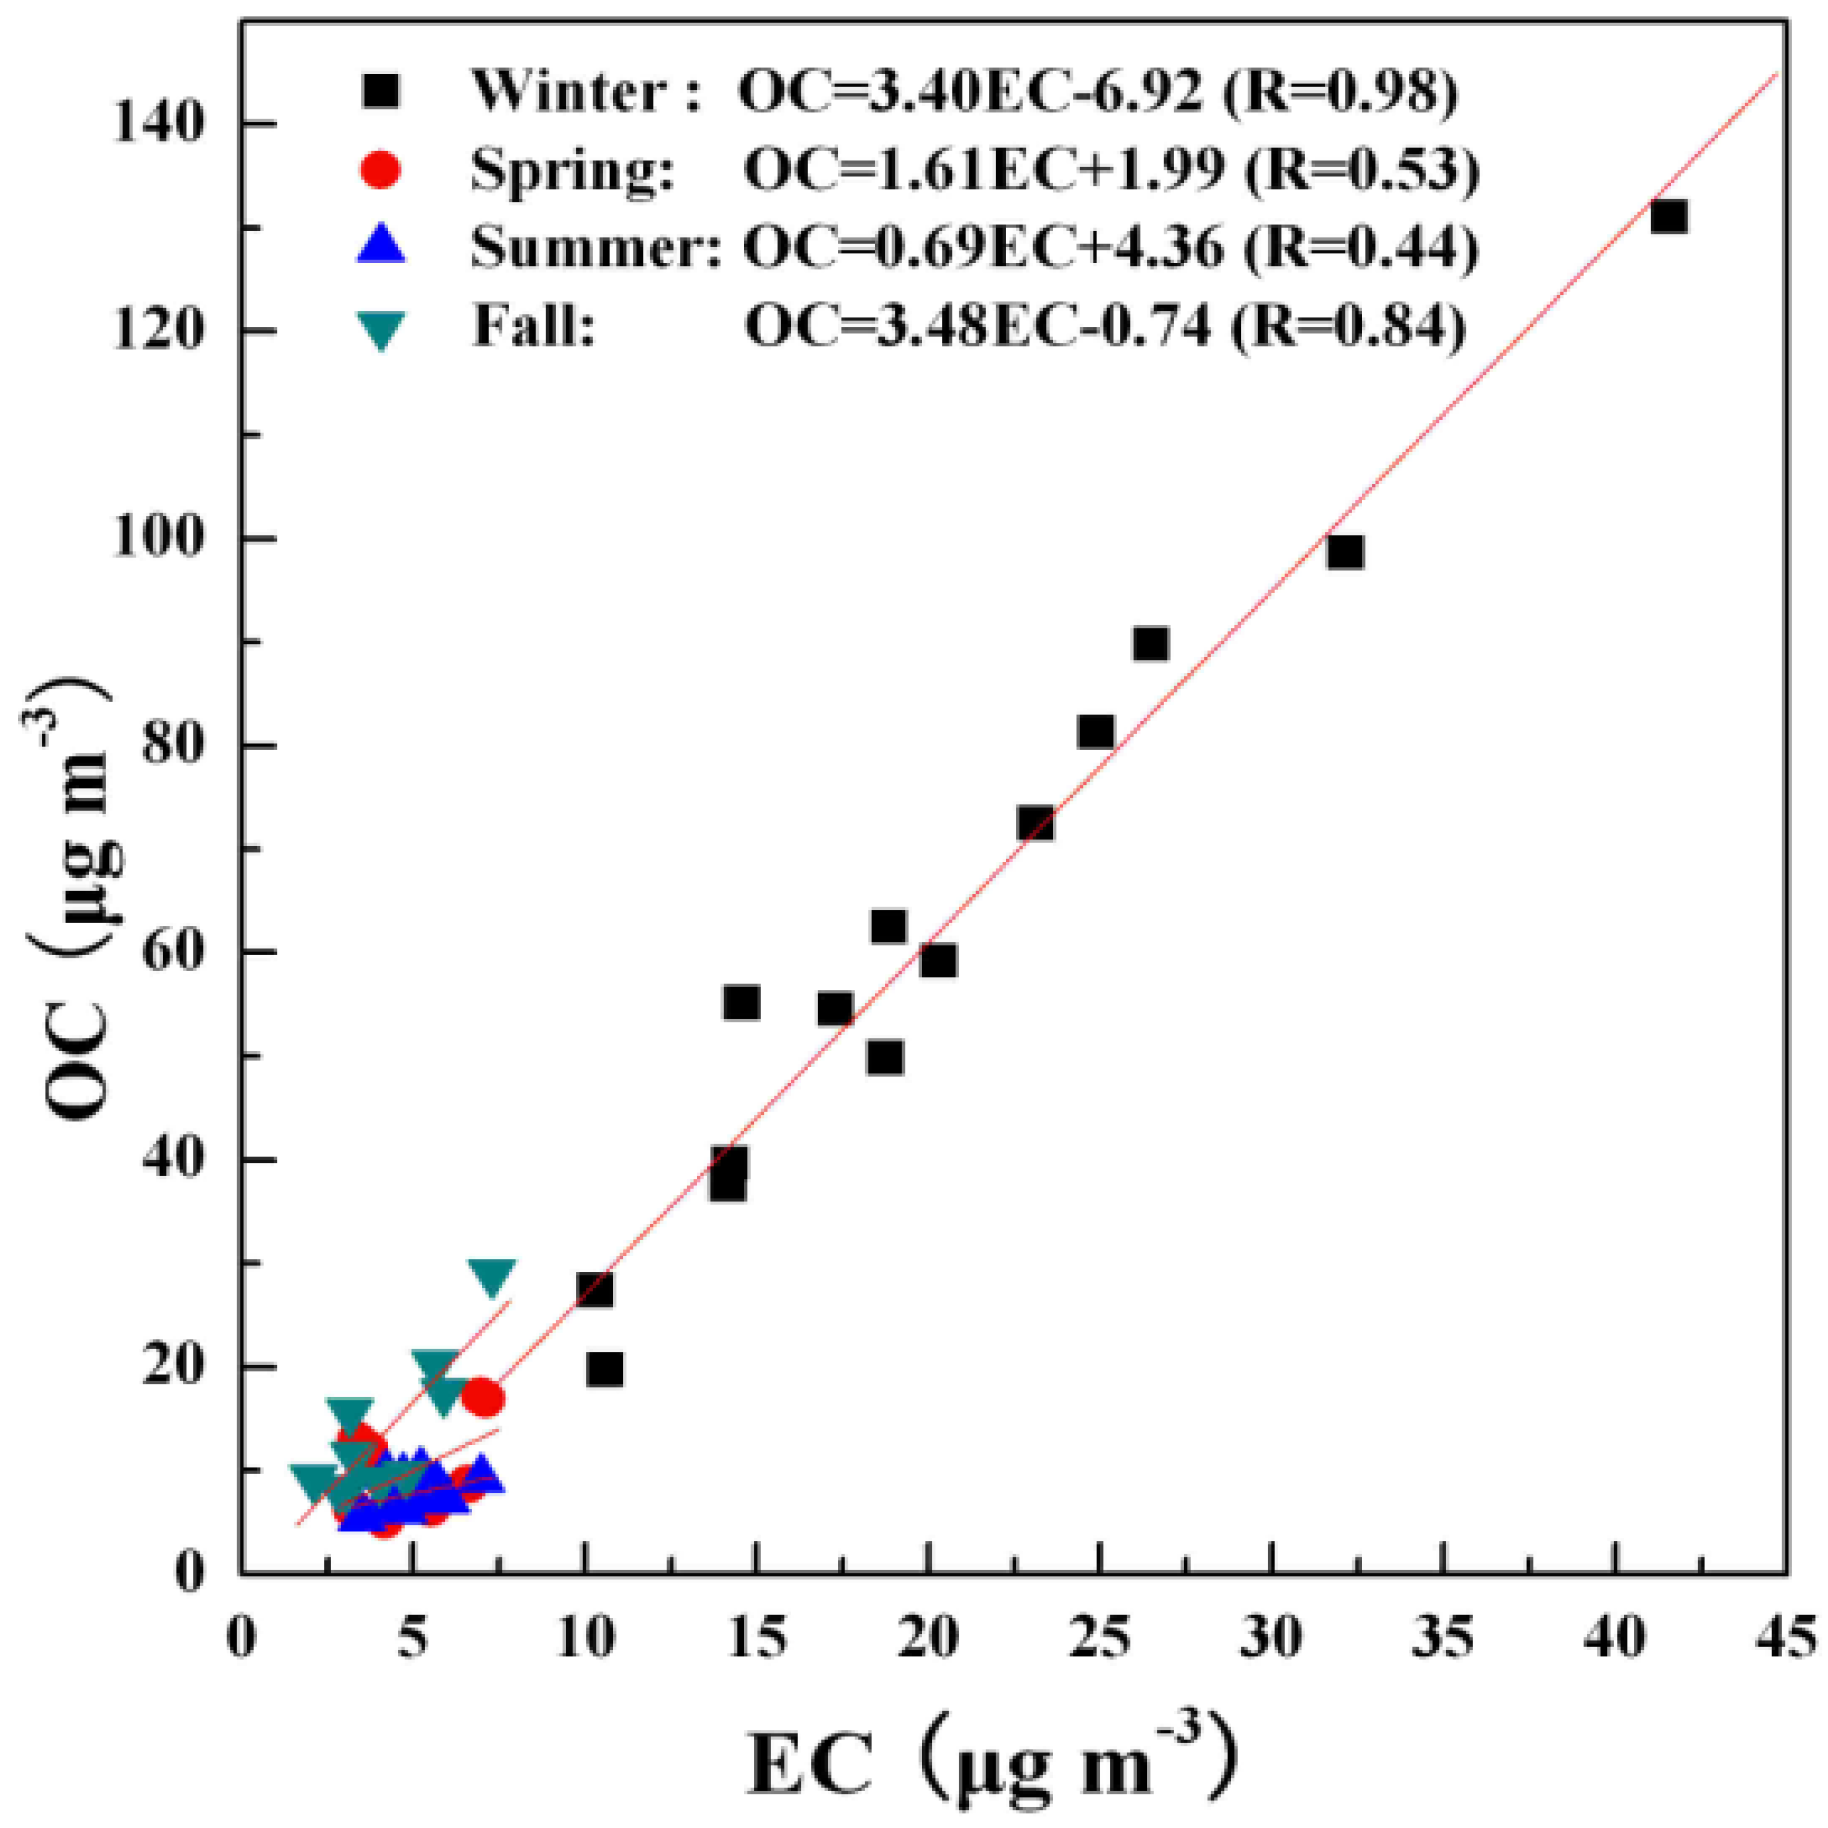
3.3. Relationship between OC and EC

Atmospheric EC is from the incomplete combustion of carbonaceous fuels directly. OC may be emitted as primary particles directly from sources, but secondary organics can also be formed in the atmosphere from the low vapor pressure products of atmospheric chemical reactions. Thus, OC/EC ratios can give some indication of the origins of carbonaceous PM2.5. As shown in Figure 3, strong OC-EC correlations (R > 0.8) in Wanzhou were observed for winter and fall, indicating that similar emission sources might contribute to atmospheric fine particles and SOA formation might be minor during these two seasons. Possibly, the residential wood and coal combustion, motor-vehicle exhaust, and meat smoking were responsible for that in winter, while the biomass burning and motor vehicle exhaust were responsible for that in fall. The correlations between OC and EC in spring and summer were relatively lower than that in winter and spring, indicating the presence of other sources, such as fugitive dust in spring. In summer, the lowest OC-EC correlation (0.44) was probably due mainly to the increased biogenic emission and the increased formation of SOA through photochemical activity.
OC/EC ratios provides a valuable tool to identify the secondary organic aerosol (SOA) formation [31]. As shown in Table 3, seasonal average OC/EC ratios in PM2.5 was 3.0 in winter, 2.1 in spring, 1.6 in summer, and 3.3 in fall, with an overall average of 2.5 during the study period. OC/EC ratios are influenced not only by secondary organic aerosol formation, but also by emission sources, and different OC/EC removal rates by deposition. The highest OC/EC ratio in fall was probably attributed to the higher contribution from biomass burning after harvest [30]. Higher OC/EC ratio was also observed in winter, several reasons can account for it. First, residential wood burning in winter increased the emission of volatile organic precursors, and more volatile secondary organic compounds may be condensed to form aerosol under low temperature condition. Sheehan et al. [32] found that a 10 °C decrease in temperature is estimated to increase SOA yields by 20%–50%. Second, foggy days which often occur in winter would enhance the formation of SOA, since droplet easily capture airborne pollution particles and adsorb gaseous pollutants [33]. Third, stagnated atmospheric conditions which often occur in winter would enhance the SOA formation. In summer, the effects of photochemical activity and biogenic emission during our sampling periods on the ratio of OC/EC might be shielded by the above reasons.
Figure 3. Seasonal correlations between OC and EC in PM2.5.
Atmosphere 06 00534 g003

3.4. Estimation of the SOC Concentration

Because there was no direct analytical technique for quantification of primary and secondary OC, OC/EC ratio method, which relies mainly on ambient measurements of OC and EC, received widespread application. This approach suggests that samples having the lowest OC/EC ratios contain almost exclusively primary carbonaceous compounds. So the concentration of SOC can be estimated from the following equation [34]:
OCsec = OCtot − EC × (OC/EC)min
where OCsec is the secondary OC (SOC), OCtot is the total OC (TOC), and (OC/EC)min is the minimum ratio observed. However, this method is not always valid. Since the ratios of OC/EC can be affected by meteorology, local sources and long-range transport of pollutants. According to 48-h backward air mass trajectories shown in Figure 4. On the highest and lowest OC/EC ratio days in each season, all the daily air flows arriving in Wanzhou originated from and passed through relatively cleaner areas. So it is reasonable to consider that the sources are local, the impact by long-range transport is minor, and the lowest value of OC/EC can represent that of the primary sources. In addition, considering seasonal variations in meteorology and emissions, the (OC/EC)min observed for each season was used in calculation: the values were 1.9 in winter, 2.0 in spring, 1.2 in summer and fall.
Figure 4. Forty-eight-hour backward air mass trajectories for the highest (bold) and lowest (thin) OC/EC ratio days in winter (red), spring (yellow), summer (blue), and fall (green).
Atmosphere 06 00534 g004
Based on the above equation, the average concentrations of SOC in PM2.5 were calculated and shown in Table 4. The seasonal average concentrations of SOC in Wanzhou were 24.6 ± 14.5, 4.2 ± 3.9, 1.7 ± 1.3, and 5.4 ± 4.4 μg·m−3 in winter, spring, summer, and fall, which accounted for 38.9%, 34.3%, 20.8%, and 35.0% of OC, respectively. It illuminated that SOC was an important component of OC mass in Wanzhou, presenting a significant trend of secondary transformation. High SOC/OC ratios in winter were mainly due to the increased emission of volatile organic precursors and the adsorption and condensation of semi-volatile organic compounds onto existing solid particles under low temperature conditions, as well as enhanced SOC formation under the stagnated atmospheric condition. A similar seasonal variation trend was also reported in Beijing [21], Guangzhou [28], Xiamen [24], and Hong Kong [30].
Table 4. Average concentrations of secondary organic carbon (SOC), total carbonaceous aerosol (TCA), secondary organic aerosol (SOA) and their ratios in Wanzhou.
SeasonSOC (μg·m−3)SOC/OC (%)TCA a (μg·m−3)TCA/PM2.5 (%)SOA b (μg·m−3)SOA/PM2.5 (%)OC/PM2.5 (%)EC/PM2.5 (%)
Winter24.6 ± 14.538.9 ± 6.5121.0 ± 56.550.9 ± 6.739.4 ± 23.215.7 ± 5.626.3 ± 3.88.9 ± 1.1
Spring4.2 ± 3.934.3 ± 24.826.4 ± 12.323.1 ± 7.46.6 ± 6.27.4 ± 4.914.3 ± 4.18.3 ± 4.4
Summer1.7 ± 1.320.8 ± 13.117.6 ± 2.725.1 ± 6.02.8 ± 2.13.8 ± 2..611.2 ± 2.67.3 ± 2.1
Fall5.4 ± 4.435.0 ± 18.920.8 ± 8.131.2 ± 10.48.6 ± 7.17.0 ± 5.112.1 ± 4.13.8 ± 1.3
Year9.0 ± 10.532.3 ± 7.946.5 ± 49.832.6 ± 12.714.4 ± 16.98.5 ± 5.116.0 ± 7.07.1 ± 2.3
Values are represented as average ± standard deviation; a TCA: total carbonaceous aerosol (TCA = 1.6 × OC + EC) [35]; b SOA: secondary organic aerosol (SOA = 1.6 × SOC) [35].

3.5. OC, EC and TCA Contributions to PM2.5

As shown in Table 4, the percentages of OC and EC to PM2.5 mass accounted for 26.3% and 8.9% for winter, 14.3% and 8.3% for spring, 11.2% and 7.3% for summer, 12.1% and 3.8% for fall, respectively. The relative abundances of OC and EC in winter should be one of the major factors causing visibility impairment in winter in Wanzhou. Figure 5 shows the relationship between OC/EC and PM2.5 mass concentrations. OC was highly correlated with PM2.5 (r = 0.96) and EC was moderately correlated with PM2.5 (r = 0.87), suggesting that OC, EC, and PM2.5 shared major sources.
Figure 5. Relationships between OC/EC and PM2.5 mass concentrations.
Atmosphere 06 00534 g005
The total carbonaceous aerosol (TCA) was calculated by the sum of organic matter and elemental carbon (TCA = 1.6 × OC + EC). The annual average concentrations of TCA in Wanzhou were 121.0 ± 56.5, 26.4 ± 12.3, 17.6 ± 2.7, and 20.8 ± 8.1 μg·m−3 in winter, spring, summer, and fall, which accounted for 50.9%, 23.1%, 25.1%, and 31.2% of PM2.5 mass, respectively, implying that TCA contributed a major fraction of PM2.5 mass in Wanzhou. The annual average concentrations of estimated SOA in Wanzhou was 14.4 μg·m−3, accounting for 11.5% of PM2.5 mass, which indicated that SOA contributed a relatively minor fraction of PM2.5 mass in Wanzhou.

4. Conclusions

In this study, the mass concentration and carbonaceous species of PM2.5 collected in Wanzhou in southwest China were investigated in 2013. The average mass concentrations of PM2.5 were 236.0 ± 104.5, 77.5 ± 48.0, 73.4 ± 19.5, and 114.3 ± 35.4 μg·m−3, in winter, spring, summer and fall, respectively, indicating the serious situation of fine particle pollution in Wanzhou. The concentrations for OC and EC were 23.6 and 8.7 μg·m−3 in Wanzhou. By comparison with other cities in China, the carbonaceous species in PM2.5 in Wanzhou were at a higher level. TCA contributed a major fraction (32.6%) of PM2.5 mass. On seasonal average, the OC and EC concentrations ranked in the order of winter > fall > spring > summer, which was mainly associated with meteorological conditions and local emissions. In winter, strong OC-EC correlations suggested the contributions of similar sources, which mainly included residential wood and coal combustion, motor-vehicle exhaust, and meat smoking. The low OC-EC correlation in summer was mainly due to the increased biogenic emission and the increased formation of SOA through photochemical activity. High OC/EC ratio in winter resulted from condensation of volatile secondary organic compounds at low temperature condition and enhanced formation of SOA in frequent foggy days and stagnated atmospheric condition. Based on the minimum OC/EC ratio, SOC concentrations were estimated to be 24.6 ± 14.5, 4.2 ± 3.9, 1.7 ± 1.3, and 5.4 ± 4.4 μg·m−3 in winter, spring, summer, and fall, accounting for 38.9%, 34.3%, 20.8%, and 35.0% of the total OC, respectively. The low average ratios of SOA/PM2.5 (3.8%–15.7%) indicated that SOA was a minor fraction in fine particles of Wanzhou.

Acknowledgements

This work was funded by the National Natural Science Foundation of China (NSFC) project (Grant No. 41375123), and the Science and Technology Commission of Chongqing project (cstc2014yykfC20003) and Wanzhou project (Grant No. 201303049).

Author Contributions

Chuan Fu and Fumo Yang supervised the research. Liuyi Zhang wrote the majority of the manuscript and performed much of the data analysis. Yimin Huang performed the carbonaceous species analysis and quality control. Yuan Liu and Guoxin Lan contributed valuable scientific insights, ideas, and discussion. Jun Wang worked on sample collection.

Conflicts of Interest

The authors declare no conflict of interest.

References

  1. Zhang, M.; Ma, Y.Y.; Gong, W.; Zhu, Z.G. Aerosol optical properties of a haze episode in Wuhan based on ground-based and satellite observations. Atmosphere 2014, 5, 699–719. [Google Scholar] [CrossRef]
  2. Yang, F.; He, K.; Ma, Y.; Zhang, Q.; Cadle, S.H.; Chan, T.; Mulawa, P.A. Characterization of carbonaceous species of ambient PM2.5 in Beijing, China. J. Air Waste Manage. Assoc. 2005, 77, 984–992. [Google Scholar] [CrossRef]
  3. Yang, F.; Huang, L.; Duan, F.; Zhang, W.; He, K.; Ma, Y.; Brook, J.R.; Tan, J.; Zhao, Q.; Cheng, Y.; et al. Carbonaceous species in PM2.5 at a pair of rural/urban sites in Beijing, 2005–2008. Atmos. Chem. Phys. 2011, 11, 7893–7903. [Google Scholar] [CrossRef]
  4. Bond, T.C.; Streets, D.G.; Yarber, K.F.; Nelson, S.M.; Woo, J.H.; Klimont, Z. A technology-based global inventory of black and organic carbon emissions from combustion. J. Geophys. Res. 2004, 109, D14203. [Google Scholar] [CrossRef]
  5. Jacobson, M.Z. Control of fossil-fuel particulate black carbon and organic matter, possibly the most effective method of slowing global warming. J. Geophys. Res. 2002. [Google Scholar] [CrossRef]
  6. Ramanathan, V.; Carmichael, G. Global and regional climate changes due to black carbon. Nat. Geosci. 2008, 1, 221–227. [Google Scholar] [CrossRef]
  7. Menon, S.; Hansen, J.; Nazarenko, L.; Luo, Y.F. Climate effects of black carbon aerosols in China and India. Science 2002, 297, 2250–2253. [Google Scholar] [CrossRef] [PubMed]
  8. Chameides, W.L.; Yu, H.; Liu, S.C.; Bergin, M.; Zhou, X.; Mearns, L.; Wang, G.; Kiang, C.S.; Saylor, R.D.; Luo, C.; et al. Case study of the effects of atmospheric aerosols and regional haze on agriculture: An opportunity to enhance crop yields in China through emission controls? Proc. Natl. Acad. Sci. USA 1999, 96, 13626–13633. [Google Scholar] [CrossRef] [PubMed]
  9. Duan, F.; He, K.; Ma, Y.; Jia, Y.T.; Yang, F.M.; Lei, Y.; Tanaka, S.; Okuta, T. Characteristics of carbonaceous aerosols in Beijing, China. Chemosphere 2005, 60, 355–364. [Google Scholar] [CrossRef] [PubMed]
  10. Xiao, G.; Wang, Z.; Chen, J.; Qiu, Z.; Li, Y.; Qi, J.; Liu, W.; Shu, W. Occurrence and infection risk of waterborne pathogens in Wanzhou watershed of the Three Gorges Reservoir, China. J. Environ. Sci. 2013, 25, 1913–1924. [Google Scholar] [CrossRef]
  11. Xiao, G.S.; Qiu, Z.Q.; Qi, J.S.; Chen, J.A.; Liu, F.D.; Liu, W.Y.; Luo, J.H.; Shu, W.Q. Occurrence and potential health risk of Cryptosporidium and Giardia in the Three Gorges Reservoir, China. Water Res. 2013, 47, 2431–2445. [Google Scholar] [CrossRef] [PubMed]
  12. Fu, C.; Guo, J.S.; Pan, J.; Qi, J.S.; Zhou, W.S. Potential ecological risk assessment of heavy metal pollution in sediments of the Yangtze River within the Wanzhou Section, China. Biol. Trace Elem. Res. 2009, 129, 270–277. [Google Scholar] [CrossRef] [PubMed]
  13. Lin, J.; Fu, C.; Zhang, X.; Xie, K.; Yu, Z. Heavy metal contamination in the water-level fluctuating zone of the Yangtze River within Wanzhou Section, China. Biol. Trace Elem. Res. 2012, 145, 268–272. [Google Scholar] [CrossRef] [PubMed]
  14. Determination of Atmospheric Particles PM10 and PM2.5 in Ambient Air by Gravimetric Method. Available online: http://kjs.mep.gov.cn/hjbhbz/bzwb/dqhjbh/jcgfffbz/201109/W020120130460791166784.pdf (accessed on 8 April 2015). (In Chinese).
  15. Chi, X.G.; Di, Y.A.; Dong, S.P.; Liu, X.D. Determination of organic carbon and elemental carbon in atmospheric aerosol samples. Environ. Monit. China 1999, 15, 11–13. (In Chinese) [Google Scholar]
  16. Watson, J.G.; Chow, J.C.; Antony Chen, L.W. Summary of organic and elemental carbon/black carbon analysis methods and intercomparisons. Aerosol Air Qual. Res. 2005, 5, 65–102. [Google Scholar]
  17. Duan, F.K.; He, K.B.; Ma, Y.L.; Yang, F.M.; Yu, X.C.; Cadle, S.H.; Chan, T.; Mulawa, P.A. Concentration and chemical characteristics of PM2.5 in Beijing, China: 2001–2002. Sci. Total Environ. 2006, 355, 264–275. [Google Scholar] [CrossRef] [PubMed]
  18. Feng, Y.C.; Xue, Y.H.; Chen, X.H.; Wu, J.H.; Zhu, T.; Bai, Z.P.; Fu, S.T.; Gu, C.J. Source apportionment of ambient total suspended particulates and coarse particulate matter in urban areas of Jiaozuo, China. J. Air Waste Manag. Assoc. 2007, 57, 561–575. [Google Scholar] [CrossRef] [PubMed]
  19. Yang, F.; Tan, J.; Zhao, Q.; Du, Z.; He, K.; Ma, Y.; Duan, F.; Chen, G.; Zhao, Q. Characteristics of PM2.5 speciation in representative megacities and across China. Atmo. Chem. Phys. 2011, 11, 5207–5219. [Google Scholar] [CrossRef]
  20. Chow, J.C.; Watson, J.G.; Chen, L.A.; Ho, S.S.H.; Koracin, D.; Zielinska, B.; Tang, D.L.; Perera, F.; Cao, J.J.; Lee, S.C.; et al. Exposure to PM2.5 and PAHs from the Tong Liang, China epidemiological study. J. Environ. Sci. Health Part A 2006, 41, 517–542. [Google Scholar] [CrossRef]
  21. He, K.B.; Yang, F.M.; Ma, Y.L.; Zhang, Q.; Yao, X.H.; Chan, C.K.; Cadle, S.; Chan, T.; Mulawa, P. The characteristics of PM2.5 in Beijing, China. Atmos. Environ. 2001, 35, 4959–4970. [Google Scholar] [CrossRef]
  22. Gu, J.X.; Bai, Z.P.; Liu, A.X.; Wu, L.P.; Xie, Y.Y.; Li, W.F.; Dong, H.Y.; Zhang, X. Characterization of Atmospheric organic carbon and element carbon of PM2.5 and PM10 at Tianjin, China. Aerosol Air Qual. Res. 2010, 10, 167–176. [Google Scholar]
  23. Geng, N.B.; Wang, J.; Xu, Y.F.; Zhang, W.D.; Chen, C.; Zhang, R.Q. PM2.5 in an industrial district of Zhengzhou, China: Chemical composition and source apportionment. Particuology 2013, 11, 99–109. [Google Scholar] [CrossRef]
  24. Zhang, F.W.; Zhao, J.P.; Chen, J.S.; Xu, Y.; Xu, L.L. Pollution characteristics of organic and elemental carbon in PM2.5 in Xiamen, China. J. Environ. Sci. 2011, 23, 1342–1349. [Google Scholar] [CrossRef]
  25. Meng, Z.Y.; Jiang, X.M.; Yan, P.; Lin, W.L.; Zhang, H.D.; Wang, Y. Characteristics and sources of PM2.5 and carbonaceous species during winter in taiyuan, China. Atmos. Environ. 2007, 41, 6901–6908. [Google Scholar] [CrossRef]
  26. Cao, J.J.; Wu, F.; Chow, J.C.; Lee, S.C.; Li, Y.; Chen, S.W.; An, Z.S.; Fung, K.K.; Watson, J.G.; Zhu, C.S.; et al. Characterization and source apportionment of atmospheric organic and elemental carbon during fall and winter of 2003 in Xi’an, China. Atmos. Chem. Phys. 2005, 5, 3127–3137. [Google Scholar] [CrossRef]
  27. Feng, Y.L.; Chen, Y.J.; Guo, H.; Zhi, G.R.; Xiong, S.C.; Li, J.; Sheng, G.Y.; Fu, J.M. Characteristics of organic and elemental carbon in PM2.5 samples in Shanghai, China. Atmos. Res. 2009, 92, 434–442. [Google Scholar] [CrossRef]
  28. Feng, J.L.; Hu, M.; Chan, C.K.; Lau, P.S.; Fang, M.; He, L.Y.; Tang, X.Y. A comparative study of the organic matter in PM2.5 from three Chinese megacities in three different climatic zones. Atmos. Environ. 2006, 40, 3983–3994. [Google Scholar] [CrossRef]
  29. Yang, H.; Yu, J.Z.; Ho, S.S.H.; Xu, J.H.; Wu, W.S.; Wan, C.H.; Wang, X.D.; Wang, X.R.; Wang, L.S. The chemical composition of inorganic and carbonaceous materials in PM2.5 in Ningjing, China. Atmos. Environ. 2005, 39, 3735–3749. [Google Scholar] [CrossRef]
  30. Duan, J.C.; Tan, J.H.; Cheng, D.X.; Bi, X.H.; Deng, W.J.; Sheng, G.Y.; Fu, J.M.; Wong, M.H. Sources and characteristics of carbonaceous aerosol in two largest cities in Pearl River Delta Region, China. Atmos. Environ. 2007, 41, 2895–2903. [Google Scholar] [CrossRef]
  31. Tao, J.; Cheng, T.T.; Zhang, R.J.; Cao, J.J.; Zhu, L.H.; Wang, Q.Y.; Luo, L.; Zhang, L.M. Chemical composition of PM2.5 at an urban site of Chengdu in southwestern China. Adv. Atmos. Sci. 2013, 30, 1070–1084. [Google Scholar] [CrossRef]
  32. Sheehan, P.E.; Bowman, F.M. Estimated effects of temperature on secondary organic aerosol concentrations. Environ. Sci. Technol. 2001, 35, 2129–2135. [Google Scholar] [CrossRef] [PubMed]
  33. Blando, J.D.; Turpin, B.J. Secondary organic aerosol formation in cloud and fog droplets: A literature evaluation of plausibility. Atmos. Environ. 2000, 34, 1623–1632. [Google Scholar] [CrossRef]
  34. Castro, L.M.; Pio, C.A.; Harrison, R.M.; Smith, D.J.T. Carbonaceous Aerosol in Urban and Rural European Atmospheres: Estimation of Secondary Organic Carbon Concentrations. Atmos. Environ. 1999, 33, 2771–2781. [Google Scholar] [CrossRef]
  35. Turpin, B.J.; Lim, H.J. Species contributions to PM2.5 mass concentrations: Revisiting common assumptions for estimating organic mass. Aerosol Sci. Technol. 2001, 35, 602–610. [Google Scholar] [CrossRef]

