Article

Atmospheric Deposition History of Trace Metals and Metalloids for the Last 200 Years Recorded by Three Peat Cores in Great Hinggan Mountain, Northeast China

1
State Key Laboratory of Lake Science and Environment, Nanjing Institute of Geography and Limnology, Chinese Academy of Sciences, Nanjing 210008, China
2
Key Laboratory of Wetland Ecology and Environment, Northeast Institute of Geography and Agroecology, Chinese Academy of Sciences, Changchun 130102, China
3
Université de Toulouse, INP, UPS, EcoLab (Laboratoire Ecologie Fonctionnelle et Environnement), ENSAT, Avenue de l'Agrobiopole, 31326 Castanet Tolosan, France
4
CNRS, EcoLab, 31326 Castanet Tolosan, France
*
Author to whom correspondence should be addressed.
Atmosphere 2015, 6(3), 380-409; https://doi.org/10.3390/atmos6030380
Submission received: 15 January 2015 / Accepted: 6 March 2015 / Published: 18 March 2015

Abstract

:
A large number of studies on trace metals and metalloids (TMs) accumulations in peatlands have been reported in Europe and North America. Comparatively little information is available on peat chronological records of atmospheric TMs flux in China. Therefore, the objective of our study was to determine the concentrations and accumulation rates (ARs) of TMs in Motianling peatland from Great Hinggan Mountain, northeast China, and to assess these in relation to establish a historical profile of atmospheric metal emissions from anthropogenic sources. To meet these aims we analyzed 14 TMs (As, Ba, Cd, Co, Cr, Cu, Mo, Ni, Pb, Sr, Sb, Tl, and Zn) and Pb isotopes (206Pb, 207Pb, 208Pb) using ICP-AES and ICP-MS, respectively, in three peat sections dated by 210Pb and 137Cs techniques (approximately spanning the last 200 years). There is a general agreement in the elemental concentration profiles which suggests that all investigated elements were conserved in the Motianling bog. Three principal components were discriminated by principal component analysis (PCA) based on Eigen-values >1 and explaining 85% of the total variance of element concentrations: the first component representing Ba, Co, Cr, Mo, Ni, Sr and Tl reflected the lithogenic source; the second component covering As, Cu and Sb, and Cd is associated with an anthropogenic source from ore mining and processing; the third component (Pb isotope, Pb and Zn) is affected by anthropogenic Pb pollution from industrial manufacturing and fossil-fuel combustion. The pre-industrial background of typical pollution elements was estimated as the average concentrations of TMs in peat samples prior to 1830 AD and with a 207Pb/206Pb ratio close to 1.9. ARs and enrichment factors (EFs) of TMs suggested enhanced metal concentrations near the surface of the peatland (in peat layers dated from the 1980s) linked to an increasing trend since the 2000s. This pollution pattern is also fingerprinted by the Pb isotopic composition, even after the ban of leaded gasoline use in China. Emissions from coal and leaded gasoline combustions in northern China are regarded as one of the major sources of anthropogenic Pb input in this region; meanwhile, the long-distance transportation of Pb-bearing aerosols from Mongolia should be also taken into consideration. The reconstructed history of TMs’ pollution over the past ca. 200 years is in agreement with the industrial development in China and clearly illustrates the influence of human activities on local rural environments. This study shows the utility of taking multi-cores to show the heterogeneity in peat accumulation and applying PCA, EF and Pb isotope methods in multi-proxies analyses for establishing a high resolution geochemical metal record from peatland.

Graphical Abstract

1. Introduction

Trace metals and metalloids (referred to here as TMs) have been emitted by human activities and dispersed into the environment since the beginning of metallurgy [1]. They usually have many adverse impacts on environmental and human health because of their toxic, persistent and bio-accumulative nature. In addition to the natural sources including volcanic activity, soil erosion, and biologically driven reduction processes in the ocean, anthropogenic sources are the major contributions to abundance of TMs in the environment and principally include fossil-fuel combustion, industrial manufacturing, ore mining and processing, and incineration of urban, medical and industrial wastes [2]. Human activities have been shown to increase local, regional and global fluxes of TMs to the atmosphere, and anthropogenic TMs’ fluxes clearly exceed the prehistoric levels of atmospheric deposition. As a result, governments around the world have negotiated a global legally binding instrument to control TM emissions from human activities, such as the Protocol on Long-range Transboundary Air Pollution of Heavy Metals for the United Nation (UN)/Economic Commission for Europe (ECE) [3]. A considerable percentage of TMs released to the atmosphere is often carried by long range transport, deposited by precipitation or as aerosols, and stored in and between aquatic and terrestrial ecosystems in remote areas. Long term records to quantify accumulation of TMs in natural geological archives are helpful to differentiate and document the temporal trends of natural versus anthropogenic TMs [4,5,6,7,8]. The magnitude and history of changes in past metal deposition have been studied in a variety of environmental records in the Northern Hemisphere, such as ice core [9], lake sediment [10,11] and ombrotrophic peat [12,13].
Ombrotrophic peatlands are hydraulically isolated, and receive all their chemical constituents via direct deposition from atmosphere or via uptake from the atmosphere by vegetation [14]. As a result, records from ombrotrophic peatlands can provide valuable information about atmospheric inputs of TMs [15,16]. Assuming that most metals deposited on the surface of ombrotrophic peatlands are sequestered by living or dead organic matter and are immobile, they can also provide a reliable indication of the changing deposition and, thus, of the content of elements in the air [17,18].There have been a large number of studies in the past three decades on the use of peat bogs as archives of atmospheric TMs’ deposition and most of them have been carried out in Europe and North America [19,20,21,22,23] and references therein. In contrast to those extensive amounts of work, few similar studies have been conducted in China. Most of the latter focused on either on Hg [24,25] or Pb [26,27]. Another two emerging studies used inorganic geochemistry of the peat record to reconstruct the history of atmospheric dust fluxes, and focused on major lithogenic elements such as Al, Ca, Fe, Mg and Ti and other trace elements such as rare earth elements (REE), Sc, Y and Th [28,29].
Such investigations above have focused on geochemical analysis of peat sampled at different depths and establishment of rates of peat accumulation through 14C or 210Pb dating to provide information about pollution chronologies. The fluxes of atmospheric TMs deposition could be calculated through combining the rate of peat accumulation, dry bulk density and TMs concentrations. This approach assumed that TMs are immobile and well preserved in peatlands. However, a peatland is an active system as a result of both accumulation and decomposition processes of organic matter. The mobility of TMs, especially in the peat surface layer (i.e., the acrotelm) is linked to various factors such as adsorption on oxyhydroxides [30], variation in pH [31], decomposition of organic matter [32], and uptake and recycling by plants [33], and thus their behavior is not always well understood, despite the numerous studies undertaken. Lead is by far the most intensively studied heavy metal in peat and is considered by most authors as an immobile element in peat [12,34]. Moreover, the isotopic composition of Pb is regarded to be a powerful tool for distinguishing natural from anthropogenic sources [35] and could also provide a support for Pb immobility by comparing Pb isotopic composition in dated herbarium Sphagnum samples and in 210Pb-dated peat samples from the same age and same location [4,36]. Zinc usually accompanies Pb in geochemical studies of peat and both of them are often associated in some important sources of pollution including sulfide minerals and coals [21].However, to some extent, Zn is relatively mobile due to bioaccumulation, water table fluctuations and pH conditions [37,38], so the use of Zn as a tracer is still under debate. Similar to Zn, the behavior of Cu is demonstrated to be either immobile [39,40] or mobile [18,41]. Compared to Pb, Zn and Cu, less studies for Ni behavior in peat and contradictory conclusions existed from different researches. In a study of atmospheric deposition in peat since the late glacial period, thus focused on the catotelm, Krachler et al. [42] found that Ni is mainly immobile; whereas, Ukonmaanaho et al. [43] argued that Ni is mobile and affected by leaching and pH condition in the acrotelm. With respect to the other TMs like As, Cd, Cr, Co, Sb and V, there is an increasing concern of their behaviors in ombrotrophic peatlands; their sources are mainly anthropogenic emissions and their distributions in peat are usually comparable to the Pb profile [44,45,46].
Figure 1. (A) Regional map showing the location of Aershan in northeast Asia; (B) Local map of Aershan city showing the sampling site of Motianling peatland in Aershan city in Great Hinggan Mountains, NE China; (C) Photo showing the early summer scene in the studied peatland (photo in June 2009). Average wind frequency (2005–2010) is inserted in (C), showing the prevailing wind in Aershan is mainly from the northwest and southeast (%).
Atmosphere 06 00380 g001
When a large geochemical dataset is generated in such a multi-tracer study of peat records, principal component analysis (PCA) is often applied to reduce the number of observed variables to a smaller number of factors and to identify sources and processes related to the distribution of multiple elements [47,48,49,50]. This statistical technique is used to a single set of variables (i.e., geochemical elements) to discern which set of variables form coherent subsets that are relatively independent of one another. Those correlated variables are combined into factors which should be representative of the underlying process. Loadings measure the correlations among these variables and relate to the specific association between the factors and original variables [51]. Another common approach to distinguish between natural and anthropogenic sources for elements in the environment is to calculate a normalized enrichment factor (EF) for metal concentrations above uncontaminated background levels [52,53,54]. The calculation of EF is usually based on a conservative (lithogenic) element indicative of mineral matter, such as Ti; in addition to the reference element, such a calculation is often relative to a reference material, either external (i.e., the continental crust) or internal (i.e., the mean of several low concentration samples selected from the deeper, pre-industrial levels of cores) [54]. The interpretation of EF is that an element with an EF value near unity has a probable source in crustal material and elements with EF value a few to many times larger than unity could be mainly industrial origin [55].
China has been one of the fast-growing economics of the late 20th and early 21st centuries, and heavy metal emissions have been increased in parallel with rapid industrialization and urbanization which has led to elevated metal concentrations in air, water and soil [27]. It has become a growing concern for human health; however, the temporal variation of atmospheric metal pollution is still not well understood due to the lack of long-term environmental records of atmospheric metal deposition. There are extensive peatlands developed on the alpine areas in northeast China, such as Great Hinggan Mountains [56]. Recently, we did an initial study of geochemical records through 210Pb-dated cores from a peatland in this region and provided a preliminary estimate of atmospheric Pb and soil dust fluxes over the past 200 years [26,28]. However, a complete representation of the factors affecting TMs accumulation in peatlands is still absent in China. Therefore, this study presents a synthesis on TMs in the same peatland in Motianling of Great Hinggan Mountain to give an overview of present and past contamination in northeast China (Figure 1). The objectives are to determine the concentrations, accumulation rates and inventories of As, Ba, Cd, Co, Cr, Cu, Mo, Ni, Pb, Sr, Sb, Tl, and Zn in Motianling peatland using a peat multi coring approach, and to assess TMs sources through the use of stable Pb isotopes (206Pb, 207Pb, 208Pb), calculation of EF and PCA analyses.

2. Material and Methods

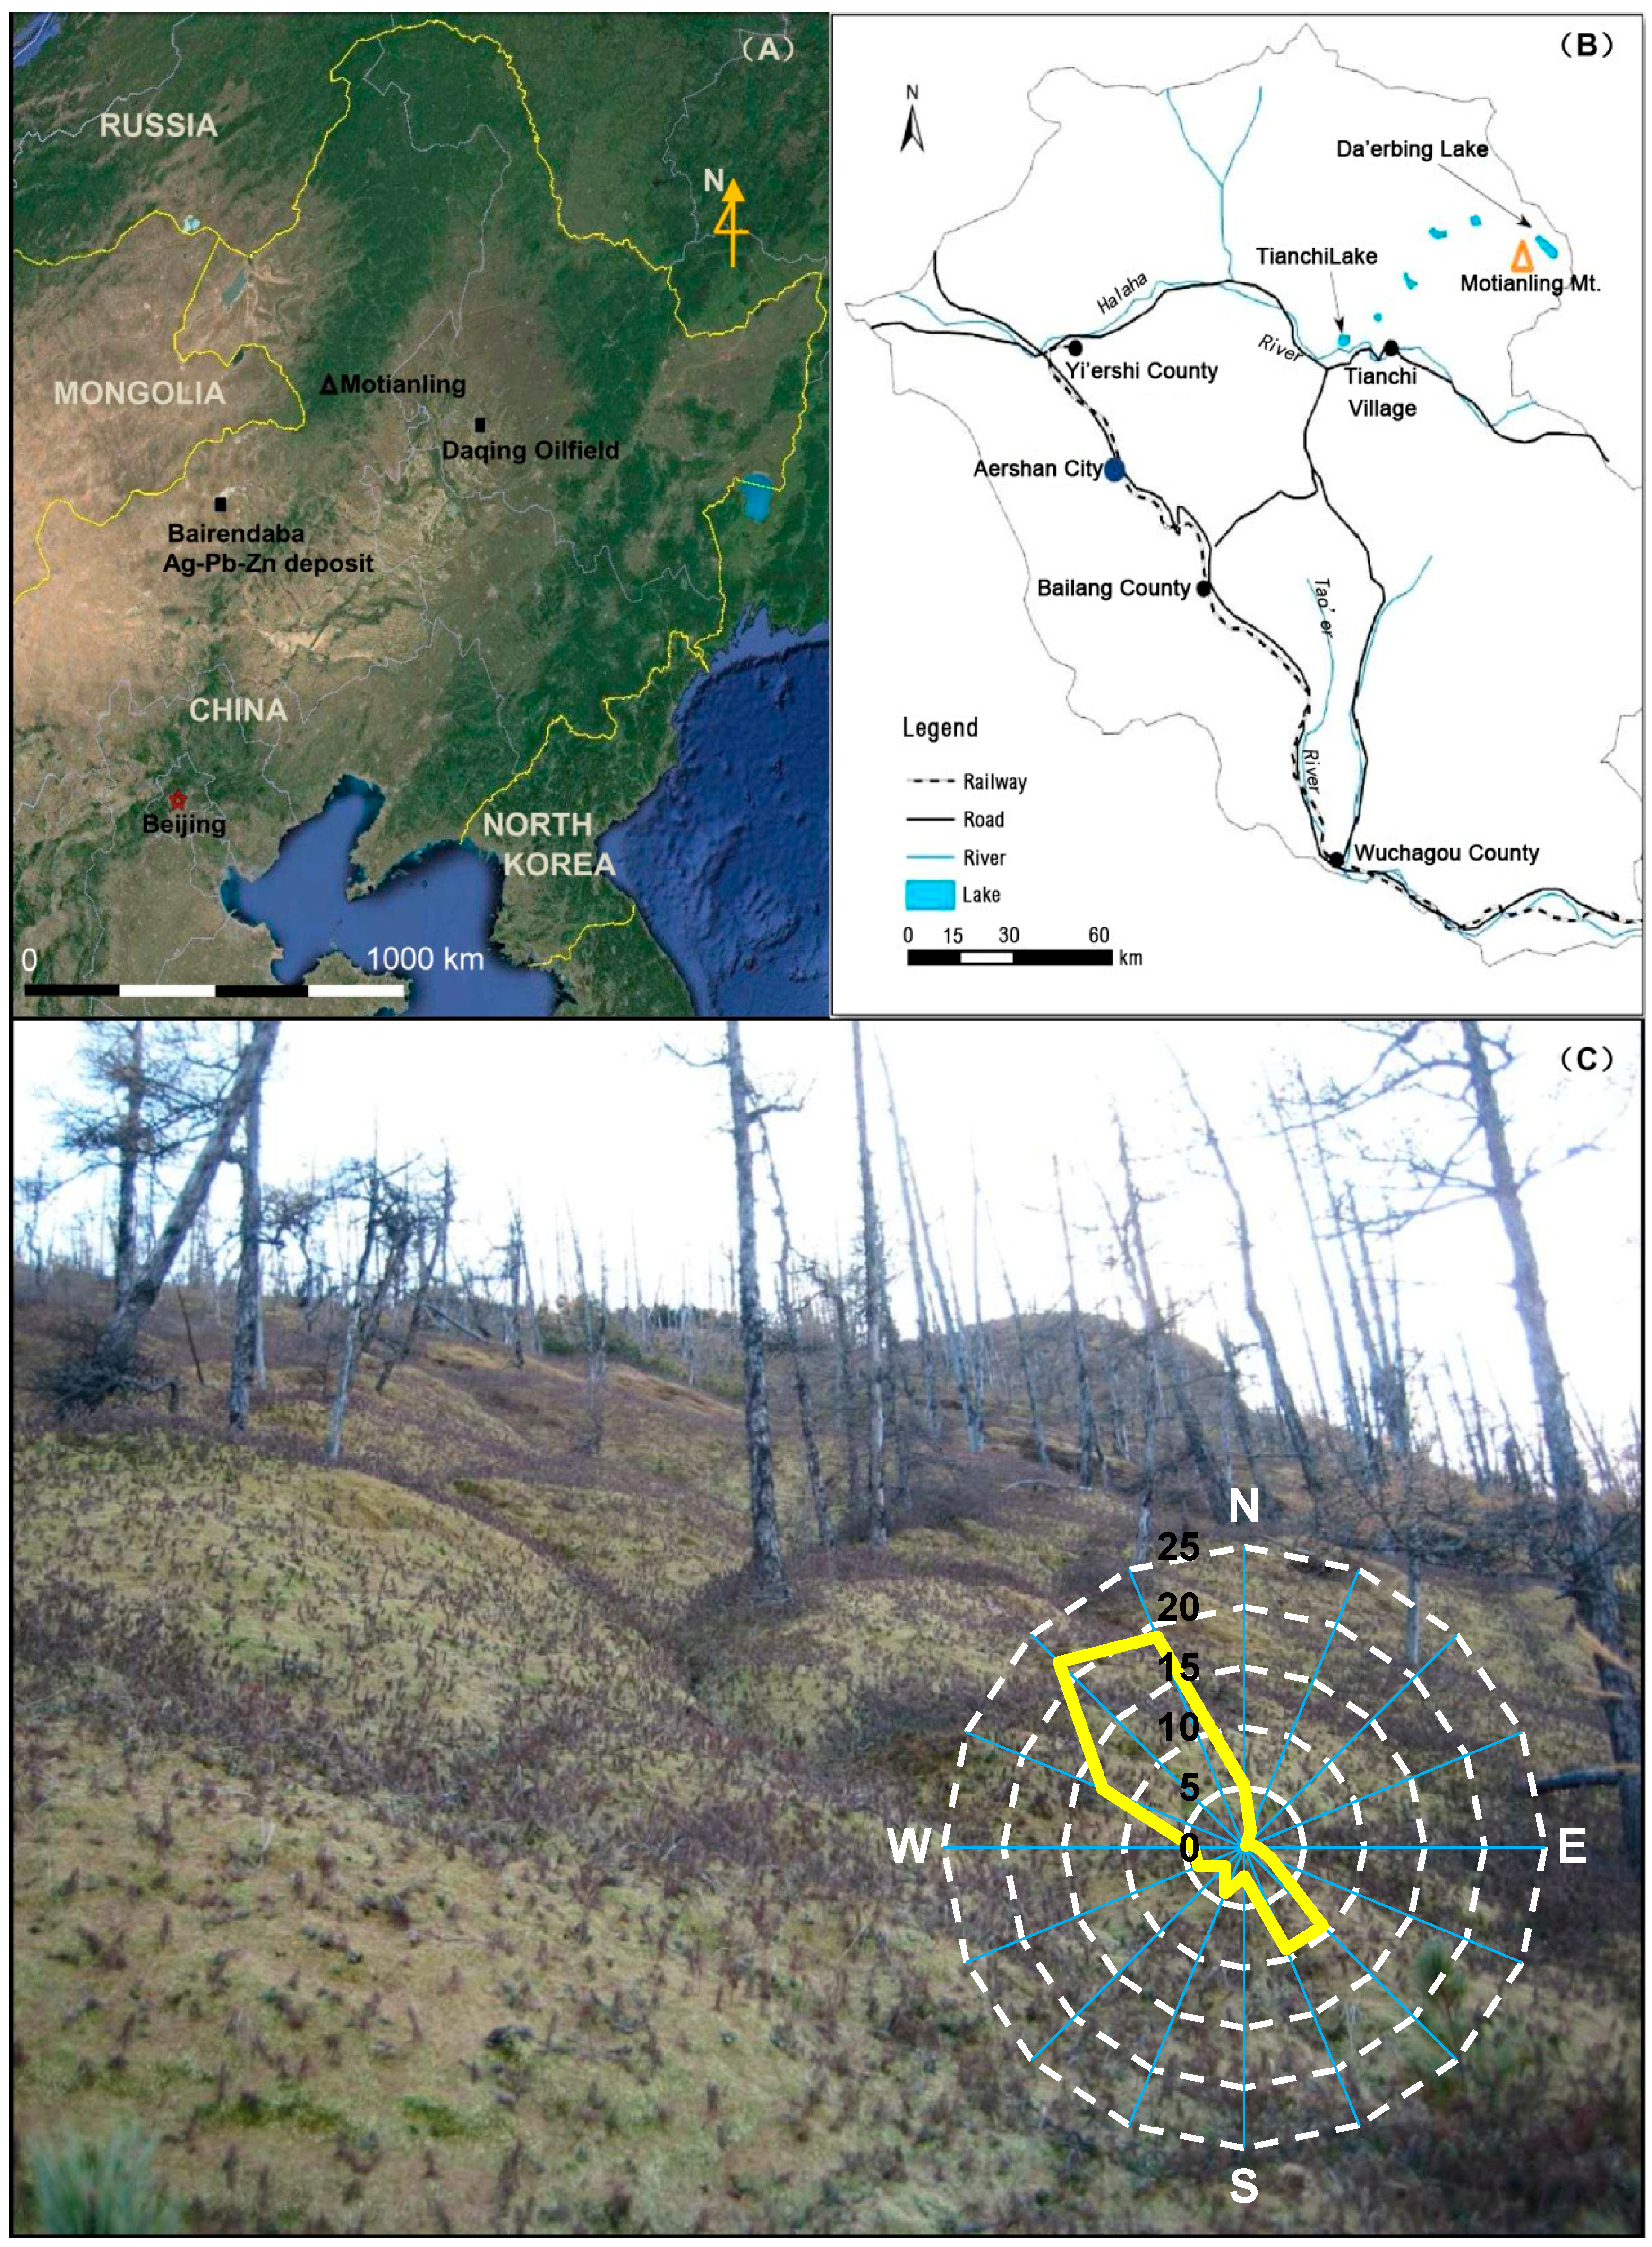
2.1. Brief Description of Previous Studies

A detailed description of three peat cores, the procedures used to section it and to prepare the peat samples, as well as the methods used to measure the basic physical and chemical indicators (Water content, dry bulk density, ash content, etc.) and major and trace elements using ICP-AES (Al, Ca, Fe, Mn, V, Ti and Pb), as well as the age dating undertaken using 210Pb and 137Cs, is provided elsewhere [26,28]. The following is a brief summary of these procedures: at the Motianling peat deposit on the north facing slope (ca. 30°) of Motianling mountain in northeast China (Figure 1), MP1 and MP2 columns were collected in October of 2008 and MP3 column was collected in June of 2009 by digging a pit. On the straight face of the pit, we first isolated a 15 cm × 15 cm column of peat by removing material on either side, and then carefully cut the 1 or 2 cm thick layers from this column and placed in plastic bags. Individual slices were sub-sampled, prepared, and measured for water content (WAT, %), dry bulk density (DBD, g∙cm−3), weight loss on ignition (LOI, %), ash content (ASH, %) [26]. Selected elements (Al, Ca, Fe, K, Mn, Mg, Na, Pb, Ti, V) were determined by ICP-AES (Shimadzu Corporation, Japan). The detailed process of sample preparation and results of Al, Ca, Fe, Mn, V and Ti were given in Bao et al. [28], and Pb data of MP1 and MP2 were reported in Bao et al. [26]. Dried bulk peat samples were age dated using 210Pb and 137Cs techniques through a low-background γ-ray spectrometer with a high pure Ge semiconductor (ORTEC Instruments Ltd., Oak Ridge, TN, USA) as described previously [26]. The unsupported 210Pb (excess 210Pb) activities were gradually declined with depth downward in all cores, and they became negligible at depths of 58 cm for MP1, 64 cm for MP2 and 60 cm for MP3, respectively.

2.2. Peat pH, Grain-Size, TOC and TN

The pH of peat was not measured when the fresh samples were collected and thus determined from our frozen samples which were thawed at room temperature. Water could be squeezed out of most of samples gently by hand, but some without water due to the lower water content at the bottom of core. The squeezed water or 1 g bulk peat was added into 5 mL deionized water. They were stirred adequately (ca. 30 min) and measured by a pH meter after 30 min standing. Total organic carbon (TOC) and total nitrogen (TN) were determined using the FlashEA1112 elemental analyzer (Thermo Finnigan, Milan, Italy).The quality of TOC and TN measurement was checked by periodic analysis of a certified reference material (GSS-1, Brown soil), with an error <1%. Granulometry of the samples was determined through the measurement of the grain size of peat ash prepared by ignition of dry samples in a muffle furnace at 700°C ± 50°C for 4 h [57]. Ash sample (ca. 0.2 g) was dissolved in 10 mL distilled water with the addition of sodium hexametaphosphate ((NaPO3)6, 3.6%) as a dispersant. Sample solutions were ultrasonicated for 10 min to facilitate dispersion for a concentration of 10%–20% prior to analysis by Mastersizer 2000 Laser Particle Size Analyser (Malvern Ltd., Worcestershire, UK) with a measurement range of 0.02–2000 μm. The repeated measurement error is generally less than 3%.

2.3. Determination of Trace Elements

Selected TMs (As, Ba, Cd, Co, Cr, Cu, Mo, Ni, Pb, Sr, Sb, Tl and Zn) and stable Pb isotopes (206Pb, 207Pb, 208Pb) were measured by a Quadrupole Inductively Coupled Plasma Mass Spectrometry (Q-ICP-MS 7700x, Agilent Technologies, Santa Clara, CA, USA)at the State Key Laboratory of Lake Science and Environment, Nanjing Institute of Geography and Limnology, CAS. Because total concentrations of Pb were measured for MP1 and MP2 cores [26], here we just measured Pb contents for MP3 core which were combined with the previous results. Sample aliquots were dried at 105 °C for 12 h and ground using an agate mortar. The fine sample was weighted accurately (0.2000–0.2059 g) into a TFM-PTFE in-liner vessel (“bomb”) with the stainless steel pressure digestion system (DAB-2, Berghof, Berchtesgaden, Germany). 2.5 mL HNO3 (high purity obtained by sub-boiling distillation of the analytical-grade reagent in an I.R. distiller (BSB-939, Berghof, Berchtesgaden, Germany)) and 0.5 mL H2O2(Baker ACS Reagent) were added and the PTFE vessels were close heated at 200°C–220 °C for 3 h. After cooling, 1 mL HF (Baker ACS Reagent) and 0.5 mL HClO4 (Fisher Trace Metal Grade) were added and they were heated again until the white smoke from the in-liner disappeared. After cooling again, 0.5 mL HNO3 (high purity) and 2.5 mL deionized water (>18 MΩ·cm) were added and they were heated at 150°C–180°C for 5 min. Last, they were cooled to ambient temperature for a minimum of 2 h, and the digested samples were centrifuged and the supernatant was transferred to a 50 mL centrifuge tube along with the washings from the TFM-PTFE in-liner. The sample solutions were brought up to a final volume of 25 mL with deionized water for TM analysis. The above solutions were diluted to a concentration of 8–10 μg∙L−1 Pb for measuring the isotopic composition of Pb [35]. NIST SRM 981 was used as an international standard reference material for every five samples to ensure the precision of the measurement process. The relative standard deviations (RSD) for 206Pb/207Pband 208Pb/206Pb were <0.12% and <0.07%, respectively. The accuracy of the measurements was tested on replicate analyses of some randomly selected samples and the results of TMs concentrations and Pb isotope ratios were summarized in Table 1 and expressed as mean ± standard deviation.

2.4. Calculations of EFs and ARs

Two criterions were used to establish a local “baseline” concentration for each core by taking the mean of several low concentration samples selected from (1) the deep, least impacted level of peats prior to the industrial revolution (i.e., 1830); (2) the peats with the 206Pb/207Pb ratio larger than 1.19 (typically radiogenic value). The determined background values of the lithogenic element (Ti) and the six pollution elements (As, Cd, Cu, Pb, Sb and Zn) identified by PCA were summarized in Table 2. They are comparable to the concentrations in standard earth materials such as average shale [58] or average crustal values [59,60].The difference between the total concentrations of TMs (TMtotal) and the background concentrations of TMs (TMbackground) provided an estimate of excess TM concentration (TMex) from human activities (Equation (1)).The EFs relative to the local background content of TMs were calculated according to Equation (2) detailed in a previous study [13]. The annual AR TMs were calculated from Equation (3) proposed by Givelet et al. [61].
TMex = TMtotal − TMbackground
EFlocal = (TMtotal/Titotal)sample/(TMtotal/Titotal)background
AR TM (mg∙m−2∙yr−1) = TMtotal (µg∙g−1) × DBD (g∙cm−3) × SR (cm∙yr−1) × 10
where (TMtotal)sample is the total concentration of the elements measured in the peat sample; TMbackground is the abundance measured at the bottom section of the bog, by average the value of samples with 206Pb/207Pb ≥ 1.9 and taken from pre-1830 layers, representing the natural pre-industrial elemental background; Ti is used as the conservative reference element; DBD is the bulk density of the peat and SR is the sedimentation rate of the peat. The methodology to calculate sedimentation rate (SR, cm∙yr−1) and peat accumulation rate (PAR, g∙cm−2∙yr−1) are described in a previous report [26].
Table 1. Replicate analyses of trace metal and metalloid (TM) concentrations (mg∙kg−1) and Pb isotope ratios (208Pb/206Pb and 206Pb/207Pb) with respective to some randomly selected samples from Motianling peatland and the results are expressed as mean ± standard deviation.
Sample NumberDepth (cm)AsBaCdCoCrCuMo (mg∙kg−1)NiPb *SrSbTlZn208Pb/206Pb206Pb/207Pb
MP1-10.53.45 ± 0.07146.5 ± 2.120.35 ± 0.012 ± 011.4 ± 0.427.15 ± 0.070.75 ± 0.075.40 ± 0.14 61.15 ± 1.060.45 ± 0.010.14 ± 066.40 ± 1.70
MP1-54.51.95 ± 0.0781.85 ± 0.070.1 ± 01 ± 05.8 ± 05.4 ± 0.140.3 ± 03 ± 0 30 ± 0.140.26 ± 0.040.07 ± 058.85 ± 1.632.1134 ± 0.0.00251.1639 ± 0
MP1-109.51.8 ± 073.75 ± 0.070.16 ± 0.010.95 ± 0.076 ± 0.283.75 ± 0.070.3 ± 03.1 ± 0.14 28.75 ± 0.490.21 ± 0.020.06 ± 026.9 ± 0.85
MP1-21311.65 ± 0.07110.5 ± 2.120.1 ± 01.4 ± 06.8 ± 0.285.5 ± 00.35 ± 0.074 ± 0.14 42.7 ± 0.570.23 ± 0.010.06 ± 033.6 ± 1.84
MP1-22331.55 ± 0.0783.75 ± 2.620.12 ± 01.35 ± 0.075.05 ± 0.784.9 ± 0.280.25 ± 0.073.6 ± 0 35.5 ± 0.570.18 ± 0.010.04 ± 032.3 ± 2.832.1089 ± 0.00271.1677 ± 0.0037
MP1-31518.35 ± 0.64443.5 ± 3.540.17 ± 013.75 ± 0.2166.8 ± 1.723.4 ± 0.141.55 ± 0.0729.45 ± 0.49 153.5 ± 2.120.71 ± 0.040.4 ± 077.05 ± 1.91
MP1-35596.7 ± 0.28415 ± 5.660.17 ± 015.05 ± 0.4960.35 ± 0.7824.65 ± 0.351.5 ± 030.5 ± 1.56 146 ± 2.830.57 ± 0.010.36 ± 0.0154.8 ± 0.992.0784 ± 0.00051.1912 ± 0.0030
MP2-43.51.65 ± 0.0735.05 ± 0.780.15 ± 00.9 ± 05 ± 0.283.75 ± 0.350.3 ± 02.7 ± 0 18.85 ± 0.070.22 ± 00.05 ± 033.6 ± 1.84
MP2-13132.15 ± 0.0765.05 ± 0.920.14 ± 01.5 ± 07.6 ± 0.145.85 ± 0.070.3 ± 04.05 ± 0.07 33.7 ± 0.140.23 ± 00.09 ± 032 ± 1.272.1100 ± 01.1666 ± 0.0004
MP2-14151.95 ± 0.0771.85 ± 1.630.19 ± 01.8 ± 06.8 ± 0.424.7 ± 00.3 ± 04.1 ± 0.14 34.95 ± 0.780.25 ± 0.010.08 ± 029.25 ± 0.64
MP2-25371.75 ± 0.07177 ± 1.410.1 ± 03.1 ± 08.9 ± 08.25 ± 0.070.4 ± 07.95 ± 0.07 86.1 ± 0.850.18 ± 00.08 ± 0.0191.25 ± 32.17
MP2-38637.1 ± 0.14432.5 ± 0.710.13 ± 09.15 ± 0.0764.35 ± 0.6423.15 ± 0.071.8 ± 024.5 ± 0.57 168 ± 00.68 ± 00.42 ± 078.85 ± 2.902.0715 ± 0.00071.1932 ± 0.0008
MP3-2317.9 ± 0.99993.5 ± 12.020.88 ± 0.1118.55 ± 1.4865.25 ± 7103.95 ± 7.144.4 ± 0.1450.75 ± 5.02109.5 ± 6.36414 ± 7.072.85 ± 0.350.99 ± 0.08312.5 ± 31.82
MP3-112115.2 ± 1.131103.5 ± 14.850.09 ± 0.0120.85 ± 0.2165.1 ± 5.6696.05 ± 2.193.85 ± 0.07148.5 ± 34.6545.2 ± 0.85674.5 ± 6.361.7 ± 0.140.6 ± 0.01197.5 ± 6.36
MP3-224312.9 ± 0.141358 ± 2.830.34 ± 0.0224.95 ± 0.2162.25 ± 2.47101.7 ± 24.472.6 ± 0128.4 ± 88.5338.8 ± 3.54665 ± 2.831.45 ± 0.350.56 ± 0184 ± 0
MP3-33659.8 ± 0859 ± 11.310.28 ± 0.0315.05 ± 0.0780.65 ± 2.6254.5 ± 3.682.35 ± 0.0745.3 ± 3.6828.6 ± 0.85377.5 ± 3.541.35 ± 0.070.63 ± 0.01101.85 ± 5.87
MP3-39779.1 ± 0.14644 ± 8.490.17 ± 0.0410.5 ± 0.2876.95 ± 8.4135.25 ± 1.482.15 ± 0.0732.7 ± 0.8526.65 ± 0.35213.5 ± 2.122.3 ± 0.140.65 ± 0.0397.9 ± 1.72.0830 ± 0.00141.1887 ± 0.0010
* Indicates that samples of MP3 core were just measured for Pb concentration by ICP-MS; Pb content data of MP1 and MP2 were from Bao et al. [26] and not shown here.
Table 2. Background concentration values for lithogenic element (Ti) and pollution elements identified by PCA (As, Cd, Cu, Pb, Sb and Zn) for the three studied cores, based on the 206Pb/207Pb ratio larger than 1.19. Data is presented as follows: average ± standard deviation (SD). The numbers in the bracket following cores are numbers of samples.
ElementMP1 (n = 7)MP2 (n = 3)MP3 (n = 3)Earth’s Crust [59]Continental Shale [58]Continental Crust [60]
Ti (mg/g)3.19 ± 1.294.61 ± 1.684.13 ± 0.814.55.74.01
As (mg/kg)5.36 ± 1.322.58 ± 0.541.75 ± 0.151.71.81.7
Cd (mg/kg)0.17 ± 0.000.14 ± 0.030.21 ± 0.020.130.20.1
Cu (mg/kg)14.55 ± 3.878.26 ± 1.845.74 ± 0.99475525
Pb (mg/kg)28.36 ± 7.5343.80 ± 16.4036.89 ± 5.20162014.8
Sb (mg/kg)0.62 ± 0.080.26 ± 0.060.25 ± 0.170.50.20.3
Zn (mg/kg)67.88 ± 14.4270.91 ± 32.5272.71 ± 19.06837065

2.5. Data Statistical Analysis

Values of mean, standard deviation, minimum and maximum were calculated for the variables of peat deposition, elemental concentrations and ARs. PCA analysis was applied to identify and interpret the underlying (latent) factors affecting chemical elements in peat record. Pearson correlation analysis was performed to examine relationships among the individual parameters. Before PCA and Pearson correlation analyses, all data were converted to Z-scores calculated as per Equation (4). Principal components were extracted applying a varimax rotation to the complete dataset combining the data of all cores. These procedures were performed using SPSS 11.5 software package [62]. Statistical significance was determined at the P = 0.05 level unless indicated otherwise.
Z-score = (Xi− Xavg)/Xstd
where Xi, Xavg, and Xstd are the given value, the average and the standard deviation of a variable in a given sample, respectively.

3. Results

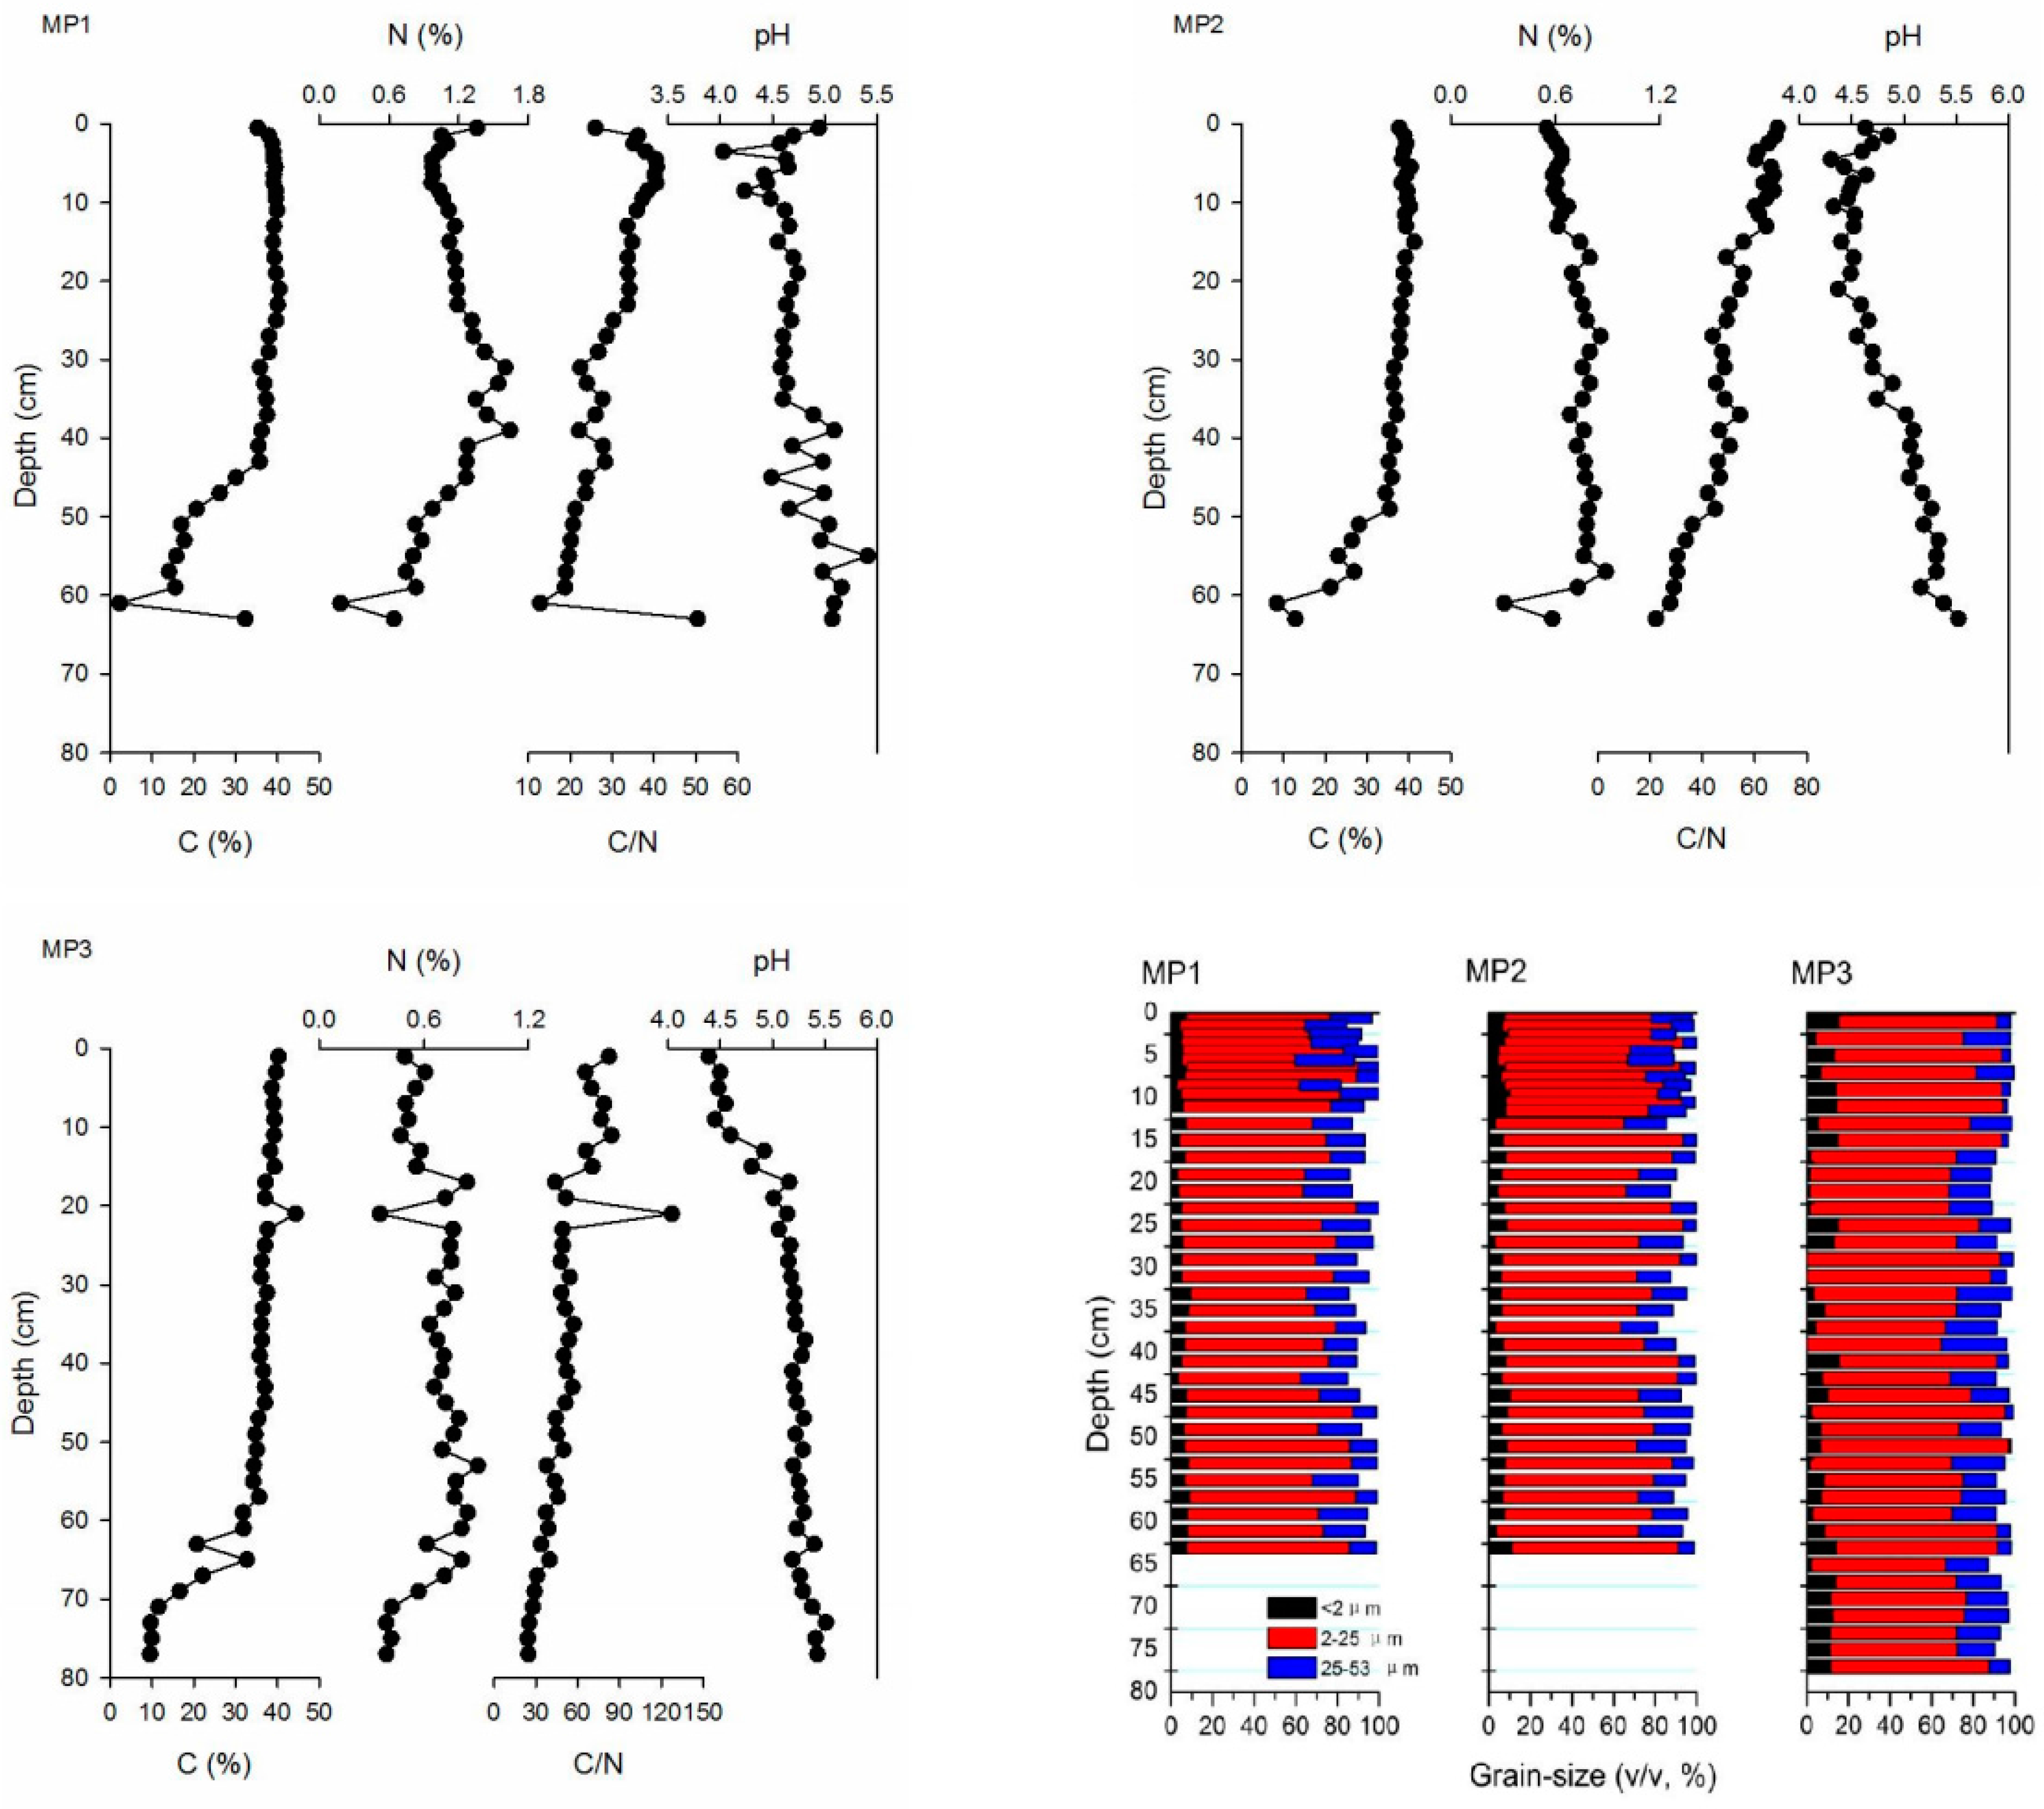
3.1. TOC, TN, Peat pH and Grain-Size Distribution

Distribution of TOC was characterized by high values up to 45% in the topmost section followed by a subsequent decrease at the deeper layers, and the minimum value was 9.5% at the bottom of core. For TN, there was an increasing trend with depth near the surface, with an obvious peak at ca. 40 cm (MP1), 55 cm (MP2) and 50 cm (MP3), and below these depths, variation of TN was similar to that of TOC. The C/N ratios were calculated to represent the degree of peat decomposition and had a steadily decreasing trend with depth except for the abnormal high value at the bottom of MP1 core (Figure 2). For MP3 core, the C/N ratio has a quite high value (up to 128) at ca. 20 cm depth. The pH values of the three cores were quite consistent and increased with depth downward gradually (Figure 2). The following grain-size fractions were determined: clay (<2 μm), fine silt (2–25 μm), coarse silt (25–53 μm), fine sand (53–250 μm), and coarse sand (>250 μm). The profiles variations of main fractions with depth in MP1, MP2 and MP3 cores are also shown in Figure 2. The fine silt composition accounted for 68.6% ± 8.3% of MP1, 72.6% ± 8.5% of MP2 and 71.4% ± 9.3% of MP3, respectively. The grain-size distribution is nearly homogeneous, exclusively assembled with clay-silt fine grain fractions over the entire core length (92.8% ± 5.2% < 53 μm for MP1, 94.4% ± 4.9% < 53 μm for MP2, 94.8% ± 3.5% < 53 μm for MP3).
Figure 2. Depth profiles of total organic carbon content (TOC, %), total nitrogen content (TN, %) as well as their ratios (C/N), and grain-size distribution (v/v, %) of particles in the peat ash from Motianling peatland in Great Hinggan Mountains, northeast China.
Atmosphere 06 00380 g002

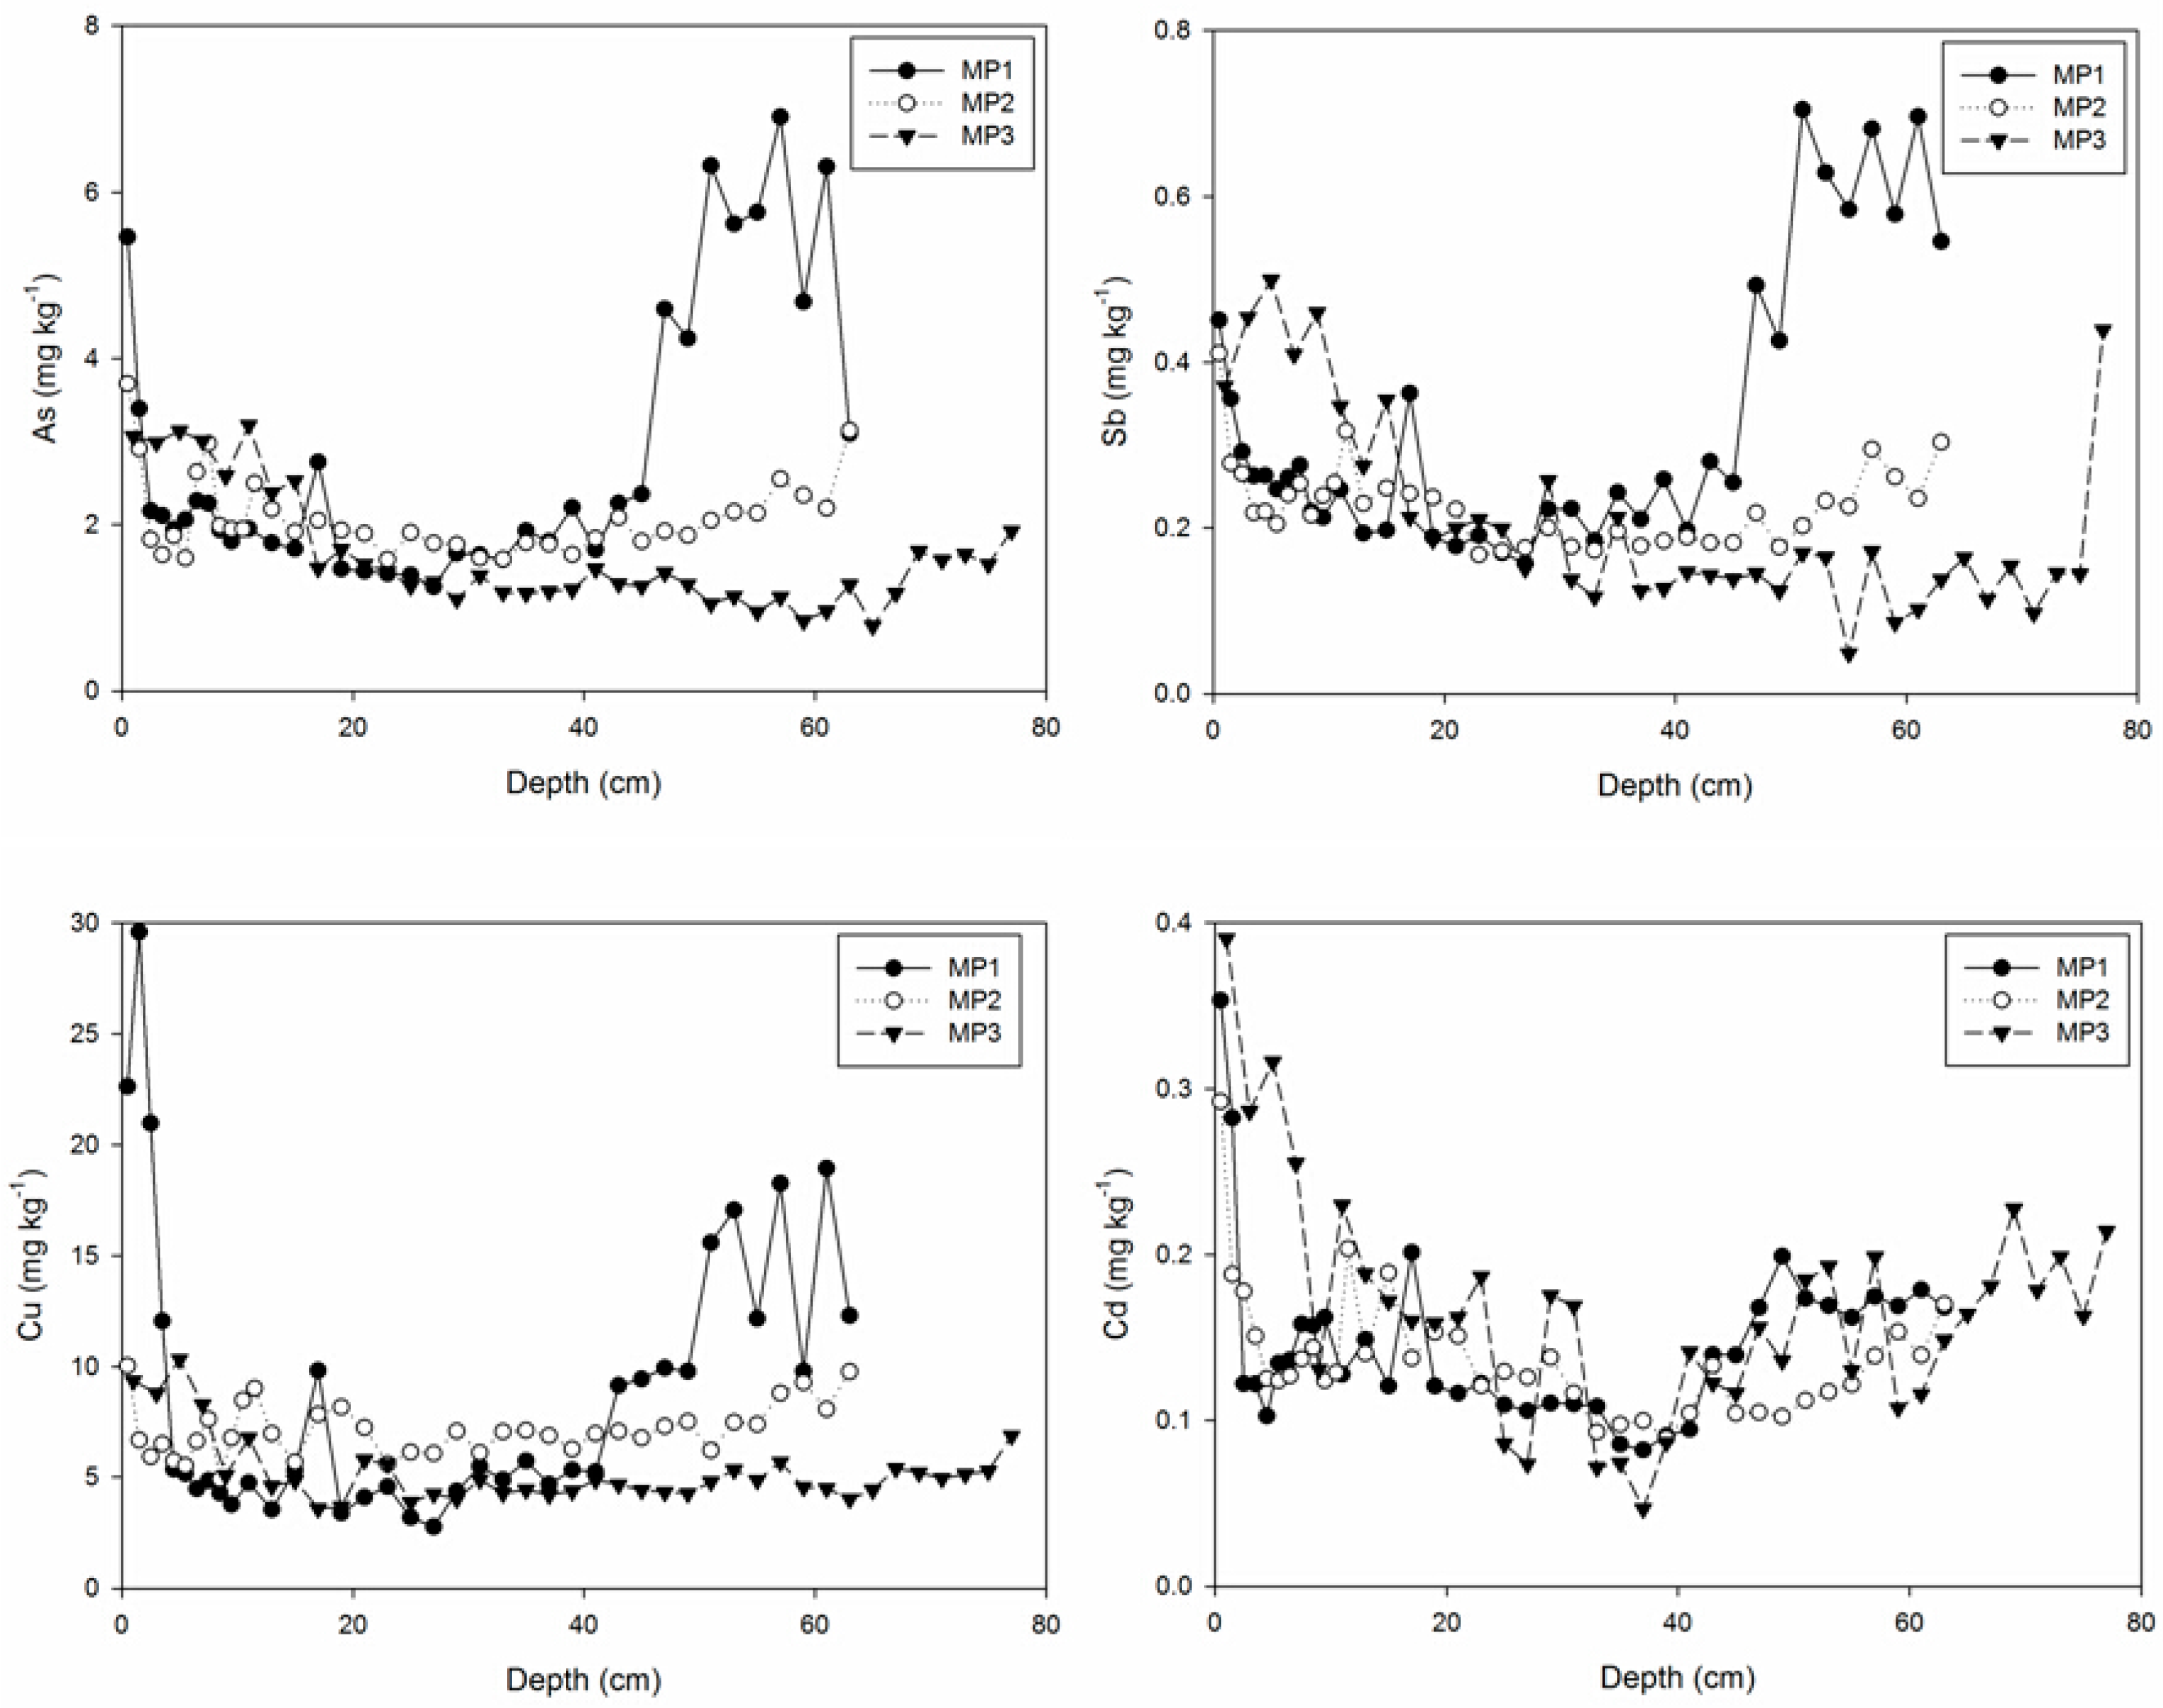
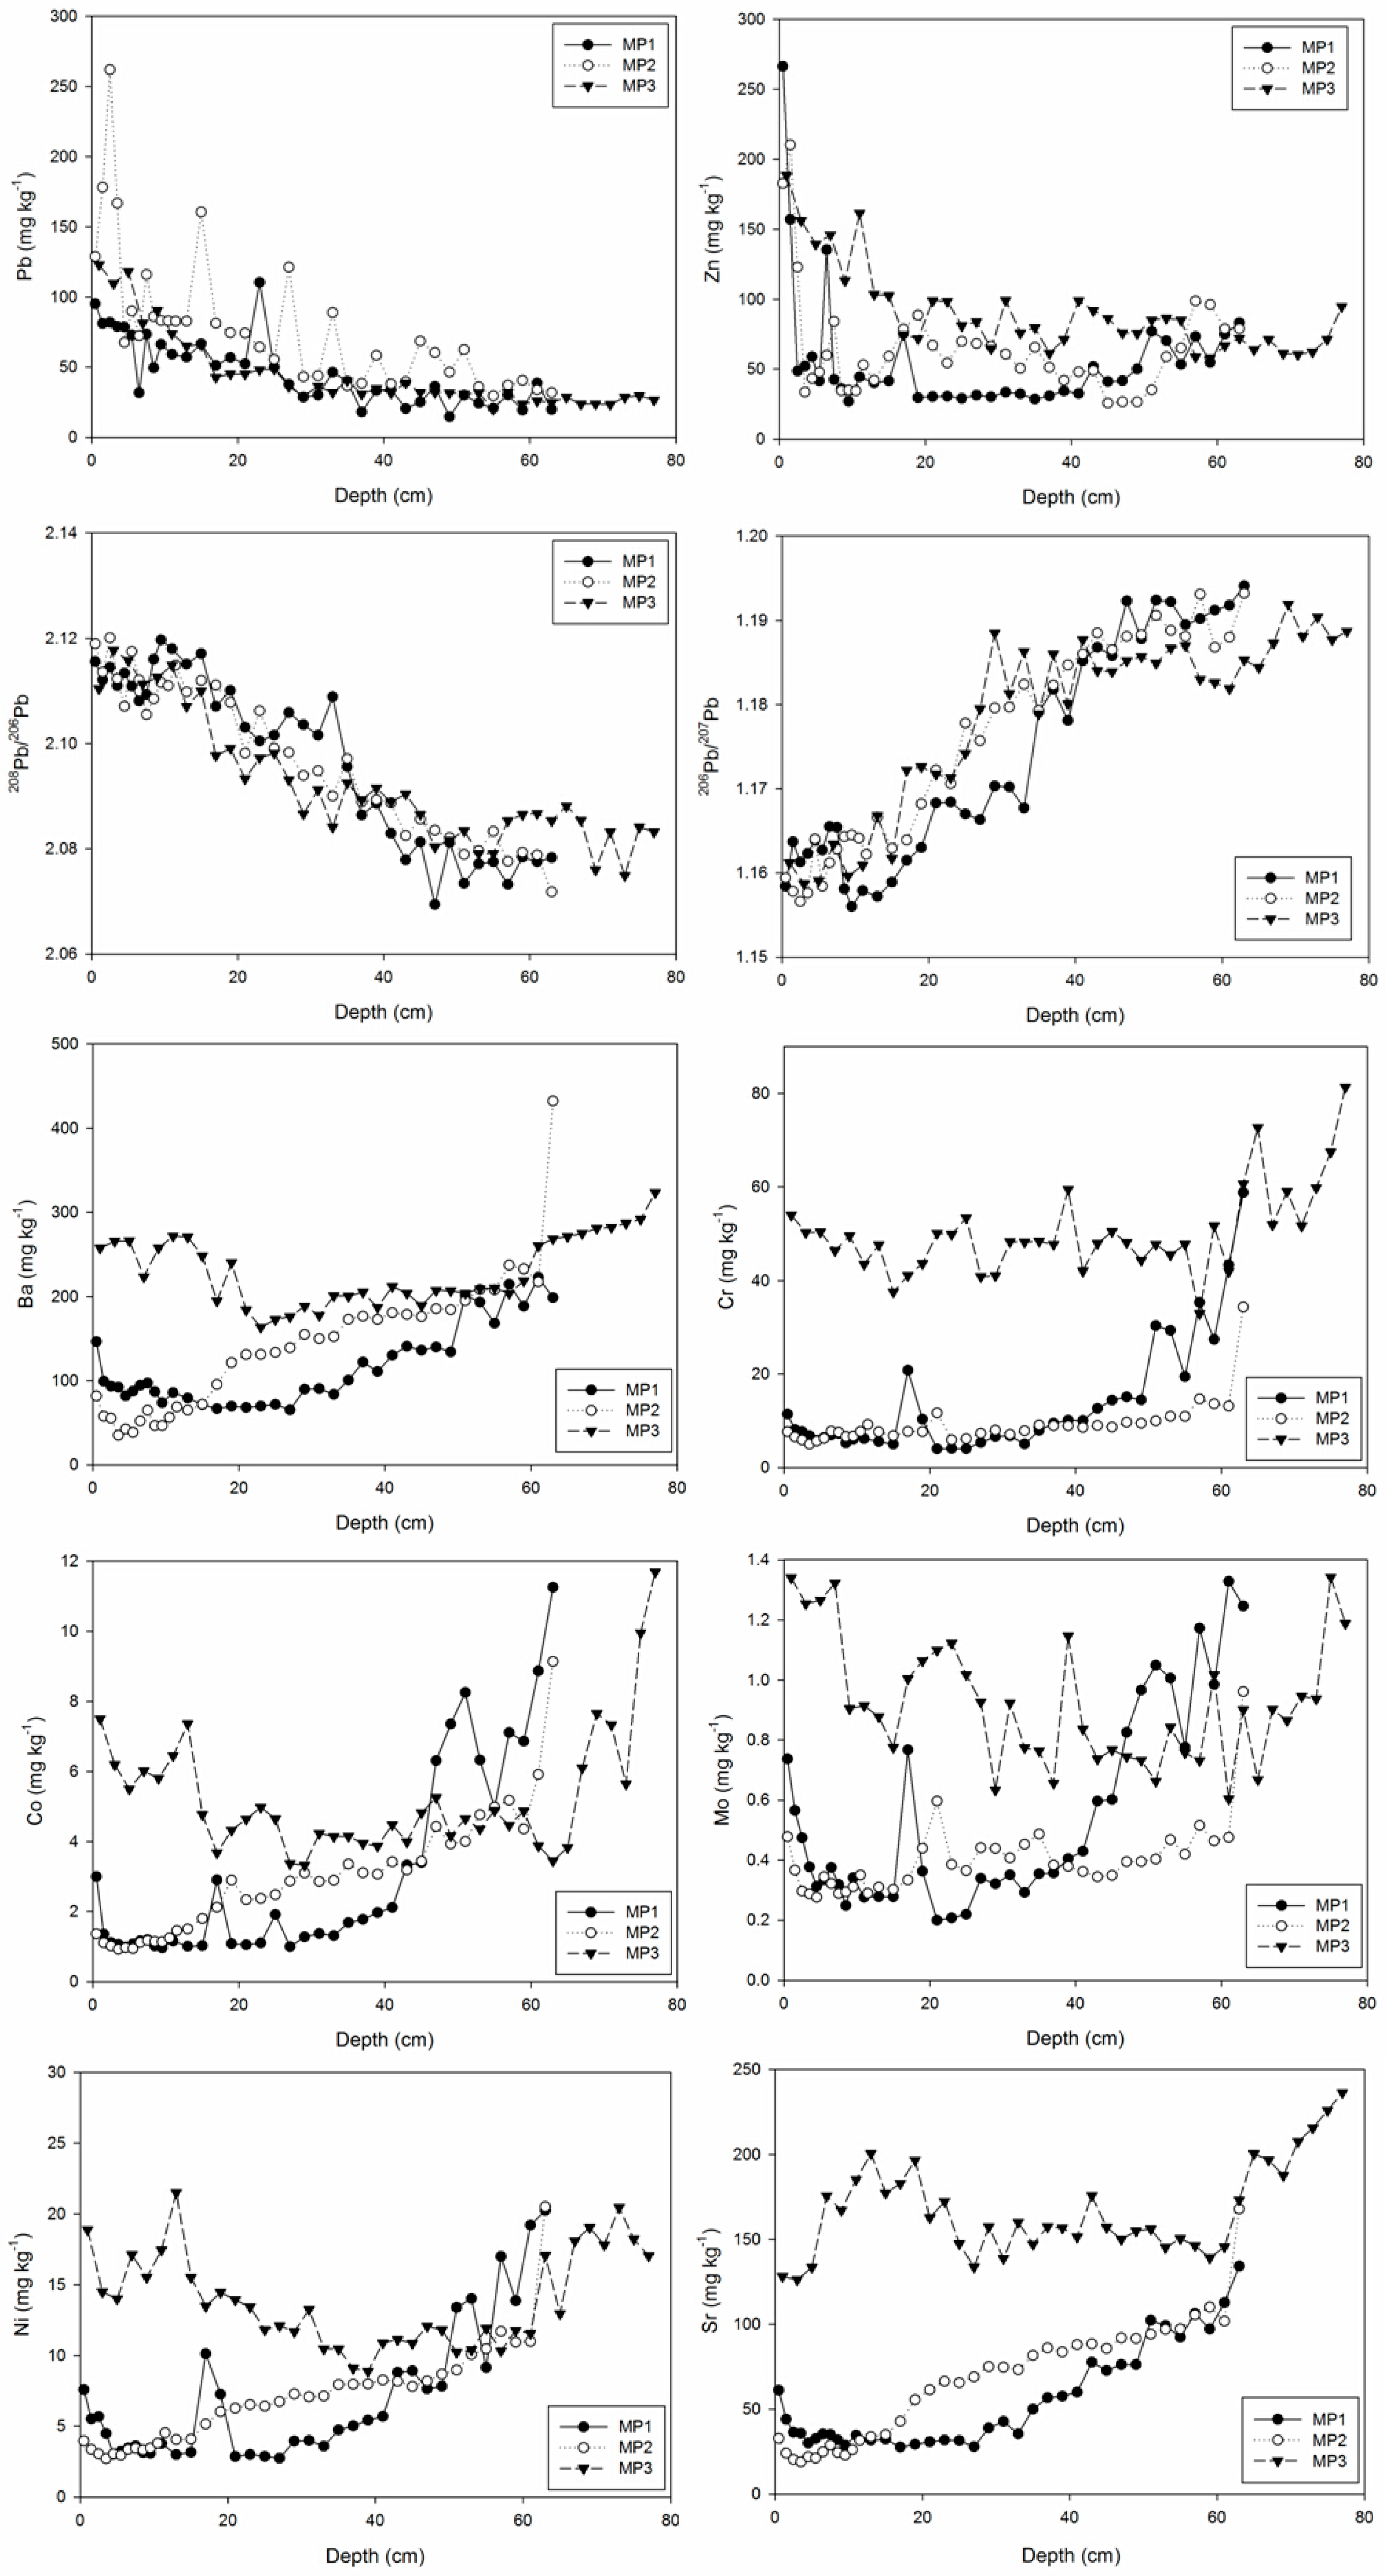
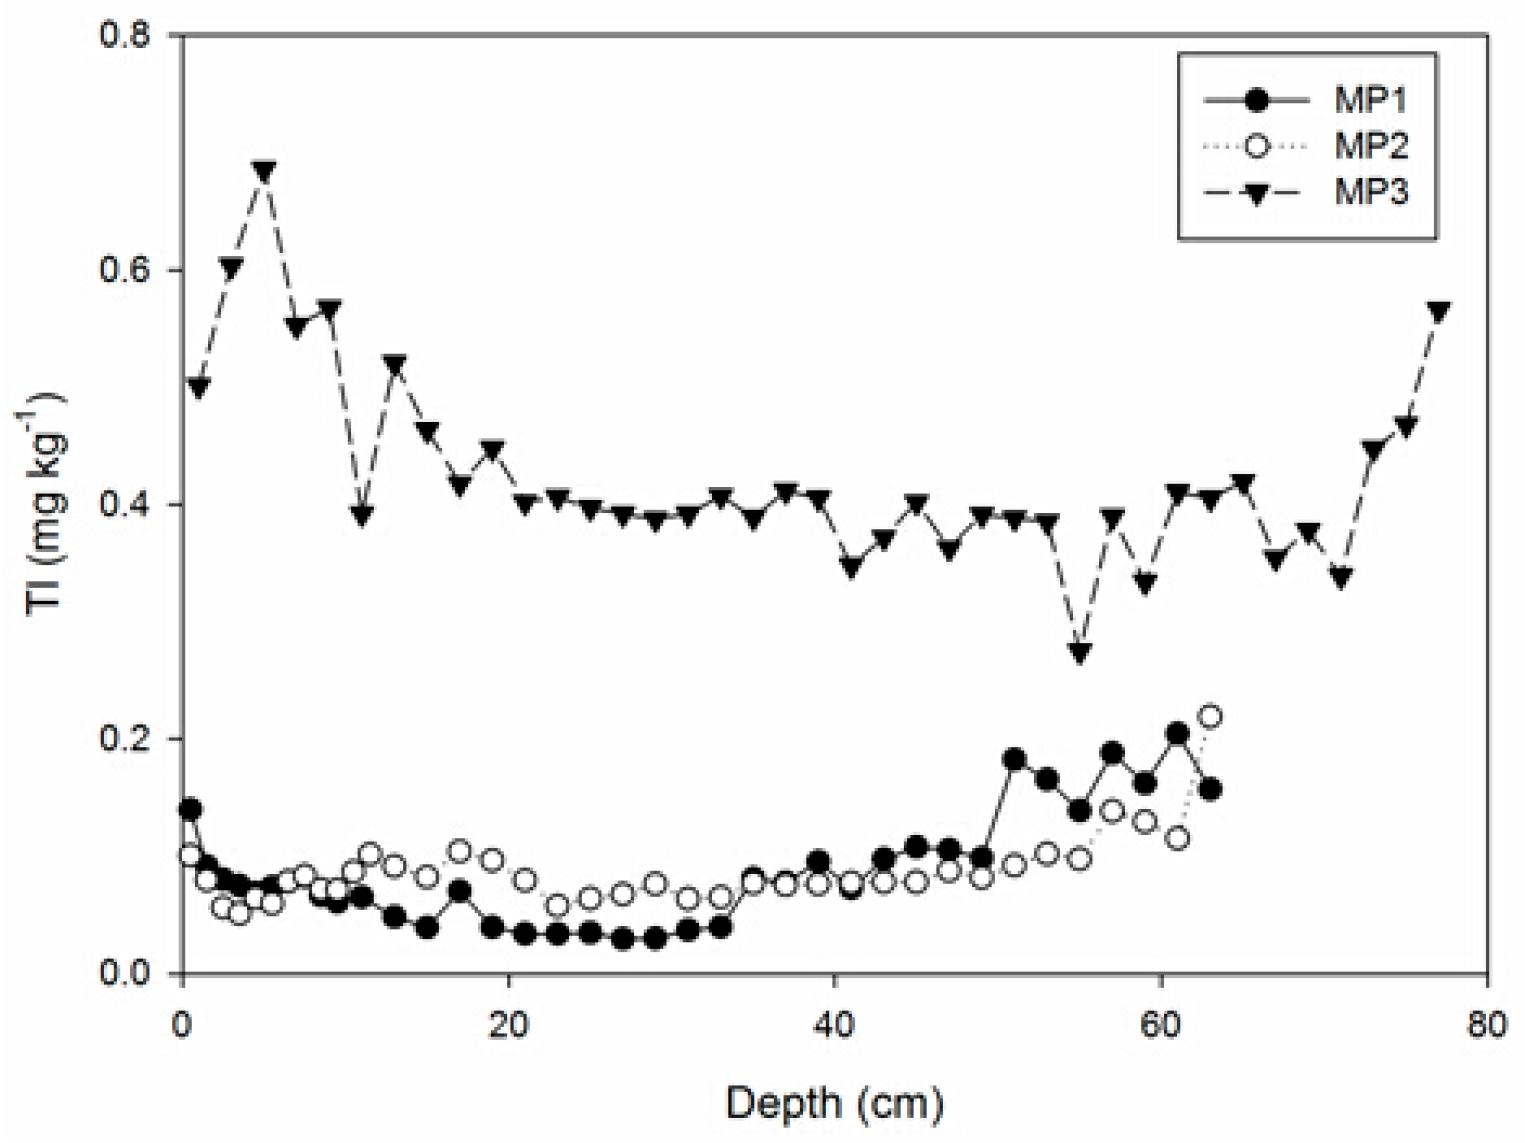
3.2. Elemental Concentrations and Pb Isotope Ratios

Means of element concentrations (As, Ba, Cd, Co, Cr, Cu, Mo, Ni, Pb, Sb, Sr, Tl and Zn) in the different peat cores (Table 3) show that the variability among the three cores is generally low (<two-fold difference) except that there are slightly higher values of Sr, Tl and Cr in the MP3 core (ca. three-fold, 4.5-fold and 5.5-fold than other cores). Depth distributions of TMs are shown in Figure 3. They are all characterized by obvious elevated concentrations in the surface section as well as at the bottom section. All elements show smaller variation with a factor of lower than 10; however, great variability of concentrations was found for Cr, Co and Cu in MP1, Ba and Co in MP2, and Sb in MP3, with a factor of above 10 (Table 3). Lead isotopic composition involving 206Pb/207Pb and 208Pb/206Pb revealed quite similar behavior for the three profiles (Figure 3). Ratios of 206Pb/207Pbare generally increasing with depth downward, with the minimum value of 1.156 at 9.5 cm depth (MP1), 1.157 at 2.5 cm depth (MP2), and 1.159 at 3 cm depth (MP3).
Table 3. Mean, maximum and minimum concentrations of elements (mg∙kg−1) in peat cores taken from three cores in Motianling peatland of the Great Hinggan Mountains, northeast China.
ElementMinMaxMeanFactormax/minMinMaxMeanFactormax/minMinMaxMeanFactormax/min
MP1 (n = 37)MP2 (n = 38)MP3 (n = 39)
As1.25 6.91 2.84 5.53 1.58 3.70 2.08 2.34 0.78 3.20 1.62 4.10
Ba65.29 222.95 115.36 3.41 35.08 432.25 135.54 12.32 163.64 323.39 229.62 1.98
Cd0.08 0.35 0.15 4.38 0.09 0.29 0.14 3.22 0.05 0.39 0.17 7.80
Cr4.00 58.79 13.34 14.70 4.98 34.35 9.11 6.90 32.96 81.36 50.15 2.47
Co0.96 11.26 2.99 11.73 0.92 9.14 2.82 9.93 3.33 11.70 5.24 3.51
Cu2.76 29.60 8.99 10.72 4.92 10.03 7.13 2.04 3.58 10.32 5.25 2.88
Mo0.20 1.33 0.54 6.65 0.28 0.96 0.40 3.43 0.60 1.34 0.92 2.23
Ni2.74 20.25 6.87 7.39 2.71 20.51 6.75 7.57 8.88 21.51 13.88 2.42
Pb14.69 * 110.40 * 47.59 * 7.52 * 29.49 * 261.98 * 78.01 * 8.88 * 20.10 123.0044.516.12
Sb0.16 0.70 0.33 4.38 0.17 0.41 0.23 2.41 0.05 0.50 0.21 10.00
Sr27.64 134.27 55.06 4.86 18.86 167.92 63.68 8.90 126.24 236.44 167.28 1.87
Tl0.03 0.20 0.09 6.67 0.05 0.22 0.09 4.40 0.27 0.69 0.43 2.56
Zn26.95 266.42 57.09 9.89 25.70 210.32 65.61 8.18 57.81 188.53 89.65 3.26
* Indicates that Pb content data of MP1 and MP2 were from Bao et al. [26] and those of MP3 were measured by ICP-MS.
Figure 3. Concentration records of elements (As, Ba, Cd, Co, Cr, Cu, Mo, Ni, Pb, Sb, Sr, Tl and Zn; mg∙kg−1) and lead isotope ratios (206Pb/207Pb and 208Pb/206Pb) in the three cores sampled at Motianling peatland of Great Hinggan Mountains, northeast China. Pb content data of MP1 and MP2 were from Bao et al. [26].
Atmosphere 06 00380 g003aAtmosphere 06 00380 g003bAtmosphere 06 00380 g003c
Table 4. Varimax rotated factor matrices for the transformed (Z-scores) elemental concentrations in the first three principal components obtained by PCA analysis of the entire Motianling peatland geochemical dataset (MP1, MP2 and MP3). Significant (>0.4 and <−0.4) factor loadings are designated in bold. Proportion of the total data variance captured by a component is given as Eigenvalue, % Variance and Cumulative variance at the bottom of the table. Percentage of the variance of each element explained by each component and accounted for all the extracted principle components are given in four columns from the right.
Factor LoadingsPartition of Communality (%)Extraction Communalities (%)
PC1PC2PC3PC1PC2PC3Total
Tl0.941−0.1380.09688.51.90.991.4
Cr0.941−0.097−0.12388.50.91.590.9
Sr0.932−0.147−0.27186.92.27.396.3
Ni0.8990.191−0.26480.83.66.991.4
Mo0.8770.310−0.10476.99.61.187.6
Ba0.8590.053−0.35273.80.312.486.5
Co0.7770.352−0.39460.412.415.588.3
As−0.0060.957−0.048091.60.291.9
Sb0.0860.9160.0320.783.90.184.8
Cu−0.0470.8650.0250.274.80.175.1
Cd0.4550.5350.51620.728.626.676.0
206Pb/207Pb0.3160.068−0.89410.00.579.990.3
208Pb/206Pb−0.317−0.0960.88810.00.978.989.8
Pb−0.2300.0970.7895.30.962.368.5
Zn0.5120.3790.56126.214.431.572.1
Eigenvalue6.2903.2673.252
% Variance41.921.821.7
%Cumulative variance41.963.785.4
Figure 4. Temporal trends of enrichment factors (EF, see text for calculation) for As, Cd, Cu, Pb, Sb and Zn in the three cores from Motianling peatland in Great Hinggan Mountains, NE China. An EF >1 indicates that the sample is enriched, relative to background, thus four peaks of EFs are observed, representing specific historical periods (1860–1880: #4, 1920–1940: #3, and 1949-now: #1 and 2) of society development in China.
Atmosphere 06 00380 g004

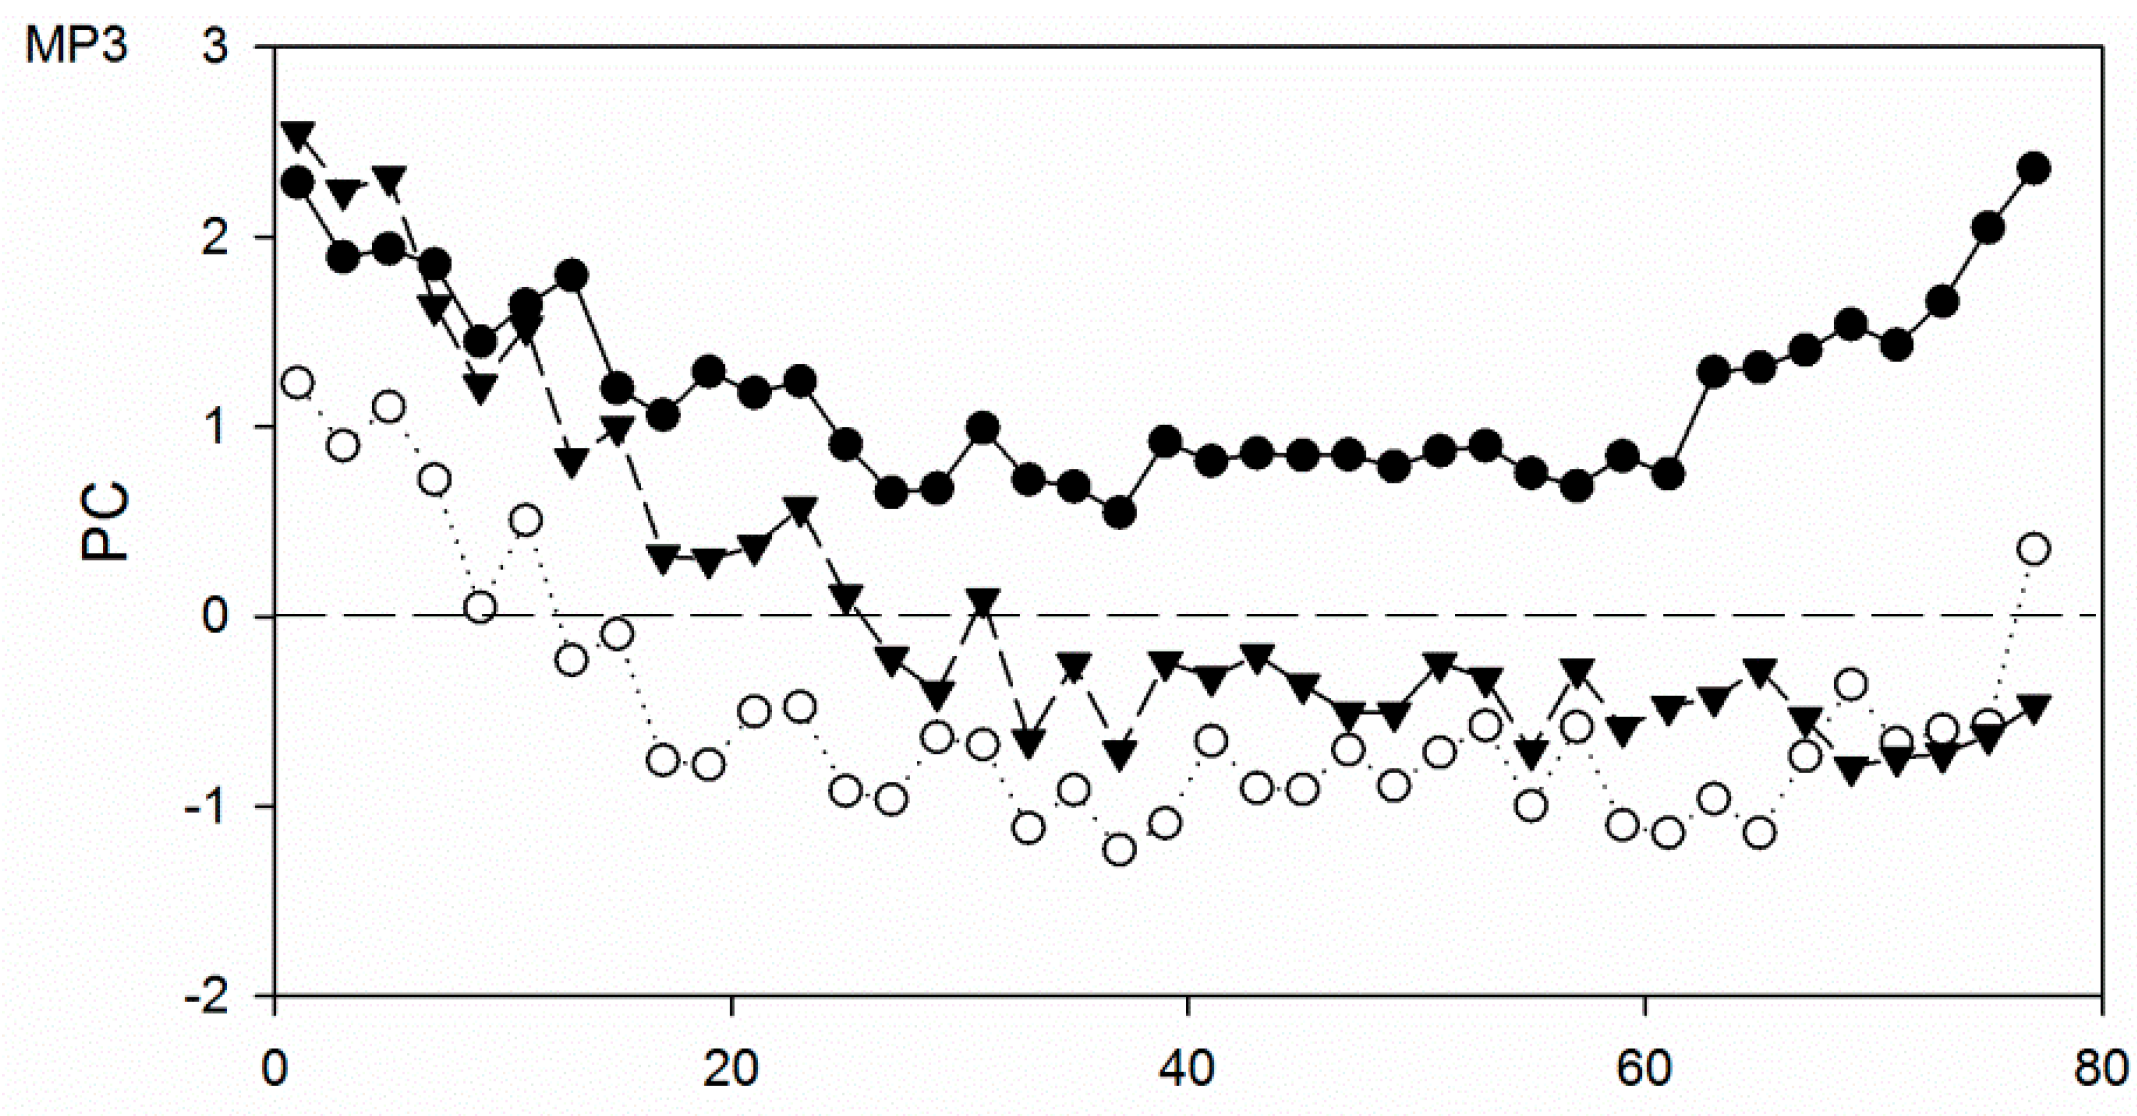
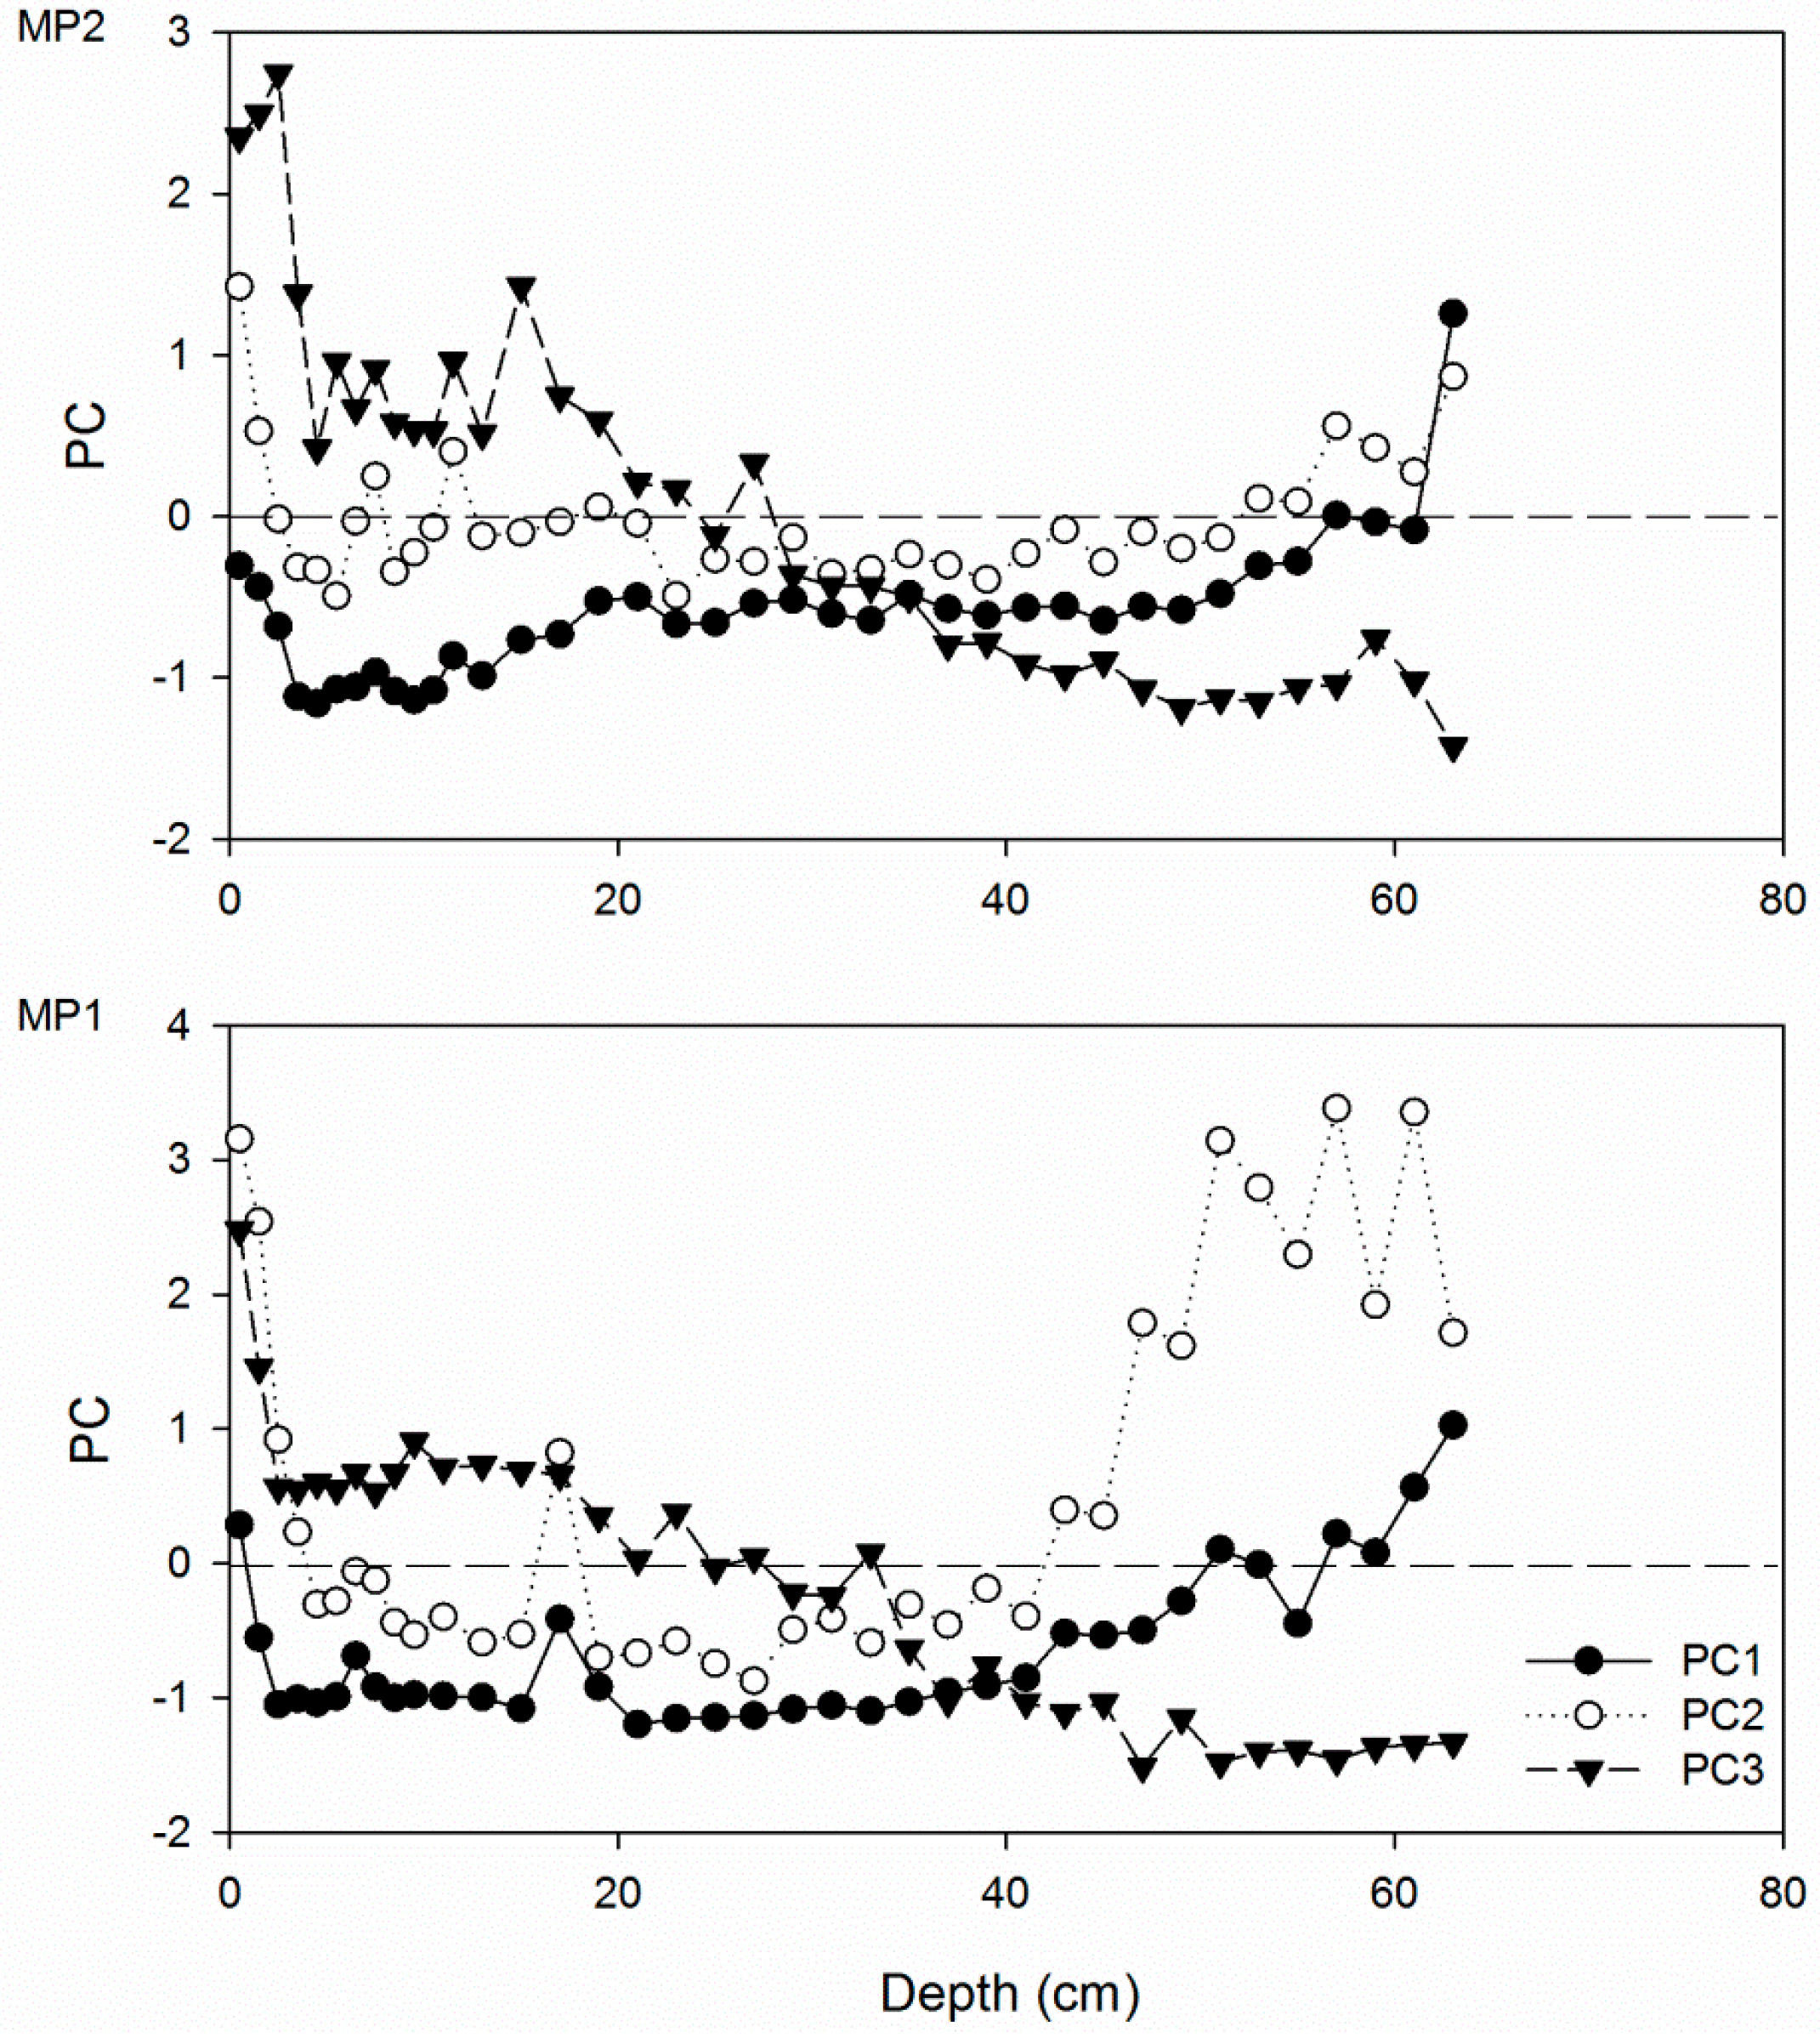
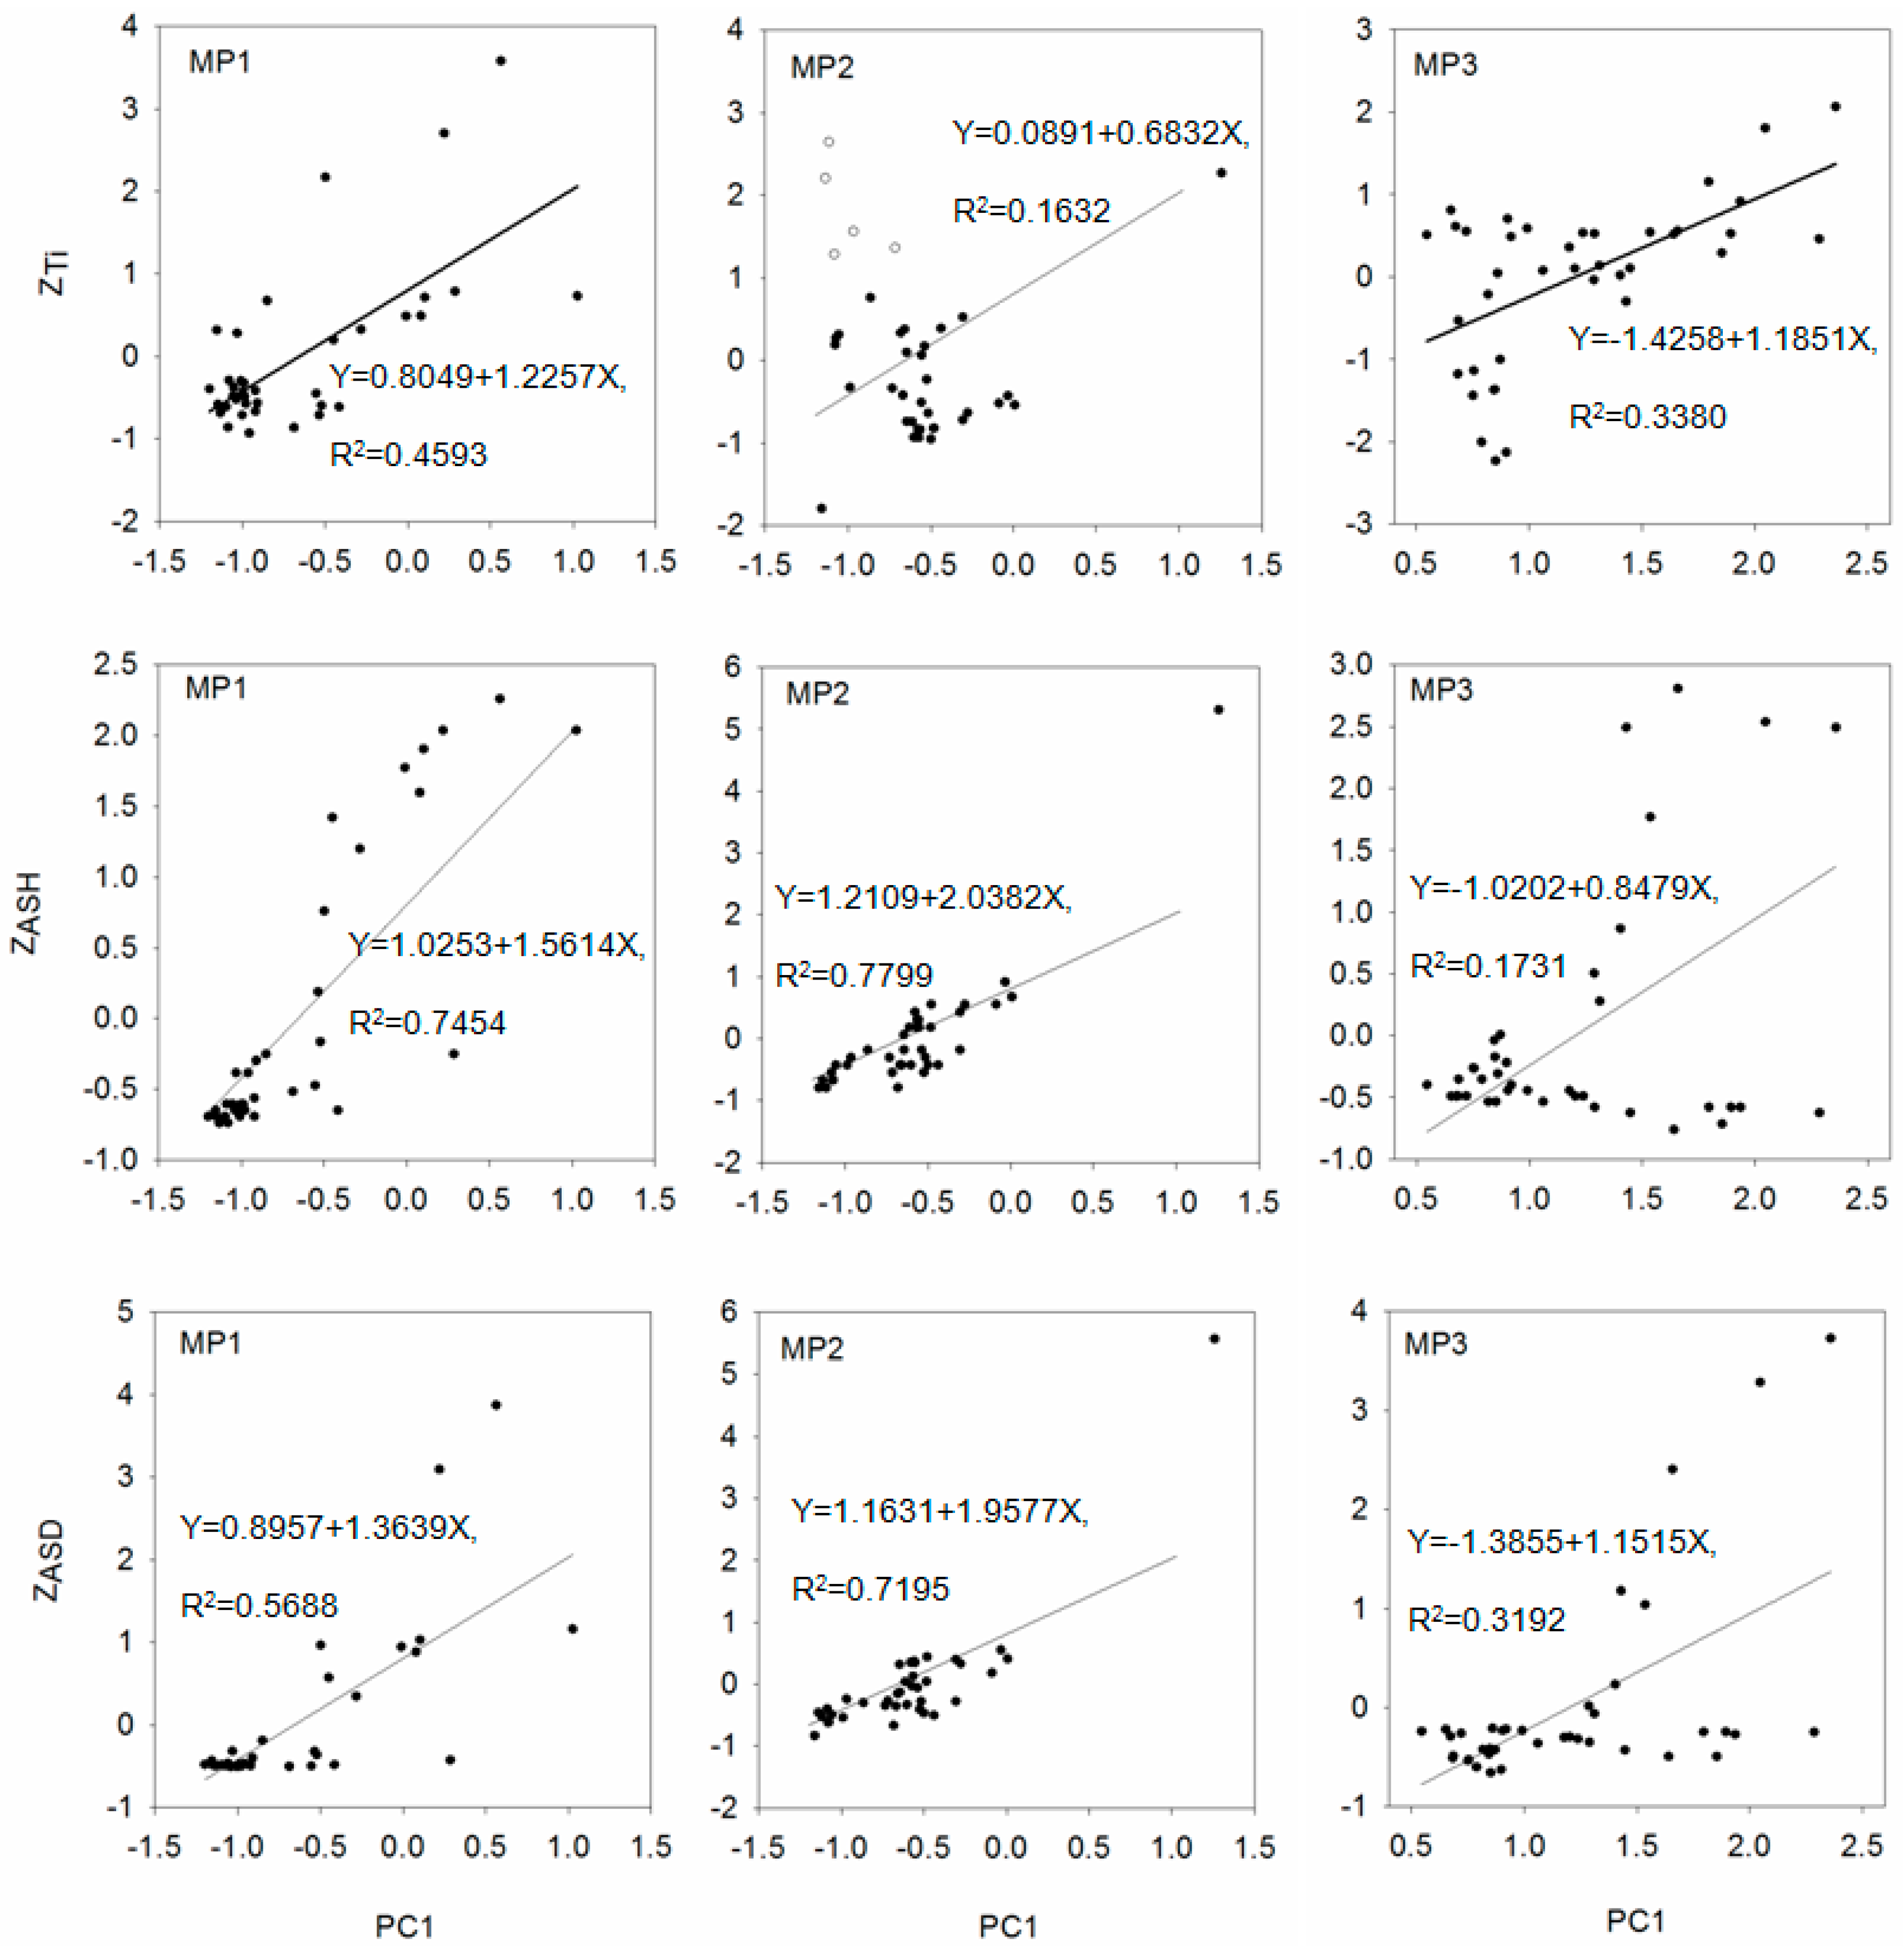
3.3. Principal Component Analysis

The statistical identification of the main factors that control the elemental distribution in peat has been based on PCA of the complete dataset, using a varimax with Kaiser normalization rotation method. Three principle components have Eigen-values >1 and explain 85% of the total variance of element concentrations in the three cores (Table 4). For all elements, at least 68% or more of their variance is explained by the exacted components (Table 4). The first component (PC1) accounts for a large proportion of the variance (41.9%) and is characterized by the high positive loadings (0.777–0.941) of Ba, Co, Cr, Mo, Ni, Sr and Tl (Table 4). The second component (PC2) accounts for 21.8% of the total variance and is dominated by the high positive loadings (0.865–0.957) of As, Cu and Sb, and a moderate positive loading of Cd (0.535). The third component (PC3) accounts for 21.7% of the total variance and is characterized by the high negative loading of the 206Pb/207Pb ratio (−0.894), the high positive loadings of the 208Pb/206Pb (0.888) and Pb (0.789), and the moderate positive loading of Zn (0.561). It is worthy to note that Cd also has a moderate positive loading (0.455) associated to PC1 and a moderate positive loading (0.516) associated to PC3, and Zn also has a moderate positive loading (0.512) associated to PC1.

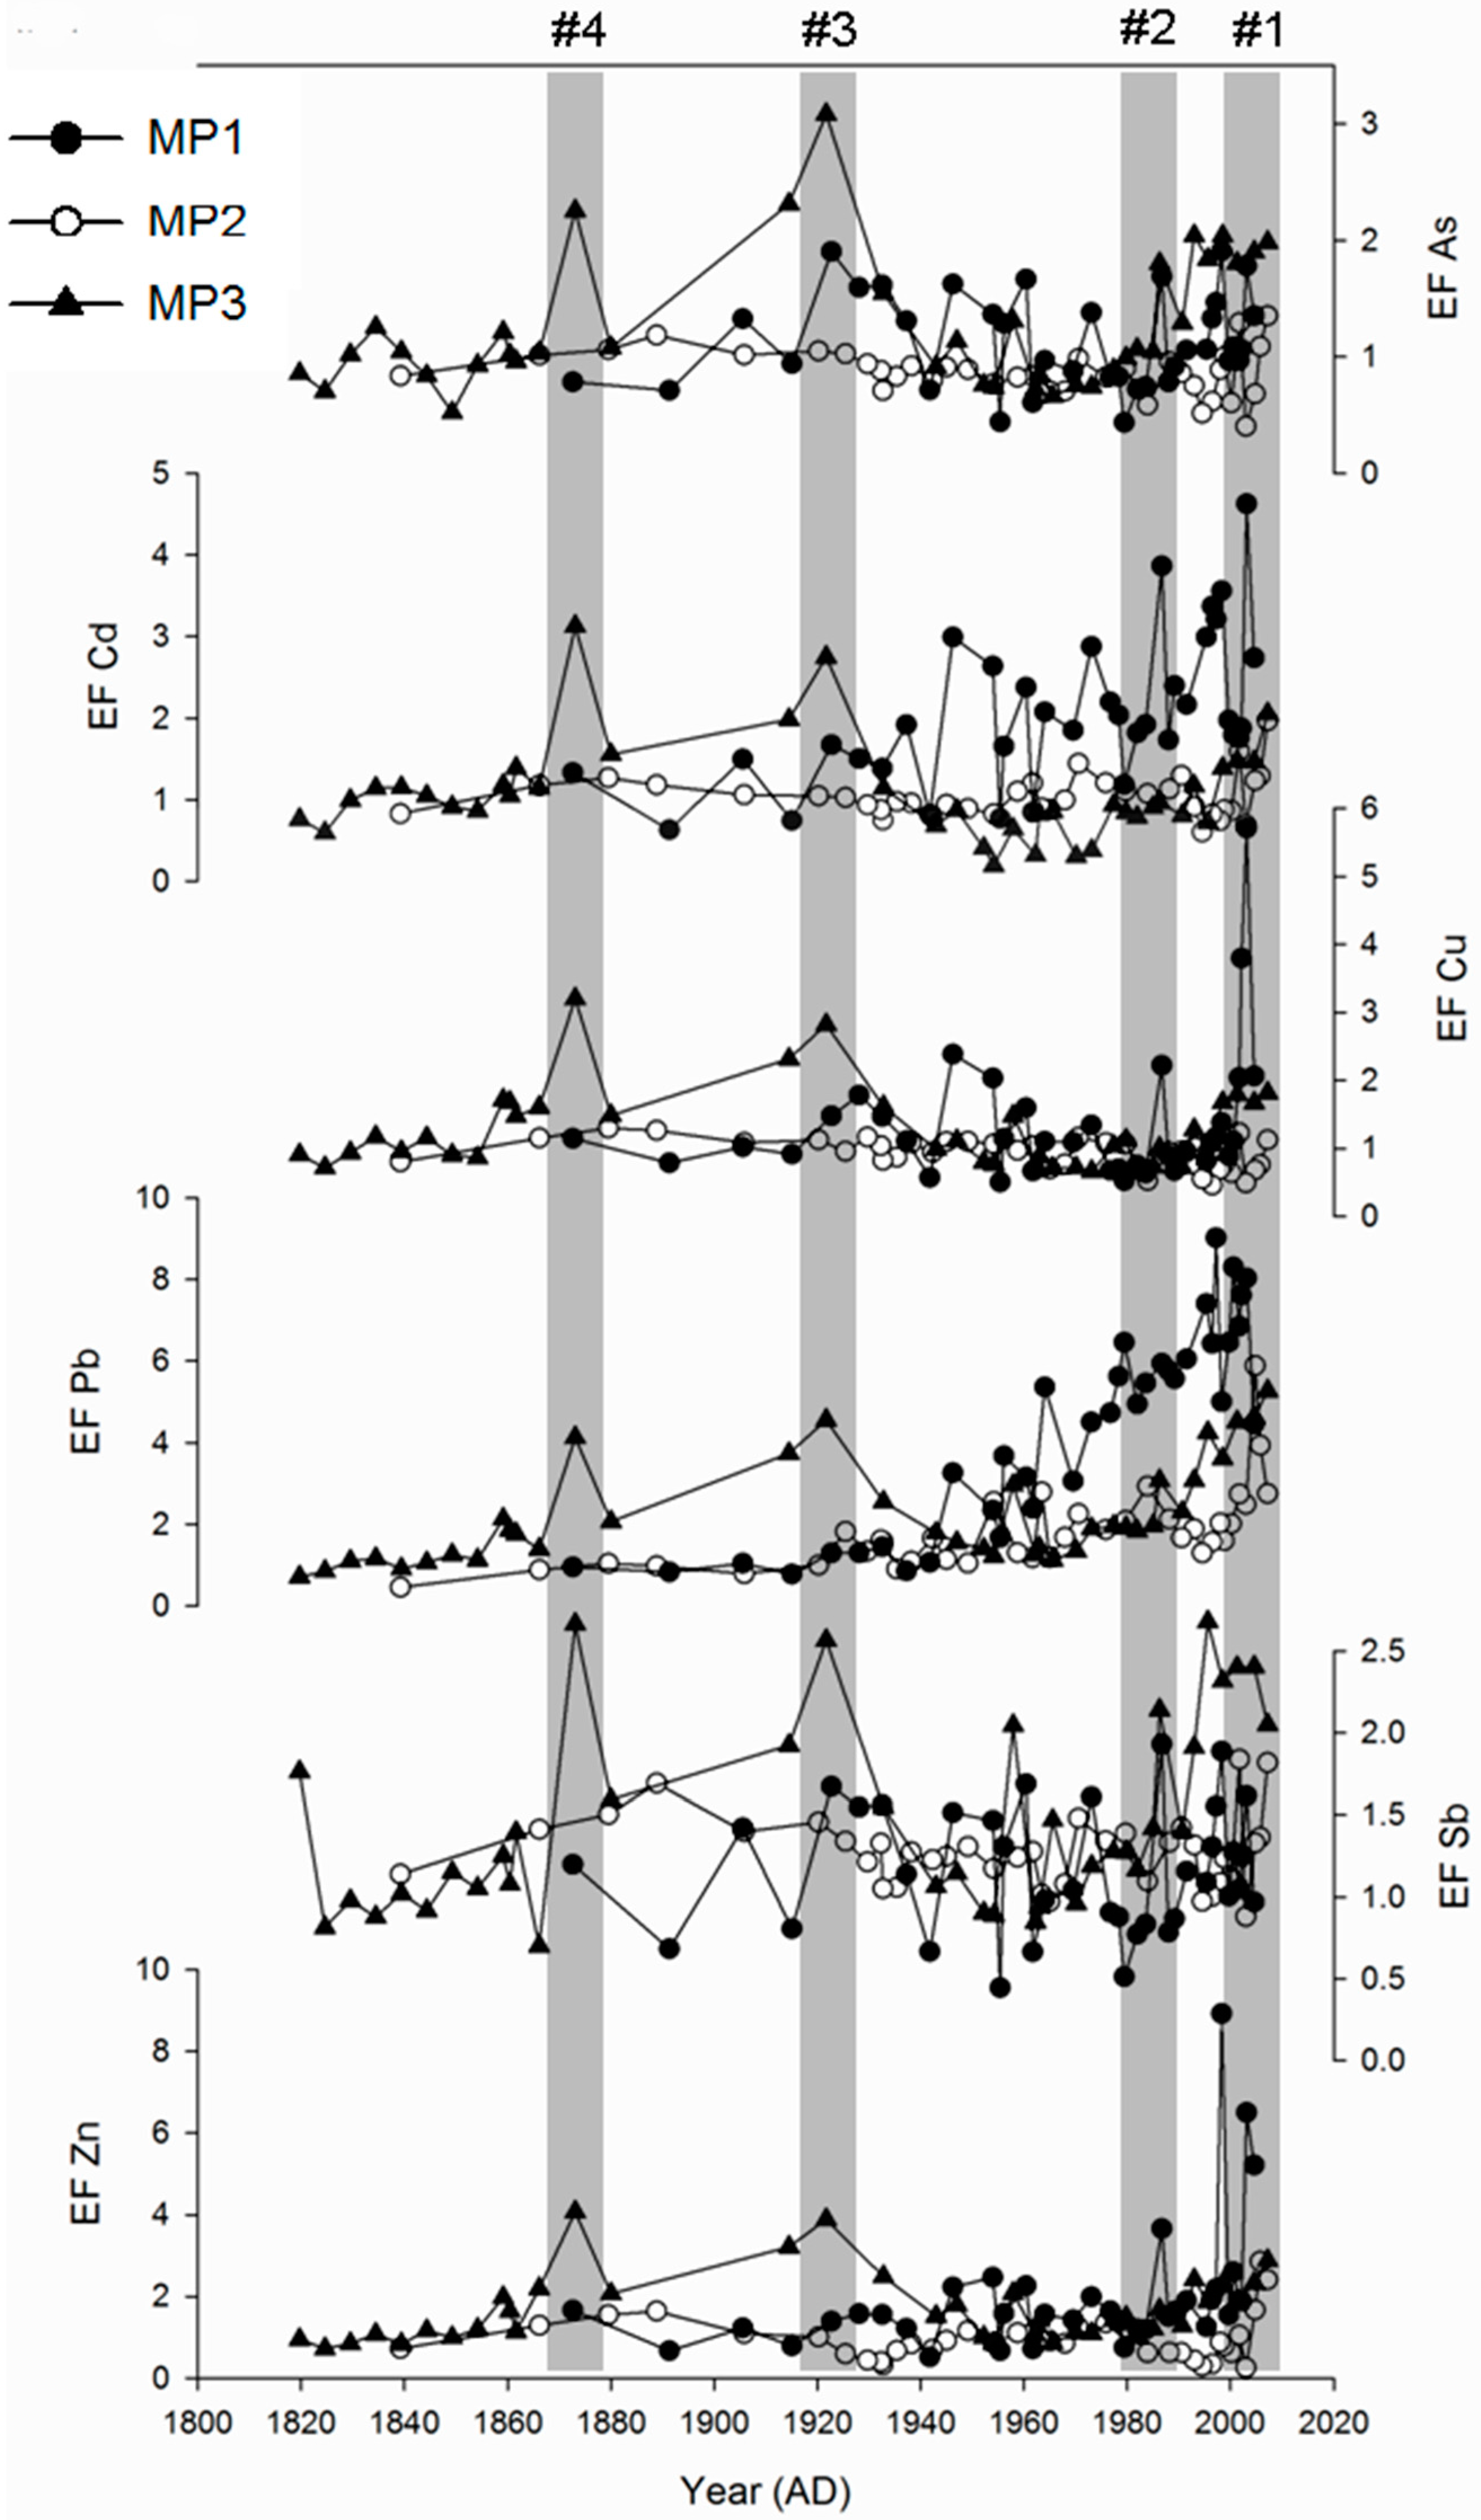
3.4. Enrichment Factor Analysis

Combined with the established local pre-industrial backgrounds, enrichment factors were calculated through normalizing the measured heavy metal content (As, Cd, Cu, Pb, Sb and Zn) with respect to a reference metal (i.e., Ti) for metal concentrations in the ombrotrophic upper profiles. Their temporal variations were shown in Figure 4 for the three cores. Given an EF > 1 suggesting that the sample is enriched relative to background, four peaks of EFs were supposed to be in the following order: #1 in the 2000s, #2 in the 1980s, #3 in the 1930s and #4 in the 1870s.

4. Discussion

4.1. The Ombrotrophic vs. Minerotrophic Character of the Peat

The ombrotrophic peats receive their inorganic minerals predominantly from the atmosphere and are mainly composed of Sphagnum and sedge remains, but minerotrophic peats, as the name suggests, are also fed by surface runoff and groundwaters and are relatively rich in inorganic components [14]. Motianling peatland is about 2.6 km from the southwestern bank of Da’erbing Lake which is a lava-dammed lake with an altitude of ca. 1200 m (Figure 1B). A large number of types of mires are widely distributed on lakeside, footslope as well as hillside, with a transect of eutrophic, mesotrophic and oligotrophic mires from the lakeside up to the hillside [63]. The rain-fed oligotrophic peatland on the hillside is underlain by the permafrost of the basalt weathering crust and predominantly consists of mosses (Sphagumacutifolium, Sphagnum girgensohnii), ericaceous shrubs (Ledumpalustre var. angustum, Vacciniumvitis-idaea), and a sparse pine cover (Pinuspumila, Larixgmelini) [26,63]. Physicochemical properties of the peat (i.e., DBD, WAT, ASH, TOC and TN) as well as other proxies reported elsewhere [28] have indicated its ombrotrophic character in the upper sections (above 45 cm for MP1, 50 cm for MP2 and 60 cm for MP3) and minerotrophic character in the lower sections. More evidence from the degree of peat decomposition, pH and grain-size composition can be found here to support such structural characterization of peat. In the lower sections, peats are much more decomposed than the above sections as shown by the C/N ratios (Figure 2) and have a higher pH value (averaged 4.6, 4.8 and 4.9 for the upper sections of MP1, MP2 and MP3; 5.1, 5.3 and 5.3 for the corresponding lower sections). Furthermore, the homogeneous fine grain minerals reflected the sole possibility of the plant cover in the area. At present, the dominant plant is Sphagnum, so it could be inferred that the Sphagnum had grown in this area, and thus formed a peat bog. With the development of peatland, the deeper sections of peats with high ash content and large degree of decomposition were probably affected by thawing of the frozen soil in the bottom of cores and they have a minerotrophic nature.
Stable Pb isotope ratios were used for the first time ever to indicate the ombrotrophic versus minerotrophic system with the logic that a high ratio of 206Pb/207Pb (≈1.2, close to the typical crustal soil [64]) could fingerprint that lithogenic components contribute more to the Pb content in the peat at the base of the individual profiles. Here, in the lower section of each core, ratios of 206Pb/207Pb fluctuate slightly around 1.19 (1.1912 ± 0.0018 (n = 9) for MP1, 1.1896 ± 0.0024 (n = 8) for MP2, and 1.1868 ± 0.0032 (n = 10)) and are very close to the signature of the typical of crustal soil, which is just corresponding to the boundary of minerotrophic and ombrotrophic peats (Figure 5). In addition, the temporal variations of 206Pb/207Pb ratio are consistent with the ash content profiles for three peat cores (r = 0.624, P < 0.001, n = 114). Therefore, we think these underlying peats show the most lithogenic signatures. In addition, previous studies also showed that these peats were affected by the effects of permafrost [56] or the addition of volcanic ash during peat formation process [65]. All in all, the boundary partition above is reasonable and ombrotrophic peat is appropriate to be used as a record of atmospheric metal deposition in northeast China.
Figure 5. Temporal profiles of 206Pb and 207Pb ratios and their comparisons with ash content ofthree core samples from Motianling peatland in Great Hinggan Mountains, NE China. Sections below 45 cm (MP1), 50 cm (MP2), and 60 cm (MP3) are attributed to minerotrophic peat and marked by a grey dashed box.
Atmosphere 06 00380 g005
Figure 6. Unsupported 210Pb and 137Cs activity (Bq∙kg−1) profiles plotted against cumulative mass depth (g∙cm−2) in the three cores from Motianling peatland in Great Hinggan Mountains, northeast China, and comparison of the chronology estimated by 210Pb CRS model with the 137Cs time marker.
Atmosphere 06 00380 g006

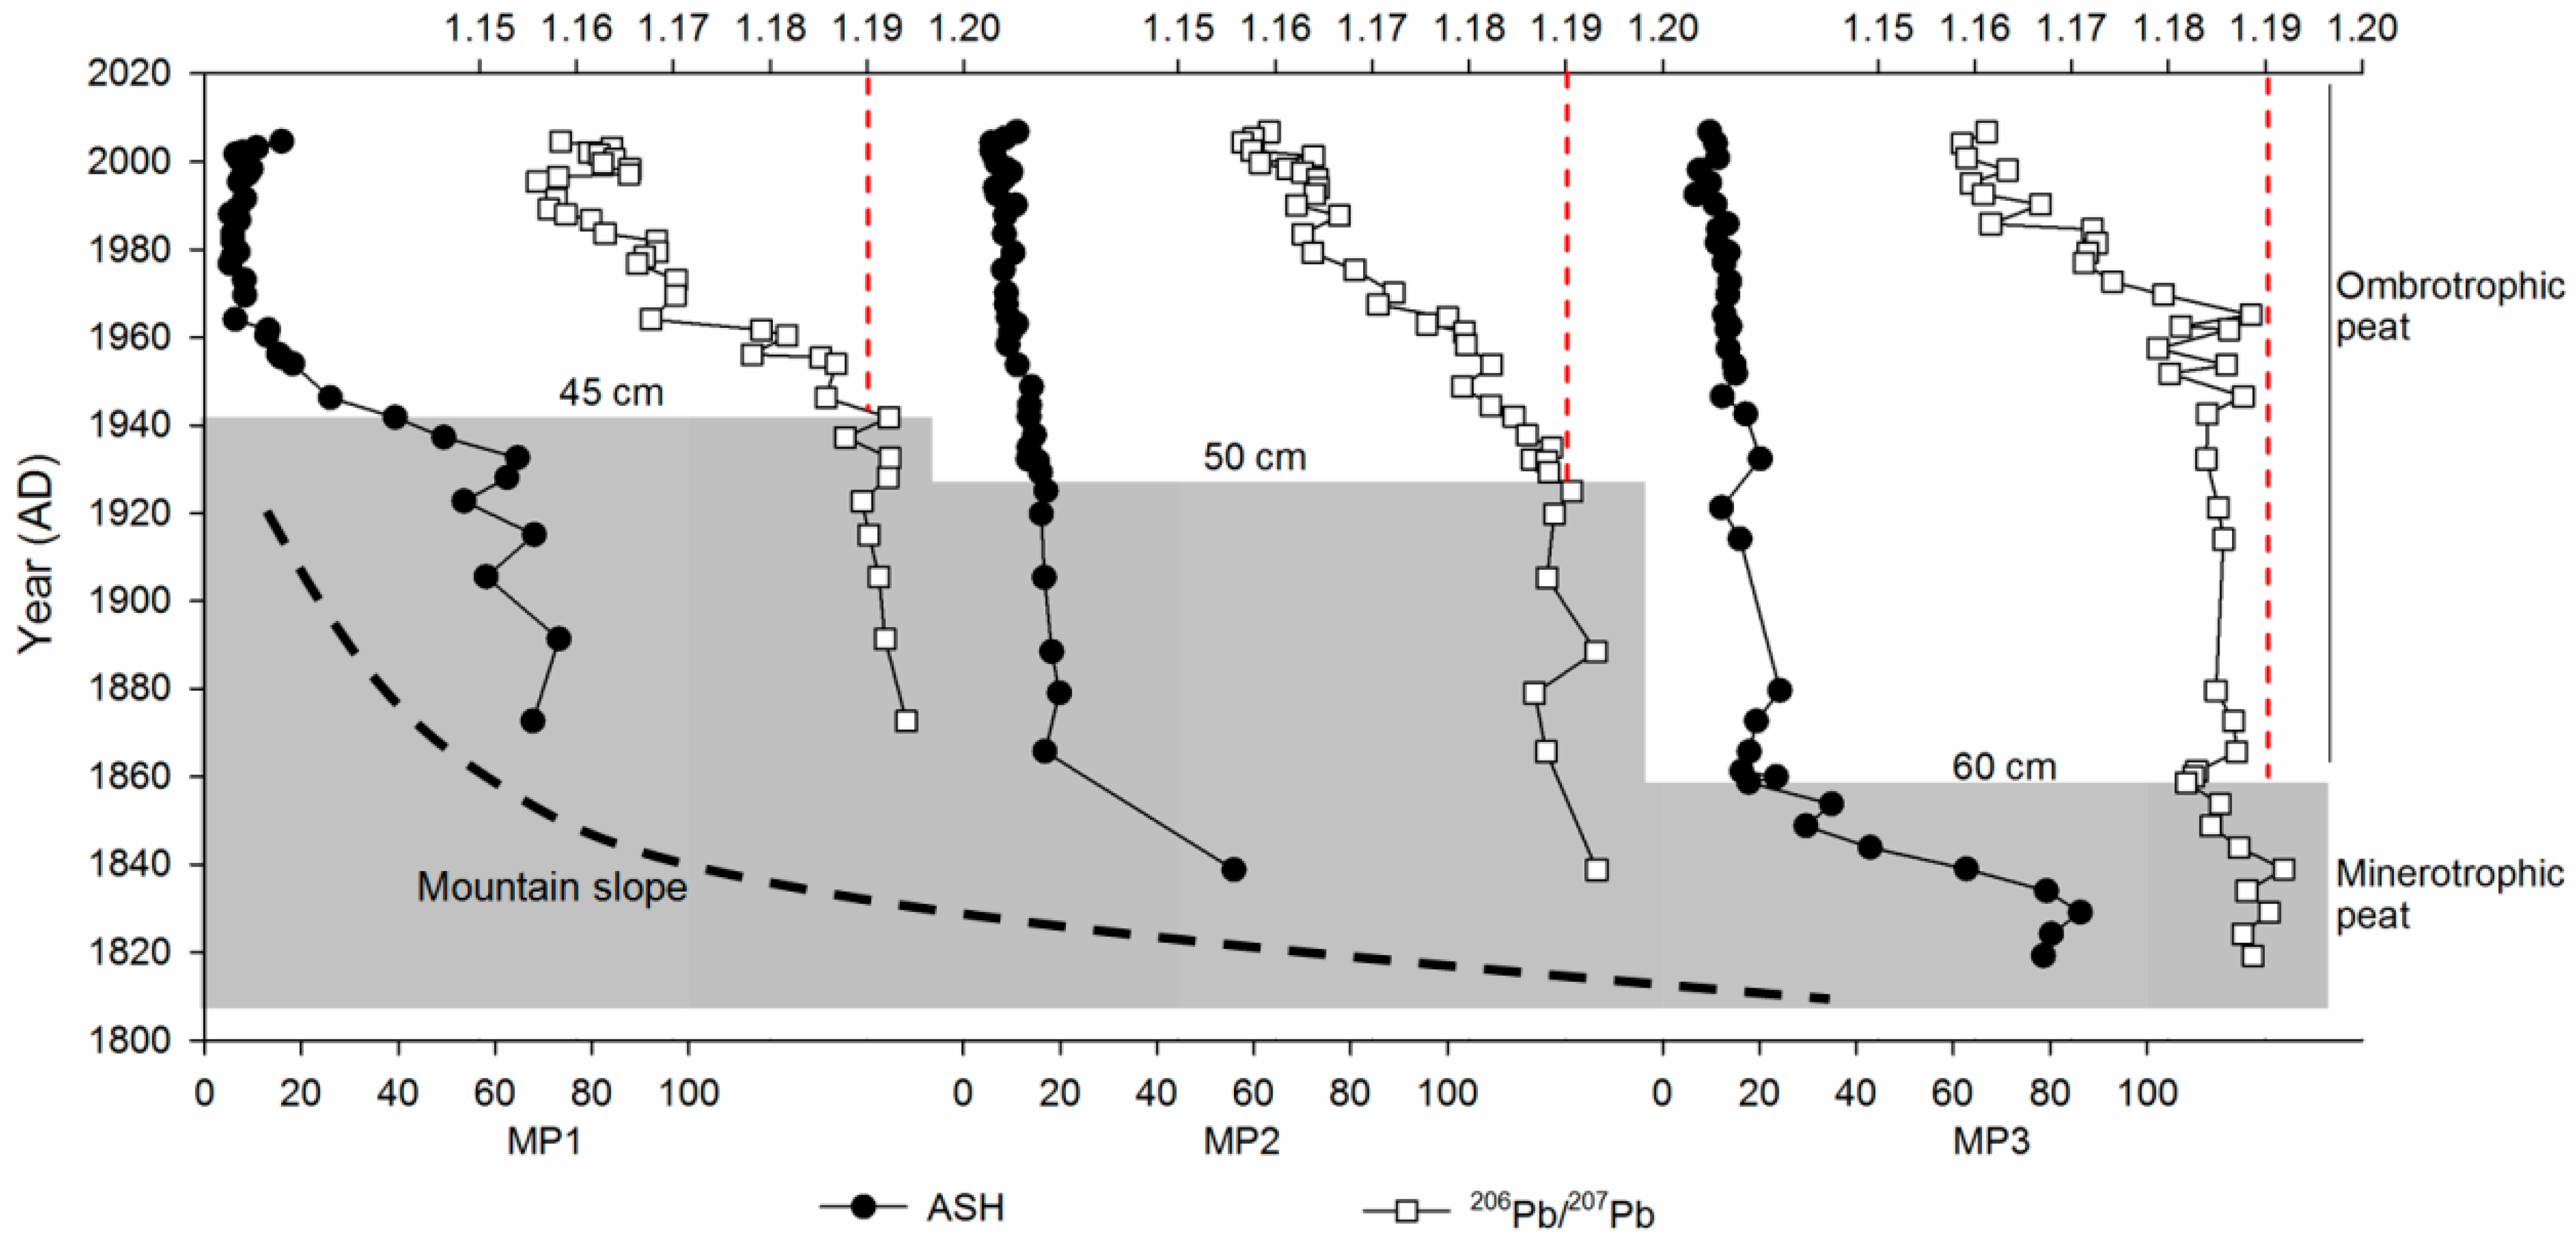
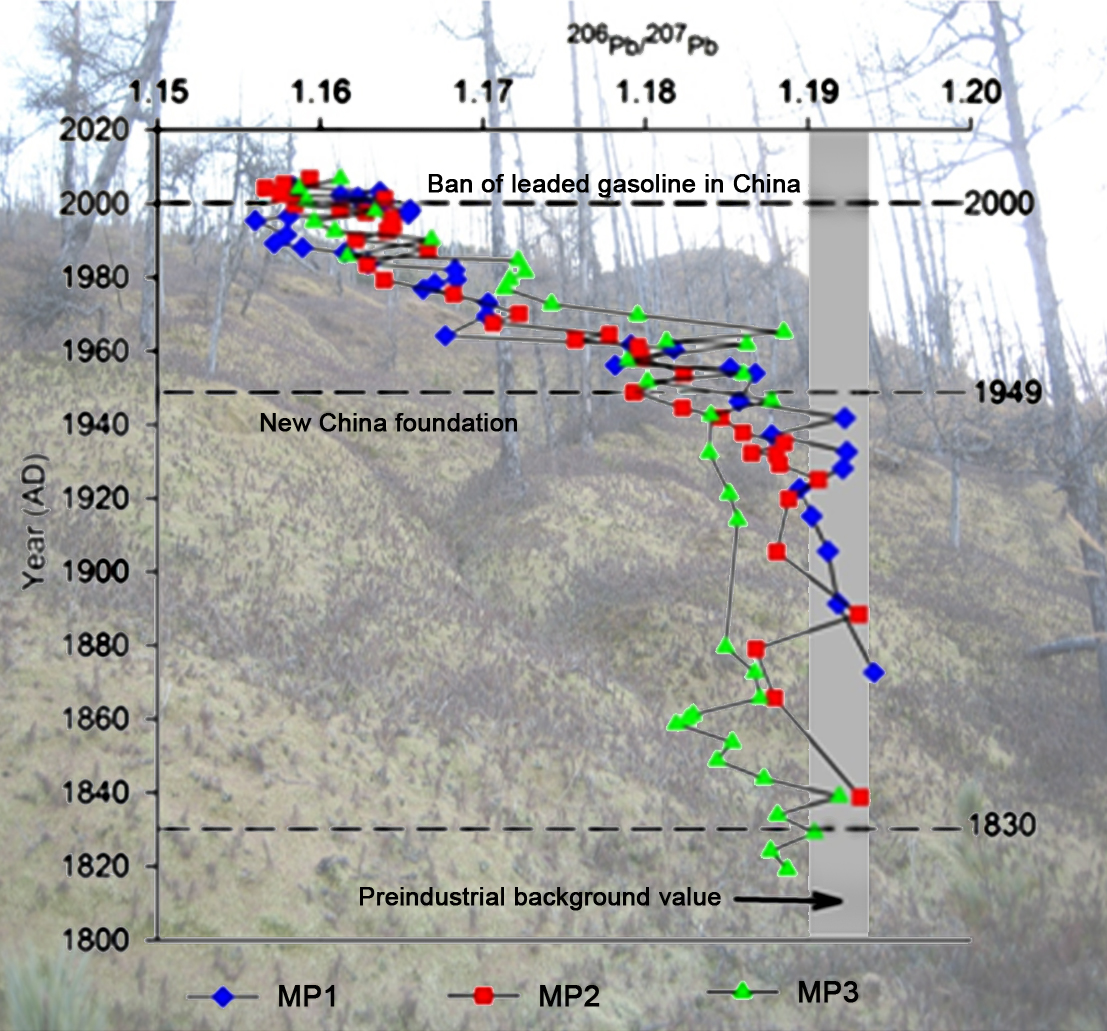
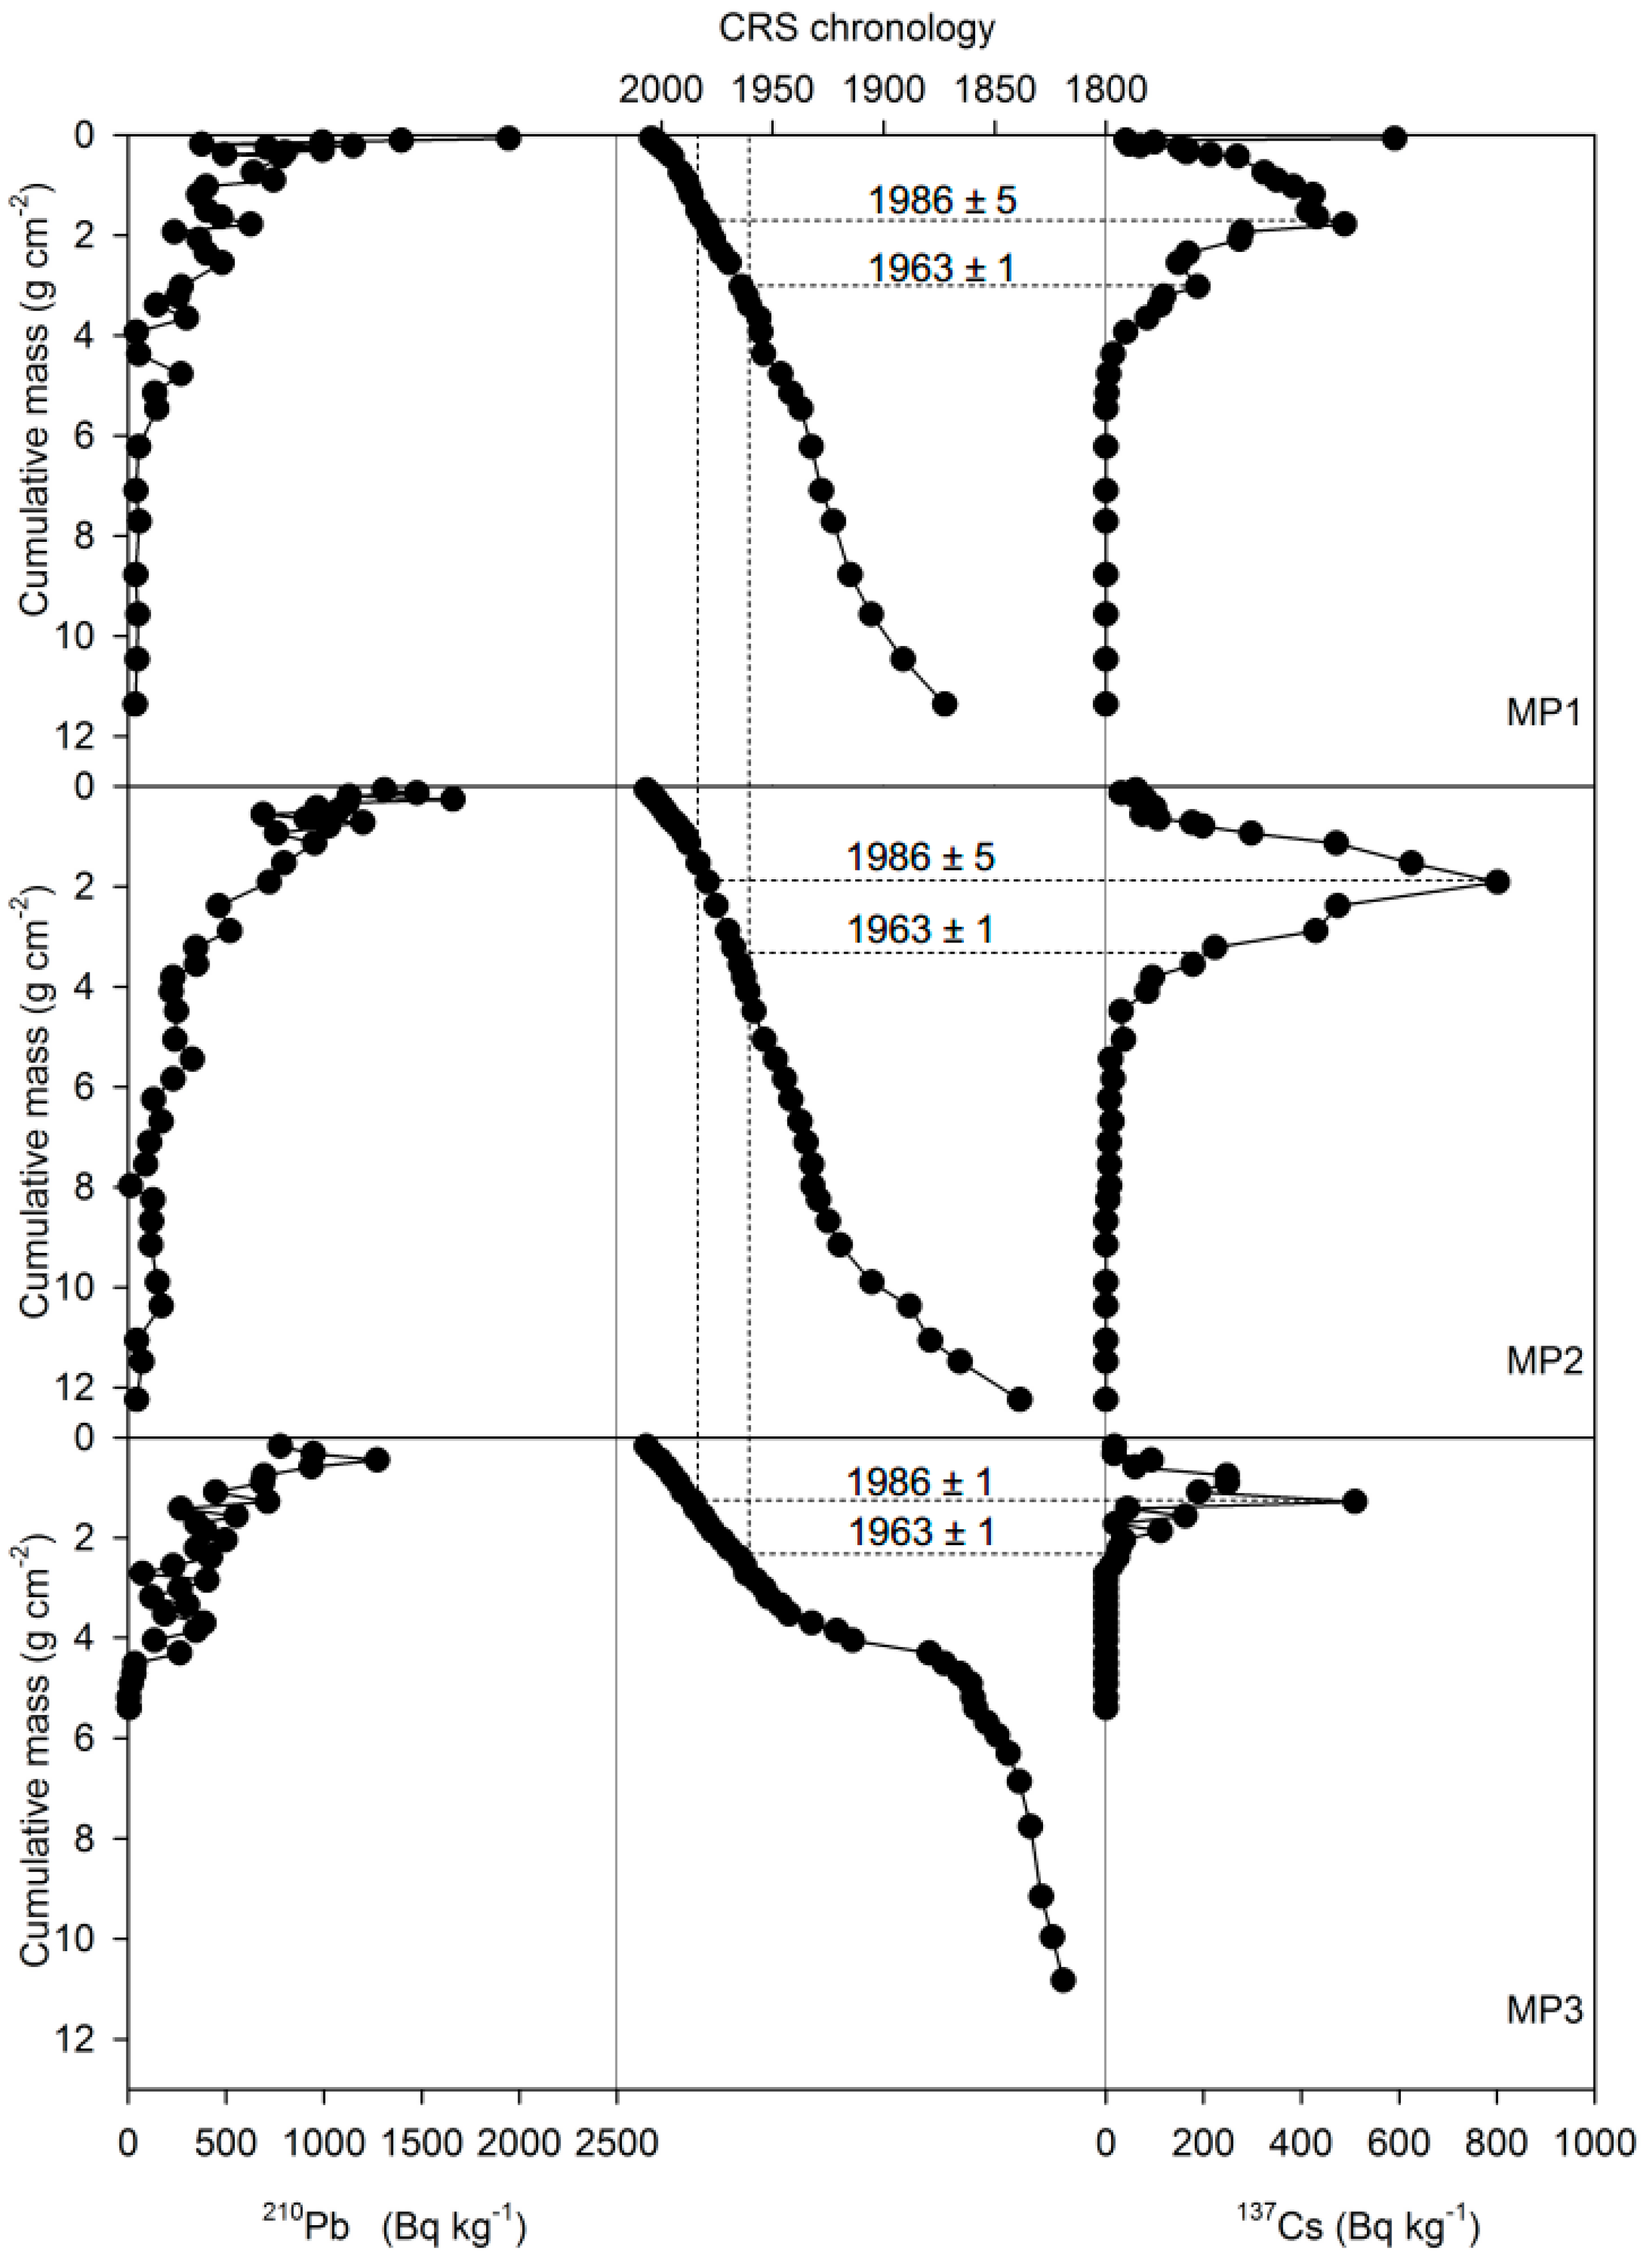
4.2. Validation of the Peat Age

Depth profiles for 210Pb and 137Cs activities have been plotted with peat depth in a normal scale [28], which did not take into account the influence of compaction. The major 137Cs peak was assigned to the weapon’s testing peak ca. 1963 in the two previous reports [26,28]. This leads to the conclusion that the 137Cs peak dates have a ca. 20-yr younger age than 210Pb chronology, although the average PAR derived from both ages for the past 45 years is in good agreement. As a result, the 210Pb and 137Cs activities were re-plotted against cumulative peat mass (g∙cm−2) (Figure 6). Unsupported 210Pb activities generally show decreasing trend with depth from the surface of the peat cores until negligible concentrations of the unsupported 210Pb were attained at depth of 6.22 g∙cm−2 (corresponding to 51 cm) for MP1, 11.06 g∙cm−2 (59 cm) for MP2 and 5.19 g∙cm−2 (59 cm) for MP3. Three 210Pb chronologies were calculated using the constant rate of supply model (CRS) and they are validated by 137Cs distribution (Figure 6). The 137Cs profiles reflect their historical fallout and exhibit an obvious subsurface peak with maximum activity at depth of 1.78 g∙cm−2 (23 cm) for MP1, 1.91 g∙cm−2 (17 cm) for MP2, and 1.28 g∙cm−2 (15 cm) for MP3. A smaller peak is detected in deeper layers, 3.03 g∙cm−2 (33 cm) for MP1, 3.81 g∙cm−2 (27 cm) for MP2, and 2.56 g∙cm−2 (31 cm) for MP3. The major subsurface peaks here were corresponding to 1986 and the smaller peaks below them were corresponding to 1963, because widespread fallout of 137Cs in the Northern Hemisphere after the Chernobyl reactor disaster in 1986 is more likely to form the subsurface peak with maximum activity in 137Cs profile [66]. Significant fallout of 137Cs after the Chernobyl accident was also reported in the Xiaolongwan lake sediment in Jilin province, northeast China [67] and in the coastal wetland sediment of the northern Beibu Gulf, South China Sea [68]. Such time markers are very consistent with the 210Pb chronology within a five-year deviation (Figure 6). In addition, the 210Pb ages were also validated by 14C dates from another core. Lin et al. [63] reported three 14C ages for a 106 cm long core from the same peatland and the calibrated 14C age (2σ) at 75 cm depth layer is 176 y∙cal.before present (BP) (170 ± 60 y∙BP). This is in good agreement with our 210Pb age, 190 ± 20 y∙cal. BP at 78 cm depth, which elucidates that our chronologies established from 210Pb and 137Cs techniques are coherent and reliable.

4.3. Geochemical Variability of the Peat Records Derived from PCA Analysis

The first component (PC1) clustered typical lithogenic elements of Ba and Sr [69,70], and also TMs of Co, Cr, Mo, Ni and Tl; thus, PC1 seems to reflect the geogenic contribution. The second component (PC2) clustered typical pollution elements of As, Cd, Cu and Sb, and probably represented a long distance source because the enrichment of As was interpreted as long-range signal by Muller et al. [51]. The third component (PC3) clustered Zn, Pb and its isotopes, and PC3 seems to be associated with local anthropogenic source from leaded gasoline burning and from ore mining and processing such as the Bairendaba Ag-Pb-Zn deposit (as shown in Figure 1), one of the largest polymetallic deposits in this region [71]. It is worthy noting that Cd also has a moderate loading (0.455) associated to PC1 and a moderate loading (0.516) associated to PC3, and Zn also has a moderate positive loading (0.512) associated to PC1.Therefore, both Cd and Zn would also be affected by the geogenic contribution (20.7% and 26.2%), and 26.6% of Cd would be derived from industrial manufacturing and fossil-fuel combustion.
Figure 7. Variation of principal component scores (PC1, PC2 and PC3) against depth for the three peat cores from Great Hinggan Mountain, northeast China.
Atmosphere 06 00380 g007aAtmosphere 06 00380 g007b
The records of factor scores for each component are presented in Figure 7. As stated in Cortizas et al. [49], factor scores are non-dimensional, average centered values and can measure the intensity of each principal component. In the surface or near-surface (ca. 5 cm depth of MP1 and MP2, and 25 cm depth of MP3) of the cores, all three components showed an increasing trend with depth upward, indicating increasing trends of mineral dust content and atmospheric metal pollution in the peat. In the lower sections, PC3 showed relative stable and significant correlations (P < 0.001) between cores, r = 0.902 (MP1 and MP2), 0.747 (MP1 and MP3) and 0.848 (MP2 and MP3), respectively. This was mainly a result of the continuous and stable local anthropogenic pollutants input. However, the other two components showed quite similar and large variations with depth, which was probably due to the long-distance contributions of pollution aerosol and dust. In a previous study [28], the typical lithogenic element (Ti) was used to successfully reconstruct recent deposition of atmospheric soil dust (ASD). The significant correlations between factor scores of PC1 and Ti concentration, ash content and ASD suggest that PC1 is indicative of natural/geogenic sources (Figure 8). Variations of PC1 are similar as suggested by their significant correlations between MP1 and MP2 (r = 0.672, P < 0.001) and between MP1 and MP3 (r = 0.397, P = 0.015). The large values of PC1 and PC2 at the bottom of cores would be resulted from the sediment/soil character of the peat, which is also in agreement with the fact that part of the variation in the concentrations of Cd is associated with geogenic sources.
Figure 8. Correlations between factor scores of PC1 (indicative of natural/geogenic sources) and Ti concentration, Ash content (ASH) and the calculated depositional rate of atmospheric soil dust (ASD). Data of Ti, ASH and ASD are from Bao et al. [28] and are in normalized formation. For regression of PC1 against Ti in MP2 core, five abnormal high values of Ti in the near-surface (at 3.5 cm, 7.5–9.5 cm and 15 cm depth) are excluded and indicated by a white dot.
Atmosphere 06 00380 g008

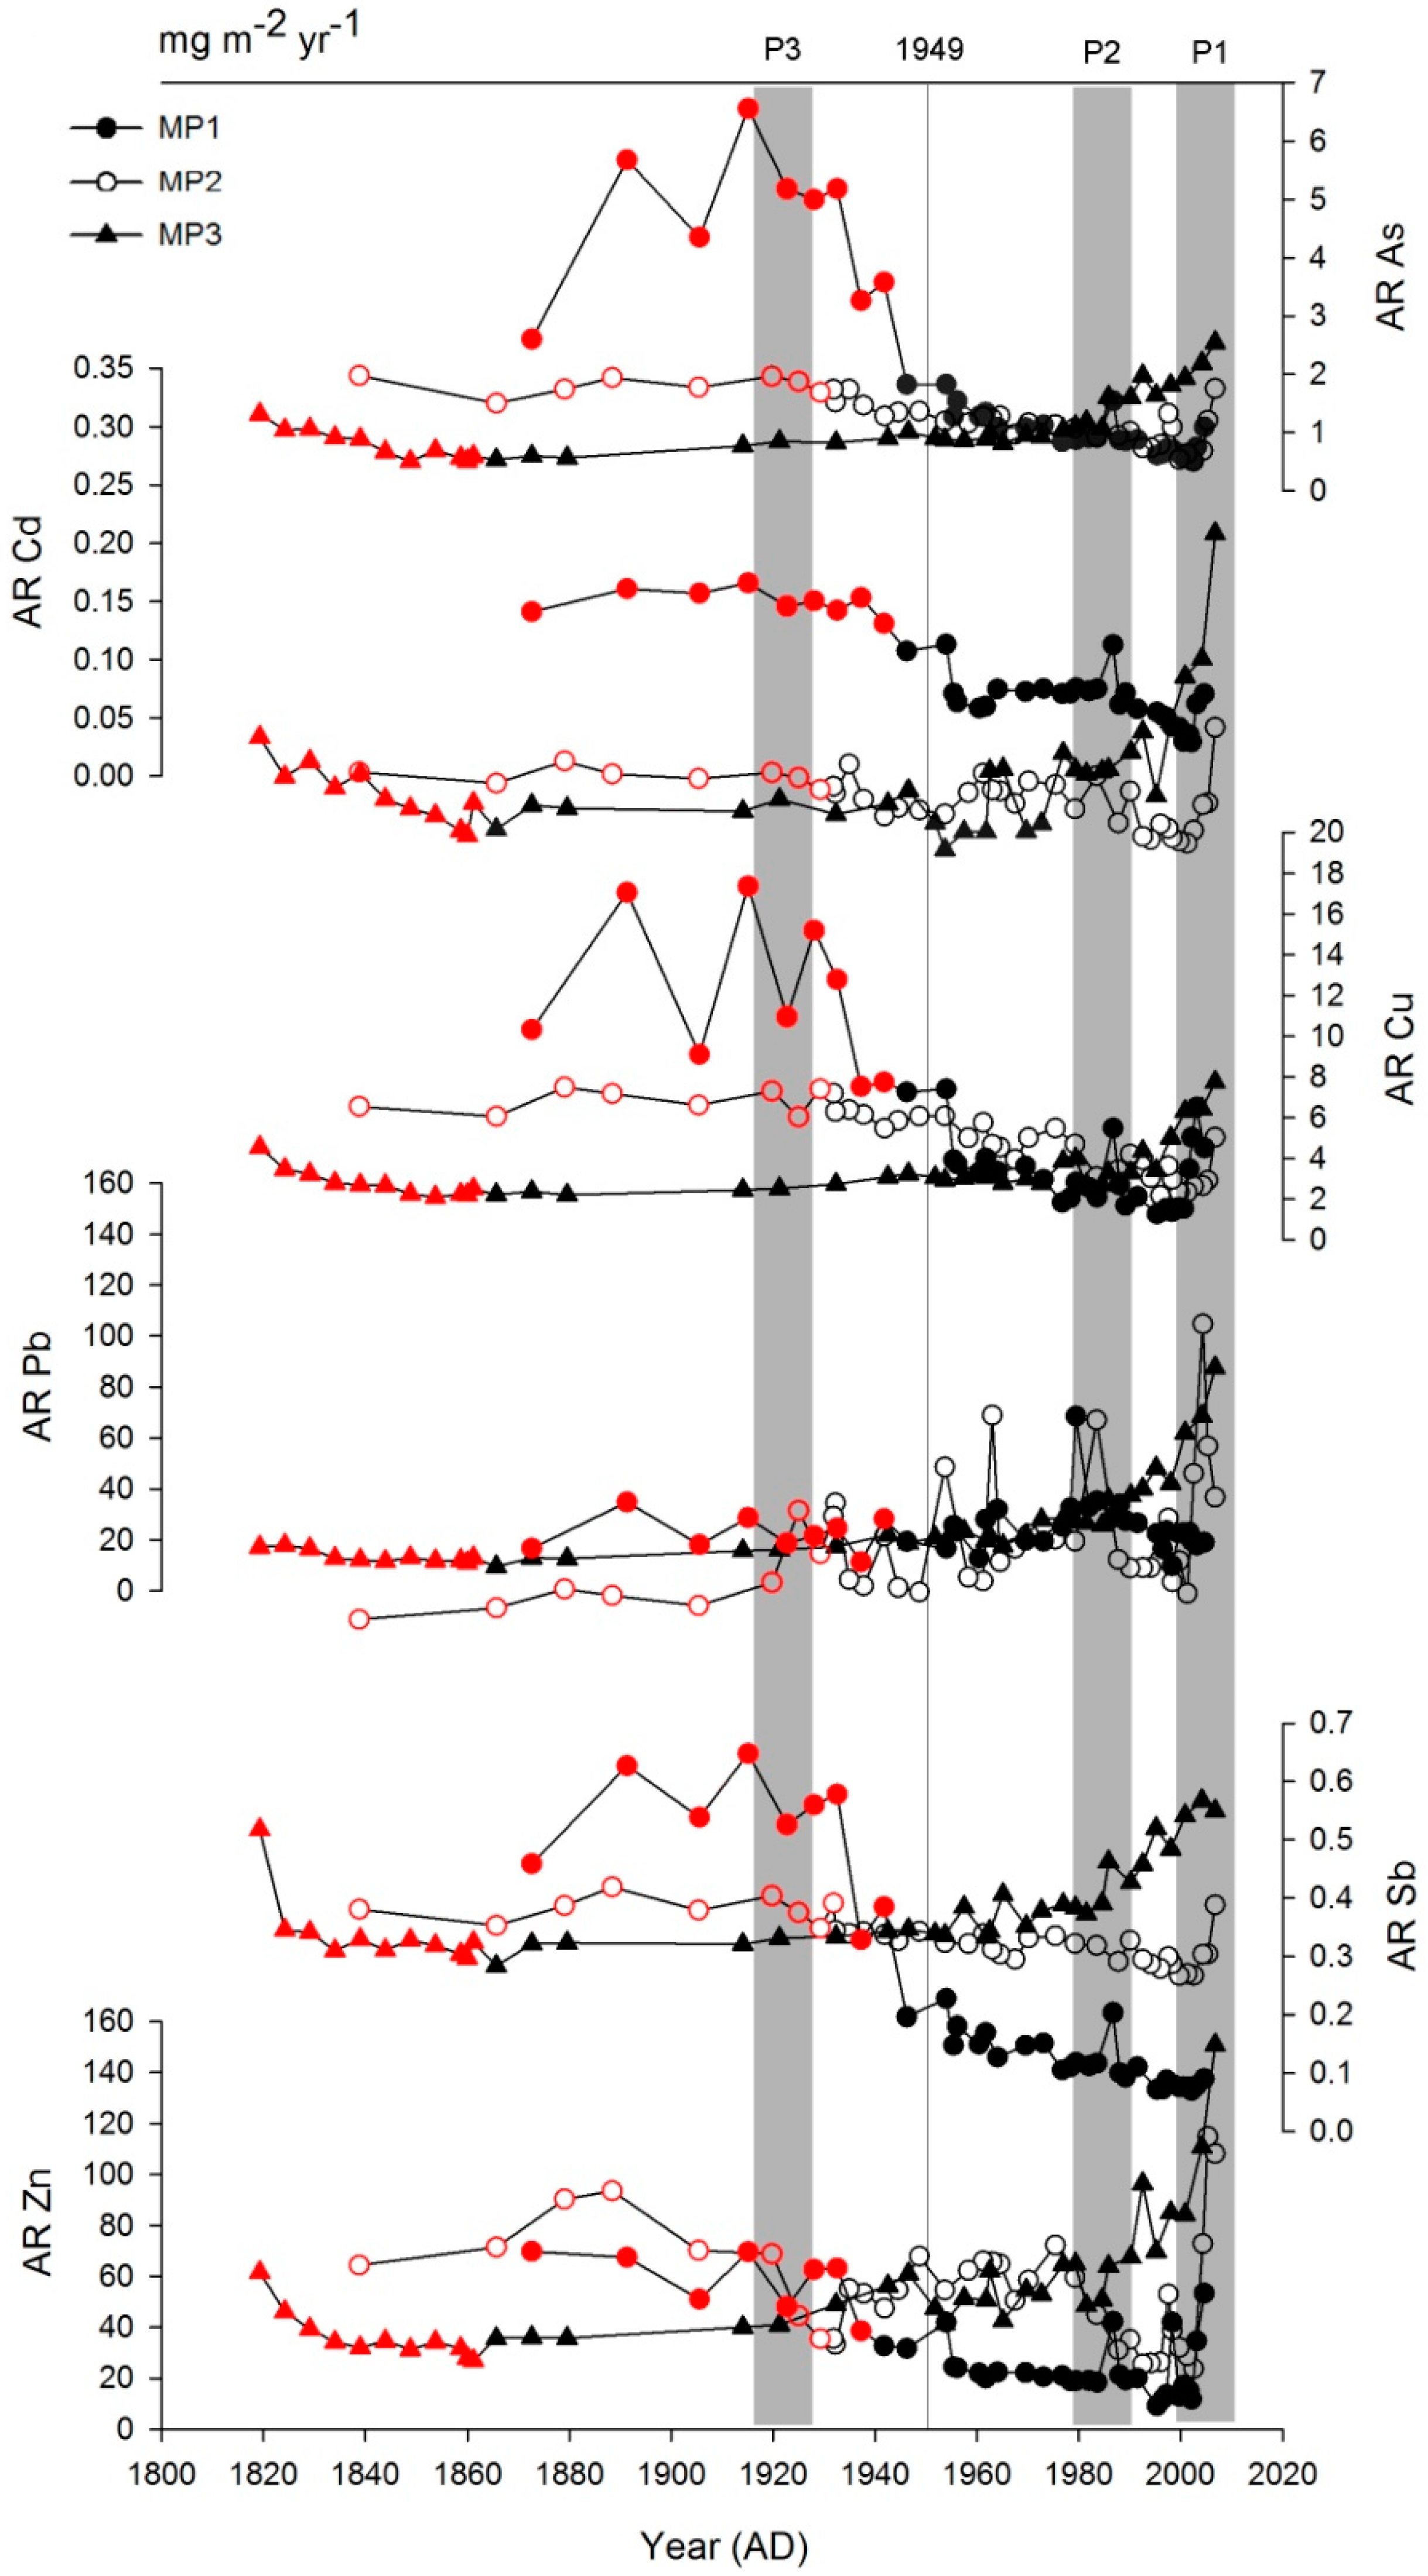
4.4. Historical Trends of Accumulation Rates for the Pollution Metals

Assuming the relationship between peat accumulation and the age explained before [28], we can assign each peat section an estimated age and determine the ARs’ evolution of those elements (Figure 9). There were large AR values for the metals in the minerotrophic sections of the bottom cores, and this pattern is consistent with the vertical distribution of elements (Figure 3), which would be controlled by the large abundance of mineral matter. The ARs of these elements in these sections could not represent the external atmospheric fluxes of metals deposition and were excluded using different color of dots for those points.
Figure 9. Temporal variation of accumulation rate (AR, mg∙m−2∙yr−1) of typical pollution elements (As, Cd, Cu, Pb, Sb and Zn) identified by PCA for three cores from Motianling peatland in Great Hinggan Mountains, northeast China. The minerotrophic sections (i.e., fen) below 45 cm for MP1, 50 cm for MP2 and 60 cm for MP3 are marked by red dots. The year of New China foundation in 1949 was indicated by a grey line. Three peaks of ARs for these metals were observed since the 2000s (P1), in the 1980s (P2) and in the 1930s (P3).
Atmosphere 06 00380 g009
For the above ombrotrophic sections, an increasing period of ARs for these metals since the 2000s (p1) and a peak of ARs in the 1980s (p2) were observed in the three cores. Both periods are corresponding to the variation of EFs in #1 and #2. Starting in 1949 through the 1980s, there was huge industrial and agricultural efforts for economic development due to government policies, for example, the Great Leap Forward in 1958–1960. Since 1978, China pursued relatively open economic policies (i.e., Reform and Opening up) and has entered the most robust stage of its industrial revolution and economic growth. Total energy consumption and coal consumption increased by 15.1% from 1952–1990 and by 22.9% from 1990–2010; emissions of industrial pollutants increased annually by 14.9% from 1952–1990 and by 12.2% from 1990–2010; the proportion of total pollution emitted by industries in China was 42.6% from 1952–1990 and 43.6% from 1990–2010 [72]. Therefore, the consistency of ARs and EFs support the fact that recent industrial development since Reform and Opening up in 1978 (p2) and modern large-scale urbanization associated with increasing vehicle emissions (p1) have led to environmental pollution and thus elevated records of these trace metals in peat.
In addition, it is worthy noting the period in the 1930s, although it was located in the minerotrophic section of MP1. The elevated ARs TMs, especially for Pb, were observed in the period (p3) for MP2 and MP3 cores. This characterization only corresponds to the variation of EFs in the same period (#3), which occurred during the long-term war periods before the foundation of New China and would have resulted from pollutants due to combustions of fuel and ecological damage due to deforestation and energy exploitation in China. The peak in the 1870s (#4) would be explained by the onset of industrial revolution in China and extensive human migration and cultivation in northeast China in the late Qing dynasty [73]; however, this character was not found from ARs whose enrichment character would be probably offset by variation of PAR due to great amount of minerals. Therefore, these periods correspond quite well to the specific social stages during the development history of China.

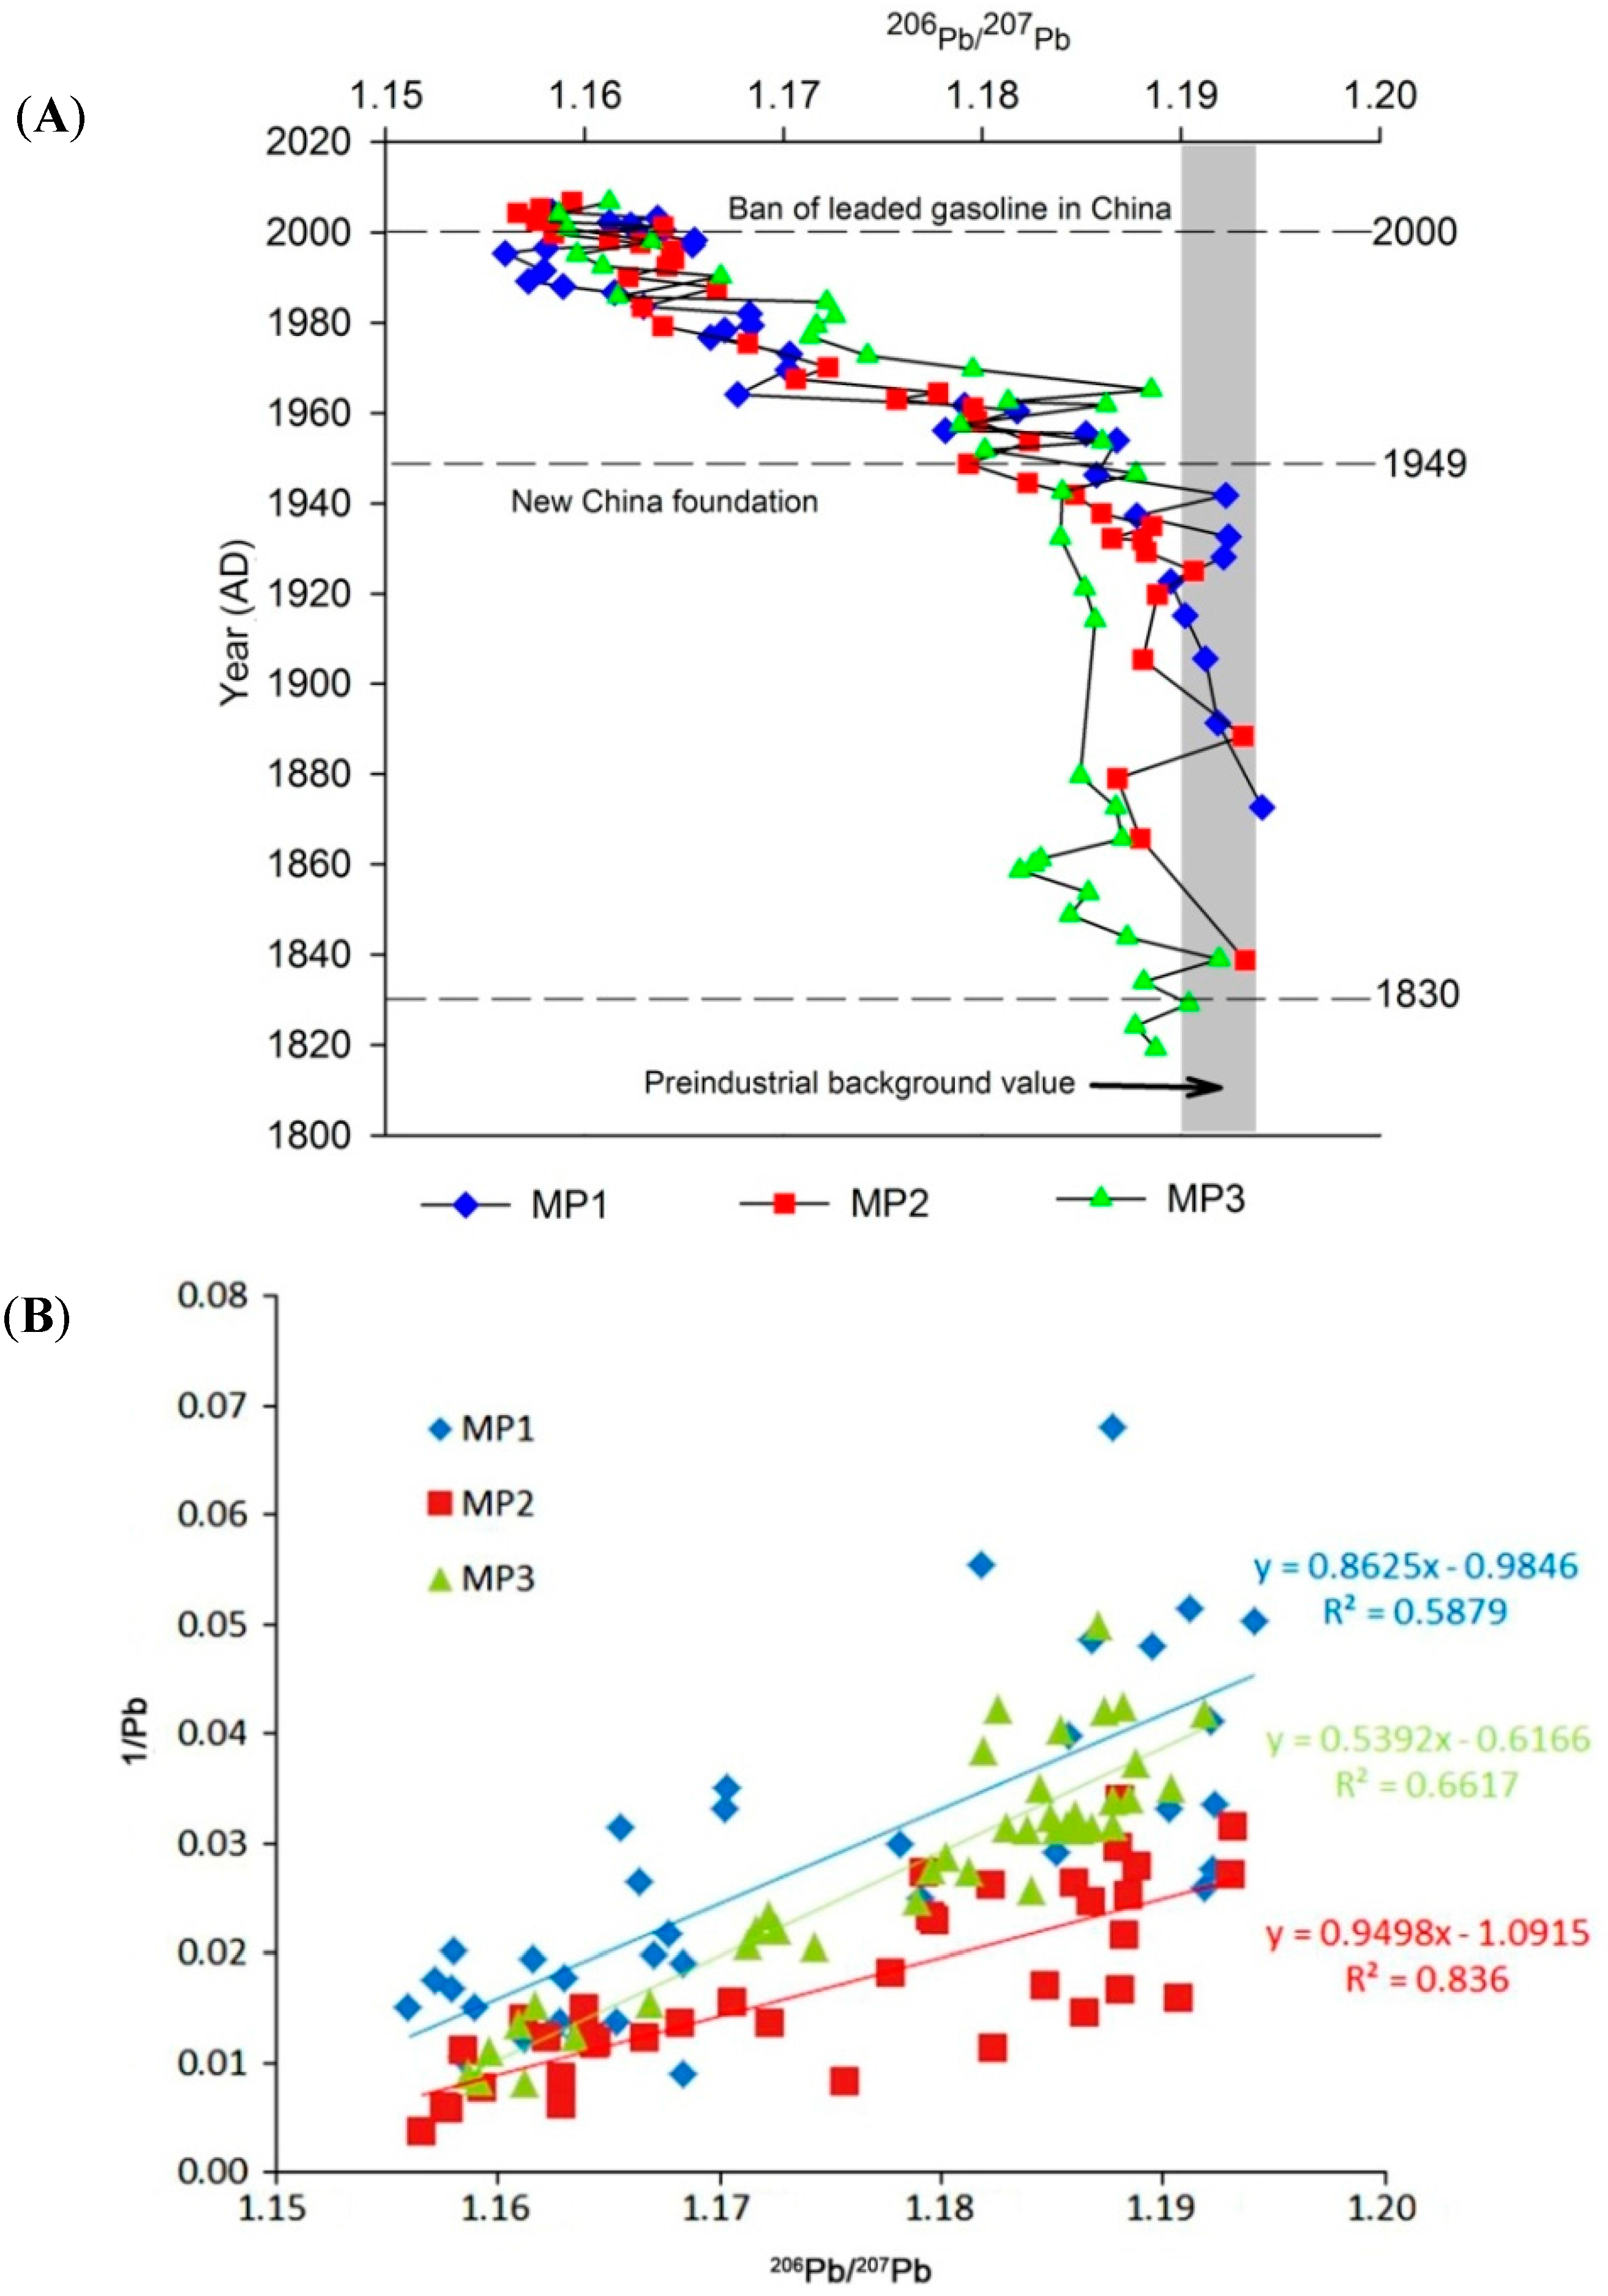
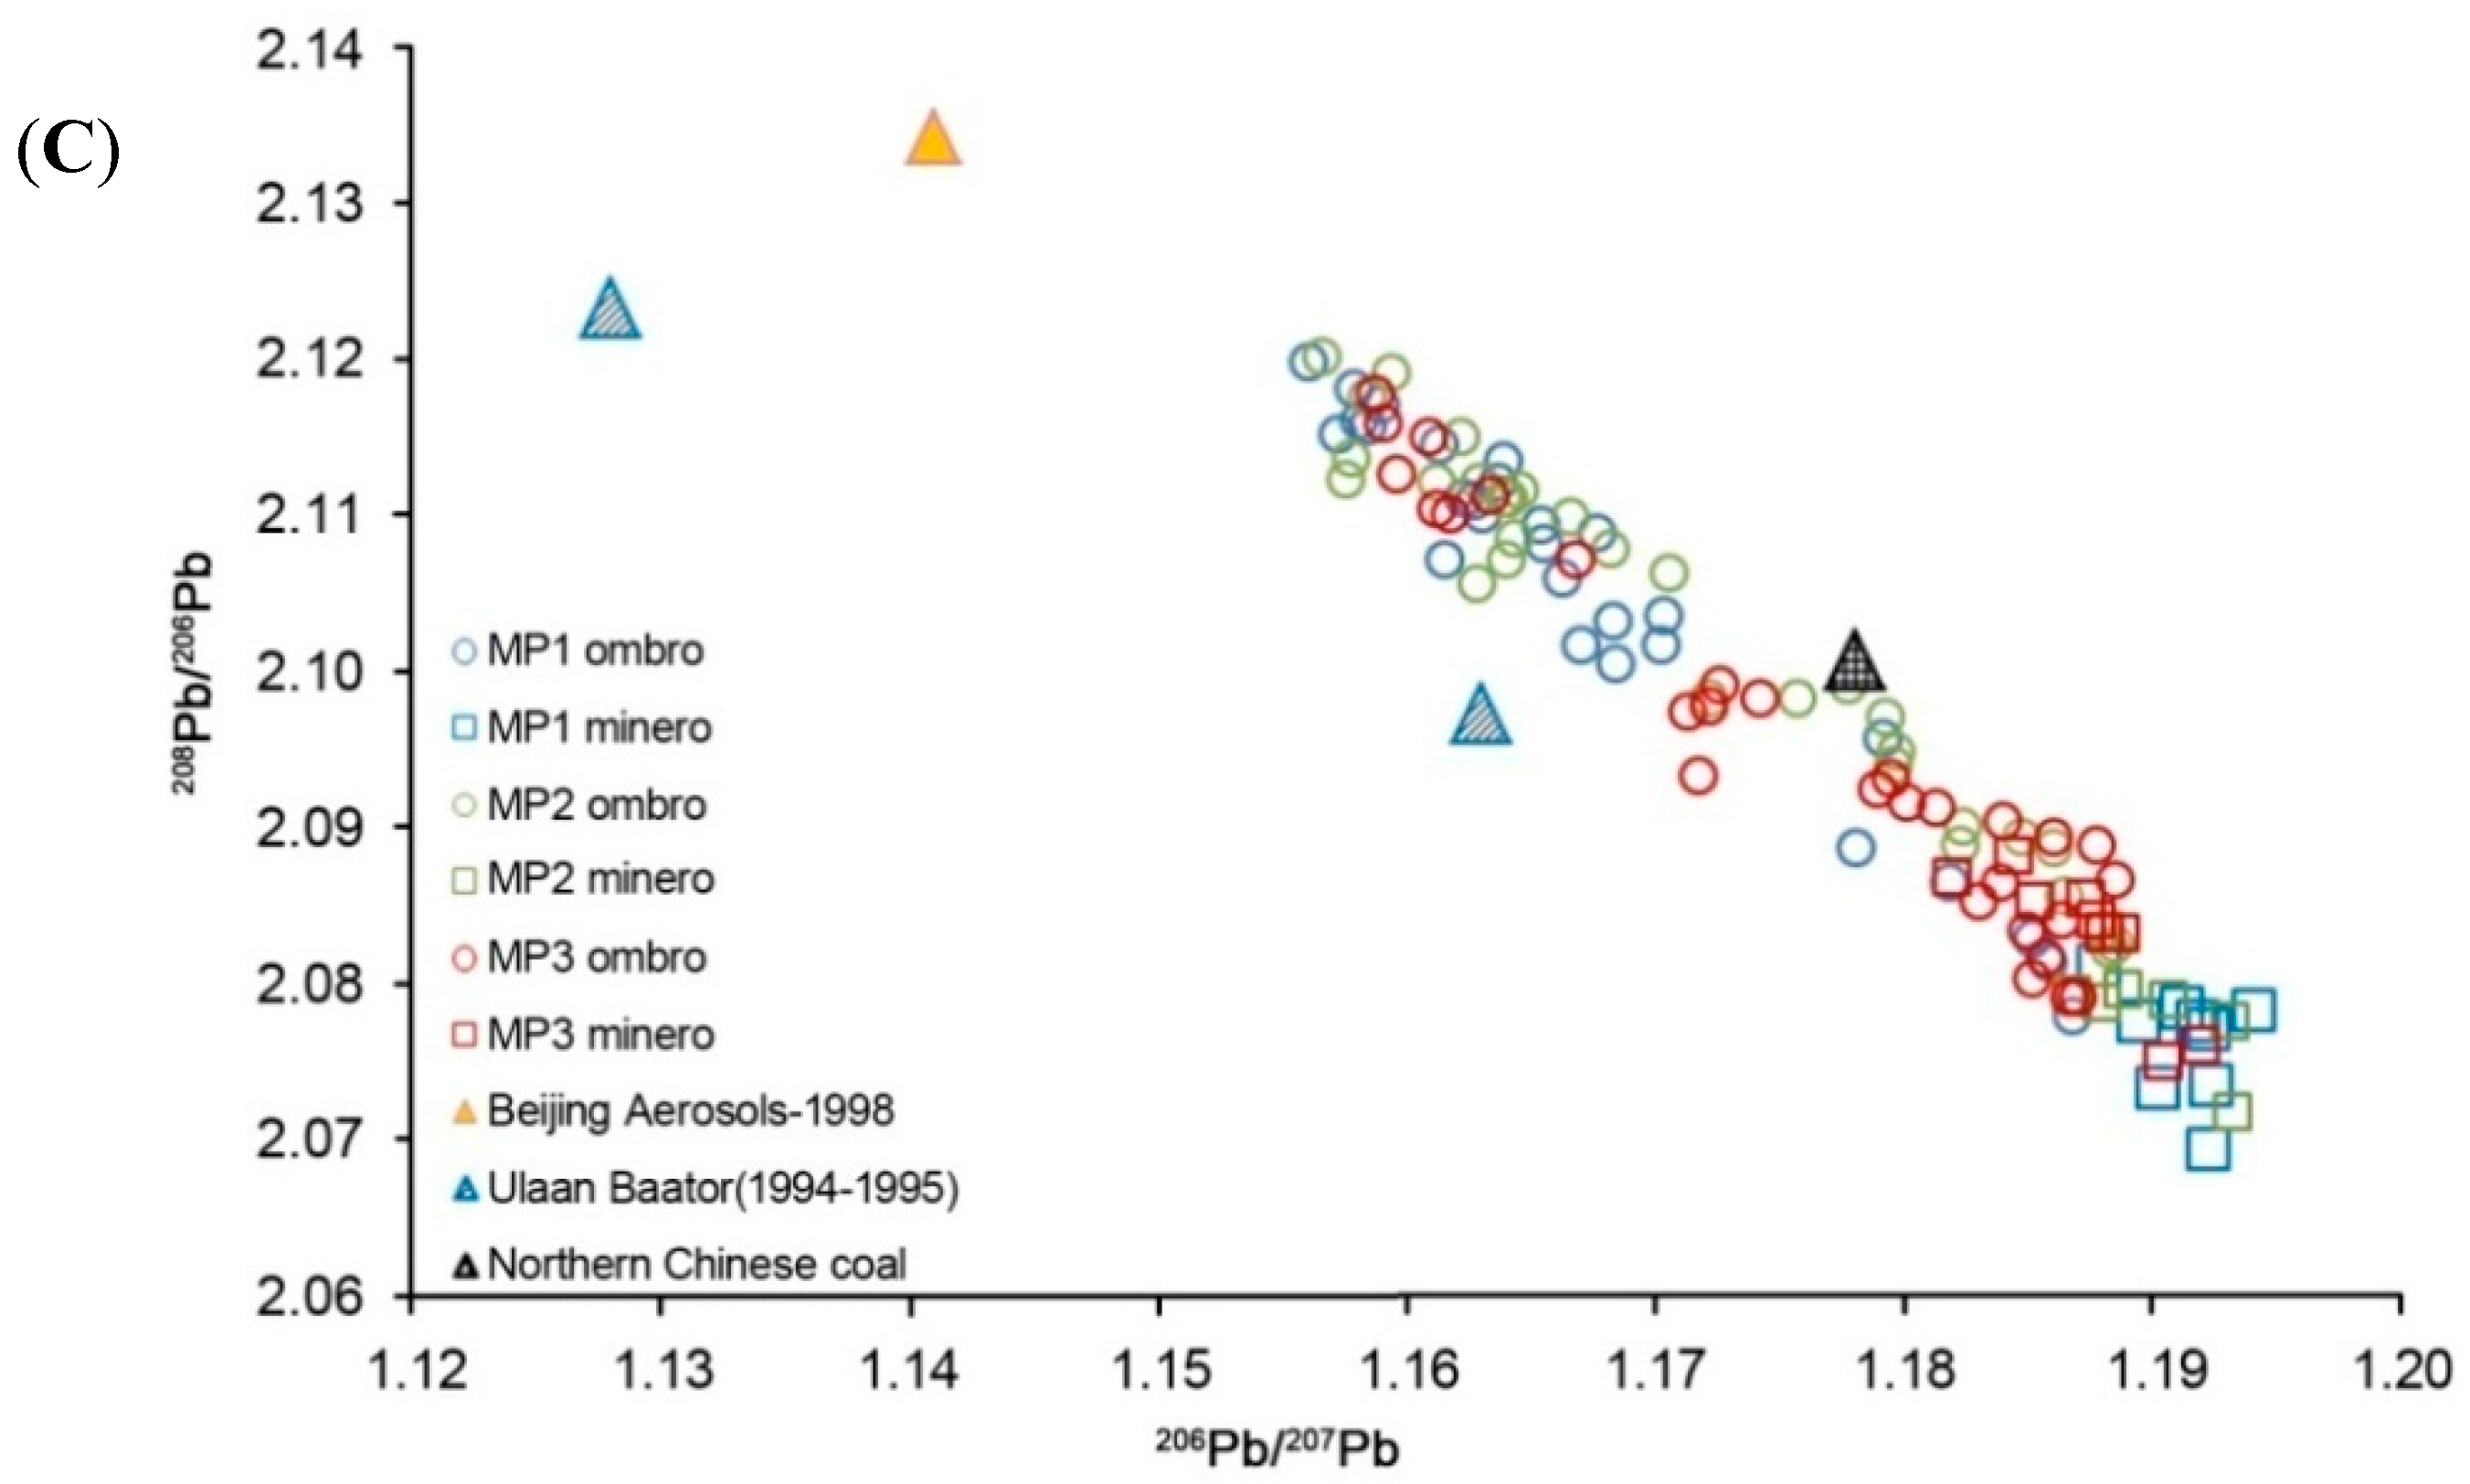
4.5. Sourcing the TMs Pollution by Pb Isotopic Composition

The temporal variations of 206Pb/207Pb ratio are shown in Figure 10a, and exhibit a clear trend to atmospheric Pb pollution in the past 150 years, with the highest concentration of Pb found in recent sediments and associated with less radiogenic (more contaminated) values of 206Pb/207Pb ratios. The phase-out of leaded gasoline in China started in the 1990s, with leaded gasoline being banned in several major cities (i.e., Beijing and Shanghai) in 1997 and 1998, before a nationwide ban in 2000 [74]. Our results show that there is still Pb contamination in our rural mountainous site despite the leaded gasoline phase-out. This is consistent with the conclusion from monitoring data which indicated that the Pb concentrations remained relatively high in aerosol samples in Shanghai and Tianjing after the phase-out of leaded gasoline [75,76]. In order to assess Pb contamination and identify potential Pb sources of peats, the correlation between the 206Pb/207Pb ratio vs. 1/Pb concentrations were analyzed (Figure 10b). The significant linear trends represented a mixture between two main sources of natural geogenic Pb and anthropogenic pollution Pb [27]. Three-isotope (206Pb/207Pb and 208Pb/206Pb) diagrams were built with an attempt to assign an origin to the anthropogenic sources (Figure 10c). The comparisons between Pb isotopic ratios in peats and other environmental samples show that the 206Pb/207Pb ratios in the minerotrophic sections fall in a tight cluster representing the natural source; those ratios in the ombrotrophic sections display a relatively linear feature, covering those in northern China coal [77] and aerosol samples in Beijing, China and Ulanbaator, Mongolia [78]. This spread most probably reflected a mixture of emissions from the burning of petrol and coal. Mongolia is not far and our study site is located in the down wind direction as shown by the wind frequency (Figure 1). It has been reported that soil mineral dust input for the Motianling peat bog came mainly from the long-range sources in northern China and Mongolia [28]. Thus, aerosols from Mongolia were also regarded as mainly contributing to deposited Pb. In northeast China, coal is one of the most important energy resources in urban economical and industrial development, and the leaded particular matter from coal combustion could contribute to other parts of anthropogenic Pb. Unfortunately, there is not very much information on coal, local ores, and alkyl lead ores used in both countries as well as local aerosol data. It is therefore not possible to apportion a reasonable contribution from each source to anthropogenic Pb in the peat bog currently.
Figure 10. (A) Chronological variation of 206Pb/207Pb vs. peat growth year derived from 210Pb technique. The period prior to 1830 is considered as pre-industrial and the background values larger than 1.19 in this study are included in the grey box. Two periods of anthropogenic Pb contributions are identified by the time markers of the foundation of New China in 1949 and the leaded gasoline phase-out in China nationwide in 2000; (B) Diagram of 206Pb/207Pb vs. 1/Pb. They exhibit significant correlations and the large amounts of Pb correspond to the lower ratio of 206Pb and 207Pb; (C) Three isotope plots (206Pb/207Pb vs. 208Pb/206Pb) diagram with the least radiogenic samples (circle) corresponding to the ombrotrophic peat and the more radiogenic samples (square) corresponding to the minerotrophic peats in Motianling. Values for aerosols samples collected in 1998 at Beijing and from 1994–1995 at Ulaan Baator are from Bollhofer and Rosman [78] and for northern Chinese coal are from Mukai et al. [77] (triangle).
Atmosphere 06 00380 g010aAtmosphere 06 00380 g010b

5. Conclusions

This study reported a high resolution record of TMs over the last 200 years derived from multiple 210Pb-dated cores collected from an ombrotrophic peatland in Great Hinggan Mountains, northeast China. The general agreement in the elemental concentration profiles suggested that all investigated elements were conserved in the Motianling bog. This study suggested a necessity to take more than one core to show the heterogeneity in peat accumulation and to investigate the utility of peat as an archive of TMs. AR TMs, EF, PCA and Pb isotope analyses were used to identify the pre-industrial background of typical pollution elements and the impact and trends in anthropogenic contributions since the onset of the Industrial Revolution at 1830 AD. For the typical pollution elements identified by PCA (As, Cd, Cu, Pb, Sb and Zn), the maximum values of AR were found near the surface of the peatland (in peat layers dated from the 1980s), and an increasing trend of AR for these metals was observed since the 2000s. The Pb isotopic composition shows a clear anthropogenic signature probably from re-emission of Pb gasoline contaminated soil particles or from a source with a similar isotopic source, even after leaded gasoline phase-out in 2000. The major potential sources of anthropogenic Pb pollution are likely the emissions from coal combustion in northern China and the aerosols from leaded gasoline burning in the local area as well as long-distance transportation from Mongolia. The historical profile of TMs in the Motianling peatland is in agreement with industrial development in China, reflecting the influence of regional environmental pollution.

Acknowledgments

We thank Yuxia Zhang and Haiyang Zhao for sampling assistance and Yuxin Zhu and Weilan Xia for valuable help during laboratory analysis. We are grateful to three anonymous referees for their useful comments on the paper. This research was funded by the National Natural Science Foundation of China (no.41301215), the Natural Science Foundation of Jiangsu Province, China (no.BK20131058), and the National Basic Research Program of China (no.2012CB956100).

Author Contributions

Kunshan Bao and Guoping Wang conceived and designed the experiments, Kunshan Bao and Ji Shen collected the data, Kunshan Bao and Gaël Le Roux analyzed the data, Kunshan Bao, Ji Shen and Guoping Wang wrote the paper, and all authors contributed to discussions of the manuscript and approved the final manuscript.

Conflicts of Interest

The authors declare no conflict of interest.

References

  1. Nriagu, J.O. A history of global metal pollution. Science 1996, 272, 223–224. [Google Scholar] [CrossRef]
  2. Pacyna, J.M.; Pacyna, E.G. An assessment of global and regional emissions of trace metals to the atmosphere from anthrogpogenic sources worldwide. Environ. Rev. 2001, 9, 269–298. [Google Scholar] [CrossRef]
  3. Ilyin, I.; Rozovskaya, O.; Travnikov, O.; Varygina, M.; Aas, W. Heavy Metals: Transboundary Pollution of the Environment. Available online: http://emep.int/publ/common_publications.html (accessed on 12 March 2015).
  4. Le Roux, G.; Aubert, D.; Stille, P.; Krachler, M.; Kober, B.; Cheburkin, A.; Bonani, G.; Shotyk, W. Recent atmospheric Pb deposition at a rural site in southern Germany assessed using a peat core and snowpack, and comparison with other archives. Atmos. Environ. 2005, 39, 6790–6801. [Google Scholar] [CrossRef]
  5. Bindler, R.; Yu, R.; Hansson, S.; Claben, N.; Karlsson, J. Mining, metallurgy and the historical origin of mercury pollution in lakes and watercourses in Central Sweden. Environ. Sci. Technol. 2012, 46, 7984–7991. [Google Scholar] [CrossRef] [PubMed]
  6. Martinez Cortizas, A.; Peiteado Varela, E.; Bindler, R.; Biester, H.; Cheburkin, A. Reconstructing historical Pb and Hg pollution in NW Spain using multiple cores from the Chao de Lamoso bog (Xistral Mountains). Geochim. Cosmochim. Acta 2012, 82, 68–78. [Google Scholar]
  7. Gallego, J.L.R.; Ortiz, J.E.; Sierra, C.; Torres, T.; Llamas, J.F. Multivariate study of trace element distribution in the geological record of Ronanzas peat bog (Asturias, N. Spain). Paleoenvironmental evolution and human activities over the last 8000 cal y BP. Sci. Total Environ. 2013, 454, 16–29. [Google Scholar] [CrossRef] [PubMed]
  8. Kuttner, A.; Mighall, T.M.; de Vleeschouwer, F.; Mauquoy, D.; Martinez Cortizas, A.; Foster, I.D.L.; Krupp, E. A 3300-year atmospheric metal contamination record from Raeburn Flow raised bog, south west Scotland. J. Archaeol. Sci. 2014, 44, 1–11. [Google Scholar] [CrossRef]
  9. Hong, S.M.; Candelone, J.P.; Patterson, C.C.; Boutron, C.F. Greenland ice evidence of hemispheric lead pollution two millennia ago by Greek and Roman civilizations. Science 1994, 265, 1841–1843. [Google Scholar] [CrossRef] [PubMed]
  10. Renberg, I.; Wik-Persson, M.; Emteryd, O. Pre-industrial atmospheric lead contamination detected in Swedish lake sediments. Nature 1994, 368, 323–326. [Google Scholar] [CrossRef]
  11. Rydberg, J.; Martinez Cortizas, A. Geochemical assessment of an annually laminated lake sediment record from northern Sweden: A multi-core, multi-element approach. J. Paleolimnol. 2014, 51, 499–514. [Google Scholar] [CrossRef]
  12. Shotyk, W.; Weiss, D.; Appleby, P.; Cheburkin, A.; Frei, R.; Gloor, M.; Kramers, J.D.; Reese, S.; van der Knaap, W. History of atmospheric lead deposition since 12,370 14C y BP from a peat bog, Jura Mountains, Switzerland. Science 1998, 281, 1635–1640. [Google Scholar] [CrossRef] [PubMed]
  13. Allan, M.; le Roux, G.; de Vleeschouwer, F.; Bindler, R.; Blaauw, M.; Piotrowska, N.; Sikorski, J.; Fagel, N. High-resolution reconstruction of atmospheric deposition of trace metals and metalloids since AD 1400 recorded by ombrotrophic peat cores in Hautes-Fagnes, Belgium. Environ. Poll. 2013, 178, 381–394. [Google Scholar] [CrossRef]
  14. Shotyk, W. Peat bog archives of atmospheric metal deposition: Geochemical evaluation of peat profiles, natural variations in metal concentrations, and metal enrichment factors. Environ. Rev. 1996, 4, 149–183. [Google Scholar] [CrossRef]
  15. Shotyk, W.; Weiss, D.; Kramers, J.D.; Frei, R.; Cheburkin, A.K.; Gloor, M.; Reese, S. Geochemistry of the peat bog at Etang de la Gruère, Jura Mountains, Switzerland, and its record of atmospheric Pb and lithogenic trace metals (Sc, Ti, Y, Zr, and REE) since 12,370 14C y BP. Geochim. Cosmochim. Acta 2001, 65, 2337–2360. [Google Scholar] [CrossRef]
  16. Bindler, R. Mired in the past-looking to the future: Geochemistry of peat and the analysis of past environmental changes. Glob. Planet. Change 2006, 53, 209–221. [Google Scholar] [CrossRef]
  17. Damman, A.W.H. Hydrology, development, and biogeochemistry of ombrogenous peat bog with special reference to nutrient relocation in a western Newfoundland bog. Can. J. Bot. Sci. 1986, 64, 384–394. [Google Scholar] [CrossRef]
  18. Shotyk, W.; Krachler, M.; Martinez Cortizas, A.; Cheburkin, A.; Emons, H. A peat bog record of natural, pre-anthropogenic enrichments of trace elements in atmospheric aerosols since 12,370 14C y BP, and their variation with Holocene climate change. Earth Planet. Sci. Lett. 2002, 199, 21–37. [Google Scholar] [CrossRef]
  19. Madsen, P. Peat bog records of atmospheric mercury deposition. Nature 1981, 293, 127–130. [Google Scholar] [CrossRef]
  20. Martinez Cortizas, A.; Pontevedra-Pombal, X.; Garcia-Rodeja, E.; Novoa-Munoz, J.C.; Shotyk, W. Mercury in a Spanish peat bog: Archive of climate change and atmospheric metal deposition. Science 1999, 284, 939–942. [Google Scholar] [CrossRef] [PubMed]
  21. Shotyk, W.; Goodsite, M.E.; Roos-Barraclough, F.; Frei, R.; Heinemeier, J.; Asmund, G.; Lohse, C.; Hansen, T.S. Anthropogenic contributions to atmospheric Hg, Pb and As accumulation recorded by peat cores from southern Greenland and Denmark dated using the 14C “bomb pulse curve”. Geochim. Cosmochim. Acta 2003, 67, 3991–4011. [Google Scholar] [CrossRef]
  22. Coggins, A.M.; Jenning, S.G.; Ebinghaus, R. Accumulation rates of the heavy metals lead, mercury and cadmium in ombrotrophic peatlands in the west of Ireland. Atmos. Environ. 2006, 40, 260–278. [Google Scholar] [CrossRef]
  23. Pratte, S.; Mucci, A.; Garneau, M. Historical records of atmospheric metal deposition along the St. Lawrence Valley (eastern Canada) based on peat bog cores. Atmos. Environ. 2013, 79, 831–840. [Google Scholar] [CrossRef]
  24. Shi, W.F.; Feng, X.B.; Zhang, G.; Ming, L.L.; Yin, R.S.; Zhao, Z.Q.; Wang, J. High-precision measurement of mercury isotope ratios of atmospheric deposition over the past 150 years recorded in a peat core taken from Hongyuan, Sichuan Province, China. Chin. Sci. Bull. 2011, 56, 877–882. [Google Scholar] [CrossRef]
  25. Tang, S.; Huang, Z.; Liu, J.; Yang, Z.; Lin, Q. Atmospheric mercury deposition recorded in an ombrotrophic peat core from Xiaoxing’an Mountain, Northeast China. Environ. Res. 2012, 118, 145–148. [Google Scholar] [CrossRef] [PubMed]
  26. Bao, K.; Xia, W.; Lu, X.; Wang, G. Recent atmospheric lead deposition recorded in an ombrotrophic peat bog of Great Hinggan Mountains, Northeast China, from 210Pb and 137Cs dating. J. Environ. Radioact. 2010, 101, 773–779. [Google Scholar] [CrossRef] [PubMed]
  27. Ferrat, M.; Weiss, D.; Dong, S.; Large, D.J.; Spiro, B.; Sun, Y.; Gallagher, K. Lead atmospheric deposition rates and isotopic trends in Asian dust during the last 9.5 kyr recorded in an ombrotrophic peat bog on the eastern Qinghai-Tibetan Plateau. Geochim. Cosmochim. Acta 2012, 82, 4–22. [Google Scholar] [CrossRef]
  28. Bao, K.; Xing, W.; Yu, X.; Zhao, H.; McLaughlin, N.; Lu, X.; Wang, G. Recent atmospheric dust deposition in an ombrotrophic peat bog in Great Hinggan Mountain, Northeast China. Sci. Total Environ. 2012, 431, 33–45. [Google Scholar] [CrossRef] [PubMed]
  29. Ferrat, M.; Weiss, D.; Spiro, B.; Large, D.J. The inorganic geochemistry of a peat deposit on the eatern Qinghai-Tibetan Plateau and insights into changing atmospheric circulation in central Asia during the Holocene. Geochim. Cosmochim. Acta 2012, 91, 7–31. [Google Scholar] [CrossRef]
  30. Grybos, M.; Davranche, M.; Gruau, G.; Petitjean, P. Is trace metal release in wetland soils controlled by organic matter mobility or Fe-oxyhydroxides reduction? Int. J. Coal Geol. 2007, 314, 490–501. [Google Scholar]
  31. Rausch, N.; Ukonmaanaho, L.; Nieminen, T.; Krachler, M.; Shotyk, W. Porewater evidence of metal (Cu, Ni, Co, Zn, Cd) mobilization in an acidic, ombrotrophic bog impacted by a smelter, Harjavalta, Finland and comparison with references sites. Environ. Sci. Technol. 2005, 39, 8207–8213. [Google Scholar] [CrossRef] [PubMed]
  32. Biester, H.; Hermanns, Y.M.; Martinez Cortizas, A. The influence of organic matter decay on the distribution of major and trace elements in ombrotrophic mires—A case study from the Harz Mountains. Geochim. Cosmochim. Acta 2012, 84, 126–136. [Google Scholar] [CrossRef]
  33. MacKenzie, A.B.; Logan, E.M.; Cook, G.T.; Pulford, I.D. Distribution, inventories and isotopic composition of lead in 210Pb-dated peat cores from contrasting biogeochemical environments: Implication for lead mobility. Sci. Total Environ. 1998, 223, 25–35. [Google Scholar] [CrossRef]
  34. Le Roux, G.; Weiss, D.; Grattan, J.; Givelet, N.; Krachler, M.; Cheburkin, A.; Rausch, N.; Kober, B.; Shotyk, W. Identifying the sources and timing of ancient and medieval atmospheric lead pollution in England using a peat profile from Lindow bog, Manchester. J. Environ. Monit. 2004, 6, 502–510. [Google Scholar] [CrossRef] [PubMed]
  35. Mihaljevic, M.; Zuna, M.; Ettler, V.; Sebek, O.; Strnad, L.; Golias, V. Lead fluxes, isotopic and concentration profiles in a peat deposit near a lead smelter (Pribram, Czech Republic). Sci. Total Environ. 2006, 372, 334–344. [Google Scholar] [CrossRef] [PubMed]
  36. Weiss, D.; Shotyk, W.; Kramers, J.D.; Gloor, M. Sphagnum mosses as archives of recent and past atmospheric lead deposition in Switzerland. Atmos. Environ. 1999, 33, 3751–3763. [Google Scholar] [CrossRef]
  37. Shotyk, W. Review of the inorganic geochemistry of peats and peatland waters. Earth Sci. Rev. 1988, 25, 95–176. [Google Scholar] [CrossRef]
  38. Novak, M.; Pacherova, P. Mobility of trace metals in pore waters of two Central European peat bogs. Sci. Total Environ. 2008, 394, 331–337. [Google Scholar] [CrossRef] [PubMed]
  39. Nieminen, T.; Ukonmaanaho, L.; Shotyk, W. Enrichments of Cu, Ni, Zn, Pb and As in an ombrotrophic peat bog near a Cu-Ni smelter in Southwest Finland. Sci. Total Environ. 2002, 292, 81–89. [Google Scholar] [CrossRef] [PubMed]
  40. Shotbolt, L.; Buker, P.; Ashmore, M.R. Reconstructing temporal trends in heavy metal deposition: Assessing the value of herbarium moss samples. Environ. Poll. 2007, 147, 120–130. [Google Scholar] [CrossRef]
  41. Rausch, N.; Nieminen, T.; Ukonmaanaho, L.; le Roux, G.; Krachler, M.; Cheburkin, A.; Bonani, G.; Shotyk, W. Comparison of atmospheric deposition of copper, nickel, cobalt, zinc, and cadmium recorded by Finnish peat cores with monitoring data and emission records. Environ. Sci. Technol. 2005, 39, 5989–5999. [Google Scholar] [CrossRef] [PubMed]
  42. Krachler, M.; Mohl, C.; Emons, H.; Shotyk, W. Atmospheric deposition of V, Cr, and Ni since the late glacial: Effects of climatic cycles, human impacts, and comparison with crustal abundances. Environ. Sci. Technol. 2003, 37, 2658–2667. [Google Scholar] [CrossRef] [PubMed]
  43. Ukonmaanaho, L.; Nieminen, T.; Rausch, N.; Shotyk, W. Heavy metal and arsenic profiles in ombrotrophic peat cores from four differently loaded areas in Finland. Water Air Soil Poll. 2004, 58, 277–294. [Google Scholar] [CrossRef]
  44. Shotyk, W.; Krachler, M.; Chen, B. Antimony in recent, ombrotrophic peat from Switzerland and Scotland: Comparison with natural background values (5320 to 8020 14C y BP) and implications for the global atmospheric Sb cycle. Glob. Biogeochem. Cycles 2004, 18, GB1016. [Google Scholar] [CrossRef]
  45. Cloy, J.M.; Farmer, J.G.; Graham, M.C.; MacKenzie, A.B. Retention of As and Sb in ombrotrophic peat bogs: Records of As, Sb, and Pb deposition at four Scottish sites. Environ. Sci. Technol. 2009, 43, 1756–1762. [Google Scholar] [CrossRef] [PubMed]
  46. Rothwell, J.J.; Taylor, K.G.; Chenery, S.R.N.; Cundy, A.B.; Evans, M.G.; Allott, T.E.H. Storage and behavior of As, Sb, Pb, and Cu in bmbrotrophic peat bogs under contrasting water table conditions. Environ. Sci. Technol. 2010, 44, 8497–8502. [Google Scholar] [CrossRef] [PubMed]
  47. Kylander, M.E.; Bindler, R.; Cortizas, A.M.; Gallagher, K.; Mörth, C.-M.; Rauch, S. A novel geochemical approach to paleorecords of dust deposition and effective humidity: 8500 years of peat accumulation at Store Mosse (the “Great Bog”), Sweden. Quatern. Sci. Rev. 2013, 69, 69–82. [Google Scholar] [CrossRef]
  48. Margalef, O.; Cañellas-Boltà, N.; Pla-Rabes, S.; Giralt, S.; Pueyo, J.J.; Joosten, H.; Rull, V.; Buchaca, T.; Hernández, A.; Valero-Garcés, B.L.; et al. A 70,000 year multiproxy record of climatic and environmental change from Rano Aroi peatland (Easter Island). Glob. Planet. Change 2013, 108, 72–84. [Google Scholar] [CrossRef]
  49. Martinez Cortizas, A.; Lopez-Merino, L.; Bindler, R.; Mighall, T.; Kylander, M. Atmospheric Pb pollution in N Iberia during the late Iron Age/Roman times reconstructed using the high-resolution record of La Molina mire (Asturias, Spain). J. Paleolimnol. 2013, 50, 71–86. [Google Scholar] [CrossRef]
  50. Gao, C.; Bao, K.; Lin, Q.; Zhao, H.; Zhang, Z.; Xing, W.; Lu, X.; Wang, G. Characterizing trace and major elemental distribution in late Holocene in Sanjiang Plain, Northeast China: Paleoenvironmental implications. Quatern. Int. 2014, 349, 376–383. [Google Scholar] [CrossRef]
  51. Muller, J.; Kylander, M.; Martinez-Cortizas, A.; Wüst, R.A.J.; Weiss, D.; Blake, K.; Coles, B.; Garcia-Sanchez, R. The use of principle component analyses in characterising trace and major elemental distribution in a 55 kyr peat deposit in tropical Australia: Implications to paleoclimate. Geochim. Cosmochim. Acta 2008, 72, 449–463. [Google Scholar] [CrossRef]
  52. Shotyk, W.; Blaser, P.; Grunig, A.; Cheburkin, A.K. A new approach for quantifying cumulative, anthropogenic, atmospheric lead deposition using peal cores from bogs: Pb in eight Swiss peat bog profiles. Sci. Total Environ. 2000, 249, 281–295. [Google Scholar] [CrossRef] [PubMed]
  53. Martinez Cortizas, A.; Garcia-Rodeja, E.; Pontevedra Pombal, X.; Novoa Munoz, J.C.; Weiss, D.; Cheburkin, A. Atmospheric Pb deposition in Spain during the last 4600 years recorded by two ombrotrophic peat bogs and implications for the use of peat as archive. Sci. Total Environ. 2002, 292, 33–44. [Google Scholar] [CrossRef] [PubMed]
  54. Kylander, M.E.; Weiss, D.J.; Cortizas, A.M.; Spiro, B.; Garcia-Sanchez, R.; Coles, B.J. Refining the pre-industrial atmospheric Pb isotope evolution curve in Europe using an 8000 year old peat core from NW Spain. Earth Planet. Sci. Lett. 2005, 240, 467–485. [Google Scholar] [CrossRef]
  55. Reimann, C.; de Caritat, P. Distinguishing between natural and anthropogenic sources for elements in the environment: Regional geochemical surveys versus enrichment factors. Sci. Total Environ. 2005, 337, 91–107. [Google Scholar] [CrossRef] [PubMed]
  56. Zhang, Y.; Niu, H. The mire in northeast of China. Chin. Geogr. Sci. 1993, 3, 238–246. [Google Scholar] [CrossRef]
  57. Bao, K.; Jia, L.; Lu, X.; Wang, G. Grain-size characteristics of sediment in Daniugou peatland in Changbai Mountains, Northeast China: Implications for atmospheric dust deposition. Chin. Geogr. Sci. 2010, 20, 498–505. [Google Scholar] [CrossRef]
  58. Taylor, S.R. Abundance of chemical elements in the continental crust: A new table. Geochim. Cosmochim. Acta 1964, 28, 1273–1285. [Google Scholar] [CrossRef]
  59. Vinogradov, A.P. Average contents of chemical elements in the major types of terrestrial igneous rocks. Geokhimiya 1962, 7, 555–571. [Google Scholar]
  60. Wedephol, K.H. The composition of the continental crust. Geochim. Cosmochim. Acta 1995, 59, 1217–1232. [Google Scholar] [CrossRef]
  61. Givelet, N.; Roos-Barraclough, F.; Shotyk, W. Predominant anthropogenic sources and rates of atmospheric mercury accumulation in southern Ontario recorded by peat cores from three bogs: Comparison with natural “background” values (past 8000 years). J. Environ. Monit. 2003, 5, 935–949. [Google Scholar] [CrossRef] [PubMed]
  62. SPSS. Statistical Product and Service Solution, Version 11.5; SPSS Inc.: Chicago, IL, USA, 2002.
  63. Lin, Q.; Leng, X.; Hong, B. The peat record of 1 ka of climate change in Daxing Anling. Bull. Mineral. Petrol. Geochem. 2004, 23, 15–18. (In Chinese) [Google Scholar]
  64. Komarek, M.; Ettler, V.; Chrastny, V.; Mihaljevic, M. Lead isotopes in environmental sciences: A review. Environ. Int. 2008, 34, 562–577. [Google Scholar] [CrossRef] [PubMed]
  65. Bai, Z.; Tian, M.; Wu, F.; Xu, D.; Li, T. Yanshan, Gaoshan—Two active volcanoes of the volcanic cluster in Aershan, Inner Mongolia. Earthq. Res. China 2005, 19, 402–408. [Google Scholar]
  66. Azoury, S.; Tronczyński, J.; Chiffoleau, J.F.; Cossa, D.; Nakhle, K.; Schmidt, S.; Khalaf, G. Historical records of mercury, lead, and polycyclic aromatic hydrocarbons depositions in a dated sediment core from the Eastern Mediterranean. Environ. Sci. Technol. 2013, 47, 7101–7109. [Google Scholar] [PubMed]
  67. Xia, W.; Xue, B. Sediment rate determination by 210Pb and 137Cs techniques in Xiaolongwan lake in Jilin province. Quatern. Sci. 2004, 24, 124–125. (In Chinese) [Google Scholar]
  68. Gan, H.; Lin, J.; Liang, K.; Xia, Z. Selected trace metals (As, Cd and Hg) distribution and contamination in the coastal wetland sediment of the northern Beibu Gulf, South China Sea. Mar. Poll. Bull. 2013, 66, 252–258. [Google Scholar] [CrossRef]
  69. Krachler, M.; Shotyk, W. Natural and anthropogenic enrichments of molybdenum, thorium, and uranium in a complete peat bog profile, Jura Mountains, Switzerland. J. Environ. Monit. 2004, 6, 418–426. [Google Scholar] [CrossRef] [PubMed]
  70. Shotyk, W.; Goodsite, M.E.; Roos-Barraclough, F.; Givelet, N.; le Roux, G.; Weiss, D.; Cheburkin, A.K.; Knudsen, K.; Heinemeier, J.; van der Knaap, W.O.; et al. Accumulation rates and predominant atmospheric sources of natural and anthropogenic Hg and Pb on the Faroe Islands. Geochim. Cosmochim. Acta 2005, 69, 1–17. [Google Scholar] [CrossRef]
  71. Ouyang, H.G.; Mao, J.W.; Santosh, M. Anatomy of a large Ag-Pb-Zn deposit in the Great Xing’an Range, Northeast China: Metallogeny associated with Early Cretaceous magmatism. Int. Geol. Rev. 2013, 55, 411–429. [Google Scholar] [CrossRef]
  72. Luo, C.; Chen, L.; Zhao, H.; Guo, S.; Wang, G. Challenges facing socioeconomic development as a result of China’s environmental problems, and future prospects. Ecol. Eng. 2013, 60, 199–203. [Google Scholar] [CrossRef]
  73. Ye, Y.; Fang, X.; Khan, M.A. Migration and reclamation in northeast China in response to climatic disasters in North China over the past 300 years. Reg. Environ. Change 2012, 12, 193–206. [Google Scholar] [CrossRef]
  74. Cheng, H.; Hu, Y. Lead (Pb) isotopic fingerprinting and its applications in lead pollution studies in China: A review. Environ. Poll. 2010, 158, 1134–1146. [Google Scholar] [CrossRef]
  75. Chen, J.; Tan, M.; Li, Y.; Zhang, Y.; Lu, W.; Tong, Y.; Zhang, G.; Li, Y. A lead isotope record of Shanghai atmospheric lead emissions in total suspended particles during the period of phasing out of leaded gasoline. Atmos. Environ. 2005, 39, 1245–1253. [Google Scholar] [CrossRef]
  76. Wang, W.; Liu, X.; Zhao, L.; Guo, D.; Tian, X.; Adams, F. Effectiveness of leaded petrol phase-out in Tianjin, China based on the aerosol lead concentration and isotope abundance ratio. Sci. Total Environ. 2006, 364, 175–187. [Google Scholar] [CrossRef] [PubMed]
  77. Mukai, H.; Furuta, N.; Fujii, T.; Ambe, Y.; Sakamoto, K.; Hashimoto, Y. Characterization of sources of lead in the urban air of Asia using ratios of stable lead isotopes. Environ. Sci. Technol. 1993, 27, 1347–1356. [Google Scholar] [CrossRef]
  78. Bollhöfer, A.; Rosman, K. Isotopic source signatures for atmospheric lead: The Northern Hemisphere. Geochim. Cosmochim. Acta 2001, 65, 1727–1740. [Google Scholar] [CrossRef]

