Article

Research on the Coupling Coordination Relationship between Urbanization and the Air Environment: A Case Study of the Area of Wuhan

1
School of Environmental Studies, China University of Geosciences, 388 Lumo Road, 430074 Wuhan, China
2
School of Public Administration, China University of Geosciences, 388 Lumo Road, 430074 Wuhan, China
*
Author to whom correspondence should be addressed.
Atmosphere 2015, 6(10), 1539-1558; https://doi.org/10.3390/atmos6101539
Submission received: 10 August 2015 / Revised: 29 September 2015 / Accepted: 8 October 2015 / Published: 22 October 2015

Abstract

:
China’s high-speed socioeconomic development has been characterized by rapid urbanization and a series of ecological environment issues, especially air pollution. This paper proposed a comprehensive indicator system for the evaluation of urbanization and the air environment in Wuhan, a metropolis in central China, and then investigated the relationship between urbanization and the air environment from the perspective of coupling coordination theory. Furthermore, a coupling coordination degree model (CCDM) was constructed to estimate the relationship by using panel data collected from 1996–2013. The results showed the following: (1) Spatial urbanization and air environment quality make the greatest contributions to the compound system compared to other first grade indicators, indicating that they are critical factors to consider when the government is making relevant decisions about urban sprawl. (2) The comprehensive level of the air environment initially decreased from 1996–1998 and then increased with fluctuations in Wuhan, with several inflection points, meaning that the variation process of the air environment is unstable and repetitive, and efforts to improve the air environment must persist over a long period of time. Lastly, (3) the degree of coordinated coupling between urbanization and the air environment exhibited an S-shaped curve, indicating that Wuhan changed from having slightly unbalanced development to barely balanced development and then entered into a period of superiorly balanced development, with the air environment lagging. Thus, the ambient urban air quality has been subject to great pressure, and the government should continue to take effective action to improve it.

1. Introduction

The relationship between urbanization and the ecological environment has become a crucial issue of geography and urban development studies [1,2]. With its rapid economic growth, China's urbanization level has also grown tremendously [3,4,5]. The rate of, demographic urbanization grew from 17.9% in 1978 to 53.73% in 2013, with an average annual growth of approximately 0.99%. However, this extensive economic growth has created high levels of pollution and energy consumption, and low efficiency. Now, air pollution has become a major environmental problem in many cities in the country [6,7]. PM2.5 and haze pollution in eastern China and the Beijing-Tianjin-Hebei region have also become serious issues [8,9], greatly affecting human health [10,11]. Accordingly, quantitatively investigating and exploring the relationship between urbanization and the air environment can provide a reference for sustainable urban development planning and environmental policymaking.
Empirical studies have focused on the relationship between economic growth and the environment, the coupling relationship between urbanization and environment [3,12], and many well-known theories have been proposed since the twentieth century. In 1991 and 1995, Grossman and Krueger first reported the hypothesis of the Environment Kuznets Curve (EKC) [13,14]. They found that the relationship between per capita income and emissions of waste exhibits an inverted U-shaped curve (the environment may get worse before it gets better), and this curve can be modified by environmental policies. After that, many studies focused on the air pollution EKC [15,16,17,18,19,20]. Shafik (1994) found that suspended particulate matter (SPM) and SO2 would be worsen with growth in per capita income before it would improve [15]. Selden and Song (1994) analyzed the four main air pollutants (SO2, CO2, NO2 and SPM) and found an inverted U-shaped relationship with per capita incomes [16]. With an increase in empirical research, the explanatory variables and indicators of the air pollution EKC have become more diversified, and researchers have begun to pay attention to urbanization factors (such as the rate of urbanization, population density, urban area) when analyzing changes in the urban air environment [21,22]. Although these independent variables are singular and yield varied conclusions, they provide the possibility and an approach to reveal the relationship between urbanization (rather than macro economic development) and the air environment.
As an important component of the eco-environment, the air environment subsystem has an extremely complex interaction with the process of urbanization, and has been a source of wide concern [6,21,22,23]. Just as a coin has two sides, the expansions of urban populations, industrial production and traffic accelerate the emission of air pollutants, and a series of measures has been taken to control air pollution [24,25,26]. We need to build a comprehensive evaluation system to reasonably judge the coupling mechanism between urbanization and the air environment. For instance, Balanced Scorecard (BSC) and Pressure-State-Response (PSR) models were used to establish a key evaluation framework for the impacts of urbanization on the air environment [27]. The Double Exponential Curve and three principles were proposed to analyze the coupling regularity between urbanization and the atmospheric environment [22]. However, the above studies present the following three problems: (1) Indicators representing the comprehensive level of the air environment are relatively scant, especially for the air pollution control index in the process of urbanization. (2) The level of coordination for the different relationship stage between urbanization and the air environment are not mentioned, which means that urban air environment management lacks a clear control target. (3) The study areas were focused on developed provinces or cities in eastern China rather than middle-western regions. Therefore, it is necessary to conduct more in-depth studies of the coupling relationship between urbanization and the air environment, especially in mega-cities in central China.
The goal of this paper is to establish a comprehensive evaluation system and use the coupling coordination degree model (CCDM) to quantitatively investigate the relationship between urbanization subsystem and the air environment subsystem, uncovering dynamic trends in the development of the degree of coupling coordination, and finally obtaining a coupling equation. The outline of the whole analysis procedure is to: (1) Build an integrated air environment evaluation system based on PSR model, which contains air environment quality, air environment pressure and air environment control level and build the comprehensive indicator system of urbanization that contains four first grade indicators (demographic, spatial, economic and social aspect). (2) Calculate indicator weight and its score. In order to enhance the reliability of the results, we take the combined method of subjective and objective index weight calculation, that respectively is the analytic hierarchy process (AHP) and mean squared deviation (MSD). (3) Confirm the degree of coupling coordination and the phase of coupling coordination pattern in each year. (4) Obtain the dynamic change curve and coupling fit curve to reflect the evolution law of relationship between urbanization and air environment.

2. Materials and Methods

2.1. Study Area

Wuhan, the capital city of Hubei province, lies between 113°41′E to 115°05′E and 29°58′N to 31°22′N. It is the largest mega-city in the central of China [28]. In terms of its natural background, Wuhan is located in the eastern part of the Jiang-Han Plain, where the Han River flows into the Yangtze River, and is surrounded by mountains on three sides. There are many lakes in this area, which contributes to the city’s meteorological features as follows: humidity, low wind and frequent fog and haze. In addition, Wuhan is under the influence of a subtropical monsoon climate, with prevailing northeasterly winds. There are four distinct seasons here with mild climate and abundant quantity of heat. In winter, the weather is cold and dry, which is controlled by the northeast monsoon. Furthermore, the radiation inversion usually appears in the morning and at night it is not conductive to the spread of pollutants. These are the main climatic factors which cause air pollution in winter. Spring is the transition period between winter monsoon and summer monsoon with alternative cold and warm currents and frequent actions of cyclones and frontal. Also, the air pollution is serious in spring due to weather conditions and the dust floating from north China to south China. However, in summer it is hot and rainy. Furthermore, the atmospheric environment is excellent. This is because the region is controlled by the southeast and the southwest monsoon, which is the best condition for the dispersion of air pollution. Autumn is the transition season from summer monsoon to winter monsoon, in which the downdraft controlling weather patterns increase.
Wuhan’s land area is 8494.41 km2, whereas the built-up urban land area is 534.28 km2 as of the end of 2013. Wuhan had a GDP of 905.127 billion RMB, accounting for more than one third of the entire GDP of Hubei Province, and the total population was 10.22 million, with a 67.6% non-agricultural population. Additionally, Wuhan is a comprehensive megacity with a well-developed secondary industry and tertiary industry. The industrial structure changed from 9.2:46.8:44.0 in 1996 to 3.7:48.6:47.7 in 2013.
With the ongoing promotion of a development strategy for central China, a resource efficient and environmentally friendly society pilot area, and the construction of the Yangtze River economic belt, Wuhan has experienced rapid urbanization and economic growth compared with other central Chinese cities [29]. Inevitably, this process has also resulted in a vast increase in sprawl, energy consumption, pollution emissions and environmental changes, especially in terms of the air environment. Figure 1 shows the trends of waste gas emissions and the non-agricultural population in Wuhan from 1996–2013. We can clearly see that the total volume of waste gas emitted increased quickly along with the agglomeration of the urban population. Controlling the waste gas emissions and improving the air environment have been severe challenges for Wuhan’s government during its rapid urbanization process.
Figure 1. Trends of waste gas emissions and the non-agricultural population in Wuhan.
Atmosphere 06 01539 g001

2.2. Data Pre-Processing

Based on the existing research conditions and availability of data, we positioned the time scale from 1996–2013 in this paper, in consideration of China’s Ambient Air Quality Standards (GB3095-1996), which were formally implemented in 1996. Furthermore, we took the examined data and statistical data as the main data source. The data regarding urbanization indicators were originally collected from the Wuhan Statistical Yearbook and the National Economic and Social Development Statistics Bulletin of Wuhan (19962013). Air environment data were mainly obtained from the Wuhan Environmental Quality Bulletin and Wuhan Statistical Yearbook. To eliminate the influence of different indicators’ magnitude and dimension, we standardized the data using Equations (1) and (2) [3,30,31]:
Positive indicator:
Y i j = ( X i j min { X j } ) / ( max { X j } min { X j } )
Negative indicator:
Y i j = ( max { X j } X i j ) / ( max { X j } min { X j } )
where X i j denotes the value of indicator j in year i and max { X j } and min { X j } indicate the maximum and minimum value of indicator j for all years, respectively. Thus, all of the index values are in the range of (0, 1).

2.3. Methods

2.3.1. Construct the Comprehensive Index System

To accurately assess the relationship between urbanization and the air environment, we conduct a preliminary determination of the indexes and develop a general framework in accordance with previously relevant studies [6,12,27,32]. This process particularly emphasizes the actual situation of Wuhan and constructs the evaluation index system based on objective scientific principles. The indexes are further selected through comparison of the correlation coefficients and significance levels.
The index system of the comprehensive urbanization contains four first grade indicators (demographic, spatial, economic and social aspects) and 20 basic grade indicators. Considering the demand for energy in the process of industrial development, we add two energy indicators (coal consumption and the unit GDP energy consumption) to economic urbanization, aiming to analyze the industrialized impact on the air environment. The final evaluation index system is shown in Table 1.
As an important ecological environment subsystem, we set up the comprehensive index system for the air environment based on the PSR (Pressure-State-Response) model, which is one of the most commonly used models for environmental impact assessment [27,33,34]. In practical terms, it contains three first grade indicators (State: air environmental quality, Pressure: air environmental pressure, Response: air environmental control level) and 15 basic grade indicators rather than single air quality evaluation index [8,35]. The final evaluation index system is shown in Table 2.
Objectively, a complex interactive coercing relationship exists between urbanization and the eco-environment as well as the atmospheric environment [22,36]. Urbanization refers to a population transformation process in which the population migrates from rural areas to urban areas and the expansion of the urban land area, leading to large-scale urban construction such as real estate development and road construction and ultimately aggravating dust pollution in cities. Meanwhile, the development of the urban economy increases the demand for energy resources, and a large amount of industrial exhaust emissions increases the pressure on the air environment. Moreover, with the rapid improvement of living standards of urban residents, a surge in the number of vehicles and the amount of vehicle exhaust emissions is one of the most important factors that influence the air environment. A worsened air environment will also impose extreme constraints on the urbanization process because residents pursue a comfortable and healthy living space. Therefore, we have no alternative but to take some effective measures (e.g., control the urban scale, optimize the land use pattern, adjust the industrial structure, and change the ways of residents) to improve air environmental quality. Of course, this will undoubtedly change the path of the process of urbanization and the urban form. The complicated interactive coupling relationship between the urbanization subsystem and the air environmental subsystem is displayed in Figure 2.
Table 1. The comprehensive index system of urbanization.
First Grade IndicatorswAHPwMSDAW1Basic Grade IndicatorswAHPwMSDAW2AW3
Demographic urbanization0.3380.2000.269Percentage of nonagricultural population (%)0.3450.2510.2980.080
Urban population density (person/km2)0.1800.2470.2140.058
Percentage of second industry employment (%)0.2070.2560.2310.062
Percentage of tertiary industry employment (%)0.2680.2460.2570.069
Spatial urbanization0.2940.2580.276Built-up area (km2)0.2660.2150.2410.067
Per capita area of roads (m2)0.1800.1950.1880.052
Urban living space per capita (m2/person)0.2490.2100.2290.063
Coverage rate of green area in built-up area (%)0.1720.1980.1850.051
Park green area per capita (m2)0.1330.1820.1570.043
Economic urbanization0.2010.3010.251GDP per capita (RMB)0.2340.1630.1990.050
Percentage of second industry in GDP (%)0.1920.1630.1780.045
Gross value of industrial output (billion RMB)0.1910.1640.1770.044
The Hoffman coefficient (%)0.1810.1680.1750.044
Coal consumption(10 thousand tons)0.0870.1840.1350.034
The unit GDP energy consumption (tons of standard coal per10 thousands RMB)0.1150.1580.1360.034
Social urbanization0.1670.2410.204Urban per capita disposable income (RMB)0.2580.2040.2310.047
Per capita total retail sales of social consumer goods (Yuan)0.2040.2030.2030.041
Numbers of running buses and taxis 0.1370.1920.1650.034
Private vehicle ownership0.1930.2040.1980.040
Urban housing construction area (104 m2)0.2080.1980.2030.041
Table 2. The comprehensive index system of air environment.
First Grade IndicatorswAHPwMSDAW1Basic Grade IndicatorswAHPwMSDAW2AW3
Air Environmental
Quality
0.4430.3540.399Sulfur dioxide concentration (μg/m3)0.2930.2120.2530.101
Nitrogen dioxide concentration (μg/m3)0.2270.2380.2320.093
PM10 concentration (μg/m3)0.3250.2790.3020.120
Urban average fallout (ton/km2·month)0.1550.2710.2130.085
Air Environmental
Pressure
0.3290.3950.362Total volume of waste gas emission (100 million cu. m)0.2350.1750.2050.074
Volume of soot emission (10,000 tons)0.1940.1590.1770.064
Volume of industrial soot emission
(10,000 tons)
0.1180.1830.1500.054
Volume of industrial dust emission
(10,000 tons)
0.1110.1790.1450.052
Volume of sulfur dioxide emission
(10,000 tons)
0.2070.1530.1800.065
Volume of industrial sulfur dioxide emission (10,000 tons)0.1350.1510.1430.052
Air Environmental
Control
0.2280.2510.239Percentage of pollution treatment in GDP (%)0.1610.2060.1840.044
Industrial waste gas treatment facilities0.2030.1810.1920.046
Percentage of industrial soot removed (%)0.2010.1890.1950.047
Percentage of industrial dust removed (%)0.1780.2040.1910.046
Percentage of industrial sulfur dioxide removed (%)0.2570.2200.2380.057
Notes: wAHP denotes the weight coefficient of Analytic Hierarchy Process (AHP) method; wMSD represents the weight coefficient of Mean Squared Deviation (MSD) method; AW1, AW2 denotes the average weight of wAHP and wMSD; AW3 shows the final weight of each single indicator: AW3=AW1*AW2.
Figure 2. Relationship of the coupling coordination between urbanization and air environment.
Atmosphere 06 01539 g002

2.3.2. Evaluation of the Indicators’ Weight

In processing the weights of the indicators, each weighting method has its limits. A synthetic evaluation method has been widely adopted in recent research [3]. To reduce the error by the single weight method, we selected a subjective weighting method, the analytic hierarchy process (AHP) method [37,38], and an objective weighting method, the mean squared deviation decision (MSD) method [39,40], and then we calculated the integrated average weight (AW) of AHP and MSD to determine the coefficient of each indicator. The detailed weight values are shown in Table 1 and Table 2. The steps of the AHP method can be found in references [37,38] and other literature that has reported its application in detail. In this study, we obtain the judgments of the index’s importance ratings from 20 experts in the field of environmental science and sustainable development, and the final weights (wAHP) are shown in Table 1 and Table 2. The steps of the MSD method for basic grade indicators are shown in Equations (3)–(5), and we obtained the comprehensive level of first grade indicators from Equation (6).
Step 1: Count the arithmetic mean value of each indicator:
E ( j ) = 1 n i = 1 n Y i j
Step 2: Calculate the mean squared deviation for indicator j:
σ ( j ) = i = 1 n ( Y i j E ( j ) ) 2
Step 3: Calculate the weight coefficient of a single indicator j:
w j = σ ( j ) / j = 1 m σ ( j )
Step 4: Calculate the comprehensive level (score) of first grade indicators:
F k = j = 1 m Y i j w j
where n is the number of years, m is the number of indicators, k represents the subsystem number of first grade indicators, among them k = 4 in the comprehensive index system of urbanization and k = 3 in the comprehensive index system of air environment. As for first grade indicators, we regarded Fk as the random variable (attribute value) and recalculated the mean squared deviation based on Equations (3)–(5).The normalized value is the final index weight coefficient wMSD [39,41].
Finally, we obtain the comprehensive value Si of sub-system in year i in Equations (7)–(9):
Step 5: Count the average weights of two level indexes:
A W 1 , 2 = ( w A H P + w M S D ) / 2
Step 6: Calculate the final integrated weight of each indicator:
A W 3 = A W 1 A W 2
Step 7: Calculate the final score of subsystem:
S i = j = 1 t Y i j A W 3
where AW1, AW2 represent the average weights of the basic grade indicators and first grade indicators, respectively. AW3 denotes the final integrated weight of each indicator. Si represents the final score of f(U) and g(E), which is applied to Equations (10) and (11). Furthermore, t represents the number of indicator in comprehensive evaluation system, among them t = 20 in the comprehensive index system of urbanization and t = 15 in the comprehensive index system of air environment.

2.3.3. The Coupling Coordination Degree Model (CCDM)

Based on the concept of capacitive coupling and its coupling coefficient model in physics [42], in this paper, we build a coupling coordination degree model to evaluate the coupling relationship between multiple systems or factors [1,12,43,44].
The CCDM is given in Equations (10)–(12):
Step 8: Count the degree of coupling:
C = { ( f ( U ) g ( E ) ) ( [ f ( U ) + g ( E ) ] / 2 ) 2 } 1 / 2
Step 9: Calculate the overall effect level:
T = α f ( U ) + β g ( E )
Step 10: Calculate the degree of coupling coordination:
D = C T
where C represents the degree of coupling, f(U) is the level of urbanization sub-system and g(E) is the level of ambient air sub-system based on the PSR model. Here, f(U) and g(E) both be calculated by Si described above. D is the degree of coupling coordination and T reflects the overall effect level between urbanization and the air environment [45]. α and β represent the contributions of urbanization and the air environment subsystem, respectively. The determination of these values is described in detail in Section 3.2.
Combined with previous research [1,12,42], the level of coupling coordination (D) between urbanization and the air environment is divided into three classes and four subclasses. Subsequently, 12 different types are developed based on the comparative relationship between urbanization f(U) and the air environment g(E). The results are shown in Table 3.
Table 3. Classification of the development of coupling pattern of urbanization and the air environment.
First Grade IndexSecond Grade IndexThird Grade IndexFeatures
Balanced Development (Acceptable Interval)0.8 < D ≤ 1.0Superior Balanced Developmentg(E) − f(U) > 0.1Superiorly Balanced Development with Urbanization Lagged
f(U) − g(E) > 0.1Superiorly Balanced Development with Air Environment Lagged
0 ≤ |f(U) − g(E)| ≤ 0.1Superiorly Balanced Development with Urbanization and Air Environment
Transitional Development (Transitional Interval)0.5 < D ≤ 0.8Barely Balanced Developmentg(E) − f(U) > 0.1Barely Balanced Development with Urbanization Lagged
f(U) − g(E) > 0.1Barely Balanced Development with Air Environment Lagged
0 ≤ |f(U) − g(E)| ≤ 0.1Barely Balanced Development with Urbanization and Air Environment
Unbalanced Development (Unacceptable Interval)0.3 < D ≤ 0.5Slightly Unbalanced Developmentg(E) − f(U) > 0.1Slightly Unbalanced Development with Urbanization Hindered
f(U) − g(E) > 0.1Slightly Unbalanced Development with Hindered Air Environment
0 ≤ |f(U) − g(E)| ≤ 0.1Slightly Unbalanced Development with Urbanization and Air Environment
0 < D ≤ 0.3Seriously Unbalanced Developmentg(E) − f(U) > 0.1Seriously Unbalanced Development with Urbanization Hindered
f(U) − g(E) > 0.1Seriously Unbalanced Development with Air Environment Hindered
0 ≤ |f(U) − g(E)| ≤ 0.1Seriously Unbalanced Development with Urbanization and Air Environment

3. Results and Discussions

3.1. Variations of Comprehensive Urbanization and Air Environment Index

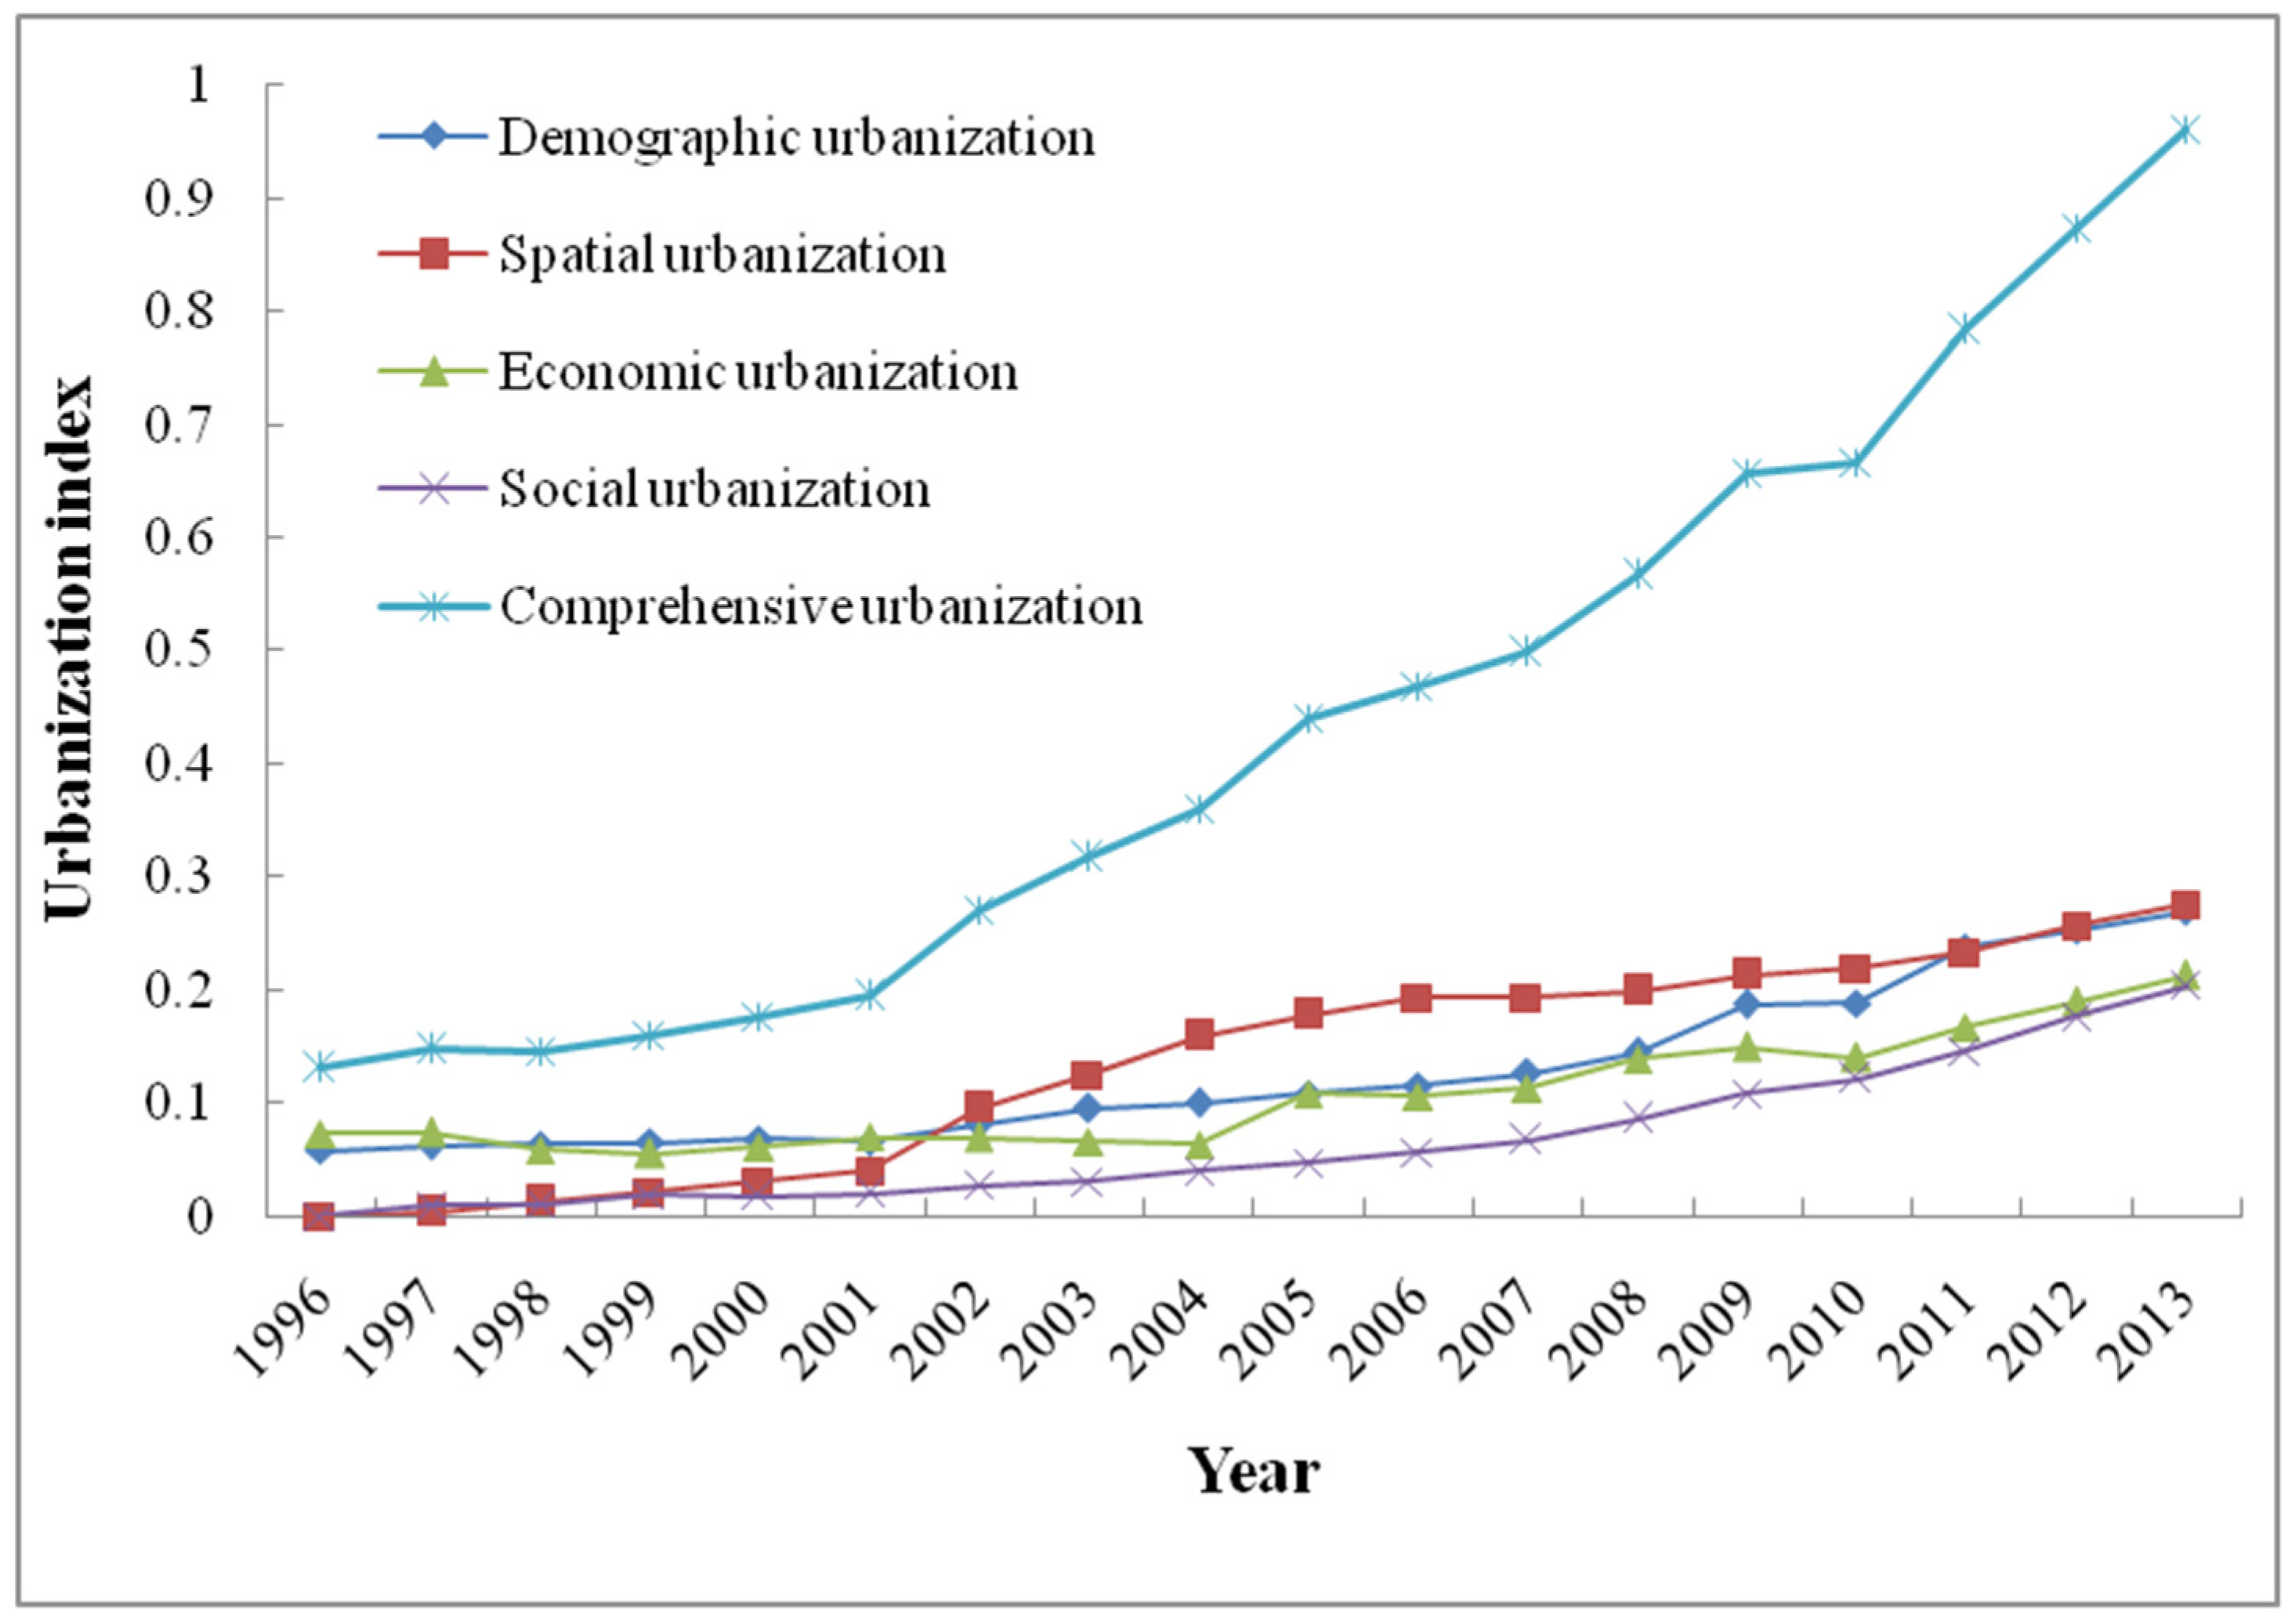
3.1.1. Variations of Comprehensive Urbanization

As shown in Table 1, spatial urbanization (0.276) makes the greatest contributions to comprehensive urbanization at the sub-system level, followed by demographic urbanization (0.269) and economic urbanization (0.251), and social aspects (0.204). However, this result is not consistent with those of Li (2012) [12] and Wang S.J. (2014) [3], illustrating that the main driving forces of urbanization vary among different cities. Large-scale urban expansion and population agglomeration are the main driving forces of urbanization in Wuhan. Additionally, in terms of the comprehensive weight of each index, the percentage of the nonagricultural population (0.080), the percentage of tertiary industry employment (0.069), the built-up area (0.067), urban living space per capita (0.063), and the percentage of second industry employment (0.062) are the five impact indicators that have the greatest effect. Taken together, they account for 34.1% of the total effect and are mainly expressed in demographic urbanization and spatial urbanization. Based on these analyses, in the past 18 years, growth of urban population, non-agricultural employment and the expansion of urban construction have been important elements of development. Urban planners and government agencies should pay more attention to the urban scale impacts when they are designing urban development policies.
The overall level of comprehensive urbanization in Wuhan exhibited a slow increasing trend from 1996–2000 and rapid growth after 2001 (Figure 3), whereas the sub-system aspects represented large degree variations. Spatial urbanization mainly increased from 2001–2006, whereas the other period showed a slow increasing trend. Economic urbanization mainly increased after 2004 due to the stimulation by the strategies of Central Rising and Wuhan Urban Agglomeration [46,47,48]. Demographic and social aspects showed a similar trend to the comprehensive urbanization curve, which indicates that demographic and social aspects had the greatest effect on the sub-system of urbanization. In fact, the original power of urbanization comes not only from population concentration from rural to urban areas and the movement of population from agricultural to non-agricultural sectors, but also from an improvement in the living standards of urban residents. Therefore, policy makers and environmental planners should pay more attention to social factors and issues (e.g., public transportation vehicles, private vehicles, exploitation of real estate) at the beginning of policymaking for rapidly urbanizing areas.
Figure 3. Trends of comprehensive urbanization and its sub-system level, 1996–2013.
Atmosphere 06 01539 g003

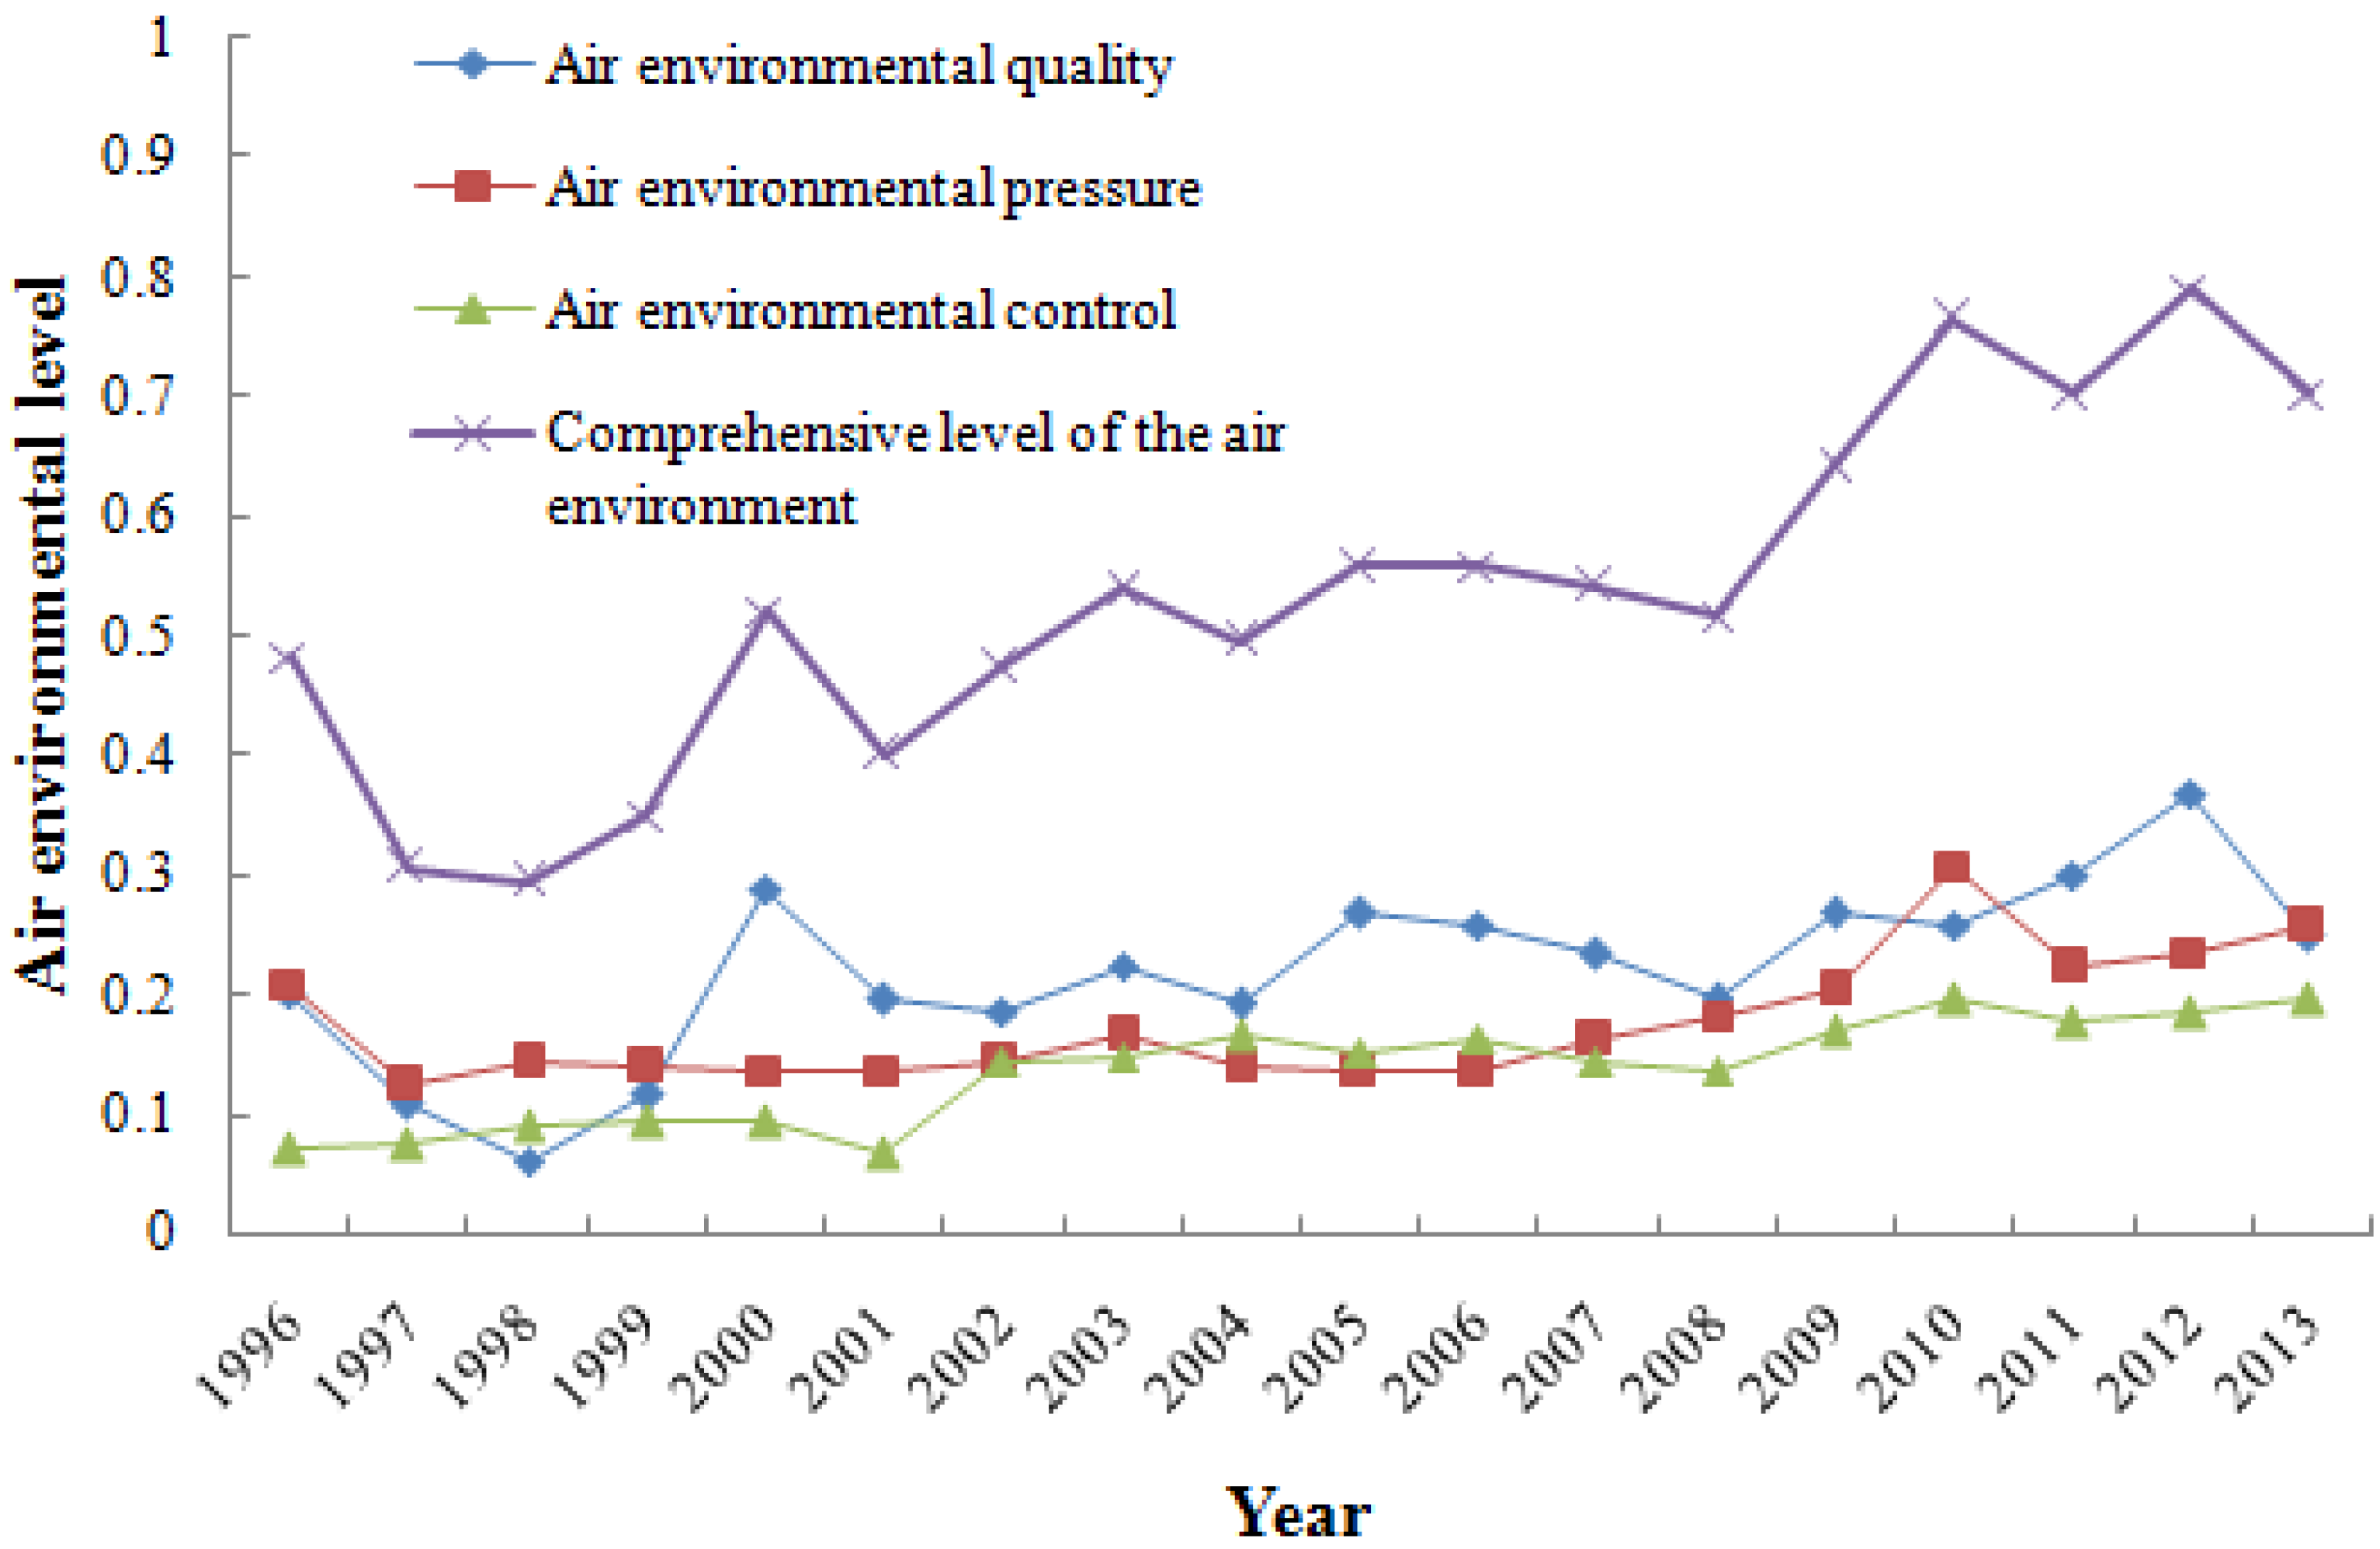
3.1.2. Variations of Comprehensive Level of Air Environment

As shown in Table 2, air environment quality (0.399) makes the greatest contributions to the overall level of the air environment, followed by air environment pressure (0.362) and air environment control (0.239). Four indicators of ambient air quality, PM10, SO2 and NO2 concentrations and average urban fallout, have significant effects on the air environment subsystem. Thus, air environment quality was the most important factor influencing evolution of the air environment system. Enhancing the capacity of air pollution control, reducing the pressure of air pollutant emissions, and improving the air environmental quality are the essential elements to ensure a virtuous cycle of the whole atmospheric environment system (Figure 2).
The comprehensive level of the air environment initially decreased from 1996–1998 and then increased with fluctuations in Wuhan with several inflection points (Figure 4). The trend was fairly consistent with the ambient air quality subsystem, and the main pollutants affecting the air quality were PM10 and NO2, the concentrations of which exceeded by 1.77 and 1.5 times the National Ambient Air Quality’s second standard (GB3095-2012), respectively. In contrast, the level of ambient air control exhibited a continuously increasing trend from 0.07 in 1996 to 0.20 in 2013. Also, it shows that the controlling ability of air pollution is a necessary condition for the improvement of air environmental quality, and that air quality improvement can be achieved in a short amount of time. Hence, improving the air environment quality is a long-term task and requires persistence.
Figure 4. Trends of the comprehensive level of the air environment and its subsystem level, 1996–2013.
Atmosphere 06 01539 g004
In short, the level of the comprehensive index system of urbanization and the ambient air of Wuhan increased from 1998–2013, whereas the overall level of the air environment sub-system experienced several fluctuations in the process of urbanization.

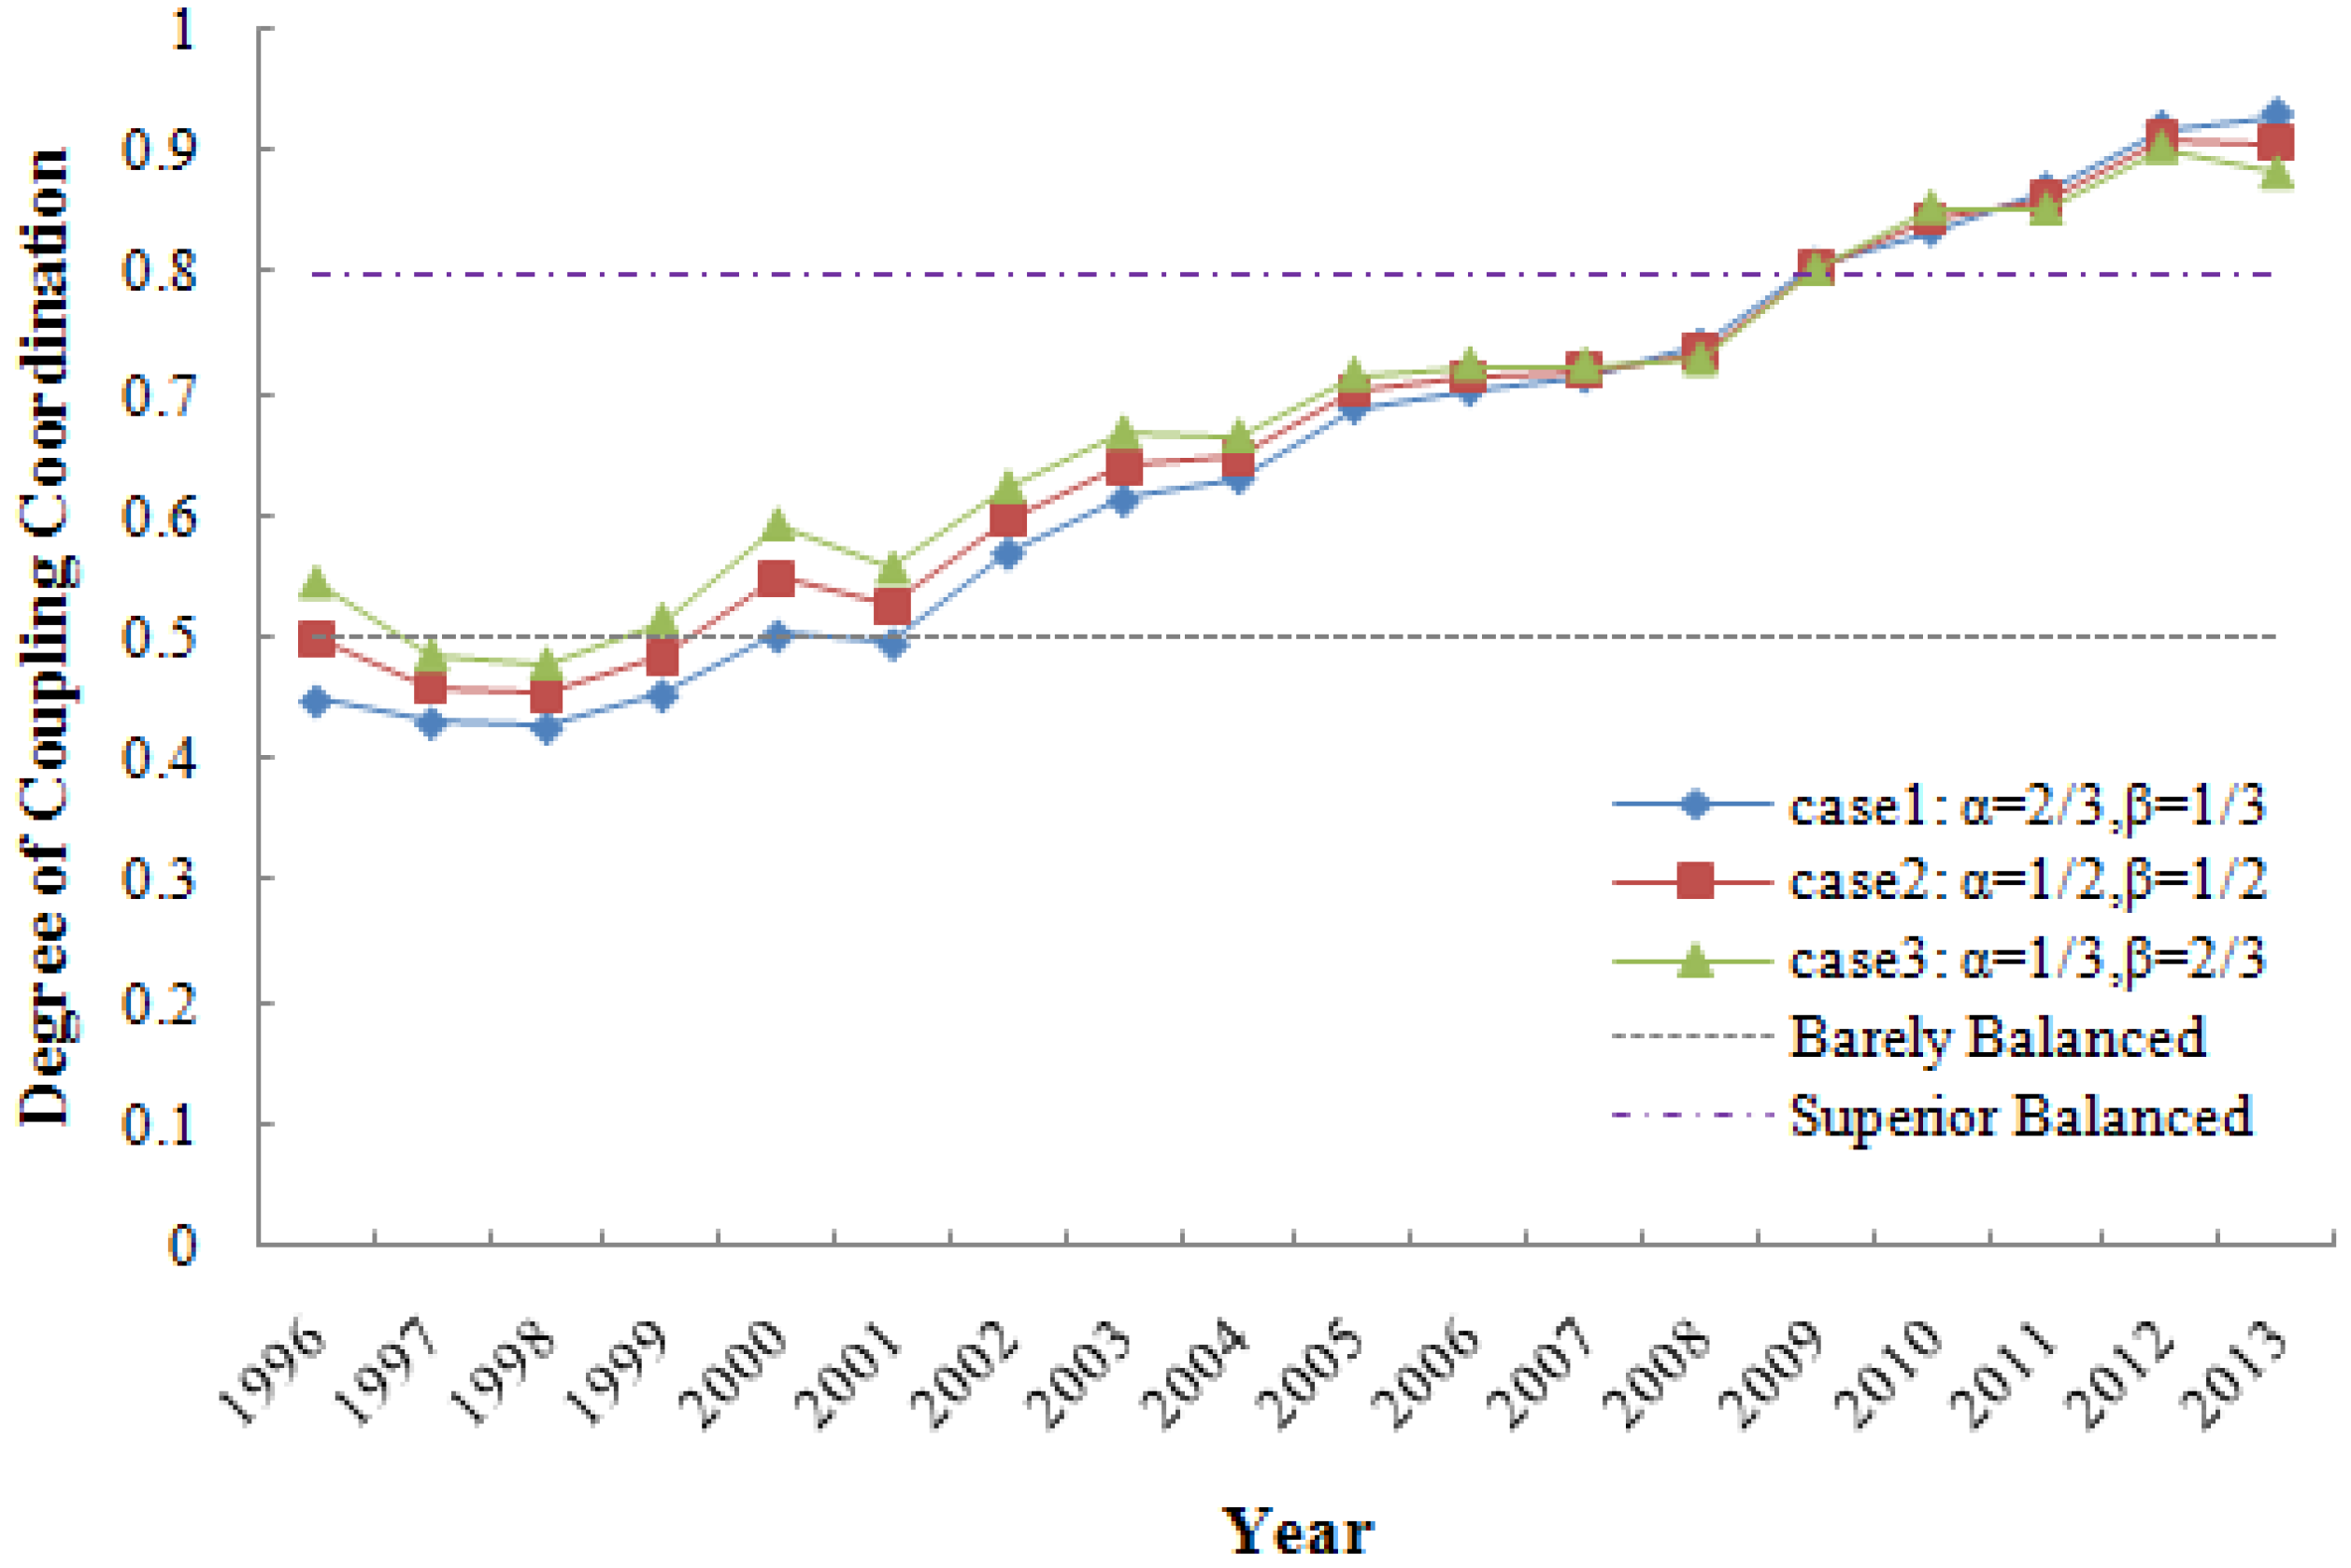
3.2. Coupling Results of Comprehensive Urbanization (α) and the Air Environment (β)

To explore the influence of urbanization and the air environment on the degree of coupling coordination, we analyzed three cases (α = 1/3, β = 2/3; α = 1/2, β = 1/2; α = 2/3, β = 1/3) with different values for urbanization and ambient air. The degree of coupling coordination for each case during the period 1996–2013 is shown in Table 4.
Although they differed slightly in specific coupling value (Figure 5), the overall trends were consistent, comparing the three different types of results. This finding indicates that the degree of coordinated coupling is not obviously influenced by the contribution quotient of the urbanization subsystem and air environment subsystem. Previous researches came to the same conclusion [1,12,44,49]. Therefore, we primarily focus on the general variation trends of the results.
Table 4. Degree of coupling coordination between urbanization and the air environment for three cases in Wuhan.
YearCase1: α = 2/3, β = 1/3Case2: α = 1/2, β = 1/2Case3: α = 1/3, β = 2/3
1996Slightly Unbalanced Development with Urbanization HinderedBarely Balanced Development with Urbanization LaggedBarely Balanced Development with Urbanization Lagged
1997Slightly Unbalanced Development with Urbanization HinderedSlightly Unbalanced Development with Urbanization Hindered
1998
1999Barely Balanced Development with Urbanization Lagged
2000Barely Balanced Development with Urbanization Lagged Barely Balanced Development with Urbanization Lagged
2001Slightly Unbalanced Development with Urbanization Hindered
2002Barely Balanced Development with Urbanization Lagged
2003
2004
2005
2006Barely Balanced Development with Urbanization and Air EnvironmentBarely Balanced Development with Urbanization and Air EnvironmentBarely Balanced Development with Urbanization and Air Environment
2007
2008
2009Superiorly Balanced Development with Urbanization and Air EnvironmentSuperiorly Balanced Development with Urbanization and Air EnvironmentSuperiorly Balanced Development with Urbanization and Air Environment
2010
2011
2012
2013Superiorly Balanced Development with Air Environment LaggedSuperiorly Balanced Development with Air Environment LaggedSuperiorly Balanced Development with Air Environment Lagged
Atmosphere 06 01539 i001
In general, the degree of coupling coordination between urbanization and the air environment initially decreased and then gradually increased, creating an S-shaped curve for 1996–2013, which is identical to the coupling relationship between urbanization and the eco-environment [1,3] and is approximately consistent with a double exponential curve [22,36]. We analyzed the dynamic change for three stages based on variation in the degree of coupling coordination and the levels of the comprehensive systems of urbanization and the air environment:
(1) 1996–1998: The degree of coupling coordination between urbanization and ambient air was in decline with cross-level change and resided mainly in the stage of slightly unbalanced development with urbanization hindered. During this period, the levels of the air environment subsystem were higher than those of the urbanization subsystem, whereas the comprehensive level of ambient air significantly decreased and waste gas emissions increased rapidly (Figure 1). This indicates that this process is not coordinated and the two elements have adverse effects on each other. This imbalance likely occurred because relevant governmental agencies paid more attention to the development of the city than the air environmental carrying capacity.
(2) 1999–2008: The degree of coupling coordination between urbanization and the air environment improved. From 1999–2005, the degree of coordinated coupling was situated in the stage of barely balanced development with urbanization lagged. The comprehensive level of the air environment changed in a relatively flat manner and remained still higher than the level of urbanization, although the latter rose rapidly. From 2006–2008, the degree maintained slow growth and entered into a barely balanced development period with urbanization and the air environment. Notably, the construction of a resource efficient and environmentally friendly society was vigorously carried forward in this period. The government began to pay attention to coordinating with the ecological environment while developing the urban economy [28].
Figure 5. Trends of the degree of coupling coordination between urbanization and the air environment.
Atmosphere 06 01539 g005
(3) 2009–2013: Entering into a new phase of coordinated development, Wuhan maintained sound development that was superiorly balanced with air environment. Specifically, from 2009–2012, urbanization developed rapidly, and the air environment sub-system improved unsteadily. Thus, simultaneous coupled development of urbanization and the environment was achieved. However, the degree of coordinated coupling resulted in superiorly balanced development, with the air environment lagging in 2013. On one hand, the level of urban construction of Wuhan increased unceasingly [47], and the levels of the urbanization subsystem started to outpace their environment subsystem. On the other hand, the ambient air quality was much worse than in 2011 and 2012, resulting in a further reduction in the comprehensive level of the air environment. Therefore, relevant governmental departments should continue to improve the air environment quality, and not relent, despite the coordinated coupling relationship being superiorly balanced.
Overall, before 1998, the coupling curve declined, likely because the earlier urban master plan did not meet the strong demands of the city considering its rapid development. After 1999, Wuhan experienced a rapid urbanization process. The level of coupling rapidly increased, with superiorly balanced development since 2009. With the improvement in the level of urbanization, technological innovation and adjustments in the energy structure, the degree of coupling coordination between urbanization and the air environment was strengthened in some ways. However, it cannot be ignored that the air environment presents much uncertainty and complexity [50]; for instance, weather conditions may intensify in years of high air pollution or exogenous pollutants may deteriorate local air quality. For instance, in autumn and winter 2013, the precipitation and rainfall days in Wuhan were much less than the same period in previous years, which is one of the main factors causing heavy air pollution.

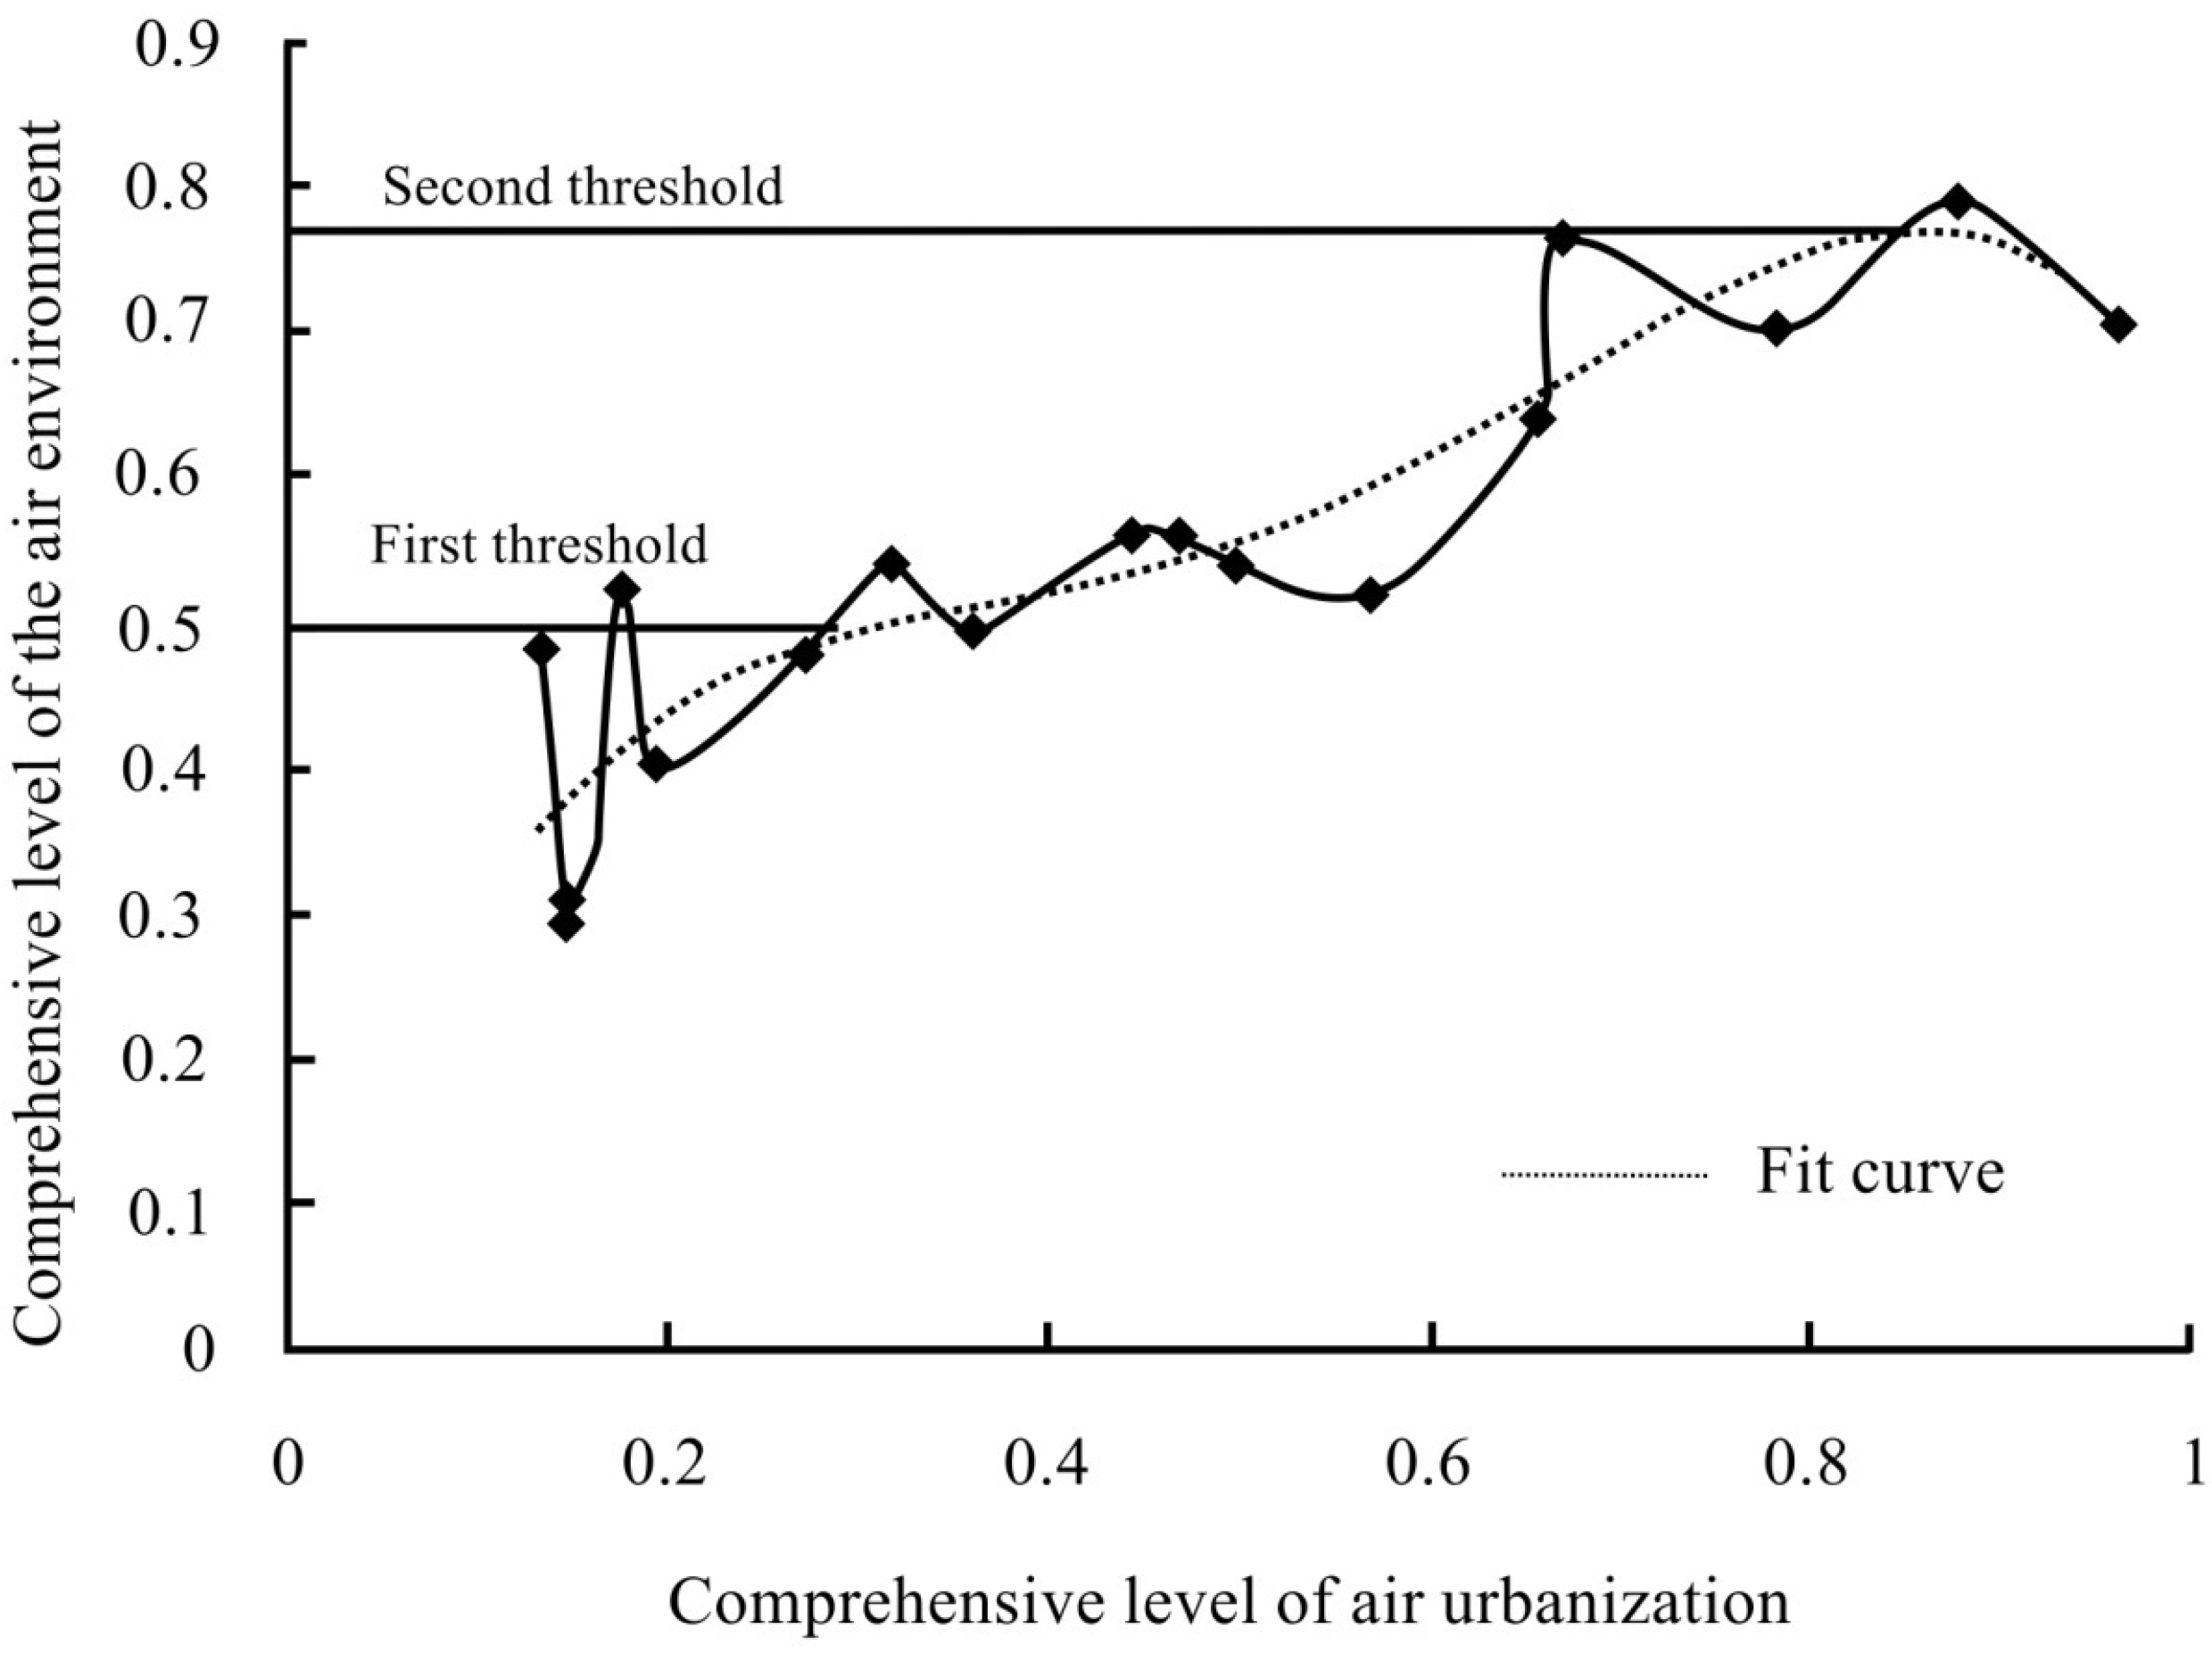
3.3. Fit Curve between Urbanization and Air Environment

To further reveal the curve function relationship between urbanization and the air environment, we obtain the coupling equation by polynomial fitting, shown in Figure 6. The coupling equation is as follows (with the R-square = 0.819, indicating good fit).
f ( U ) = 8.652 g 4 ( E ) + 17.96 g 3 ( E ) 12.74 g 2 ( E ) + 4.058 g ( E ) + 0.008
Compared with known coupling theory [3,22], the equation of double exponential curve was not observed as expected. A quartic equation was obtained (Figure 6) and trended to a logistic curve (in the form of a stepped curve). During the study period, following the threshold value law [36], there were two air environmental threshold values, one appeared in 2003 and another appeared in 2012. With the progress of urbanization, the air environmental capacity gradually approached the threshold limit value, and the level of the air environment deteriorated again after 2012. Accordingly, the interaction between urbanization and the air environment entered a new cycle, and new requirements on the construction of new pattern urbanization were put forward.
Undoubtedly, the coupling coordination degree model and coupling curve are important for the city in future development plans [12], such as environmental plans, industrial plans and urban plans. As a core city of the urban agglomeration in the middle reaches of the Yangtze River, it is important to monitor these coupling factors and promote sustainable urbanization in Wuhan. In fact, the Wuhan government is aware that large-scale urban expansion brings huge pressure on the air environment quality, and has begun to implement targeted measures to improve the air environmental quality since 2011. Subsequently, Wuhan successively compiled several environmental plans, such as the Wuhan 12th Five-Year Ecological Environment Protection Plan (20112015), The Action Plans for Improving Air Quality in Wuhan (20132017) and Wuhan Ambient Air Quality Reaching Standard Planning (20132027). Meanwhile, Wuhan is going to invest 29 billion Yuan in improving the air environmental quality, strengthening environmental protection management and reducing motor vehicle emissions and soot dust pollution beginning in 2014. In addition, Wuhan introduced the system construction of ecological civilization and an assessment method for the construction of an ecological civilization. The city implemented the circular economy promotion law in 2013. Through this policy guidance and industrial adjustment, funding and other necessary means are introduced to improve the overall level of the air environment and promote regionally coordinated development with urbanization.
Figure 6. Coupling fit curve of urbanization and the air environment in Wuhan.
Atmosphere 06 01539 g006

4. Conclusions

Studies on the interaction between urbanization and the air environment are important for guiding future environmental policy-making and sustainable development strategies for the city. The coordinated development of urbanization and the air environment subsystem is a dynamic, rather than static, process. In this paper, taking Wuhan as an example, we developed a CCDM to quantitatively evaluate the degree of coupling between these two systems. As the above research shows, the degree of coordinated coupling between urbanization and the air environment exhibits an S-type curve for the period of 1996–2013 in the study area. Wuhan changed from experiencing slightly unbalanced development to barely balanced development and, finally, superiorly balanced development.
In the context of rapid urbanization, the air environment problem has garnered more attention. This study proposes a new comprehensive index system for the assessment of urbanization and the air environment, and evaluates the weight of each indicator based on AHP and MSD. We find that spatial urbanization and the air environment quality make greater contributions to the compound system than other factors. After 2001, the urbanization of Wuhan entered a period of rapid growth, when urban population growth and aggregation, urban space expansion and urban economic development had remarkable effects on the air environment. Meanwhile, the city was able to treat pollution emissions in a more centralized way as a consequence of industrial agglomeration and technological innovation with the process of urbanization. The city improved its operational efficiency of treatment facilities and level of pollution treatment to effectively alleviate air pollution. Therefore, the degree of coupling coordination maintained steady growth, and resulted in superiorly balanced development during the period of 2009–2013. Additionally, two indicators of ambient air quality, PM10 and SO2 concentration, have the greatest effects on the air environment subsystem. This finding indicates that it is necessary to substantially reduce the emissions of industrial pollutants and particulate matter, vigorously develop a circular economy and use resources efficiently to improve the air quality and create an ecologically livable city.
From a metropolitan perspective, this paper explores the coupling relationship between urbanization and the air environment for Wuhan. Considering the particularities of different cities, future studies need to expand by including more samples in different types of cities to establish a general rule or more accurate curve for explaining the coupling coordination relationship between them.

Acknowledgments

This work is financially supported by the National Natural Science Foundation of China (Grant Nos. 41401181) and the Natural Science Foundation of Hubei Province (Grant No. 2013CFB010).
The authors would also like to thank Kunlun Chen and Ting Huang.

Author Contributions

Lei Ding and Chao Liu designed the study, analyzed the data and wrote the manuscript. Weituo Zhao, Yalin Huang and Shenggao Cheng collected the data, coordinated the data-analysis and revised the paper.

Conflicts of Interest

The authors declare no conflict of interest.

References

  1. Wang, S.J.; Fang, C.L.; Wang, Y. Quantitative investigation of the interactive coupling relationship between urbanization and eco-environment. Acta Ecol. Sin. 2015, 35, 2244–2254. (In Chinese) [Google Scholar]
  2. Luo, T.; Liu, Y.F.; Kong, X.S. System coupling between urbanization and eco-environment: Research progress in China. Trop. Geogr. 2014, 34, 266–274. (In Chinese) [Google Scholar]
  3. Wang, S.J.; Ma, H.T.; Zhao, Y.B. Exploring the relationship between urbanization and the eco-environment—A case study of Beijing-Tianjin-Hebei region. Ecol. Indic. 2014, 45, 171–183. [Google Scholar] [CrossRef]
  4. Yin, K.; Wang, R.S.; An, Q.X.; Yao, L.; Liang, J. Using eco-efficiency as an indicator for sustainable urban development: A case study of Chinese provincial capital cities. Ecol. Indic. 2014, 36, 665–671. [Google Scholar] [CrossRef]
  5. Wang, Z.B.; Fang, C.L.; Cheng, S.W. Evolution of coordination degree of eco-economic system and early-warning in the Yangtze River Delta. J. Geogr. Sci. 2013, 23, 147–162. [Google Scholar] [CrossRef]
  6. Wang, Q.S.; Yuan, X.L.; Ma, C.Y.; Zhang, Z.; Zuo, J. Researchon the impact assessment of urbanization on air environment with urban environmental entropy: A case study. Stoch. Environ. Res. Risk Assess. 2012, 26, 443–450. [Google Scholar] [CrossRef]
  7. Chen, R.J.; Wang, X.; Meng, X.; Hua, J.; Zhou, Z.J.; Chen, B.H.; Kan, H.D. Communicating air pollution-related health risks to the public: An application of the air quality health index in Shanghai, China. Environ. Int. 2013, 51, 168–173. [Google Scholar] [CrossRef] [PubMed]
  8. Xia, T.Y.; Wang, J.Y.; Song, K.; Da, L.J. Variations in air quality during rapid urbanization in Shanghai, China. Landsc. Ecol. Eng. 2014, 10, 181–190. [Google Scholar] [CrossRef]
  9. Luo, Y.P.; Chen, H.; Zhu, Q.A.; Peng, C.H.; Yang, G.; Yang, Y.Z.; Zhang, Y. Relationship between air pollutants and economic development of the provincial capital cities in China during the past decade. PLoS One 2014, 9, 1–14. [Google Scholar] [CrossRef] [PubMed]
  10. Xu, J.H.; Wang, X.S.; Zhang, S.Q. Risk-based air pollutants management at regional levels. Environ. Sci. Policy 2013, 25, 167–175. [Google Scholar] [CrossRef]
  11. Zhu, W.J.; Wang, J.Z.; Zhang, W.Y.; Sun, D.H. Short-term effects of air pollution on lower respiratory diseases and forecasting by the group method of data handling. Atmos. Environ. 2012, 51, 29–38. [Google Scholar] [CrossRef]
  12. Li, Y.F.; Li, Y.; Zhou, Y.; Shi, Y.L.; Zhu, X.D. Investigation of a coupling model of coordination between urbanization and the environment. J. Environ. Manage. 2012, 98, 127–133. [Google Scholar] [CrossRef] [PubMed]
  13. Grossman, G.M.; Krueger, A.B. Environmental Impacts of a North American Free Trade Agreement; MIT Press: Cambridge, MA, USA, 1991. [Google Scholar]
  14. Grossman, G.M.; Krueger, A.B. Economic growth and the environment. Q. J. Econ. 1995, 110, 353–378. [Google Scholar] [CrossRef]
  15. Shafik, N. Economic development and environmental quality: An econometric analysis. Oxford Econ. Pap. 1994, 46, 757–773. [Google Scholar]
  16. Selden, T.M.; Song, D. Environmental quality and development: Is there a Kuznets curve for air pollution Emissions? J. Environ. Econ. Manag. 1994, 27, 147–162. [Google Scholar] [CrossRef]
  17. Shaw, D.; Pang, A.; Lin, C.C.; Huang, M.F. Economic growth and air quality in China. Environ. Econ. Policy Stud. 2010, 12, 79–96. [Google Scholar] [CrossRef]
  18. Brajer, V.; Mead, R.W.; Xiao, F. Searching for an Environmental Kuznets Curve in China’s air pollution. China Econ. Rev. 2011, 22, 383–397. [Google Scholar] [CrossRef]
  19. Park, S.; Lee, Y.M. Regional model of EKC for air pollution: Evidence from the Republic of Korea. Energ. Policy 2011, 39, 5840–5849. [Google Scholar] [CrossRef]
  20. Al-Rawashdeh, R.; Jaradat, A.Q.; Al-Shboul, M. Air pollution and economic growth in MENA countries: Testing EKC hypothesis. Environ. Res. Eng. Manag. 2015, 70, 54–65. [Google Scholar] [CrossRef]
  21. Li, Q.; Song, J.P.; Zhang, J.H.; Yu, W.; Hu, H. Dynamics in the effect of China’s urbanization on air quality. Acta Sci. Circumst. 2013, 33, 2402–2411. (In Chinese) [Google Scholar]
  22. Wang, Q.S.; Yuan, X.L.; Lai, Y.H.; Ma, C.Y.; Ren, W. Research on interactive coupling mechanism and regularity between urbanization and atmospheric environment: A case study in Shandong Province, China. Stoch. Environ. Res. Risk Assess. 2012, 26, 887–898. [Google Scholar] [CrossRef]
  23. Han, L.J.; Zhou, W.Q.; Li, W.F.; Li, L. Impact of urbanization level on urban air quality: A case of fine particles (PM2.5) in Chinese cities. Environ. Pollut. 2014, 194, 163–170. [Google Scholar] [CrossRef] [PubMed]
  24. Cheng, Z.; Jiang, J.K.; Fajardo, O.; Wang, S.X.; Hao, J.M. Characteristics and health impacts of particulate matter pollution in China (2001–2011). Atmos. Environ. 2013, 65, 186–194. [Google Scholar] [CrossRef]
  25. Wu, D.; Fung, J.C.H.; Yao, T.; Lau, A.K.H. A study of control policy in the Pearl River Delta region by using the particulate matter source apportionment method. Atmos. Environ. 2013, 76, 147–161. [Google Scholar] [CrossRef]
  26. Zhong, L.J.; Louie, P.K.K.; Zheng, J.Y.; Yuan, Z.B.; Yue, D.L.; Ho, J.W.K.; Lau, A.K.H. Science-policy interplay: Air quality management in the Pearl River Delta region and Hong Kong. Atmos. Environ. 2013, 76, 3–10. [Google Scholar] [CrossRef]
  27. Wang, Q.S.; Yuan, X.L.; Zhang, J.; Mu, R.M.; Yang, H.C.; Ma, C.Y. Key evaluation framework for the impacts of urbanization on air environment: A case study. Ecol. Indic. 2013, 24, 266–272. [Google Scholar] [CrossRef]
  28. Zeng, C.; He, S.W.; Cui, J.X. A multi-level and multi-dimensional measuring on urban sprawl: A case study in Wuhan Metropolitan Area, Central China. Sustainability 2014, 6, 3571–3598. [Google Scholar] [CrossRef]
  29. Lu, S.S.; Guan, X.L.; He, C.; Zhang, J.L. Spatio-temporal patterns and policy implications of urban land expansion in metropolitan areas: A case study of Wuhan Urban Agglomeration, Central China. Sustainability 2014, 6, 4723–4748. [Google Scholar] [CrossRef]
  30. Ren, L.J.; Cui, E.Q.; Sun, H.Y. Temporal and spatial variations in the relationship between urbanization and water quality. Environ. Sci. Pollut. Res. 2014, 21, 13646–13655. [Google Scholar] [CrossRef] [PubMed]
  31. Guo, Y.T.; Wang, H.W.; Nijkamp, P.; Xu, J.G. Space-time indicators in interdependent urban-environmental systems: A study on the Huai River Basin in China. Habitat. Int. 2015, 45, 135–146. [Google Scholar] [CrossRef]
  32. Bao, C.; Fang, C.L. Water resources constraint force on urbanization in water deficient regions: A case study of the Hexi Corridor, arid area of NW China. Ecol. Econ. 2007, 62, 508–517. [Google Scholar] [CrossRef]
  33. Organization for Economic Cooperation and Development. Towards Sustainable Development: Environmental Indicators; OECD: Paris, France, 1998. [Google Scholar]
  34. Organization for Economic Cooperation and Development. Environmental Indicators for Agriculture; OECD: Paris, France, 1998. [Google Scholar]
  35. Liu, X.Z.; Heilig, G.K.; Chen, J.M.; Heino, M. Interactions between economic growth and environmental quality in Shenzhen, China’s first special economic zone. Ecol. Econ. 2007, 62, 559–570. [Google Scholar] [CrossRef]
  36. Fang, C.L.; Wang, J. A theoretical analysis of interactive coercing effects between urbanization and eco-environment. Chin. Geogr. Sci. 2013, 23, 147–162. [Google Scholar] [CrossRef]
  37. Ishizaka, A.; Labib, A. Review of the main developments of the analytic hierarchy process. Expert Syst. Appl. 2011, 39, 14336–14345. [Google Scholar] [CrossRef] [Green Version]
  38. Chen, Y.; Yu, J.; Khan, S. The spatial framework for weight sensitivity analysis in AHP-based multi-criteria decision making. Environ. Model. Softw. 2013, 48, 129–140. [Google Scholar] [CrossRef]
  39. Dai, Q.H.; Liu, G.B.; Liu, M.Y.; Wang, Y.B. An evaluation on sustainable development of eco-economic system in small watershed in hilly area of Northeast China. Acta Geogr. Sin. 2005, 60, 210–218. (In Chinese) [Google Scholar]
  40. Li, J.; Heap, A.D. A review of comparative studies of spatial interpolation methods in environmental sciences: Performance and impact factors. Ecol. Inform. 2011, 6, 228–241. [Google Scholar] [CrossRef]
  41. Cocklin, C.R. Methodological problems in evaluating sustainability. Environ. Conserv. 1989, 16, 27–32. [Google Scholar]
  42. Liu, Y.B.; Li, R.D.; Song, X.F. Analysis of coupling degrees of urbanization and ecological environment in China. J. Nat. Resour. 2005, 20, 105–112. (In Chinese) [Google Scholar]
  43. Yang, Q.; Ding, Y.; De Vries, B.; Han, Q.; Ma, H.M. Assessing regional sustainability using a model of coordinated development index: A case study of mainland China. Sustainability 2014, 6, 9282–9304. [Google Scholar] [CrossRef]
  44. Tang, Z. An integrated approach to evaluating the coupling coordination between tourism and the environment. Tour. Manag. 2015, 46, 11–19. [Google Scholar] [CrossRef]
  45. Liu, Y.B.; Li, R.D.; Li, C.H. Scenarios simulation of coupling system between urbanization and eco-environment in Jiangsu province based on system dynamics model. Chi. Geogr. Sci. 2005, 15, 219–226. [Google Scholar] [CrossRef]
  46. Tan, R.H.; Liu, Y.L.; Liu, Y.F.; He, Q.S.; Ming, L.C.; Tang, S.H. Urban growth and its determinants across the Wuhan urban agglomeration, Central China. Habitat. Int. 2014, 44, 268–281. [Google Scholar] [CrossRef]
  47. Zeng, C.; Cui, J.X.; Zhang, M.D.; Liu, B. The comparison of urban and rural built-up land change: A county-level investigation in Wuhan agglomeration. In Proceedings of the IEEE 22nd International Conference on Geoinformatics, Kaohsiung, Taiwan, 25–27 June 2014.
  48. Huang, H.; Dennis, W.Y. Intra-metropolitan location of foreign direct investment in Wuhan, China: Institution, urban structure, and accessibility. Appl. Geogr. 2014, 47, 78–88. [Google Scholar] [CrossRef]
  49. Liu, Y.Q.; Xu, J.P.; Luo, H.W. An integrated approach to modeling the Economy Society Ecology System in urbanization process. Sustainability 2014, 6, 1946–1972. [Google Scholar] [CrossRef]
  50. Li, L.; Qian, J.; Ou, C.Q.; Zhou, Y.X.; Guo, C.; Guo, Y.M. Spatial and temporal analysis of Air Pollution Index and its timescale-dependent relationship with meteorological factors in Guangzhou, China, 2001–2011. Environ. Pollut. 2014, 190, 75–81. [Google Scholar] [CrossRef] [PubMed]

