Article

Optical Properties of Fine Particulate Matter in Upper Silesia, Poland

by
Jozef S. Pastuszka
1,
Wioletta Rogula-Kozłowska
2,*,
Krzysztof Klejnowski
2 and
Patrycja Rogula-Kopiec
2
1
Department of Air Protection, Silesian University of Technology, 22B Konarskiego Street, 44-100 Gliwice, Poland
2
Institute of Environmental Engineering of the Polish Academy of Sciences, Skłodowskiej-Curie Street, 41-819 Zabrze, Poland
*
Author to whom correspondence should be addressed.
Atmosphere 2015, 6(10), 1521-1538; https://doi.org/10.3390/atmos6101521
Submission received: 20 September 2015 / Revised: 12 October 2015 / Accepted: 12 October 2015 / Published: 20 October 2015
(This article belongs to the Special Issue Atmospheric Aerosols and Their Radiative Effects)

Abstract

:
Ambient particles whose aerodynamic diameters were not greater than 2.5 µm (fine fraction of Particulate Matter; PM2.5) and 1 µm (PM1; sub-fraction of PM2.5) were sampled at three sites in Upper Silesia (Poland): urban background site, rural background site, and urban traffic site. In total, 240 samples were collected between 2 August 2009 and 27 December 2010. The reflectance of the collected PM1 and PM2.5 samples was determined with a digital smoke stain reflectometer. The 24-h courses and seasonal changes of three determined optical parameters for PM1 and PM2.5 (absorption coefficient (a), mass absorption (σ), and mean light reflection coefficient (Rav)) were illustrated and discussed. The mean values of the regional background absorption coefficient (a) were 1.27 × 10⁻⁵ m−1 and 0.87 × 10⁻⁵ m−1 for PM2.5 and PM1, respectively. In Katowice (urban background), the mean absorption levels were 2.37 × 10⁻⁵ m−1 and 2.09 × 10⁻⁵ m−1 for PM2.5 and PM1, respectively. The highest values of the absorption coefficient for both PM fractions were found close to the highway (urban traffic site). In the heating season (winter), the absorption coefficient (a) for PM2.5 and PM1 increased significantly when compared with the non-heating season. The obtained results confirmed the thesis about the significant increase in the elemental PM2.5-bound carbon concentration caused by the intensified hard coal combustion in Upper Silesia in winter. Moreover, it turned out that the increase in the concentration of the PM2.5-bound sulphates was even higher, which resulted in the relative decrease of the elemental carbon content in this PM fraction in some areas. Consequently, the mass absorption value dropped there as well.

1. Introduction

It is known that atmospheric aerosol significantly affects the environment (not only air) and the health condition of the population exposed to the aerosol particles. What is more, the atmospheric aerosol plays an important role in the world-range climatic changes as it can change the radiation balance of the world. Concerning only the direct effects—aerosol cools the climate system by light scattering but warms the atmosphere by light absorption. The influence may also be indirect, causing changes in the cloud properties [1]. Presently, the direct and indirect effects of aerosols represent the largest uncertainty in climate prediction [2].
It was estimated that the total aerosol influence on the radiation balance (averaged for the entire planet) is approx. −0.5 W/m2. The presence of sulphates constituting the dominant fraction in fine particulate matter (PM2.5) was largely responsible for such a result [3]. Such changes were also reported on the regional scale. For example, it was estimated that the atmospheric aerosol caused a decrease of approx. 12% in the global solar radiation in the visual and ultraviolet range in Katowice, (a highly industrialized Polish city), in 1982–1986 [4]. On the other hand, elemental carbon (EC), being a heavy solar radiation absorber, was found to be an important part of airborne particles [1,5,6,7,8].
It is estimated that the EC participation in the direct influence on the radiation balance is lower only than the CO2 influence. As EC intensively absorbs the light and heat, it positively affects the radiation balance of the atmosphere and makes a significant contribution to the climate warming [1]. The reduction of the radiation amount reaching the Earth’s surface resulting from the EC particle presence in the atmosphere may contribute to the so-called global dimming [9].
The EC particles age in the atmosphere and bind with other aerosol components, which reduce their hydrophobicity. Consequently, the EC particles can mix with water drops in the atmosphere. Such an aerosol probably makes a negative contribution to the radiation balance [10,11]. The occurrence of the increased EC concentration in the atmosphere can result in the increase in its heating speed by 1–3 °C per day. It can also bring about the changes in the humidity profile. Therefore, it can affect the cloud formation processes and change their duration time in the atmosphere [5]
Organic carbon (OC) makes up an important part of the PM2.5 mass [12,13,14]. OC contains many various compounds whose molecular masses are lower than EC. It is considered as the PM fraction that does not absorb the radiation but contributes to its dispersion. In other words, the OC impact on the radiation balance is negative [1].
Although the scattering and absorption of light on the aerosol particles influence climatic changes in an antagonistic way, these two factors increase the horizontal light extinction—the sum of scattering and absorption. Therefore, the elevated level of airborne particles, mainly less than 2.5 µm (PM2.5), causes visibility degradation. Such high visibility degradation due to the high horizontal light extinction caused by the elevated level of airborne particles was found, for example, in Katowice [15]. In the Warsaw metropolitan area (similarly to certain Asian regions), a significant reduction in the visibility was observed in the periods of the increased concentrations of PM10 (ambient particles with aerodynamic diameters not greater than 10 µm) in the air [16,17]. However, not only a level of PM is important. A key factor in determining the optical characteristics of airborne particles is their physical and chemical characteristics, which depend on many parameters [18]. Although many studies have been conducted to understand the optical properties of atmospheric aerosol (for example [19,20,21]), a quantified relationship between chemical components of airborne particles and visibility degradation is still lacking.
In this study, the optical properties of fine PM, PM1 and PM2.5 (ambient particles with aerodynamic diameters not greater than 1 and 2.5 µm, respectively) and the seasonal changes in those properties were investigated and discussed in three characteristic areas of Upper Silesia (Poland). Upper Silesia was selected for the research due to the significant participation of the hard and brown coal (and its waste material, i.e., coal dust) combustion in the energy production. The coal combustion concerns the energy production in the power and heat and power stations and households. Using hard coal as the common resource allows thinking that the optical parameters should visibly indicate the adverse influence of the aerosol on the radiation balance in Upper Silesia.

2. Methods

2.1. Sampling Sites and PM Collecting
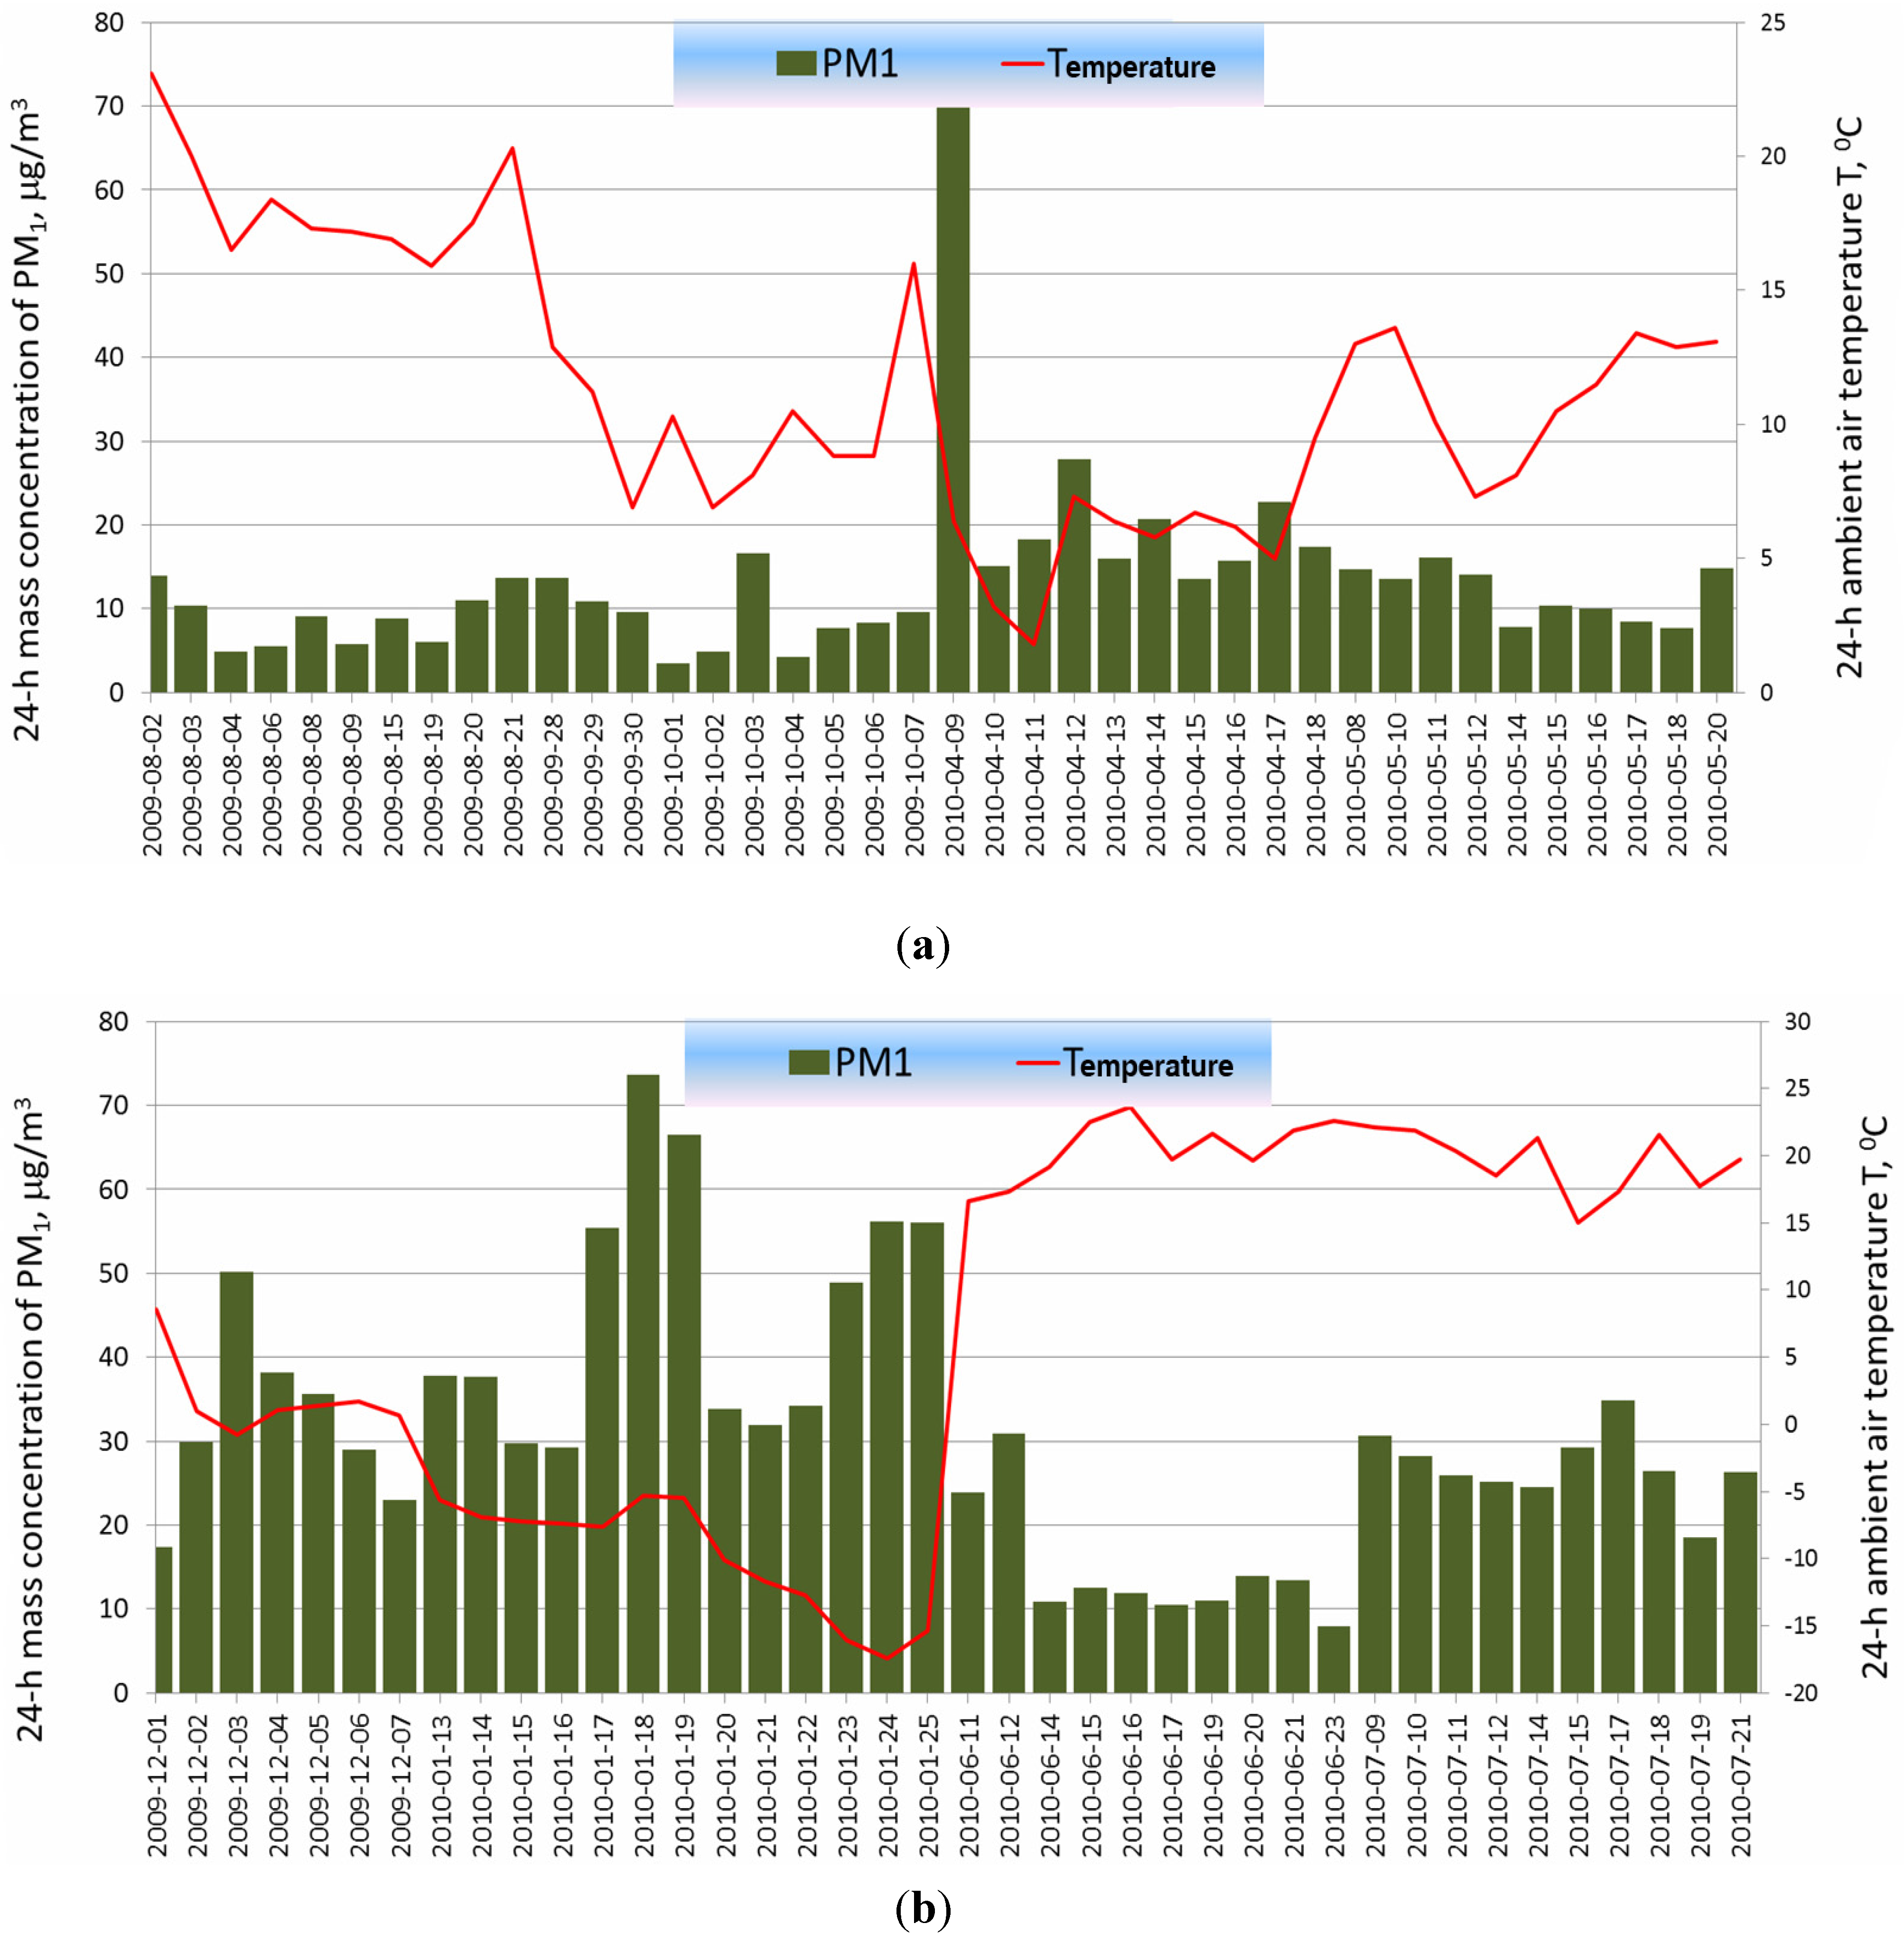
Twenty-four hours (24-h) PM1 and PM2.5 samples were collected at three sites in Upper Silesia, Poland. In Upper Silesia, the degradation of the environment related to hard coal excavation and production of coal-derivatives started in the early 19th century. The problem of the environmental pollution in the area was considered serious late, in the 1950s [22,23], and even this did not stem the further environmental degradation, most effective during the 1960s and 1970s. Although the industrial emissions have been seriously reduced during the last 30 years, the PM concentrations within the area are still one of the highest in the EU [12,13,24], mainly because of dense and obsolete housing, where poor quality hard coal, scrap, and household garbage are burnt in inefficient ovens to warm flats.
The sampling was performed with a high volume sampler (Digitel DHA-80) equipped with the PM1 and PM2.5 measuring heads. The samples were collected onto Whatman quartz fibre filters (QMA).
The first site fulfilled the conditions determined for the so-called urban background site (UB); the second site represented the regional background site (RB); whereas the third one was the so-called urban traffic site (urban site directly affected by the road traffic, UT) [25,26]. UB (geographic coordinates: 50°15′56″N, 18°58′40″E, 274 m·a.s.l.) was located in a residential district in the western part of Katowice, about 3.2 km west of the city centre. In its neighborhood, there were blocks of flats, commercial areas, and a railway line. There was also a post-mining ground at a certain distance from it. UT (geographic coordinates: 50°14′49″N, 19°01′04″E, 298 m·a.s.l.) was located almost on the shoulder of the A4 highway, about 1.5 km south of the city centre. The traffic volume was approx. 30,000 vehicles per day at this point. RB (geographic coordinates: 50°42′59″N, 19° 26′37″E, 283 m·a.s.l.) was located in Złoty Potok village (commune of Janów), approximately 20 km south-east of Częstochowa and 25 km north of Zawiercie. It was surrounded by meadows and arable lands. Several chalets and a forester’s house, all wood-heated, were found at a 150-m distance.
The research period took place between 2 August 2009 and 27 December 2010. In each heating and non-heating season, two measurement campaigns were held for each fraction at each site. However, there were no two consecutive campaigns at the same site. During one campaign, 6–14 (usually 10) 24-h samples of each PM fraction (PM1 or PM2.5) were collected. At each site, 40 samples of PM1 and 40 samples of PM2.5 were collected (240 samples in total).
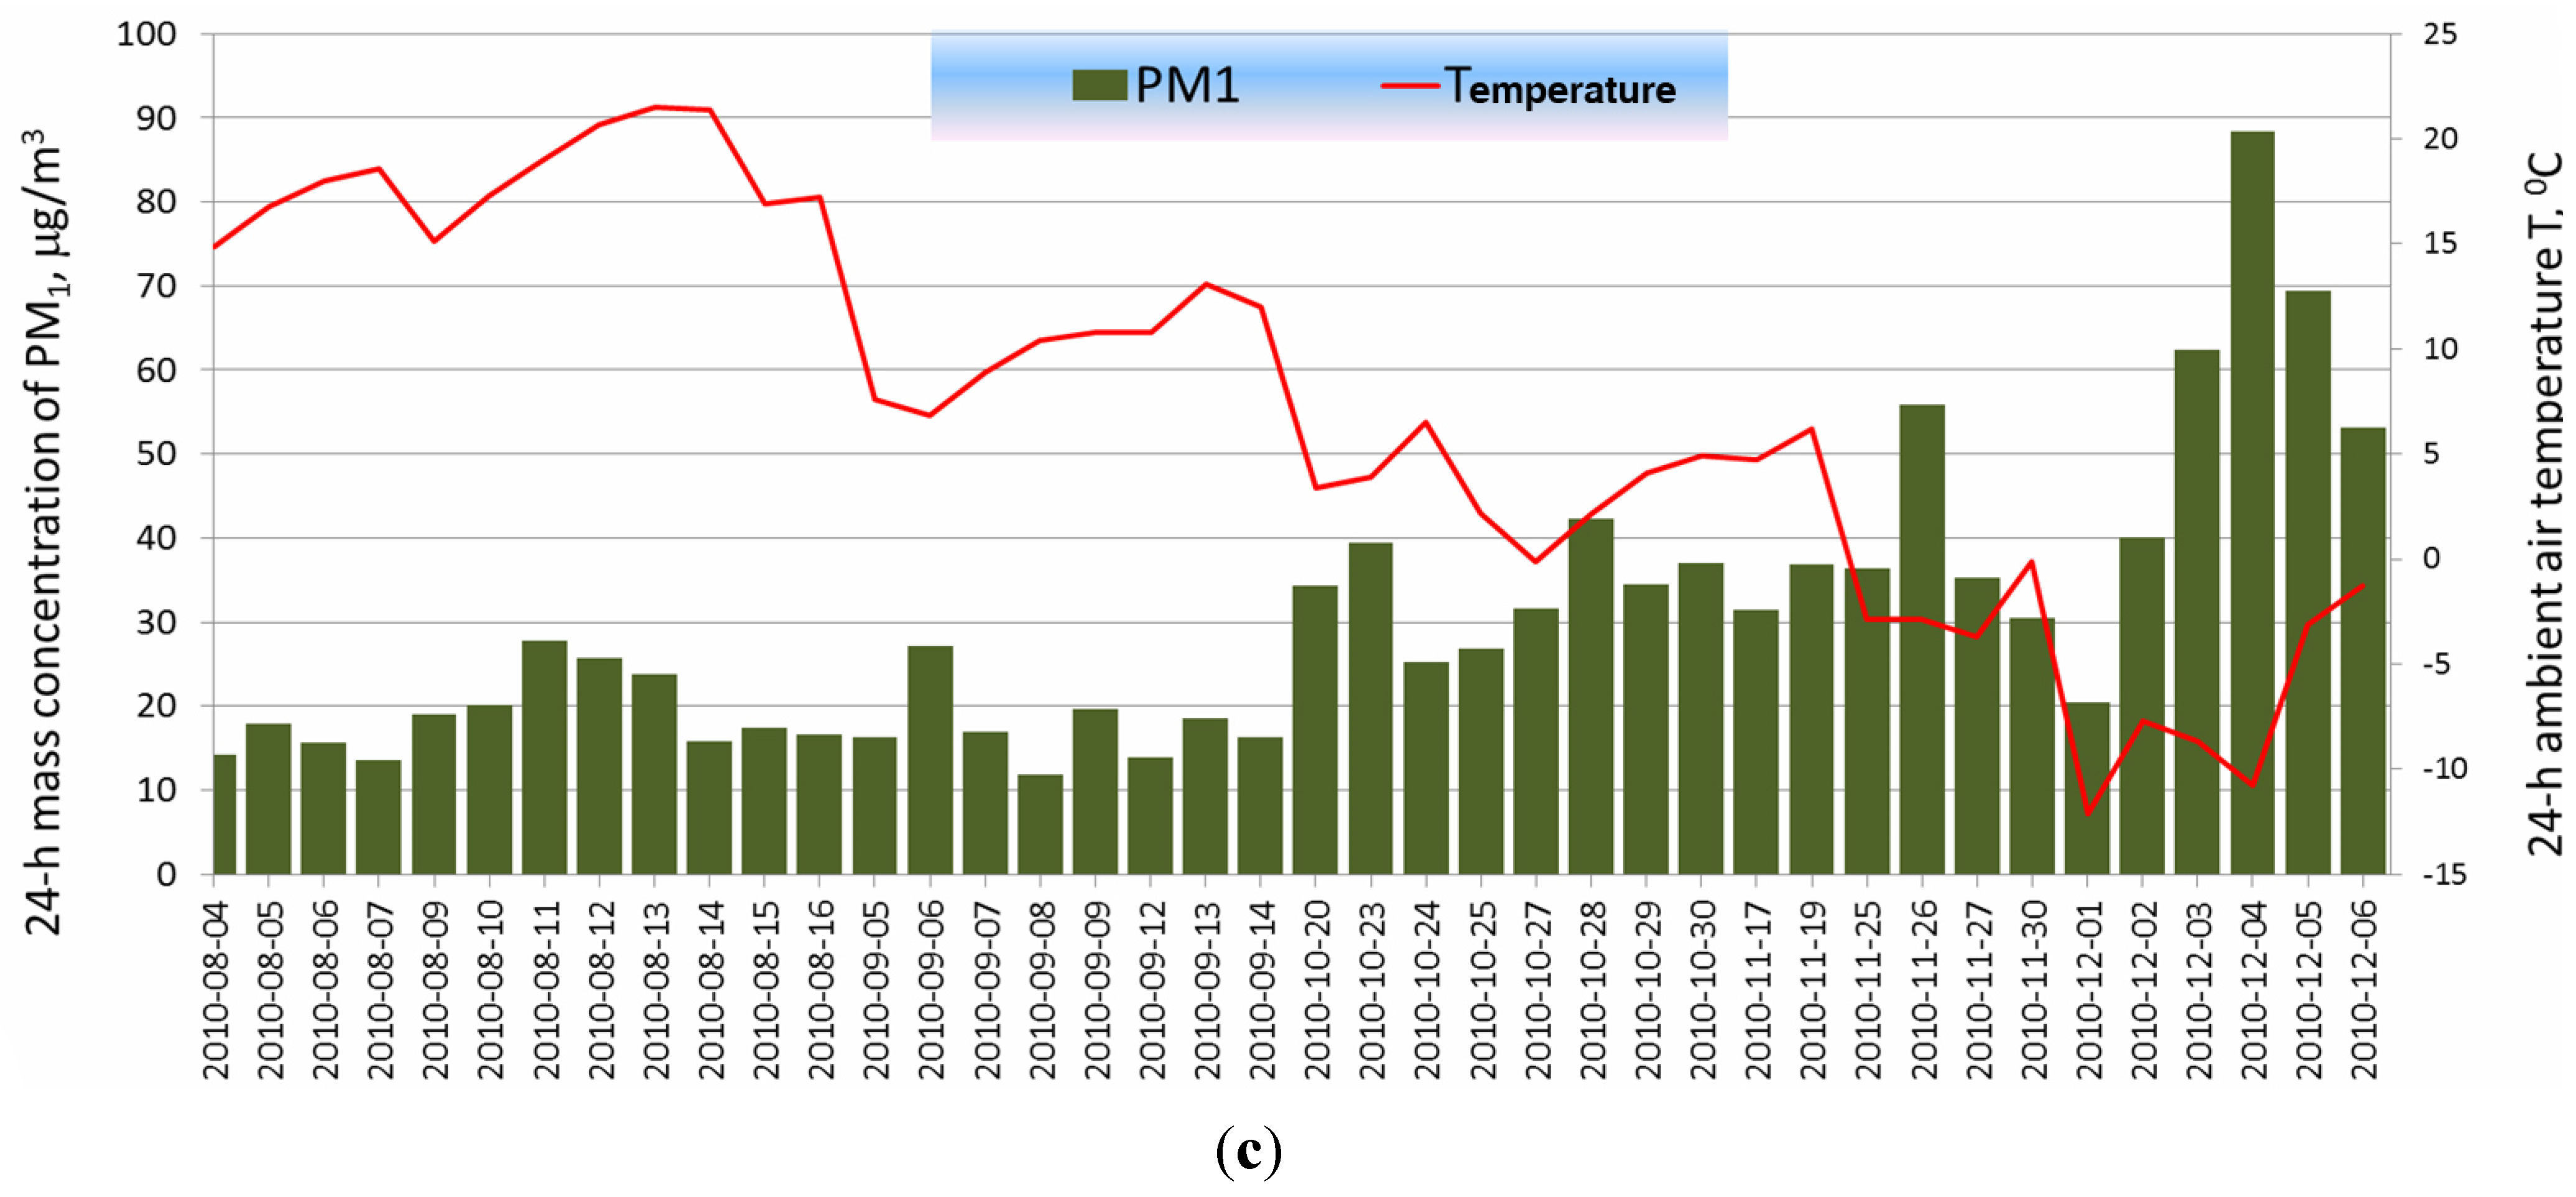
Figure 1. 24-h mass concentrations of PM1 at regional background site, RB (a), at urban background site, UB (b) and at urban traffic site, UT (c).
Atmosphere 06 01521 g001aAtmosphere 06 01521 g001b
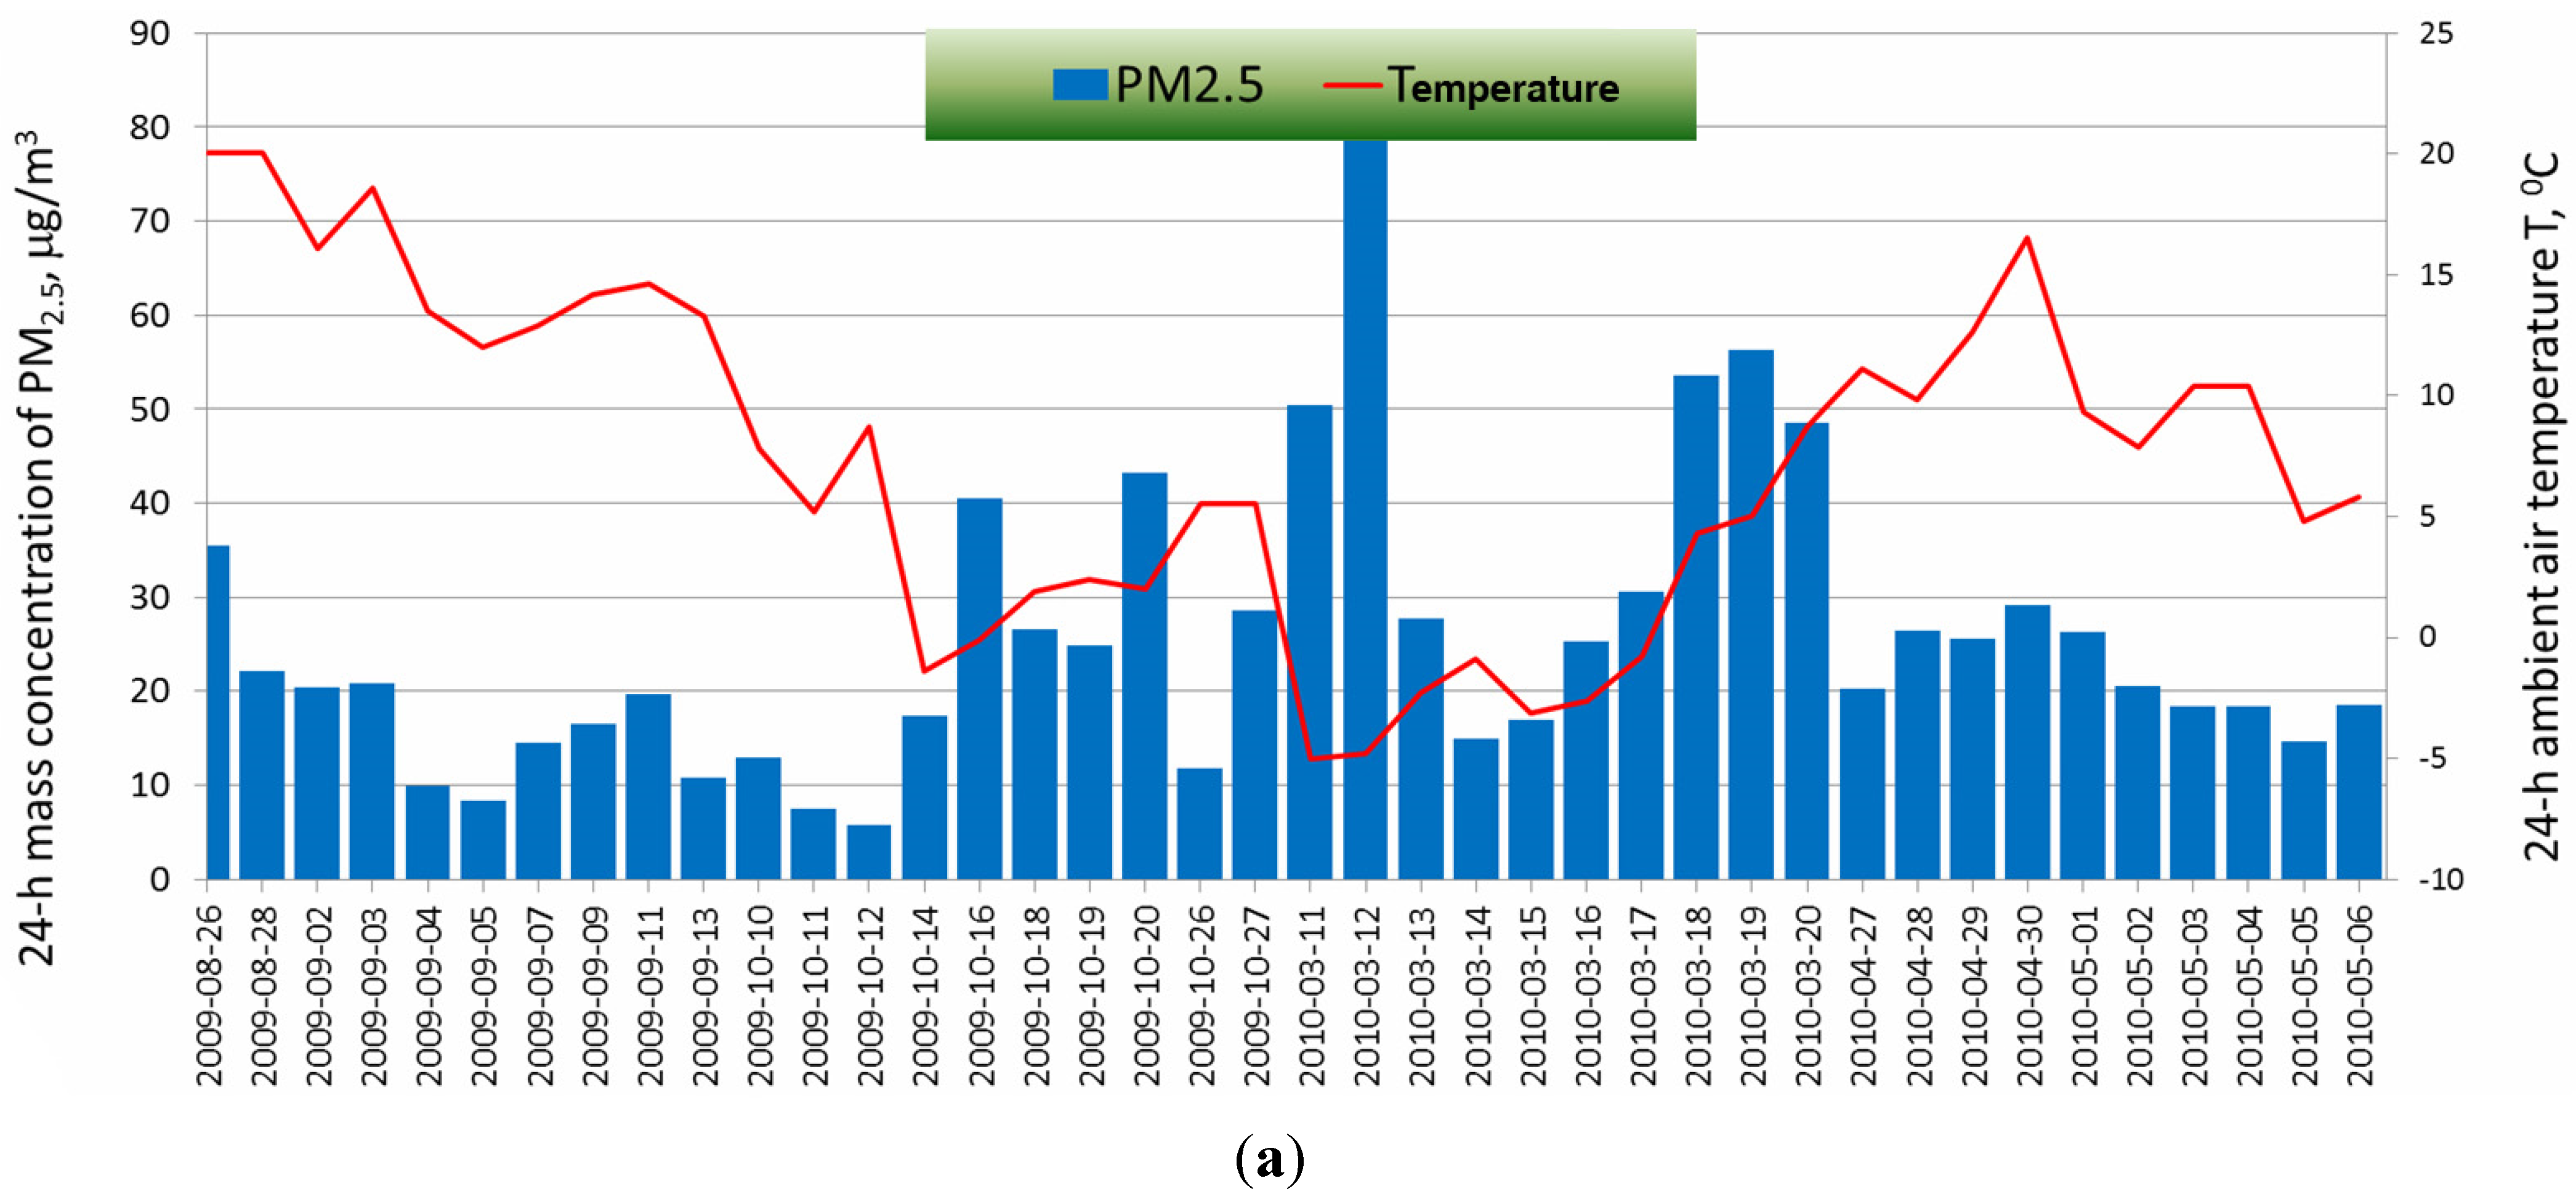
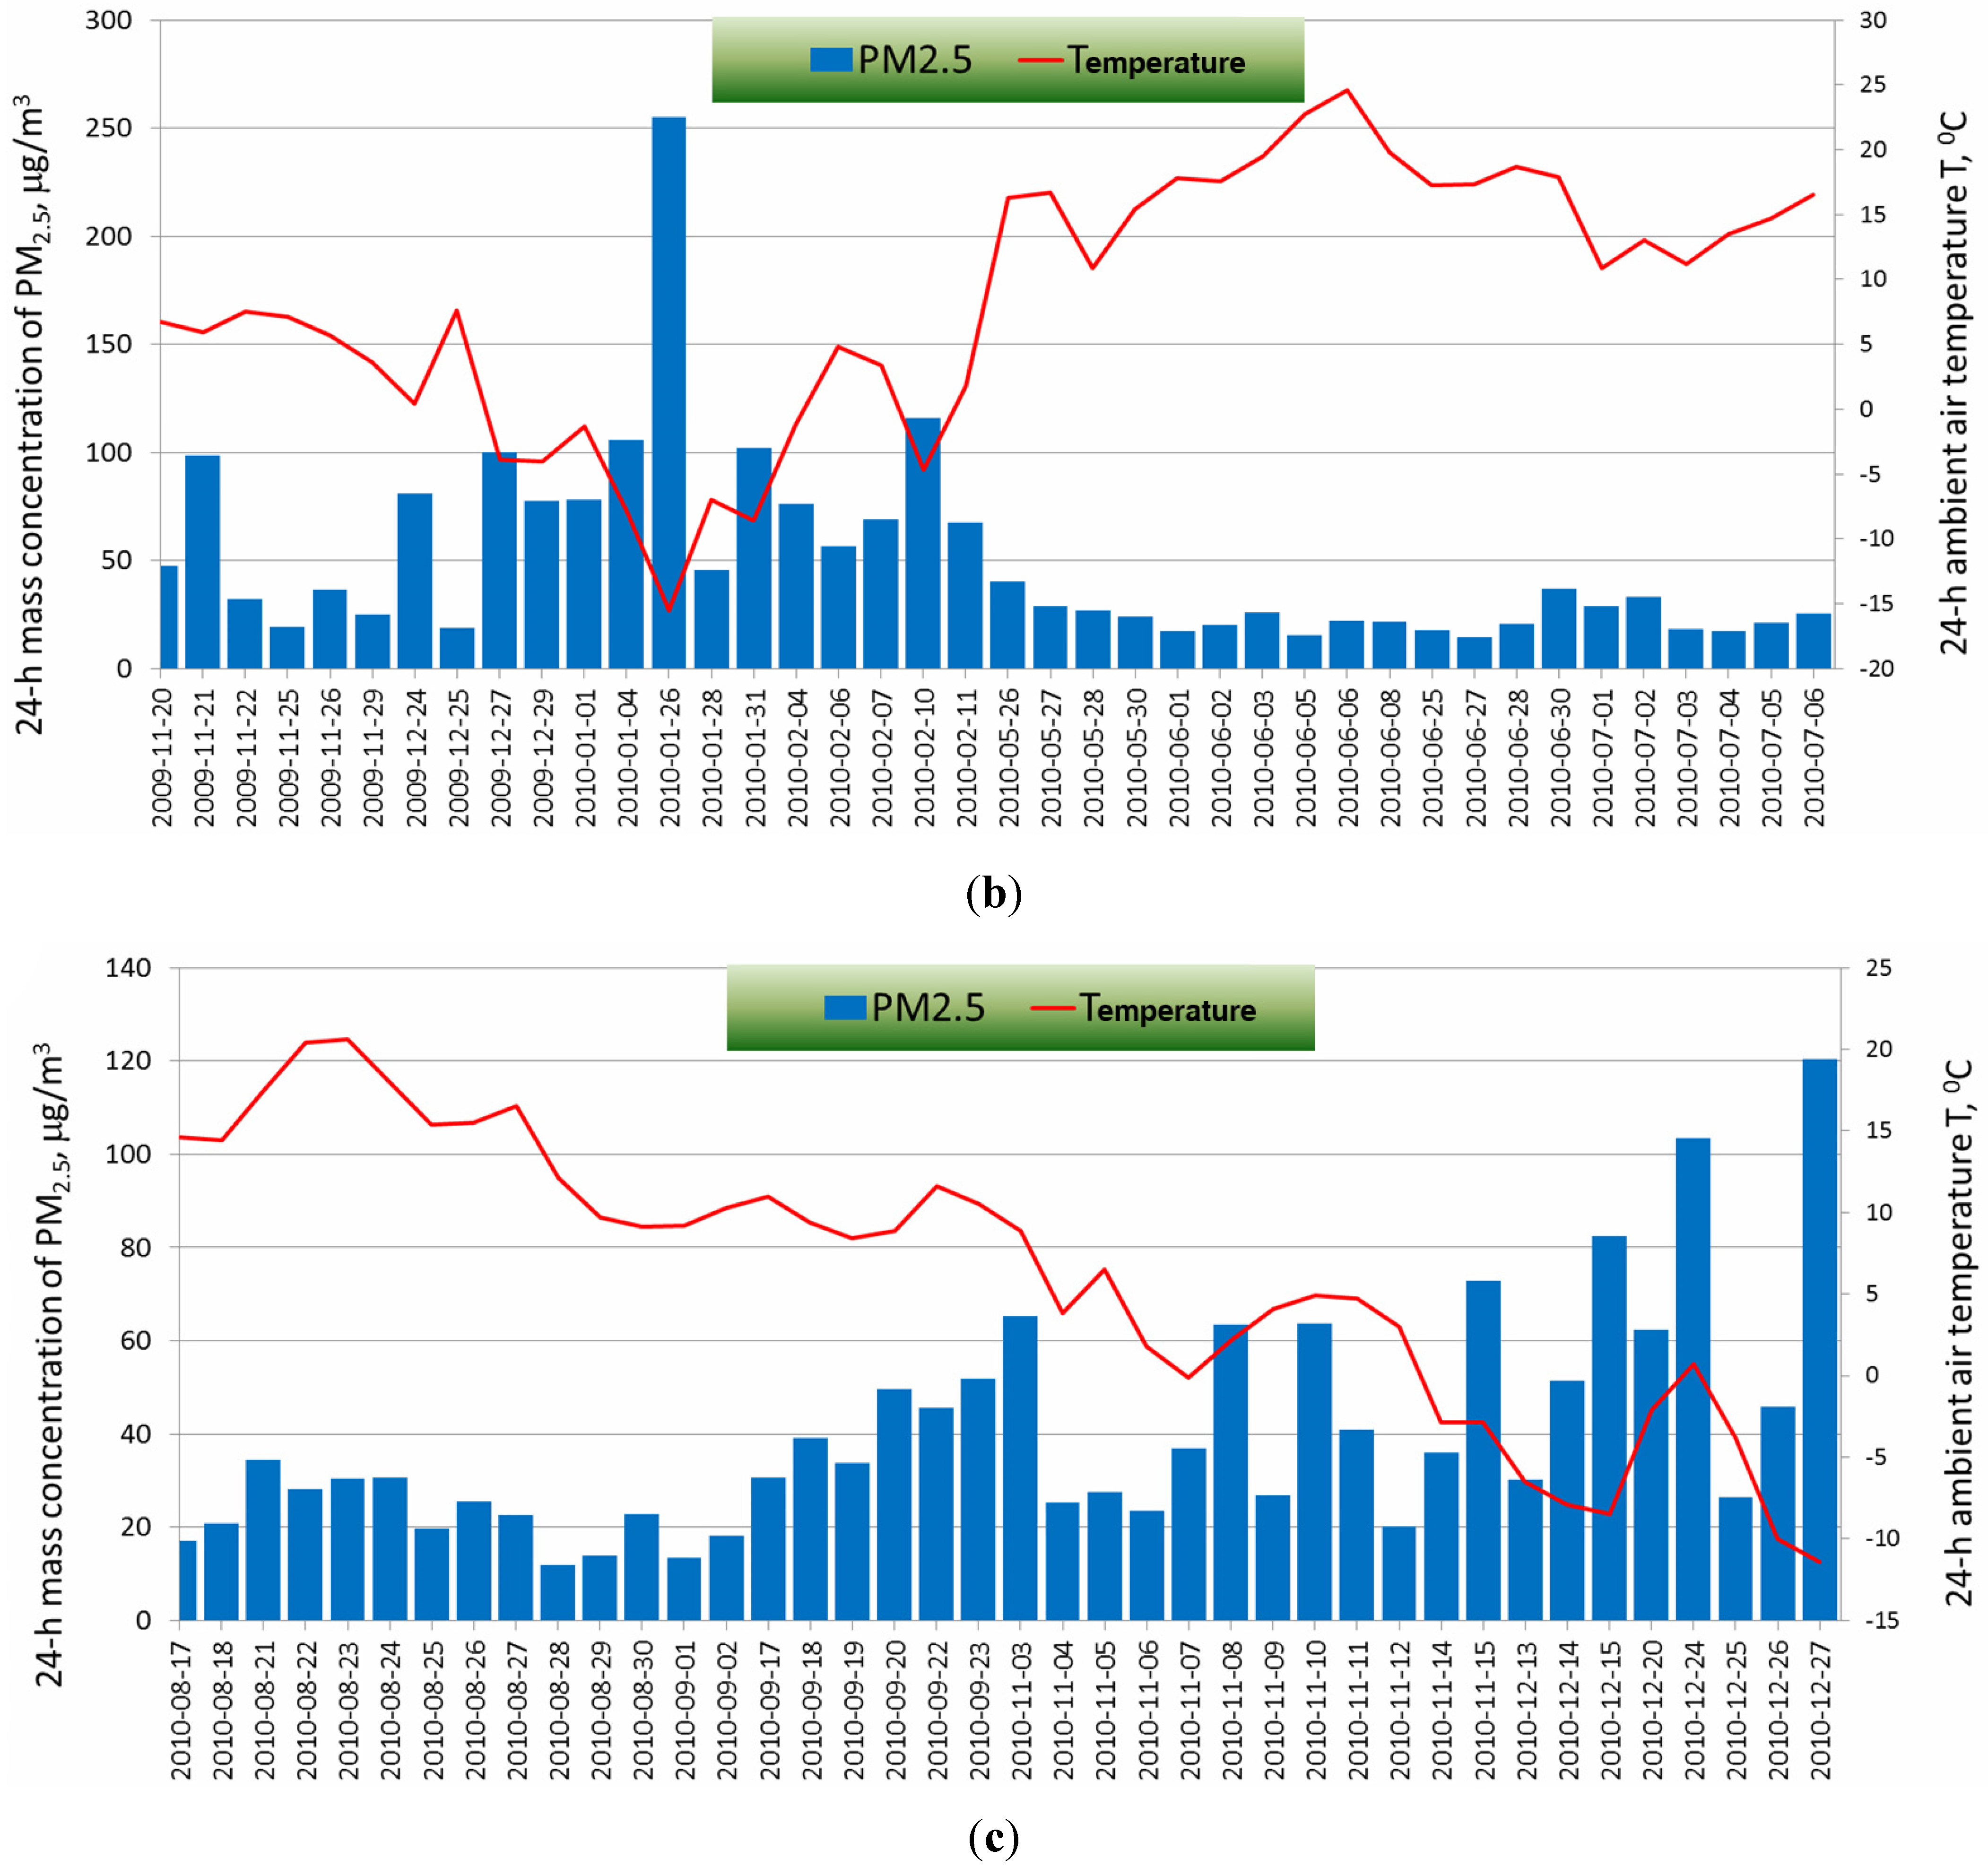
The sampled PM mass was determined gravimetrically (Sartorius balance, resolution 0.01 g) according to the CSN EN 14907 standard (Ambient air quality—Standard gravimetric measurement method for the determination of the PM2.5 mass fraction of suspended particulate matter). Before each weighing, filters were conditioned in a weighing room for at least 48 h, at the air temperature of 20 ± 1 °C, and air relative humidity of 50% ± 5%. The 24-h concentrations of PM1 and PM2.5 against the background of the air temperature changes are presented in Figure 1 and Figure 2.
Figure 2. 24-h mass concentrations of PM2.5 at regional background site, RB (a), at urban background site, UB (b) and at urban traffic site, UT (c).
Atmosphere 06 01521 g002aAtmosphere 06 01521 g002b

2.2. Determination of the Optical Parameters of PM
The reflectance of the collected PM1 and PM2.5 samples was determined with a digital smoke stain reflectometer (Model 43D, Diffusion Systems Ltd., London, UK), which measured the reflection of the white light incidence in %. One blank filter (per 10 exposed ones) was used to standardize the reflectometer reflectance to 100. Afterwards, the blank filter was replaced with the exposed filter and the reflectance was read. Each filter was measured 5 times at different filter spots to confirm the filter homogeneity. The reflectance (mean value obtained from five readings, Rav (%)) was converted into the absorption coefficient (a (m−1 × 10⁻⁵)).
It must be emphasized that determining the PM absorption coefficient is difficult. In his fundamental overview study on the subject [27], Horvath states that, in general, there are two different methods for the absorption coefficient measurement. The first one consists of the measurement of the effects caused by the light absorption. The other one is the measurement of the light transmission through the sample and compensation of the losses caused by dispersion. Nonetheless, the main problem in such experiments is posed by the quantitative (exact) consideration of the light losses due to its dispersion on the PM particles. Consequently, there is no referential technique for determining the aerosol particle absorption at present. On the other hand, a number of laboratory experiments and field investigations showed that the black carbon or EC percentage might be well assessed with measuring the coefficient of the light reflection by the filters through which a few cubic meters of air were passed [28]. Wolf et al. [29] demonstrated that the filter blackening level depended on the black carbon or EC mass on the filter.
In Europe, it was necessary to agree on a compromise between the assessment correctness and mathematical description of the light reaction with the aerosol particles and the quality of information obtained from the absorption coefficient measurement with the available methods. As a result, the International Organization for Standardization (ISO) 9835 standard [30] was introduced in 1993. The standard assumes that the coefficient of the light reflection by the filter with the weight of the aerosol particles may constitute an appropriate approximation of the absorption coefficient calculated according to the following Equation [30,31]:
a = A 2 V ln ( R 0 R f )
where a (m−1): Coefficient of the aerosol particle absorption, A (m2): Dusted filter surface, V (m3): Volume of the air collected by the aspirator during a singular measurement, R0 (%): Coefficient of the light reflection by the clean filter (blank sample), Rf (%): Coefficient of the light reflection by the dusted filter (filter with the collected aerosol particles).
The detailed description of the Equation (1) can be found in some papers (example [32]), where it is also explained that the coefficient on the left side of the Equation (1), which strictly speaking should be the extinction coefficient, may be assumed as the absorption coefficient with a good approximation. Such a situation is possible due to the characteristics of the reflection coefficient measurement with a reflectometer as the dispersive component is very small and can be ignored.
The filter diameter was d1 = 140 mm (diameter of a circle with PM). For optical research, a piece with the diameter d2 = 47 mm was cut out from the filter. Its entire surface A2 was covered with PM. Taking those facts into account; it can be written as follows:
a = A 2 0.1127 × 2 V 1 ln ( R 0 R a v )
where a (m−1): Coefficient of the aerosol particle absorption, A2 (m2): Filter surface cut out from the entire sample, used for optical research, V1 (m3): Volume of the air collected by the aspirator during a singular measurement, R0 (%): Coefficient of the light reflection by the clean filter (blank sample), Rav (%): Coefficient of the reflection of light by the dusted filter (filter with the collected aerosol particles).
This may be finally written as:
a = 769.74 V 1 ln ( R 0 R a v )
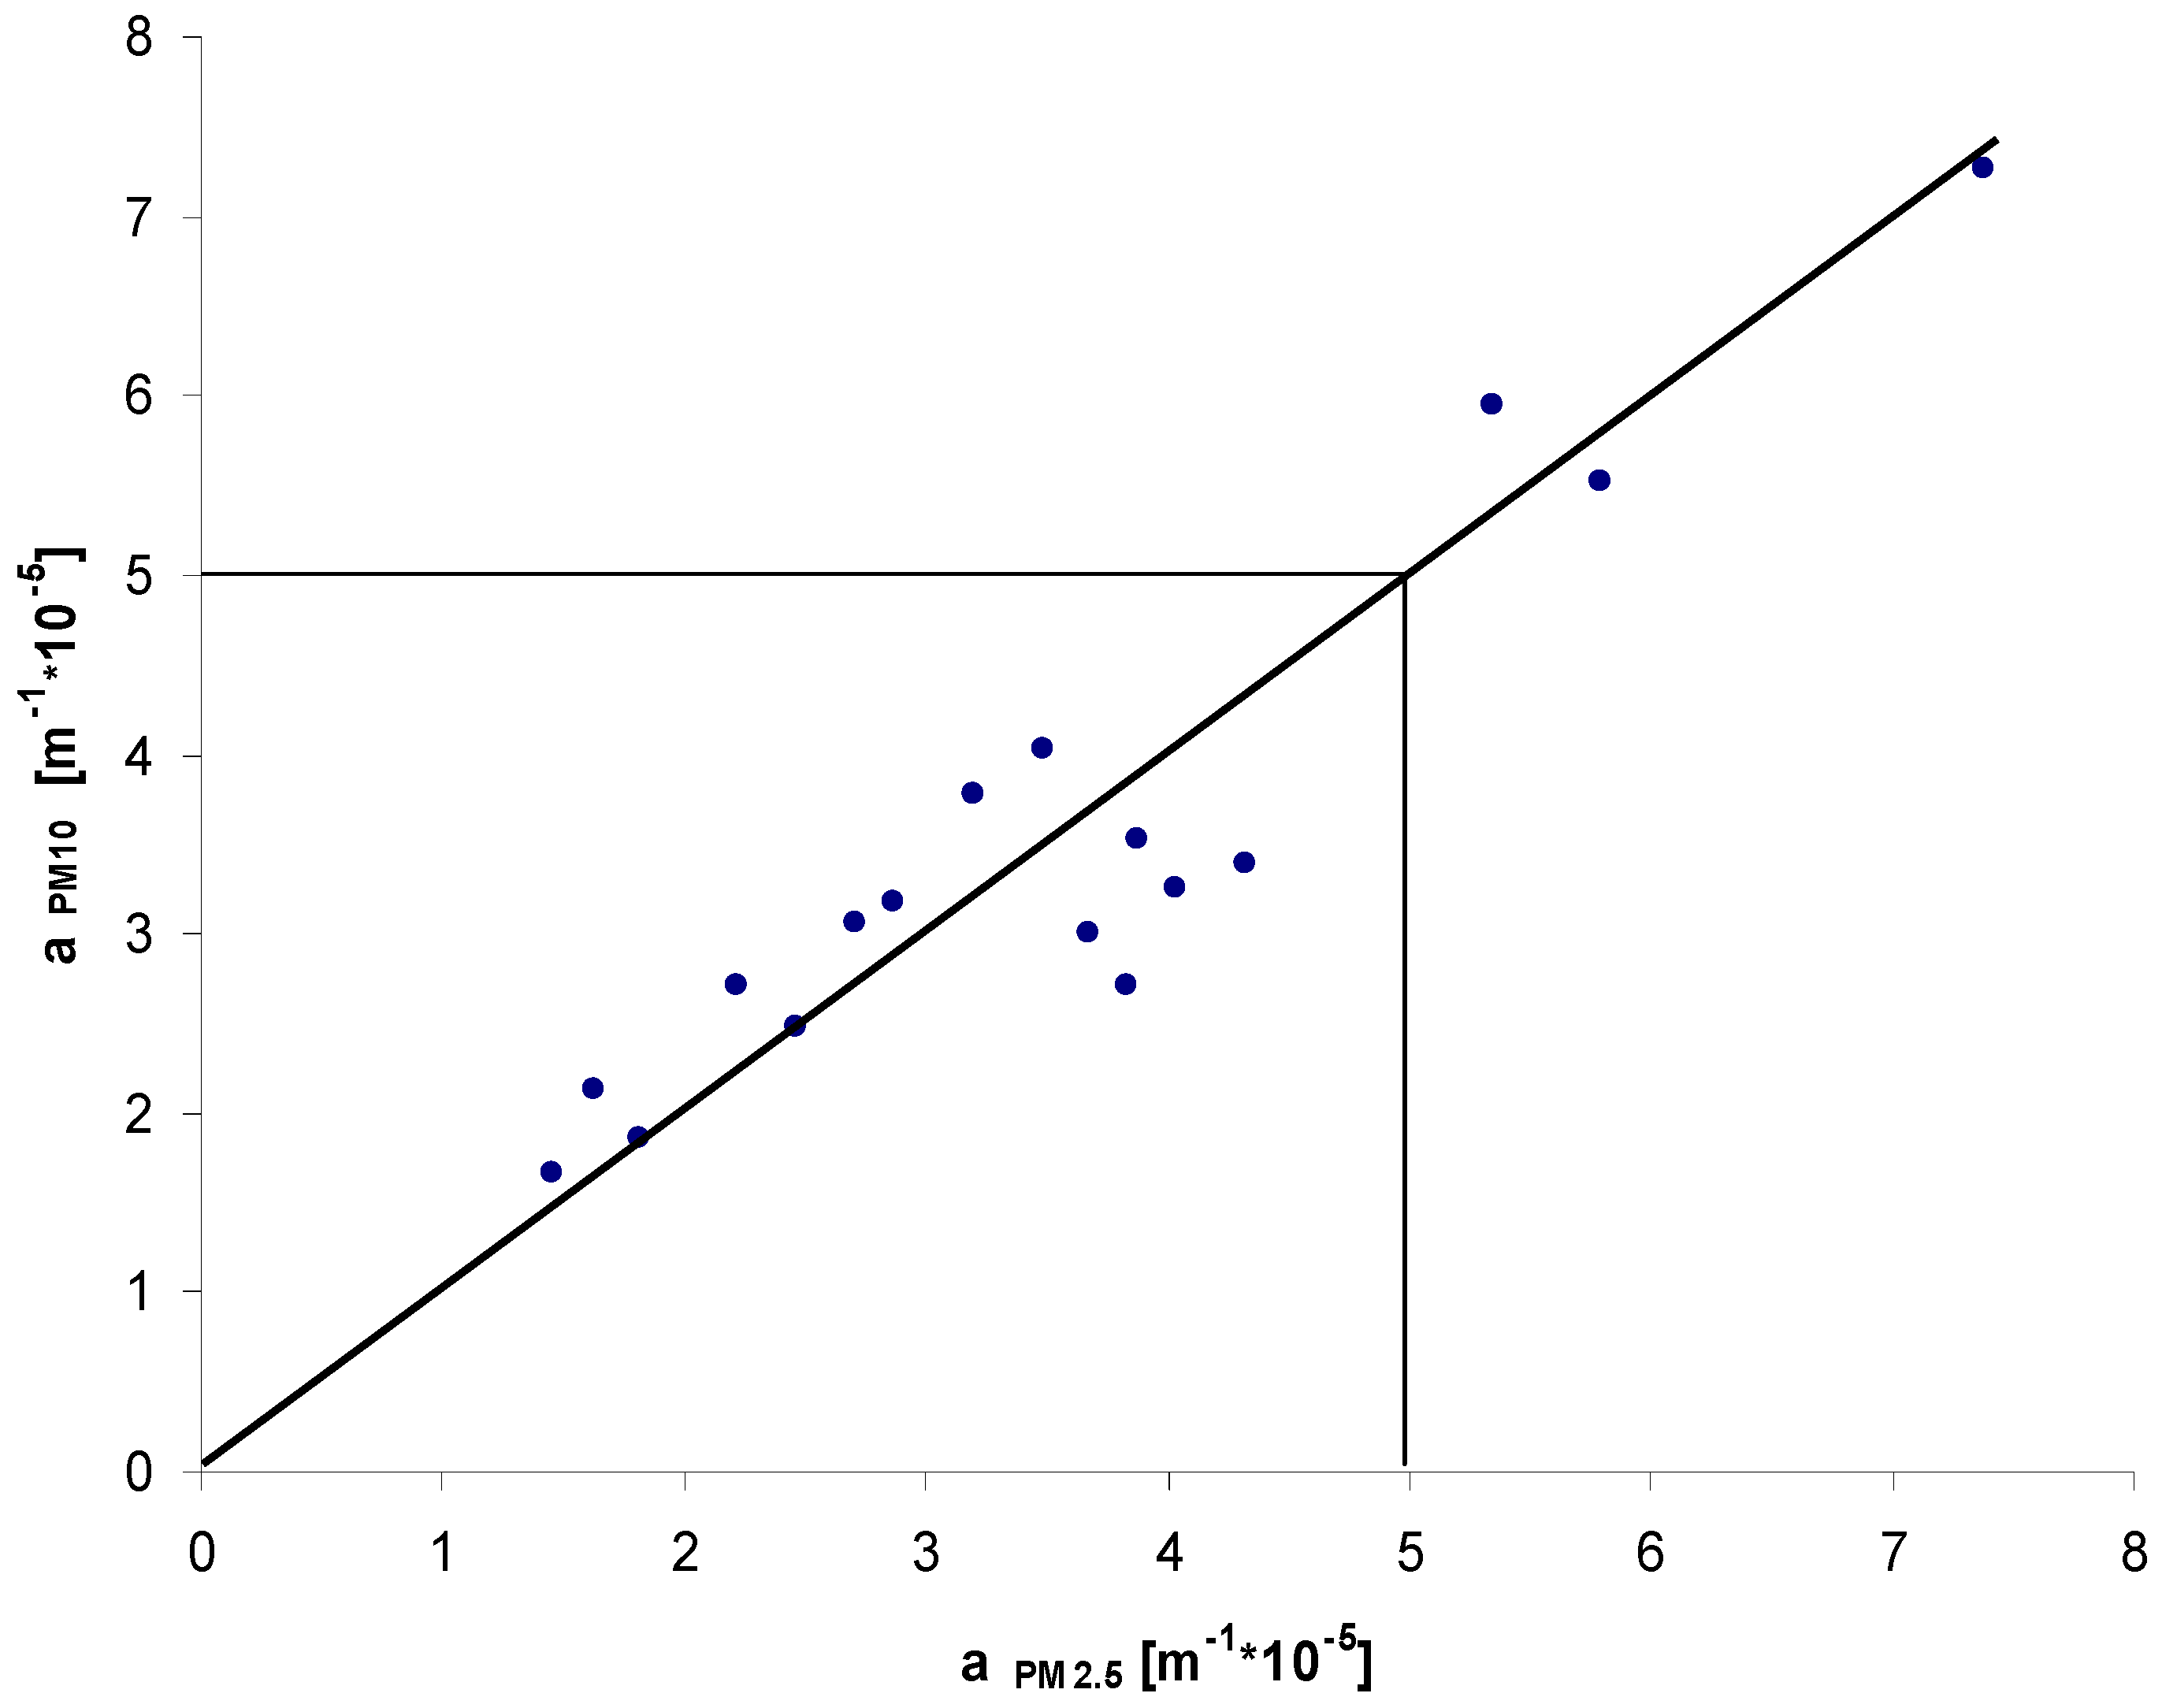
In this study, the authors decided to measure only the absorption coefficient (a) of fine particles (PM2.5 and PM1). The reason for that was that the pilot study carried out close to roads with intense traffic in Upper Silesia showed that the PM10 absorption was practically equal to the PM2.5 absorption (see Figure 3).
Figure 3. Absorption coefficient (a) of PM10 vs. absorption of PM2.5.
Atmosphere 06 01521 g003
Data obtained from the pilot study conducted close to busy roads in Upper Silesia.
The results from the previous study obtained in four towns in Southern Poland also demonstrated that the PM10 absorption was almost equal to the PM2.5 absorption [32].
The absorption coefficient value should be divided by the PM concentration value to obtain the latter parameter. In this way, the so-called mass absorption coefficient (also known as specific absorption coefficient; σ (m2/g)) was obtained.

3. Results and Discussion

The 24-h data on the absorption coefficient (a), mass absorption coefficient (σ), and the mean coefficient of the light reflection by the PM layer (Rav) are presented in Figure 4, Figure 5 and Figure 6. The mean and statistical results are collected in Table 1, Table 2 and Table 3.
The detailed analysis of the data obtained at three sampling sites shows that at RB (Złoty Potok), the mean values of the coefficient of the light reflection by the PM2.5 layer were 33.44% (entire measurement period), 25.2% (heating season), and 41.7% (non-heating season) (Table 1). The seasonal differences most probably resulted from the higher content of the carbon aerosol (including EC absorbing the light radiation) in the PM2.5 mass in the heating season [12,13]. The differences did not only result from the higher PM2.5 ambient concentration in winter than in summer (Figure 1 and Figure 2) as the 24-h PM2.5 concentrations and the light absorption coefficient (a) were rather weakly correlated in the heating season (Table 4).
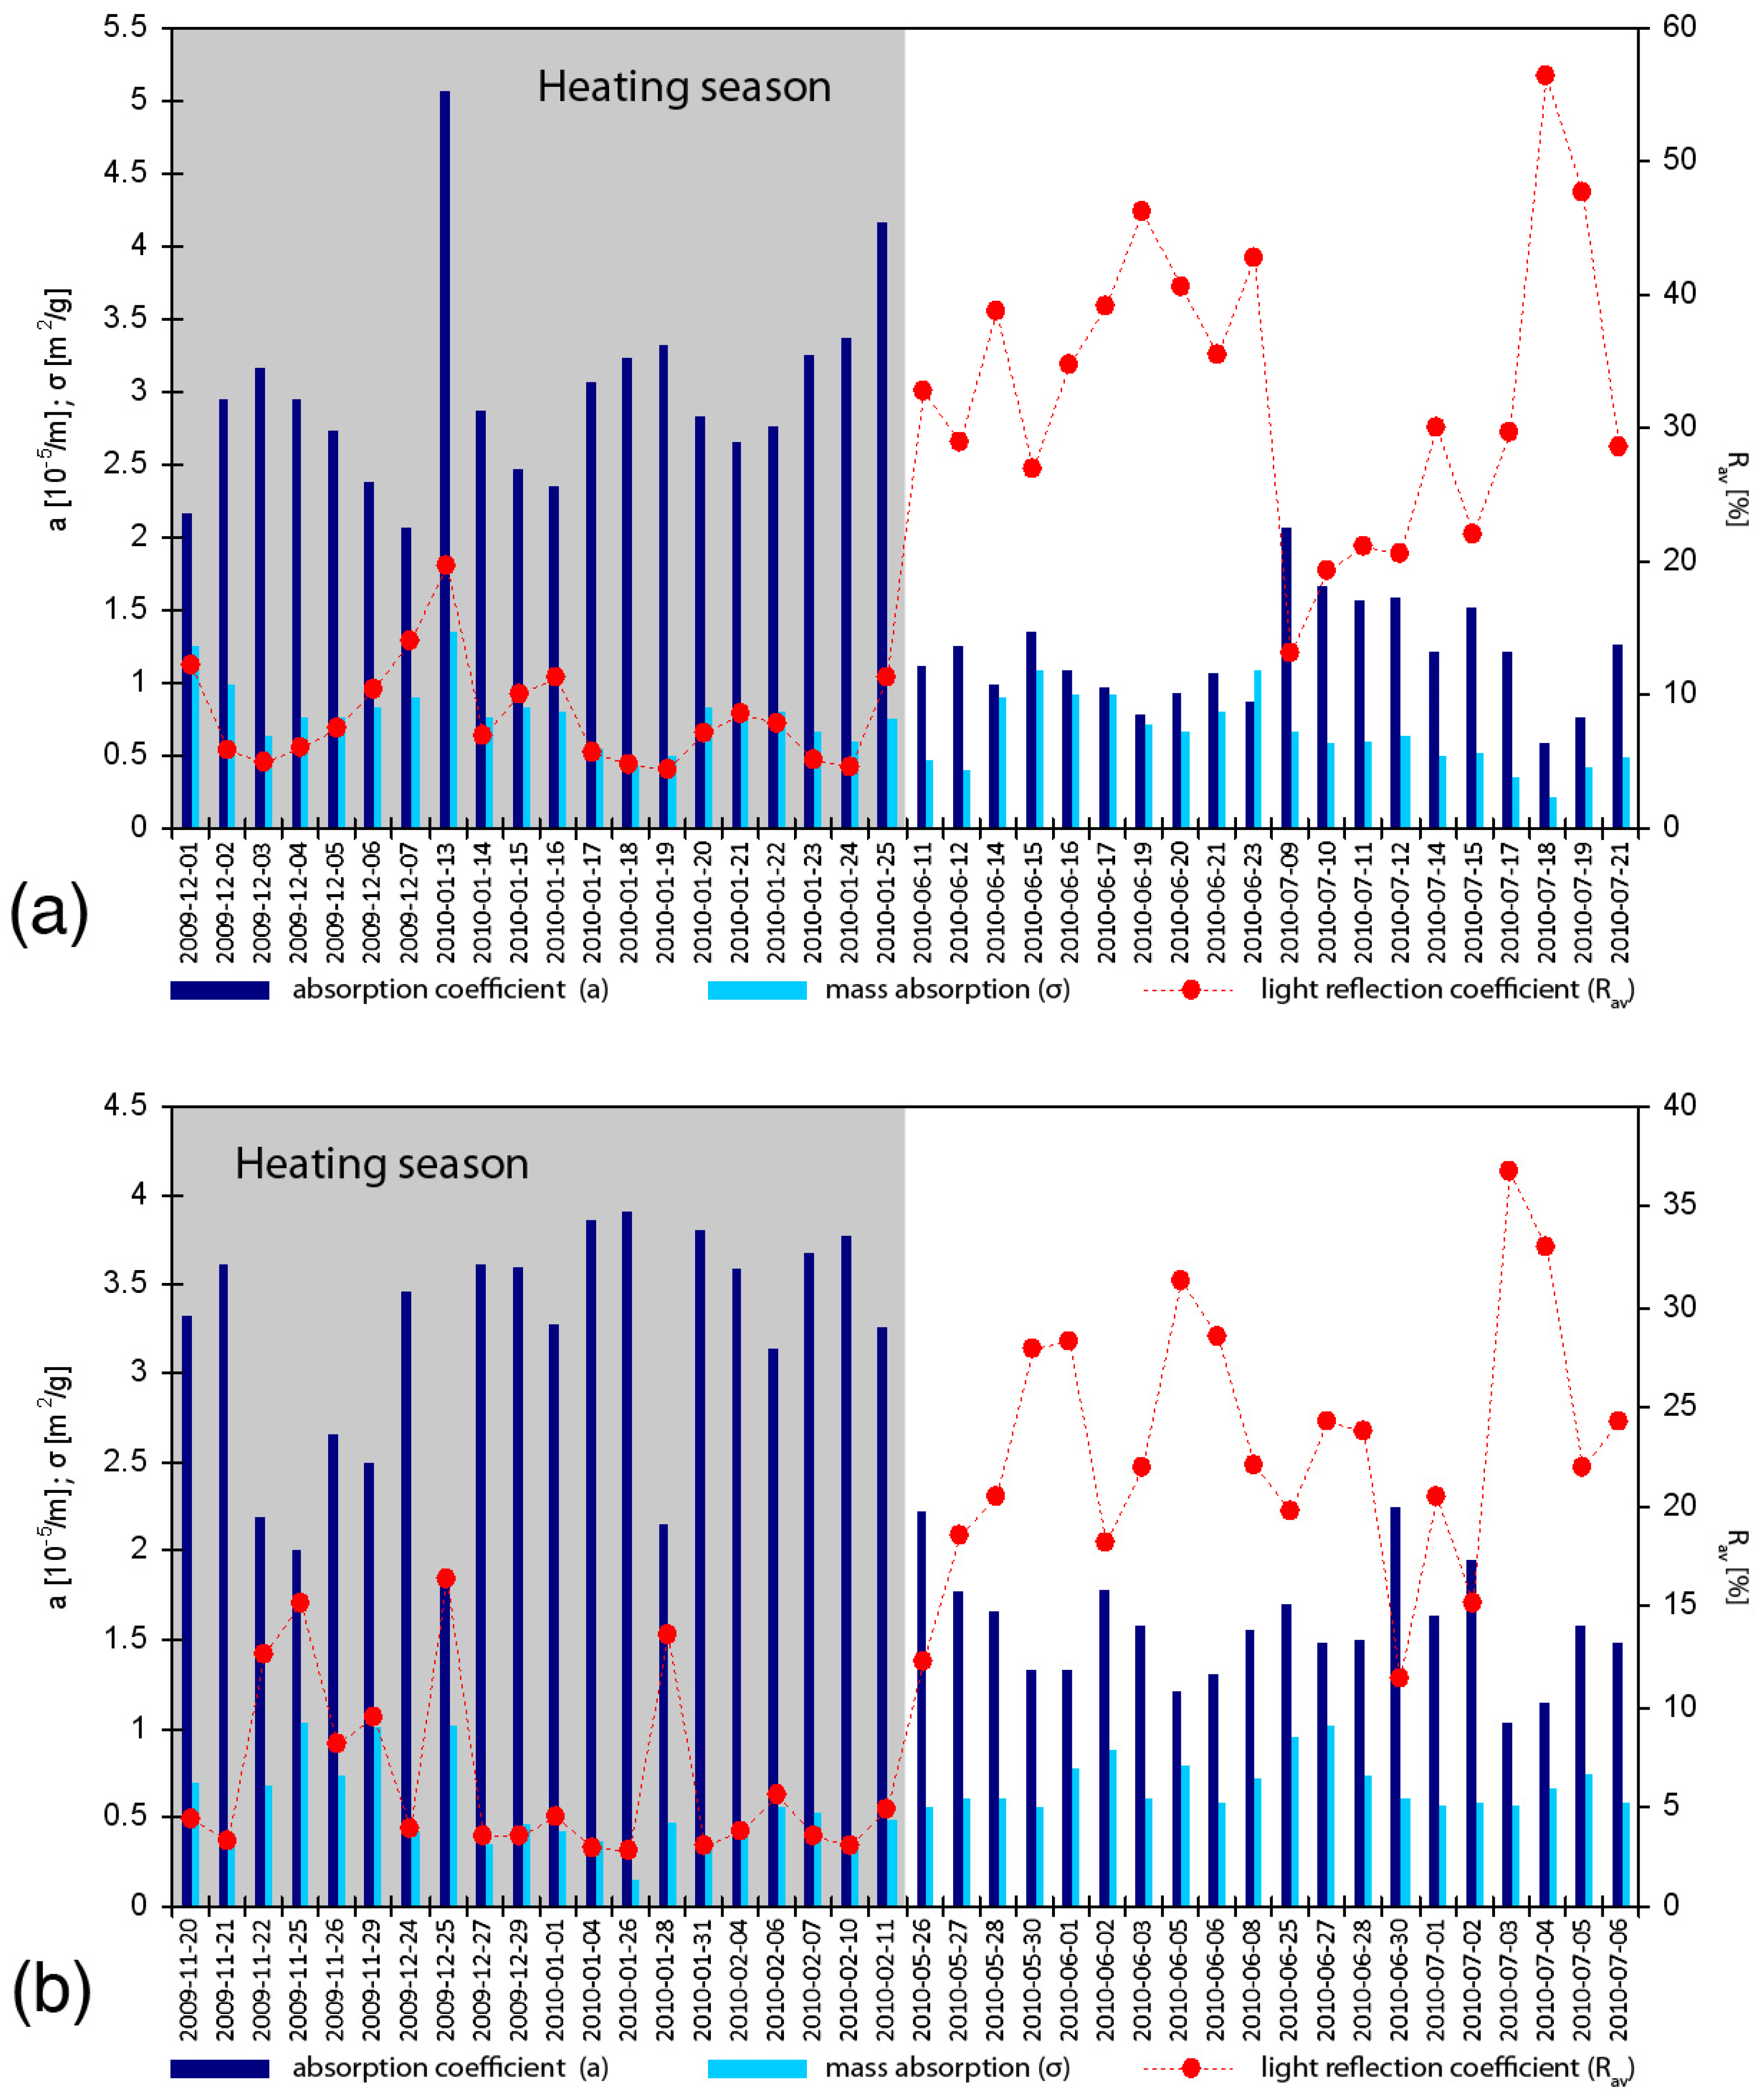
Figure 4. Optical parameters of PM1 (a) and PM2.5 (b) at RB (regional background site).
Atmosphere 06 01521 g004
Both light absorption coefficients (a and σ) demonstrated higher values in the heating season than in the non-heating one. The light absorption coefficient (a) was strongly but negatively correlated with Rav, particularly in the non-heating season (Table 4). An inverse course of the 24-h values for both light absorption coefficients (a and σ) and the light reflection coefficient (Rav) is clearly visible in Figure 4.
The Rav values for PM1 were higher than for PM2.5, both in the heating and non-heating seasons (39.3% and 53.0%, respectively). Over the whole measurement period, the mean Rav value for PM1 was 46.15%. It is evident that the PM1 concentrations in the air at RB were visibly lower than the PM2.5 concentrations (Figure 1 and Figure 2). The high value of the correlation coefficient observed between the absorption coefficient (a) and the PM1 concentrations shows that the values of these parameters were linearly dependent (Table 4). It is also possible that the content of EC (highly absorbing the light) in the PM1 mass was lower than in the PM2.5 mass. It was shown before that PM1–2.5 was much richer with EC than PM1 in Upper Silesia (Katowice, non-heating season) [31]. Moreover, PM2.5 contained more EC than PM1 in the non-urban area (Racibórz, quasi-rural site) in summer [14,33]. Consequently, the light absorption coefficient for PM2.5 was higher than for PM1 (contrary to Rav; Table 1).
Figure 5. Optical parameters of PM1 (a) and PM2.5 (b) at UB (urban background site).
Atmosphere 06 01521 g005
Figure 6. Optical parameters of PM1 (a) and PM2.5 (b) at UT (urban traffic site).
Atmosphere 06 01521 g006
The mass absorption coefficient (σ) at RB was higher for PM1 in the heating season than in the non-heating one, which could have been related to the higher content of the secondary inorganic (sulphates) and organic aerosols in PM1 in the non-heating season [14,33]. It seems that the phenomenon could explain the occurrence of the visibly higher values of the mass absorption coefficient (σ) for PM1 than for PM2.5. Perhaps, the EC-rich PM1-2.5 particles might be even richer with the light-dispersing sulphates or secondary organic compounds [12,33]. As a result, their ability to absorb light was much lower than the light absorption ability demonstrated by the submicron particles. Consequently, the PM2.5 fraction containing PM1–2.5 and PM1 had lower ability to absorb light (calculated per PM mass) than PM1.
Table 1. Descriptive statistics for the optical parameters of particulate matter (PM1) and PM2.5 at RB (regional background site).
Research Period (N = 40)Heating Season (N = 20)Non-Heating Season (N = 20)
ParameterMin/MaxArithmetic Mean ± St.dev.Min/MaxArithmetic Mean ± St.dev.Min/MaxArithmetic Mean ± St.dev
PM1 (µg/m3)3.49/71.4113.34 ± 10.803.49/71.4116.37 ± 14.424.82/16.0610.32 ± 3.51
Rav (%)26.00/66.3046.15 ± 11.3226.00/63.1039.26 ± 10.7340.10/66.3053.03 ± 6.94
a (10−5/m)0.44/2.200.87 ± 0.340.47/2.201.06 ± 0.380.44/0.970.67 ± 0.14
σ (m2/g)0.31/1.580.78 ± 0.330.21/1.580.87 ± 0.410.44/1.120.70 ± 0.20
PM2.5 (µg/m3)5.80/78.7425.48 ± 15.285.80/78.7431.12 ± 19.188.28/35.4419.83 ± 6.65
Rav (%)9.80/58.2033.44 ± 14.339.80/56.9025.20 ± 13.9727.20/58.2041.69 ± 9.13
a (10−5/m)0.57/2.491.27 ± 0.510.59/2.491.56 ± 0.550.57/1.400.97 ± 0.22
σ (m2/g)0.14/1.120.58 ± 0.200.14/1.120.62 ± 0.230.34/0.950.54 ± 0.14
Rav: Mean coefficient of the light reflection by the PM layer; a: Coefficient of the light absorption by the PM layer; σ: mass absorption coefficient (specific absorption coefficient).
At UB in Katowice, the mean value of the coefficient of the light reflection (Rav) by the PM1 layer collected onto the filter was 20.6% over the entire research period. It ranged between 4.4% and 56.3% (Table 2; Figure 5). In the heating season, the mean Rav value was 8.4%. In the non-heating season, the mean value was higher (32.7%; Table 2). For PM2.5, the mean Rav values were lower, i.e., 14.7%—over the whole measurement period; 6.4%—heating season; and 23.0%—non-heating season. When compared with RB, the values were lower by half on average. For PM1, the Rav value at UB was even four times lower than at RB in the heating season. It must have been related to the high (much higher than at RB) EC percentage in fine PM observed in the agglomeration area in the heating and non-heating seasons [12,13].
Table 2. Statistics for the optical parameters of PM1 and PM2.5 at UB (urban background site).
Research Period (N = 40)Heating Season (N = 20)Non-Heating Season (N = 20)
ParameterMin/MaxArithmetic Mean ± St.dev.Min/MaxArithmetic Mean ± St.dev.Min/MaxArithmetic Mean ± St.dev.
PM1 (µg/m3)7.99/73.5930.77 ± 15.6117.33/73.5940.70 ± 14.827.99/34.8620.83 ± 8.50
Rav (%)4.40/56.3020.56 ± 14.724.40/19.708.40 ± 3.8913.10/56.3032.73 ± 10.88
a (10−5/m)0.59/5.072.09 ± 1.062.06/5.072.99 ± 0.690.59/2.061.19 ± 0.36
σ (m2/g)0.22/1.340.72 ± 0.240.44/1.340.79 ± 0.220.22/1.090.65 ± 0.24
PM2.5 (µg/m3)14.56/255.0849.60 ± 44.9418.50/255.0875.39 ± 51.9114.56/40.1723.80 ± 7.04
Rav (%)2.80/36.7014.70 ± 10.092.80/16.406.40 ± 4.5211.40/36.7023.01 ± 6.58
a (10−5/m)1.04/3.922.37 ± 0.961.89/3.923.17 ± 0.671.04/2.251.58 ± 0.32
σ (m2/g)0.15/1.030.62 ± 0.210.15/1.030.55 ± 0.240.55/1.020.69 ± 0.14
Rav: Mean coefficient of the light reflection by the PM layer; a: Coefficient of the light absorption by the PM layer; σ: Mass absorption coefficient (specific absorption coefficient).
The changes in the 24-h optical parameter values are illustrated in Figure 5. It clearly shows the significant decrease in the Rav value with the increase in the (a) parameter value, both for PM1 and PM2.5 in the heating season. Nonetheless, the correlation between those values for PM1 at RB in the heating season was not linear (Table 4).
The values of the (a) and (σ) coefficients were much higher at UB than at RB. Both light absorption coefficients at UB were visibly higher in the heating season. At UB, the (a) coefficient value for PM2.5 was higher than for PM1 over the whole measurement period and in specific seasons. In the heating season, the (σ) value for PM1 was higher than for PM2.5. In the non-heating season, the (σ) value for PM1 was lower than for PM2.5. Such a situation could have been related to the higher content of the inorganic and organic secondary aerosols in PM1 at RB in the summer period [12,34,35].
Table 3. Statistics for the optical parameters of PM1 and PM2.5 at UT (urban traffic site).
Research Period (N = 40)Heating Season (N = 20)Non-Heating Season (N = 20)
ParameterMin/MaxArithmetic Mean ± St.dev.Min/MaxArithmetic Mean ± St.dev.Min/MaxArithmetic Mean ± St.dev.
PM1 (µg/m3)11.83/88.3429.98 ± 16.7620.50/88.3441.55 ± 16.5611.83/27.7218.40 ± 4.48
Rav (%)3.70/22.008.67 ± 4.783.70/22.007.18 ± 4.234.70/19.8010.17 ± 4.94
a (10−5/m)1.62/3.432.66 ± 0.521.62/3.432.87 ± 0.451.67/3.132.45 ± 0.50
σ (m2/g)0.39/1.641.05 ± 0.350.39/1.050.75 ± 0.161.09/1.641.35 ± 0.18
PM2.5 (µg/m3)11.80/120.4639.59 ± 24.2020.02/120.4651.22 ± 27.9111.80/51.7827.97 ± 11.78
Rav (%)3.10/28.607.79 ± 5.413.10/15.206.06 ± 2.963.40/28.609.52 ± 6.71
a (10−5/m)1.32/3.802.91 ± 0.571.99/3.803.07 ± 0.461.32/3.572.75 ± 0.64
σ (m2/g)0.31/2.070.91 ± 0.360.31/1.270.73 ± 0.290.67/2.071.09 ± 0.35
Rav: Mean coefficient of the light reflection by the PM layer; a: Coefficient of the light absorption by the PM layer; σ: mass absorption coefficient (specific absorption coefficient).
Table 4. Values of the linear correlation coefficient (R, p < 0.05) for the 24-h light absorption coefficient (a) values, light reflection coefficient Rav values, and 24-h PM concentrations.
aPM2.5Rav
Złoty Potok RB
heating season PM10.817−0.867
non-heating season PM10.749−0.984
heating season PM2.50.557−0.871
non-heating season PM2.50.735−0.991
Katowice UB
heating season PM10.5300.201
non-heating season PM10.555−0.977
heating season PM2.50.720−0.978
non-heating season PM2.50.813−0.983
Katowice UT
heating season PM10.745−0.962
non-heating season PM10.720−0.954
heating season PM2.50.811−0.983
non-heating season PM2.50.693−0.799
PM from UT demonstrated different optical parameters than PM from the remaining locations. The Rav value was relatively stable and low for PM1 and PM2.5 over the whole measurement period (Figure 6). The lowest Rav value was observed in the heating season (7.2% for PM1 and 6.1% for PM2.5). In the non-heating season, the mean Rav value was similar for both fractions (10.2% for PM1 and 9.5% for PM2.5; Table 3). When compared to RB and UB, the seasonal changes in the optical parameter values at UT were small, particularly for the light absorption coefficient (a). It was linked to the fact that large EC contents related to the traffic emission (highly capable of radiation absorption) were present in both measurement periods [36,37]. At UT, EC must have been mainly present in PM1. Consequently, this fraction demonstrated higher mass absorption coefficient (σ) than PM2.5. It was clearly seen in the non-heating season when there were no other active sources of EC in the air than the traffic emission. Taking all three locations into account, the 24-h Rav values were most visibly correlated with the light absorption coefficient (a) and PM2.5 concentrations at UT (Table 4).
It should be mentioned that the results obtained in this study (Table 1, Table 2 and Table 3) for PM2.5 were significantly lower than the absorption coefficient values determined for PM2.5 in urban areas of Southern Poland in 2001, which ranged from 3.29 × 10⁻⁵ m−1 to 4.37 × 10⁻⁵ m−1 [32]. The finding clearly indicates the decrease in the concentration of fine airborne particles of combustion origin in the area within the last decade, most probably an effect of the drop in the industrial and municipal fine PM emissions. On the other hand, in Katowice, the average absorption coefficient determined for PM2.5 was higher than at the majority of other urban background sites in Europe [38].
The increased absorption coefficient value for PM2.5 (when compared to the absorption of PM1 fraction) indicates a high EC concentration in the air (in ng/m3) for the particle size range of 1–2.5 µm, rather than the carbon content inside these particles (in µg/g). This conclusion is compliant with the measurement results of the mass size distribution of EC-containing airborne particles in Katowice in 1989, which showed heavy atmospheric pollution with EC particles, particularly for the range of 1.8–2.5 µm [39]. The finding was also confirmed by the research conducted in Katowice in summer 2012 [14]. On the other hand, the carbon content in the particle structure is related with the mass absorption (σ). Interestingly, the mass absorption (σ) values were higher for PM1 than for PM2.5 at all the studied sites, which suggests that submicrometer particles were more carbon-enriched than particles with the aerodynamic diameters of 1–2.5 µm.
Another important observation derived from Table 3 is that near the road the σ-level for PM2.5 and PM1 in summer was significantly higher than in winter (heating season). Similar results were obtained in the urban background sites but only for PM2.5 (Table 2). This certainly reflects the seasonal pattern for the EC content in these particles. Generally, the emission and the concentration level of EC in atmosphere is elevated in winter. On the other hand, heating in Poland is based on coal combustion resulting in emissions of sulphates, nitrates and other compounds, not only EC. The emission of these pollutants from municipal sources, mainly from blocks of small houses, is higher than emission of EC. Therefore, the relatively content of EC in airborne particles decreases in winter in the areas near such emission sources. This result is compliant with the previous studies conducted in Katowice [14,32].

4. Summary and Conclusions

The mean absorption in regional background (RB) was 1.20 × 10⁻⁵ m−5 and 0.87 × 10⁻⁵ m−1 for PM2.5 and PM1, respectively. In Katowice (UB), the mean absorption levels were 2.37 × 10⁻⁵ m−1 and 2.09 × 10⁻⁵ m−1 for PM2.5 and PM1, respectively. The highest absorption coefficient values (2.91 × 10⁻⁵ m−1 for PM2.5, and 2.66 × 10⁻⁵ m−1 for PM1) were determined near the A4 highway (UT).
The absorption coefficient for fine PM (PM2.5) and submicron PM (PM1) in the urban aerosol in Katowice increased significantly in the heating season (winter) in comparison to the non-heating season. What is more, the specific (mass) absorption coefficient (σ) for PM1 also increased. On the other hand, the value of σ for PM2.5 decreased in winter. The obtained result confirms the thesis that the EC percentage in the PM particles largely increases in the industrial area of Upper Silesia due to the increased hard coal combustion in winter. The sulphate percentage increases even more, which is reflected in the relative decrease in the EC content in PM mass and, consequently, in the mass absorption drop.
The values of both absorption coefficients (a and σ) had higher values in the non-heating season at the area under the direct traffic emission influence in Katowice than at the urban background receptor. The obtained data reveals the significant impact exerted by the fine carbon-rich aerosol particles from the highway car stream on the aerosol composition in the vicinity of the A4 highway.
In the heating season, the hard coal combustion influence seems to have been so dominating a process (generating the fine PM emission) that the absorption coefficient (a) values were similar at both receptors. The lower (σ) values for PM2.5 (but not for PM1) at UB in comparison with the areas neighboring with the traffic emission indicate that the PM particles in the range of 1–2.5 µm at the road were not as enriched with sulphates as in the developed areas. The reason for such a situation was the constant supply of the carbon-rich particle stream from the traffic emission.
There was a clear area diversification in the optical parameters of the PM deposited on the filter resulting both from its concentrations and the OC and EC contents. The highest values of the reflection coefficient were observed at RB, particularly in the non-heating season. The value in the traffic areas decreased by even five times. In the intensively developed urban areas, the reflection coefficient value was lower by half than in the rural areas.
Due to the high carbon content, the coefficient of the radiation absorption by the PM layer deposited on the filter demonstrated the highest values at the traffic station. In this area, its high value was maintained over the whole research period, which was related to the high EC content in PM1 and PM2.5.

Acknowledgments

The work was carried out within the project No. N N523421037 financed by the Polish Ministry of Science and Higher Education (MNiSW). Data analysis was supported by the Institute of Environmental Engineering of the Polish Academy of Sciences basic (statutory) research project.

Author Contributions

Conceived and designed the experiments: Krzysztof Klejnowski; PM sampling: Patrycja Rogula-Kopiec, Wioletta Rogula-Kozłowska; Determination of the optical parameters of PM: Jozef S. Pastuszka; Data analysis: Jozef S. Pastuszka, Wioletta Rogula-Kozłowska, Krzysztof Klejnowski, Patrycja Rogula-Kopiec; Manuscript writing: Jozef S. Pastuszka, Wioletta Rogula-Kozłowska.

Conflicts of Interest

The authors declare that there is no conflict of interests regarding the publication of this paper.

References

  1. Lim, S.; Lee, M.; Lee, G.; Kim, S.; Yoon, S.; Kang, K. Ionic and carbonaceous compositions of PM10, PM2.5 and PM1.0 at Gosan ABC Superstation and their ratios as source signature. Atmos. Chem. Phys. 2012, 12, 2007–2024. [Google Scholar] [CrossRef]
  2. Wang, Y.; Khalizov, A.; Levy, M.; Zhang, R. New directions: Light absorbing aerosols and their atmospheric impacts. Atmos. Environ. 2013, 81, 713–715. [Google Scholar] [CrossRef]
  3. Jacobson, M.C.; Hansson, H.-C.; Noone, K.J.; Charlson, R.J. Organic atmospheric aerosols: Review and state of science. Rev. Greophys. 2000, 38, 267–294. [Google Scholar] [CrossRef]
  4. Sztyler, A. Solar radiation and its attenuation in the central part of the Upper Silesia industrial region (in Polish). Prz. Geofiz. 1987, 3, 263–276. [Google Scholar]
  5. Highwood, E.J.; Kinnersley, R.P. When smoke gets in our eyes: The multiple impacts of atmospheric black carbon on climate, air quality and health. Environ. Int. 2006, 32, 560–566. [Google Scholar] [CrossRef] [PubMed]
  6. Houghton, J.T.; Ding, Y.; Griggs, D.J.; Noguer, M.; van der Linden, P.J.; Dai, X.; Maskell, K.; Johnson, C.A. Climate Change 2001: The Scientific Basis. Contribution of Working Group I to the Third Assessment Report of the IPCC; Cambridge University Press: Cambridge, UK, 2001. [Google Scholar]
  7. Quinn, P.K.; Stohl, A.; Arneth, A.; Berntsen, T.; Burkhart, J.F.; Christensen, J.; Flanner, M.; Kupiainen, K.; Lihavainen, H.; Shepherd, M.; et al. The Impact of Black Carbon on Arctic Climate; Arctic Monitoring and Assessment Programme: Oslo, Norway, 2011. [Google Scholar]
  8. Yang, S.; Xu, B.; Cao, J.; Zender, C.S.; Wang, M. Climate effects of black carbon aerosol in a Tibetan Plateau Glacier. Atmos. Environ. 2015, 111, 71–78. [Google Scholar] [CrossRef]
  9. Krishnan, R.; Ramanathan, V. Evidence of surface cooling from absorbing aerosols. J. Geophys. Res. 2002, 29, 1340–1340. [Google Scholar] [CrossRef]
  10. Abel, S.J.; Haywood, J.M.; Highwood, E.J.; Li, J.; Buseck, P.R. Evolution of biomass burning aerosol properties from an agricultural fire in Southern Africa. Geophys. Res. Lett. 2003, 30, 1783. [Google Scholar] [CrossRef]
  11. Adler, G.; Flores, J.M.; Riziq, A.; Borrmann, S.; Rudich, Y. Chemical, physical, and optical evolution of biomass burning aerosols: A case study. Atmos. Chem. Phys. 2012, 11, 1491–1503. [Google Scholar] [CrossRef]
  12. Rogula-Kozłowska, W.; Klejnowski, K.; Rogula-Kopiec, P.; Ośródka, L.; Krajny, E.; Błaszczak, B.; Mathews, B. Spatial and seasonal variability of the mass concentration and chemical composition of PM2.5 in Poland. Air Qual. Atmos. Heath 2014, 7, 41–58. [Google Scholar] [CrossRef] [PubMed]
  13. Rogula-Kozłowska, W.; Klejnowski, K.; Rogula-Kopiec, P.; Mathews, B.; Szopa, S. A study on the seasonal mass closure of ambient fine and coarse dusts in Zabrze, Poland. Bull. Environ. Contam. Toxico. 2012, 88, 722–729. [Google Scholar] [CrossRef] [PubMed]
  14. Rogula-Kozłowska, W. Size-segregated urban particulate matter: Chemical composition, primary and secondary matter content and mass closure. Air Qual. Atmos. Health 2015, 2015, 1873–9318. [Google Scholar] [CrossRef]
  15. Pastuszka, J.S. Studies on the relationship between visibility and mass size distribution of aerosol in Katowice. In Aerosols: Science, Industry, Health and Environment; Pergamon Press: Oxford, UK, 1990; pp. 290–293. [Google Scholar]
  16. Tsai, Y.I. Atmospheric visibility trends in urban area in Taiwan 1961–2003. Atmos. Environ. 2005, 39, 5555–5567. [Google Scholar] [CrossRef]
  17. Majewski, G.; Rogula-Kozłowska, W.; Czechowski, P.O.; Badyda, A.; Brandyk, A. The impact of selected parameters on visibility: First results from a long-term campaign in Poland. Atmosphere 2015, 6, 1154–1174. [Google Scholar] [CrossRef]
  18. Colbeck, I.; Atkinson, B.; Johar, Y. The morphology and optical properties of soot produced by different fuels. J. Aerosol Sci. 1997, 28, 715–723. [Google Scholar] [CrossRef]
  19. Naone, H.; Hasegawa, S.; Heintzenberg, J.; Okada, K.; Uchiyama, A.; Zaizen, Y.; Kobayashi, E.; Yamazaki, A. State of mixture of atmospheric submicrometer black carbon particles and its effect on particulate light absorption. Atmos. Environ. 2009, 43, 1296–1301. [Google Scholar] [CrossRef]
  20. Shen, G.; Xue, M.; Yuan, S.; Zhang, J.; Zhang, Q.; Li, B.; Wu, H.; Ding, A. Chemical composition and reconstructed light extinction coefficients of particulate matter in a mega-city in the western Yangtze River Delta, China. Atmos. Environ. 2014, 83, 14–20. [Google Scholar] [CrossRef]
  21. Tao, J.; Zhang, L.; Gao, J.; Wang, H.; Chai, F.; Wang, S. Aerosol chemical composition and light scattering during a winter season in Beijing. Atmos. Environ. 2015, 110, 36–44. [Google Scholar] [CrossRef]
  22. Pastuszka, J.S. Study of PM10 and PM2.5 concentrations in Southern Poland. J. Aerosol Sci. 1997, 28, 227–228. [Google Scholar] [CrossRef]
  23. Rogula-Kozłowska, W.; Kozielska, B.; Błaszczak, B.; Klejnowski, K. The Mass Distribution of Particle Bound PAH among Aerosol Fractions: A Case-Study of An Urban Area in Poland; InTech Open Access Publisher: Rijeka, Croatia, 2012. [Google Scholar]
  24. Rogula-Kozłowska, W.; Majewski, G.; Czechowski, P.O. The size distribution and origin of elements bound to ambient particles: A case study of a Polish urban area. Environ. Monit. Assess. 2015, 187, 240. [Google Scholar] [CrossRef] [PubMed]
  25. Rogula-Kozłowska, W. Traffic-generated changes in the chemical characteristics of size-segregated urban aerosols. Bull. Environ. Contam. Toxico. 2014, 93, 493–502. [Google Scholar] [CrossRef] [PubMed]
  26. Directive 2008/50/EC of the European Parliament and of the Council of 21 May 2008 on Ambient Air Quality and Cleaner Air for Europe; 2005/0183/COD; Council of the European Union: Brussels, Belgium, 2008.
  27. Horvath, H. Atmospheric light absorption: A review. Atmos. Environ. 1993, 27, 293–317. [Google Scholar] [CrossRef]
  28. Hogan, A.; Ahmed, N.; Black, J.; Barnard, S. Some physical properties of a black aerosol. J. Aerosol Sci. 1985, 5, 391–397. [Google Scholar] [CrossRef]
  29. Wolff, G.T.; Groblicki, P.J.; Cadle, S.H.; Countness, R.J. Particulate carbon at various locations in the United States. In Particulate Carbon: Atmospheric Life Cycle; Plenum Press: London, UK, 1982. [Google Scholar]
  30. Ambient Air-Determination of A Black Smoke Index; ISO 9835; International Organization for Standardization: Geneva, Switzerland, 1993.
  31. Eeftens, M.; Phuleria, H.C.; Meier, R.; Aguilera, I.; Corradi, E.; Davey, M.; Ducret-Stich, R.; Fierz, M.; Gehring, R.; Ineichen, A.; et al. Spatial and temporal variability of ultrafine particles, NO2, PM2.5, PM2.5 absorbance, PM10 and PMcoarse in Swiss study areas. Atmos. Environ. 2015, 111, 60–70. [Google Scholar] [CrossRef]
  32. Pastuszka, J.S.; Wawroś, A.; Talik, E.; Paw, U.K.T. Optical and chemical characteristics of the atmospheric aerosol in four towns in southern Poland. Sci. Total Environ. 2003, 309, 237–251. [Google Scholar] [CrossRef]
  33. Rogula-Kozłowska, W. Chemical composition and mass closure of ambient particulate matter at a crossroads and a highway in Katowice, Poland. Environ. Prot. Eng. 2015, 41, 15–29. [Google Scholar]
  34. Deshmukh, D.K.; Deb, M.K.; Tsai, Y.I.; Mkoma, S.L. Atmospheric ionic species in PM2.5 and PM1 aerosols in the ambient air of eastern central India. J. Atmos. Chem. 2010, 66, 81–100. [Google Scholar] [CrossRef]
  35. Đordević, D.; Mihajlidi-Zelić, A.; Relić, D.; Ignjatović, L.; Huremović, J.; Stortini, A.M.; Gambaro, A. Size-segregated mass concentration and water soluble inorganic ions in an urban aerosol of the Central Balkans (Belgrade). Atmos. Environ. 2012, 46, 309–317. [Google Scholar] [CrossRef]
  36. Querol, X.; Alastuey, A.; Viana, M.; Moreno, T.; Reche, C.; Minguillón, M.C.; Ripoll, A.; Pandolfi, M.; Amato, F.; Karanasiou, A.; et al. Variability of carbonaceous aerosols in remote, rural, urban and industrial environments in Spain: Implications for air quality policy. Atmos. Chem. Phys. 2013, 13, 6185–6206. [Google Scholar] [CrossRef]
  37. Rogula-Kozłowska, W.; Pastuszka, J.S.; Talik, E. Influence of vehicular traffic on concentration and particle surface composition of PM10 and PM2.5 in Zabrze, Poland. Pol. J. Environ. Stud. 2008, 4, 539–548. [Google Scholar]
  38. Eeftens, M.; Tsai, M.-Y.; Ampe, C.; Anwander, B.; Beelen, R.; Bellander, T.; Cesaroni, G.; Cirach, M.; Cyrys, J.; de Hoogh, K.; et al. Spatial variation of PM2.5, PM10, PM2.5 absorbance and PM coarse concentrations between and within 20 European study areas and the relationship with NO2: Results of the ESCAPE project. Atmos. Environ. 2012, 62, 303–317. [Google Scholar]
  39. Pastuszka, J.S.; Kolarczyk, J.; Sztyler, A. Preliminary studies of elemental carbon mass size distribution in Katowice. J. Aerosol Sci. 1989, 20, 1265–1268. [Google Scholar] [CrossRef]