
Ultrafine Particles in Residential Indoors and Doses Deposited in the Human Respiratory System


Abstract
:1. Introduction
2. Results and Discussion
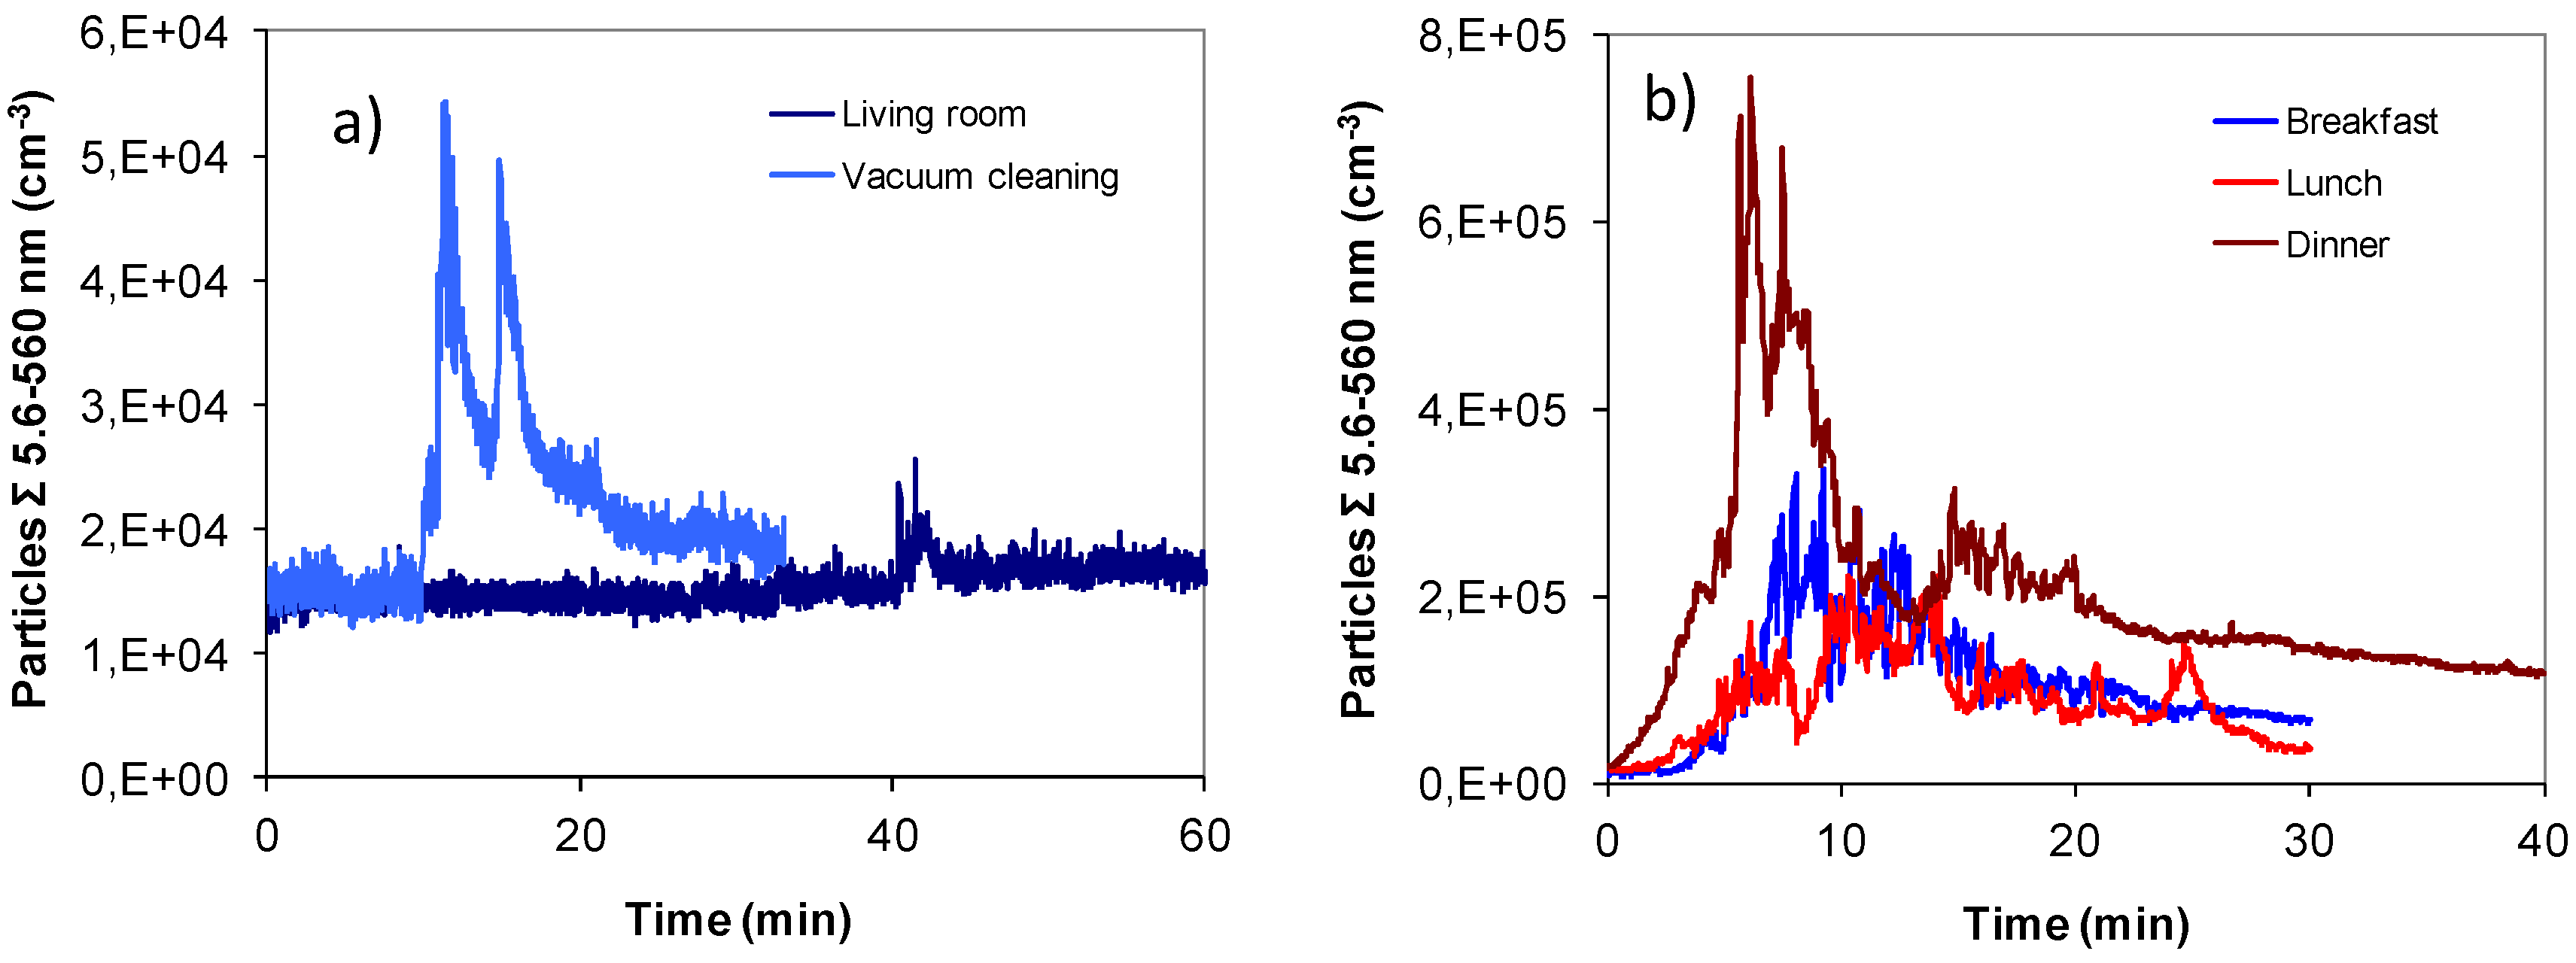
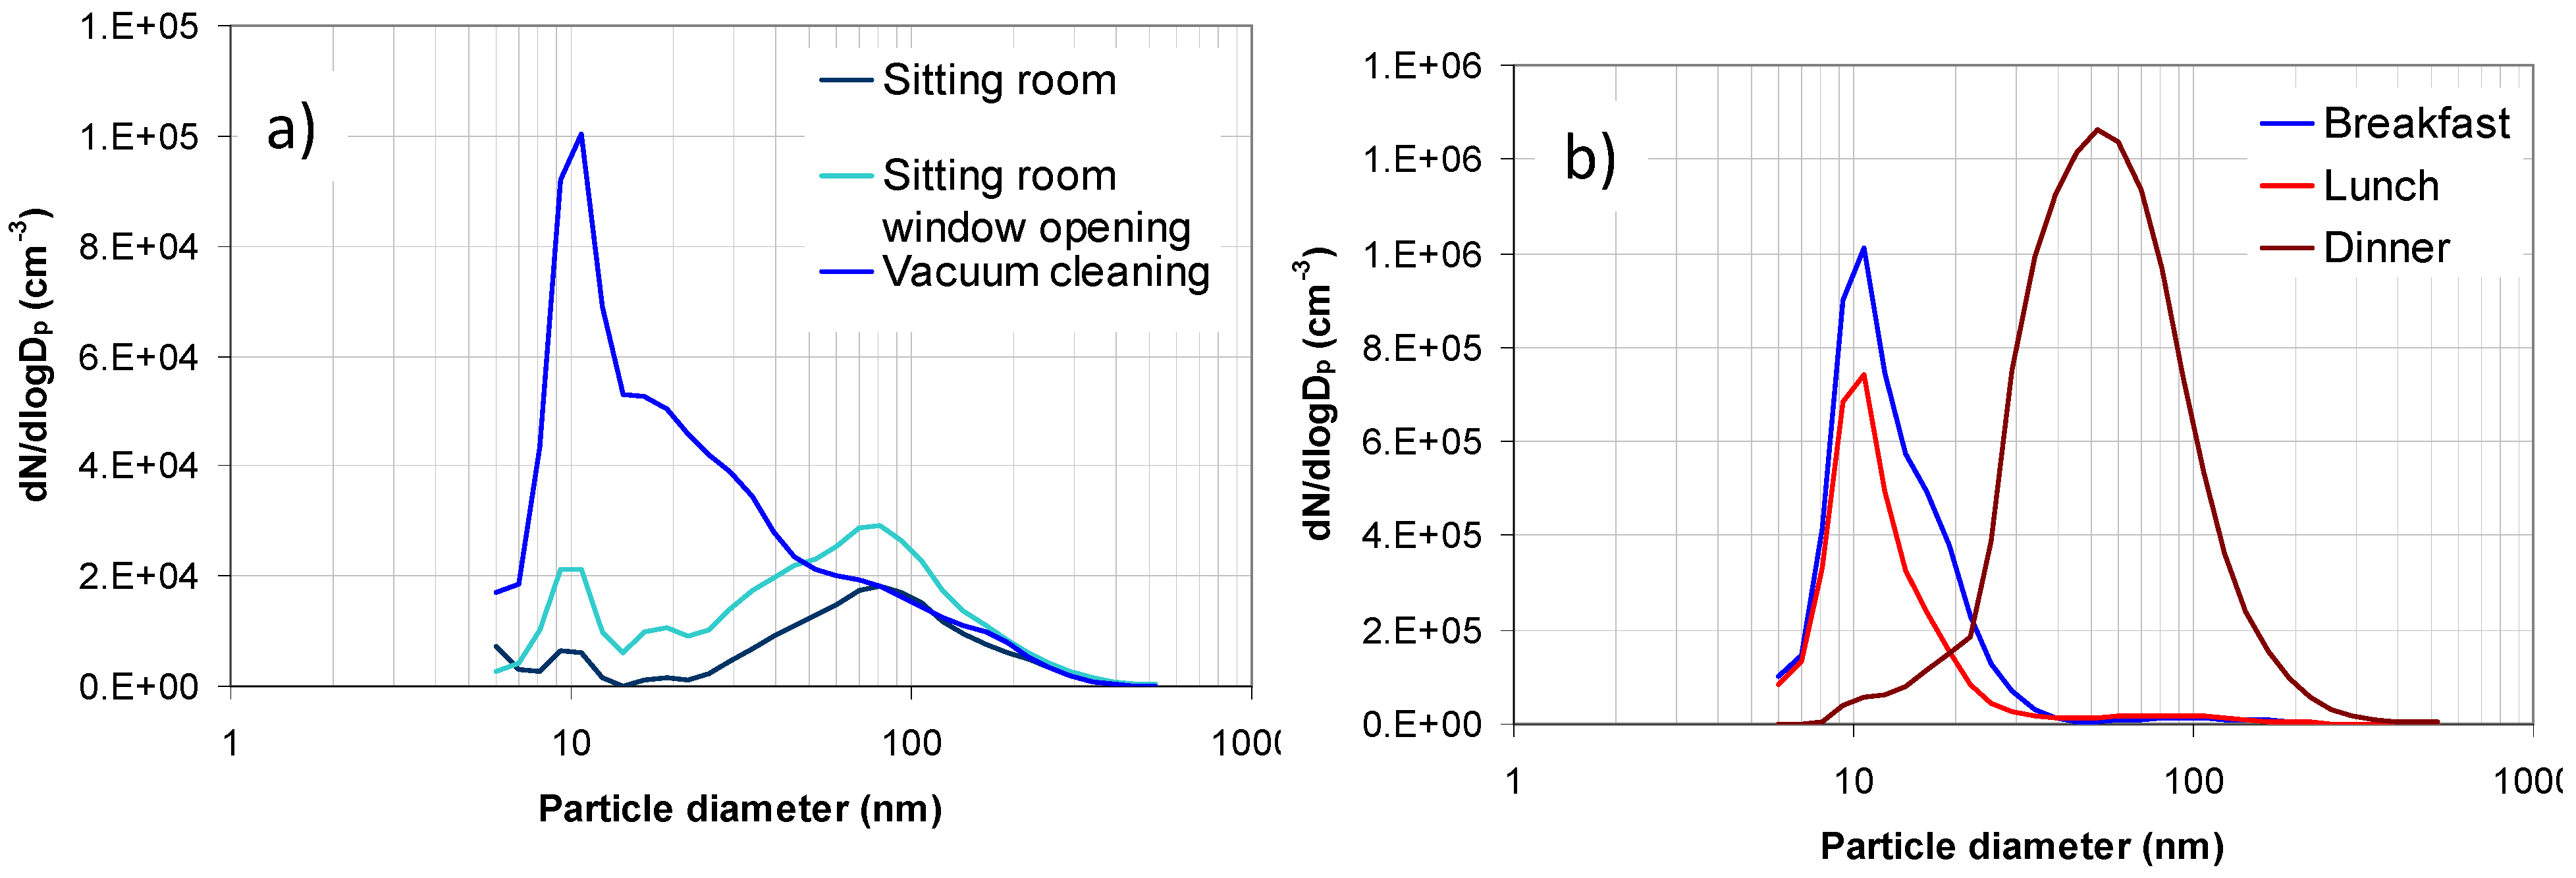
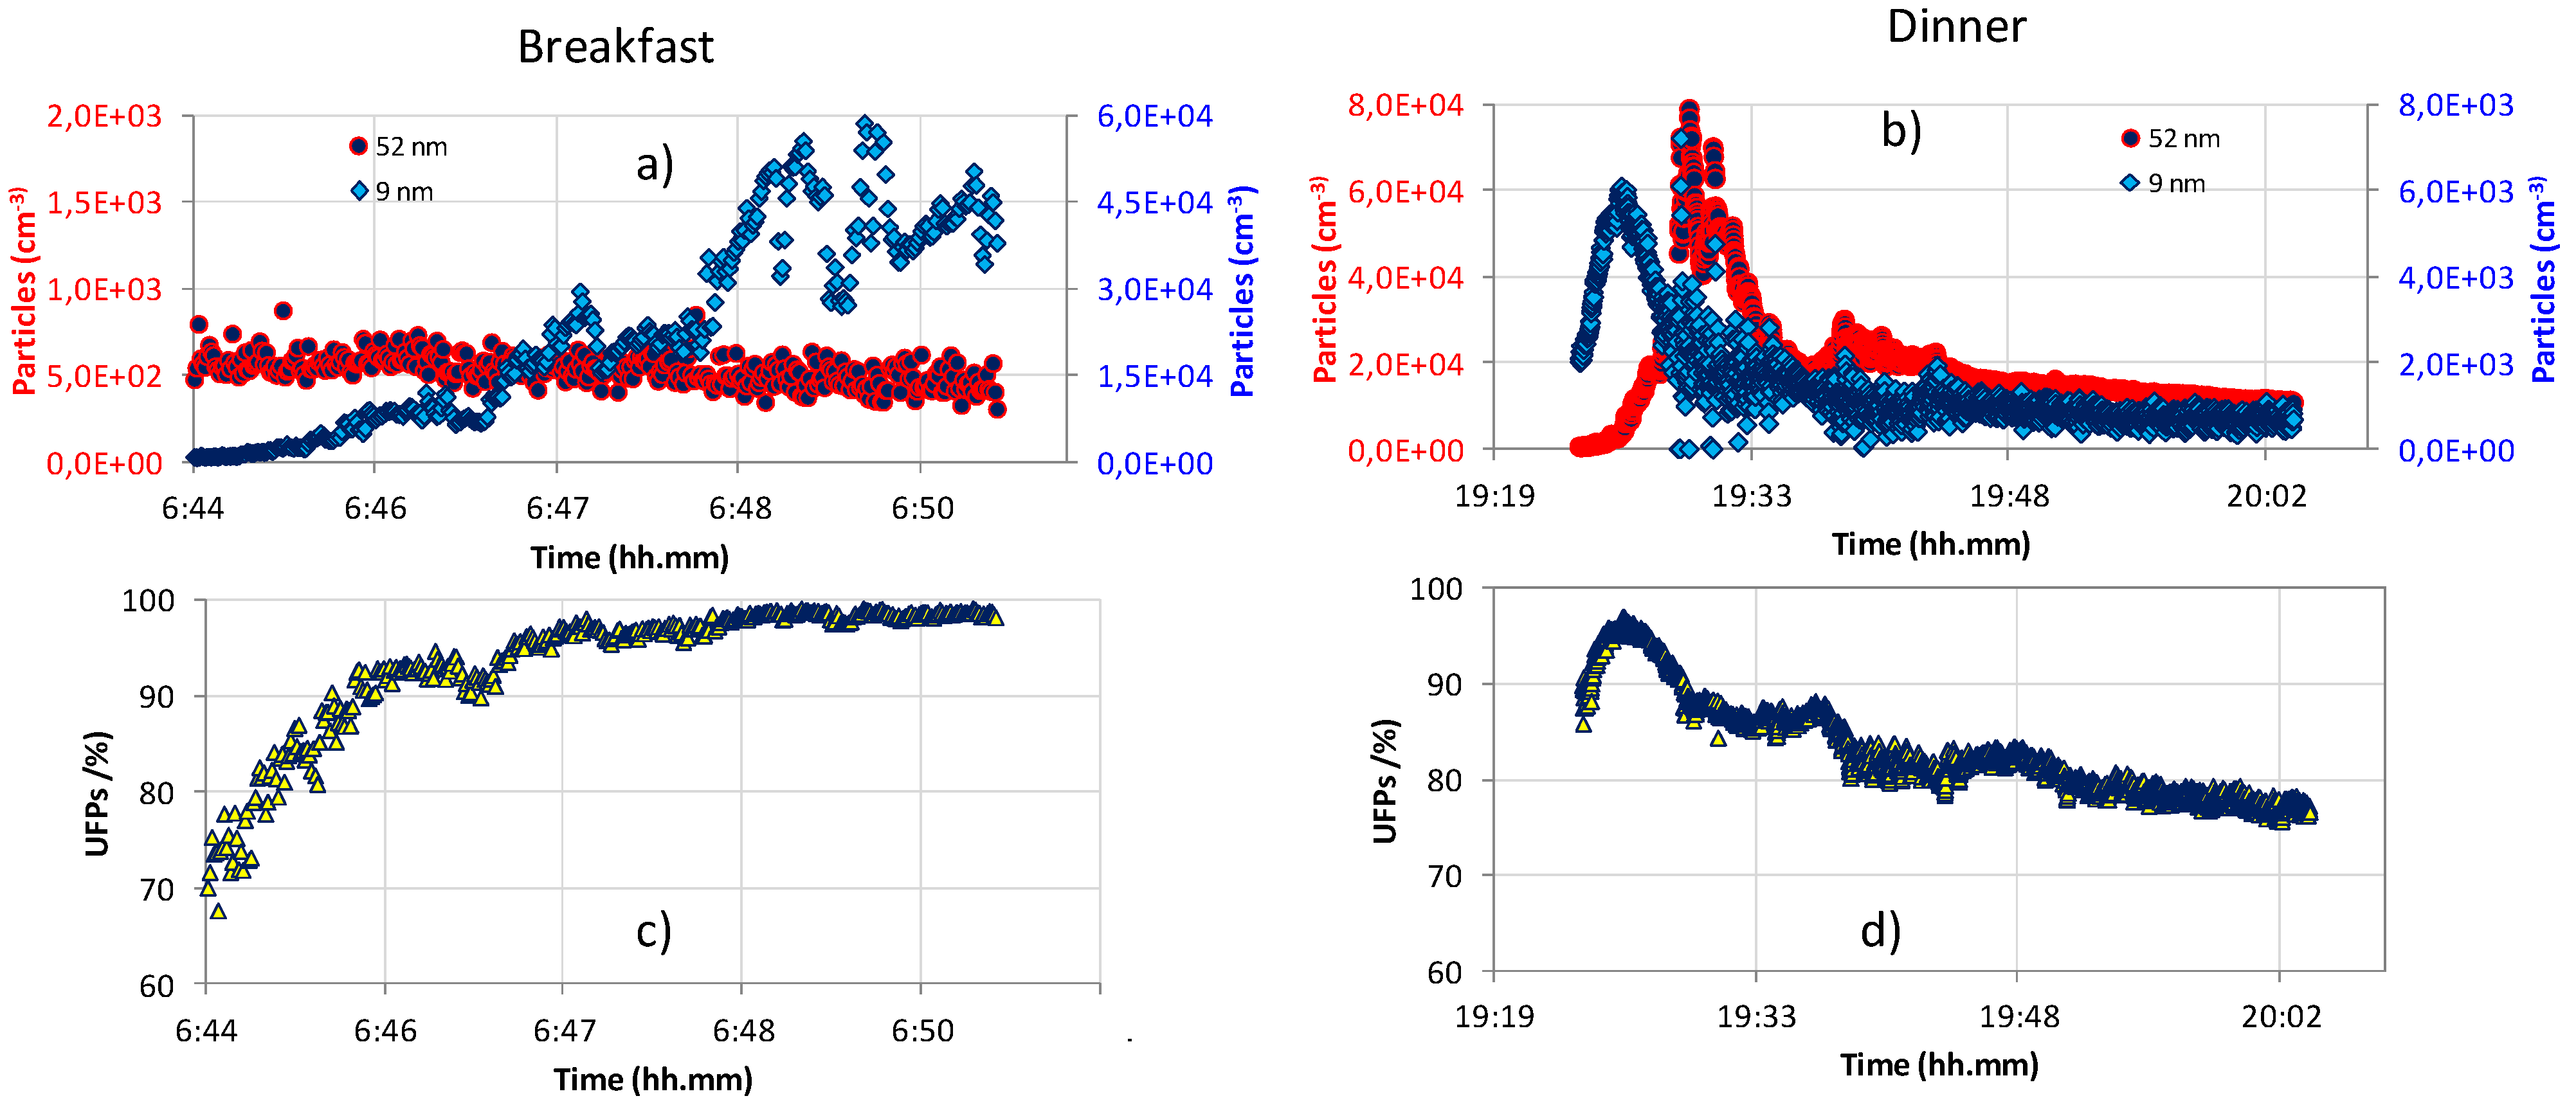
2.1. Aerosol Size Distributions


2.2. Dosimetry Estimates

| Dc(tR) (particles) | Dc(tR)/tR (particles × min−1) | DT(tMax) (particles) | D(dMax,tMax,GMax) (particles) | GMax | dMax (nm) | |
|---|---|---|---|---|---|---|
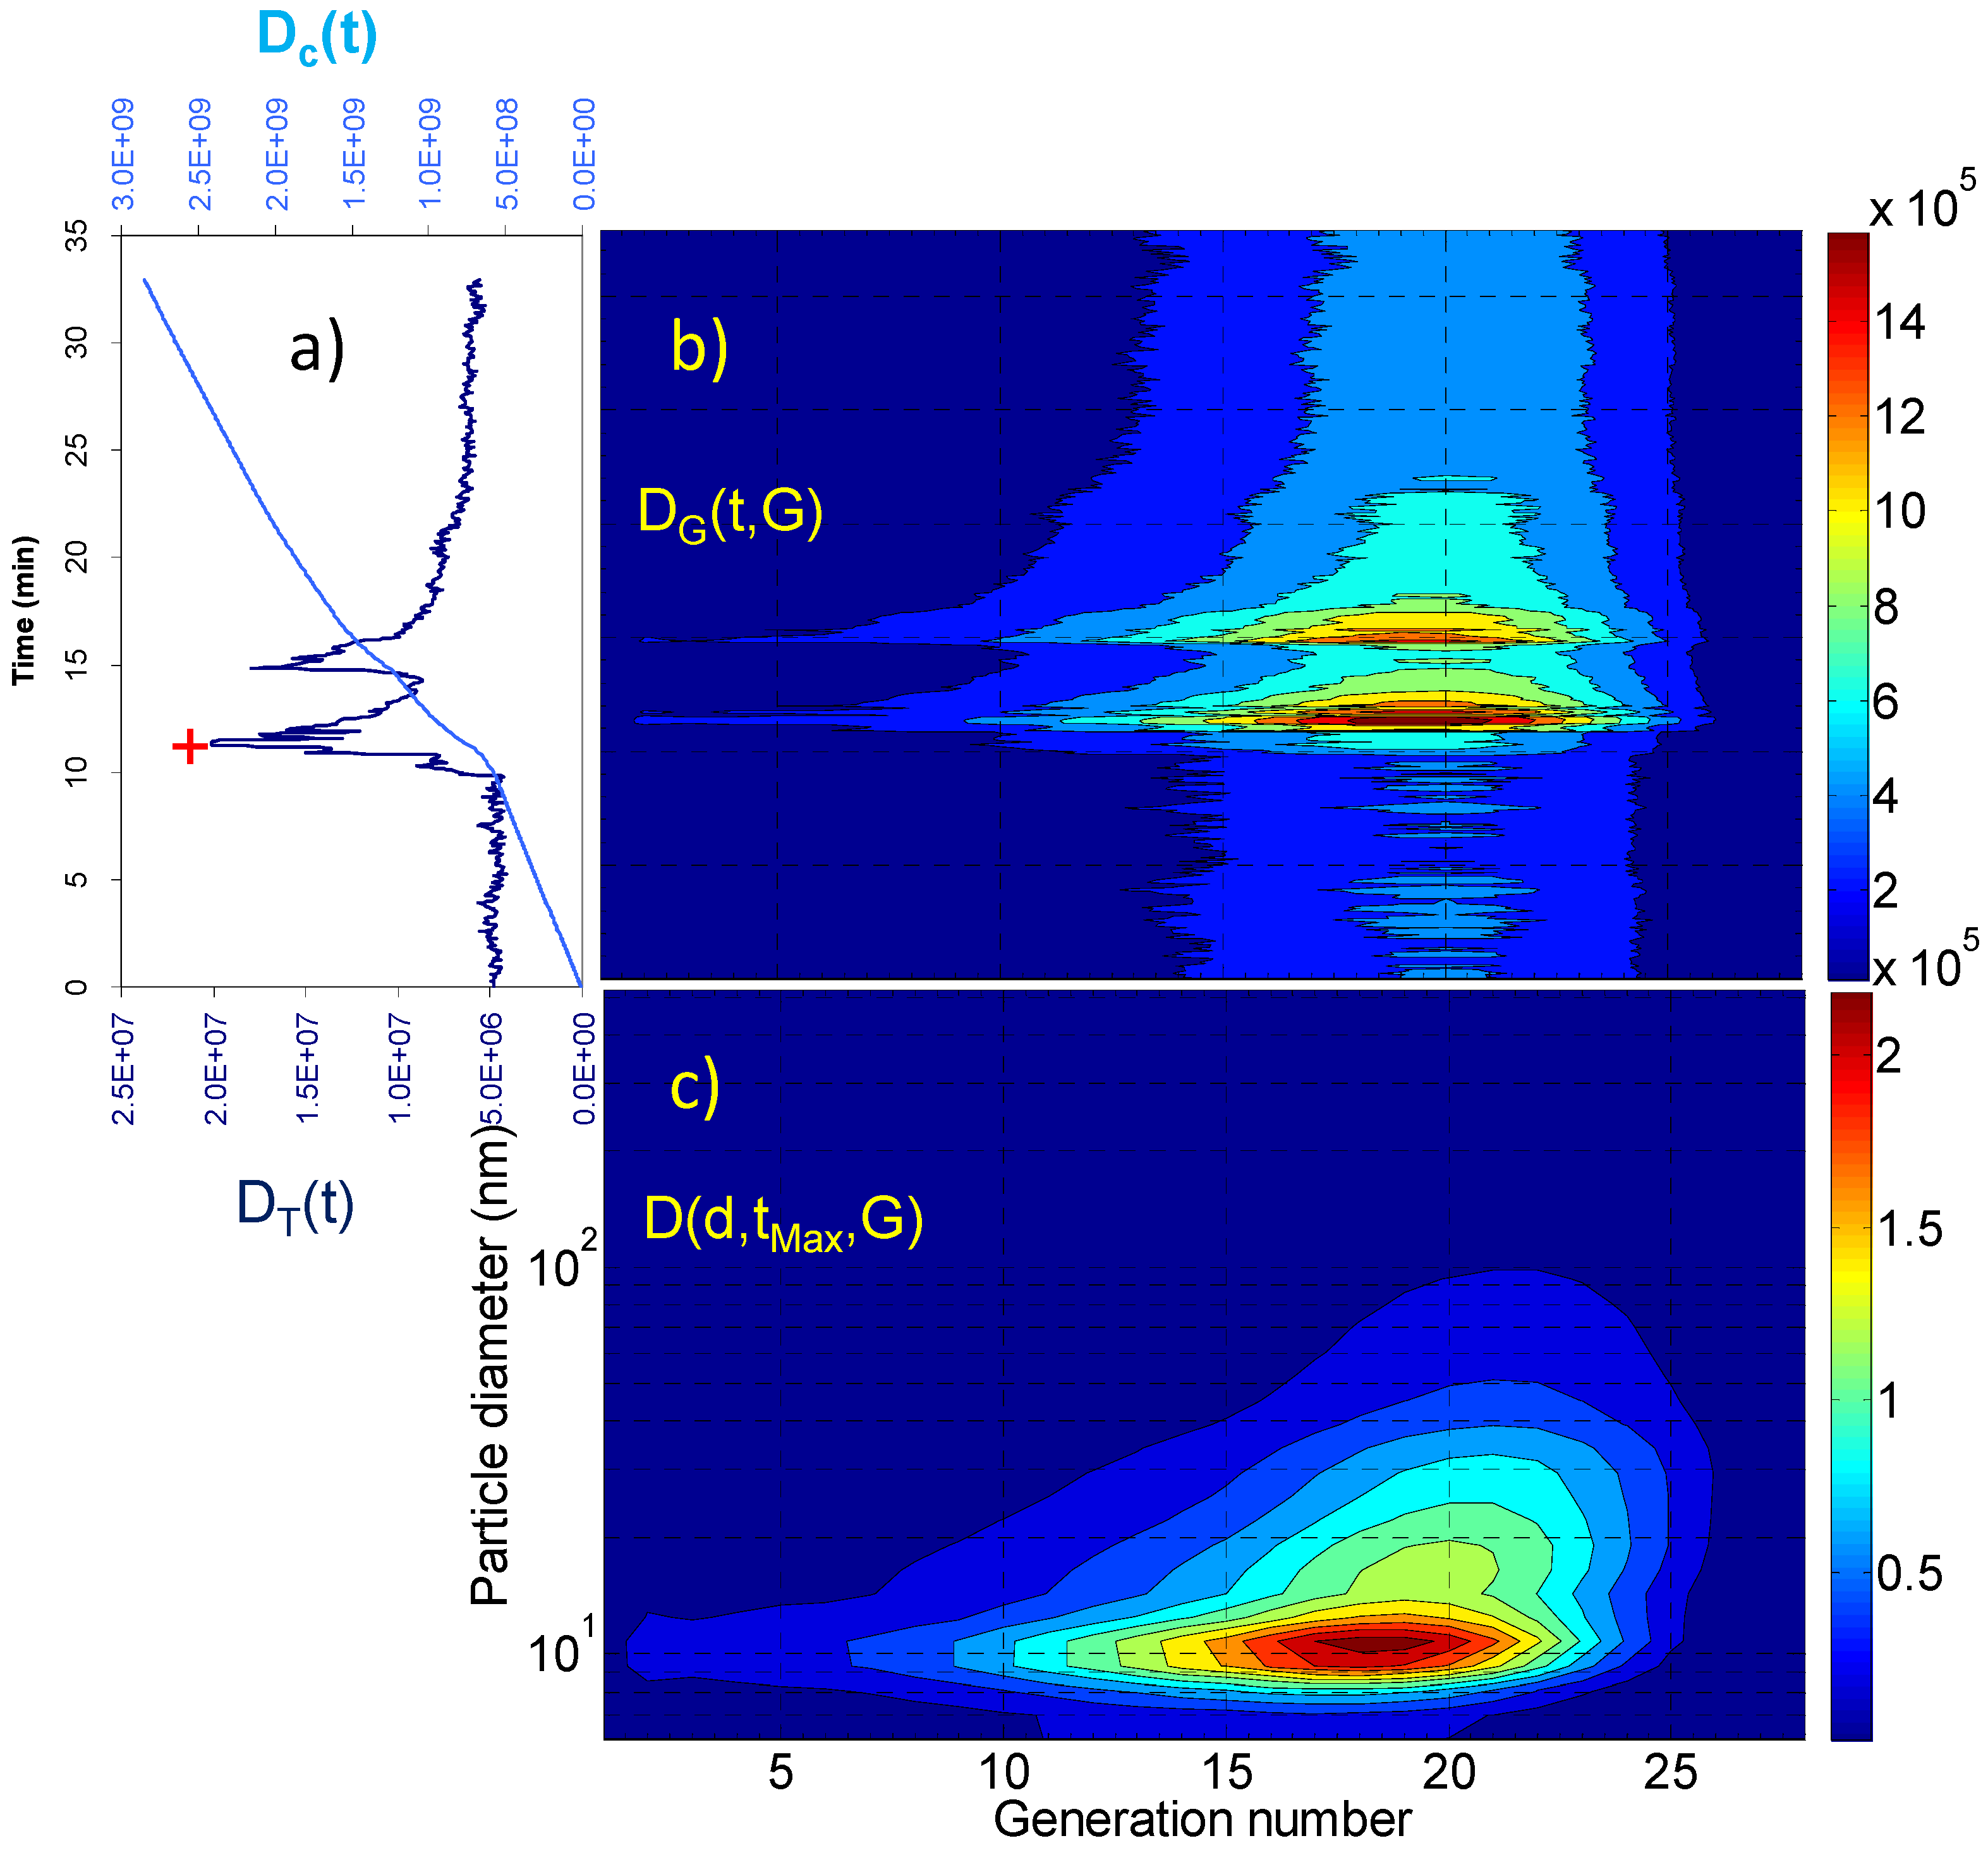
| Living room | 3.09 × 10⁹ | 5.15 × 10⁷ | 7.12 × 10⁶ | 4.83 × 10⁴ 4.73 × 10⁴ | 18 21 | 10.8 69.8 |
| Vacuuming | 2.85 × 10⁹ | 8.64 × 10⁷ | 2.01 × 10⁷ | 2.33 × 10⁵ | 18 | 10.8 |
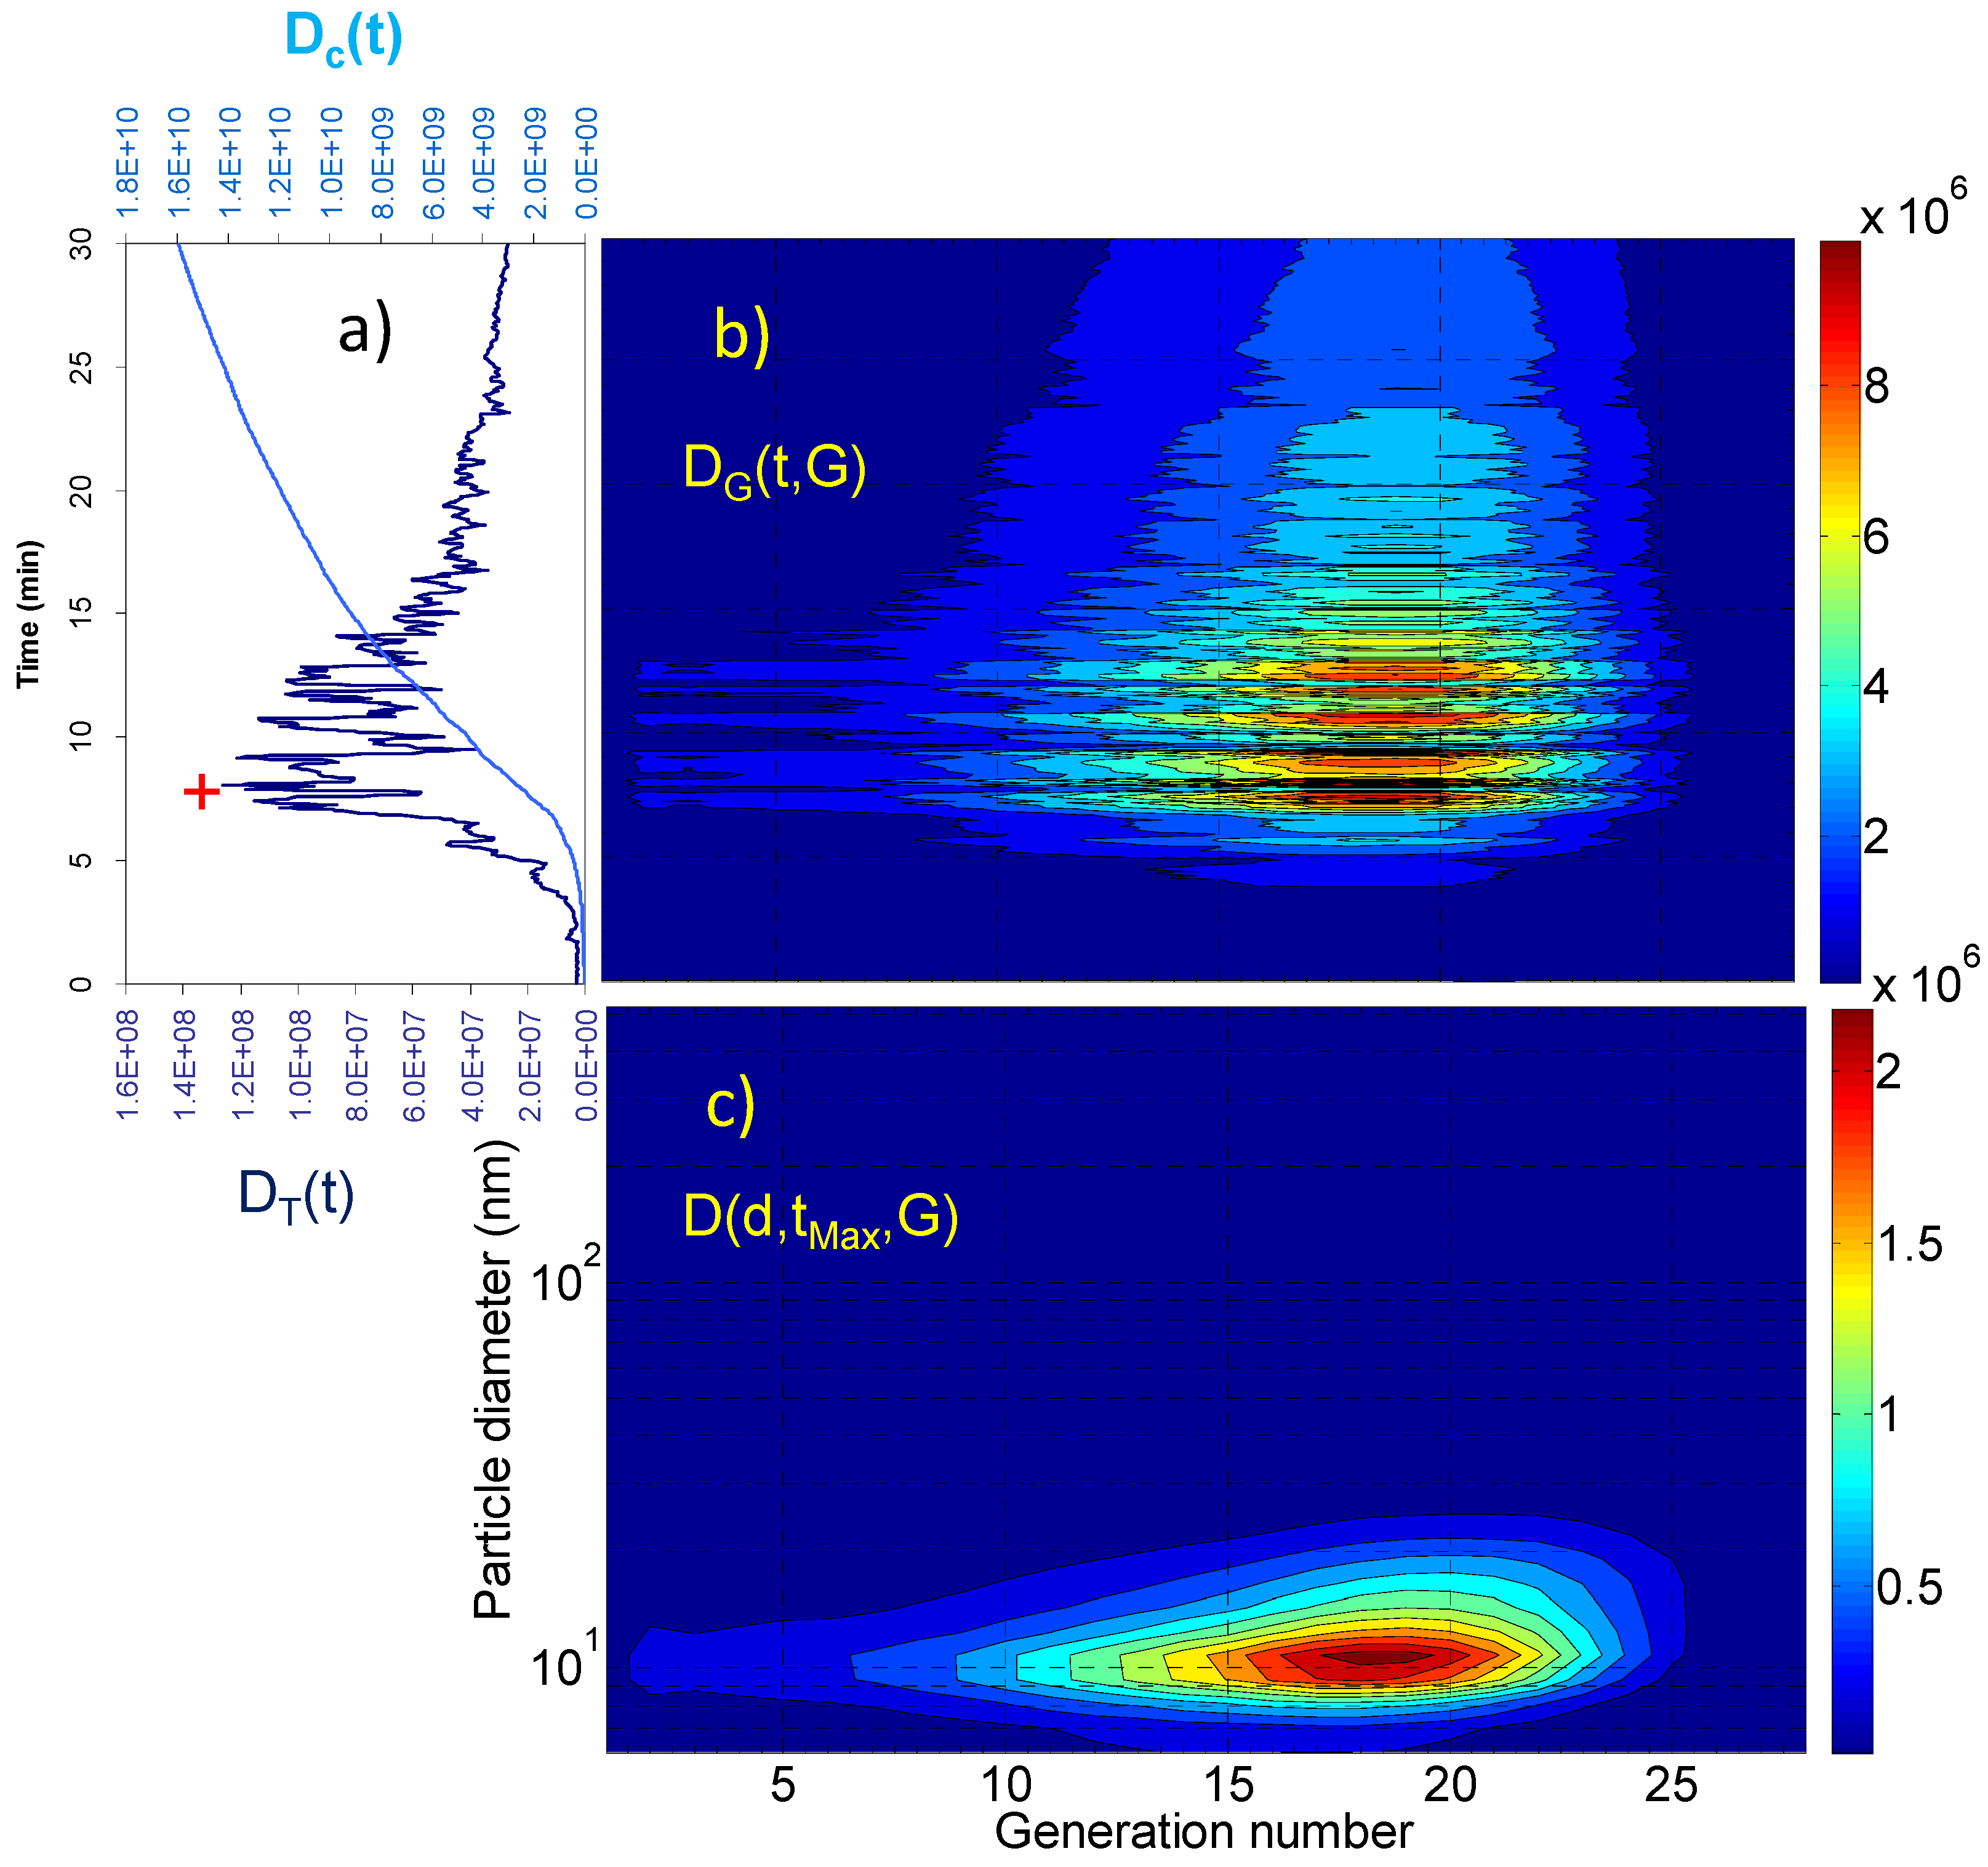
| Breakfast | 1.59 × 10¹⁰ | 5.30 × 10⁸ | 1.26 × 10⁸ | 2.32 × 10⁶ | 18 | 10.8 |
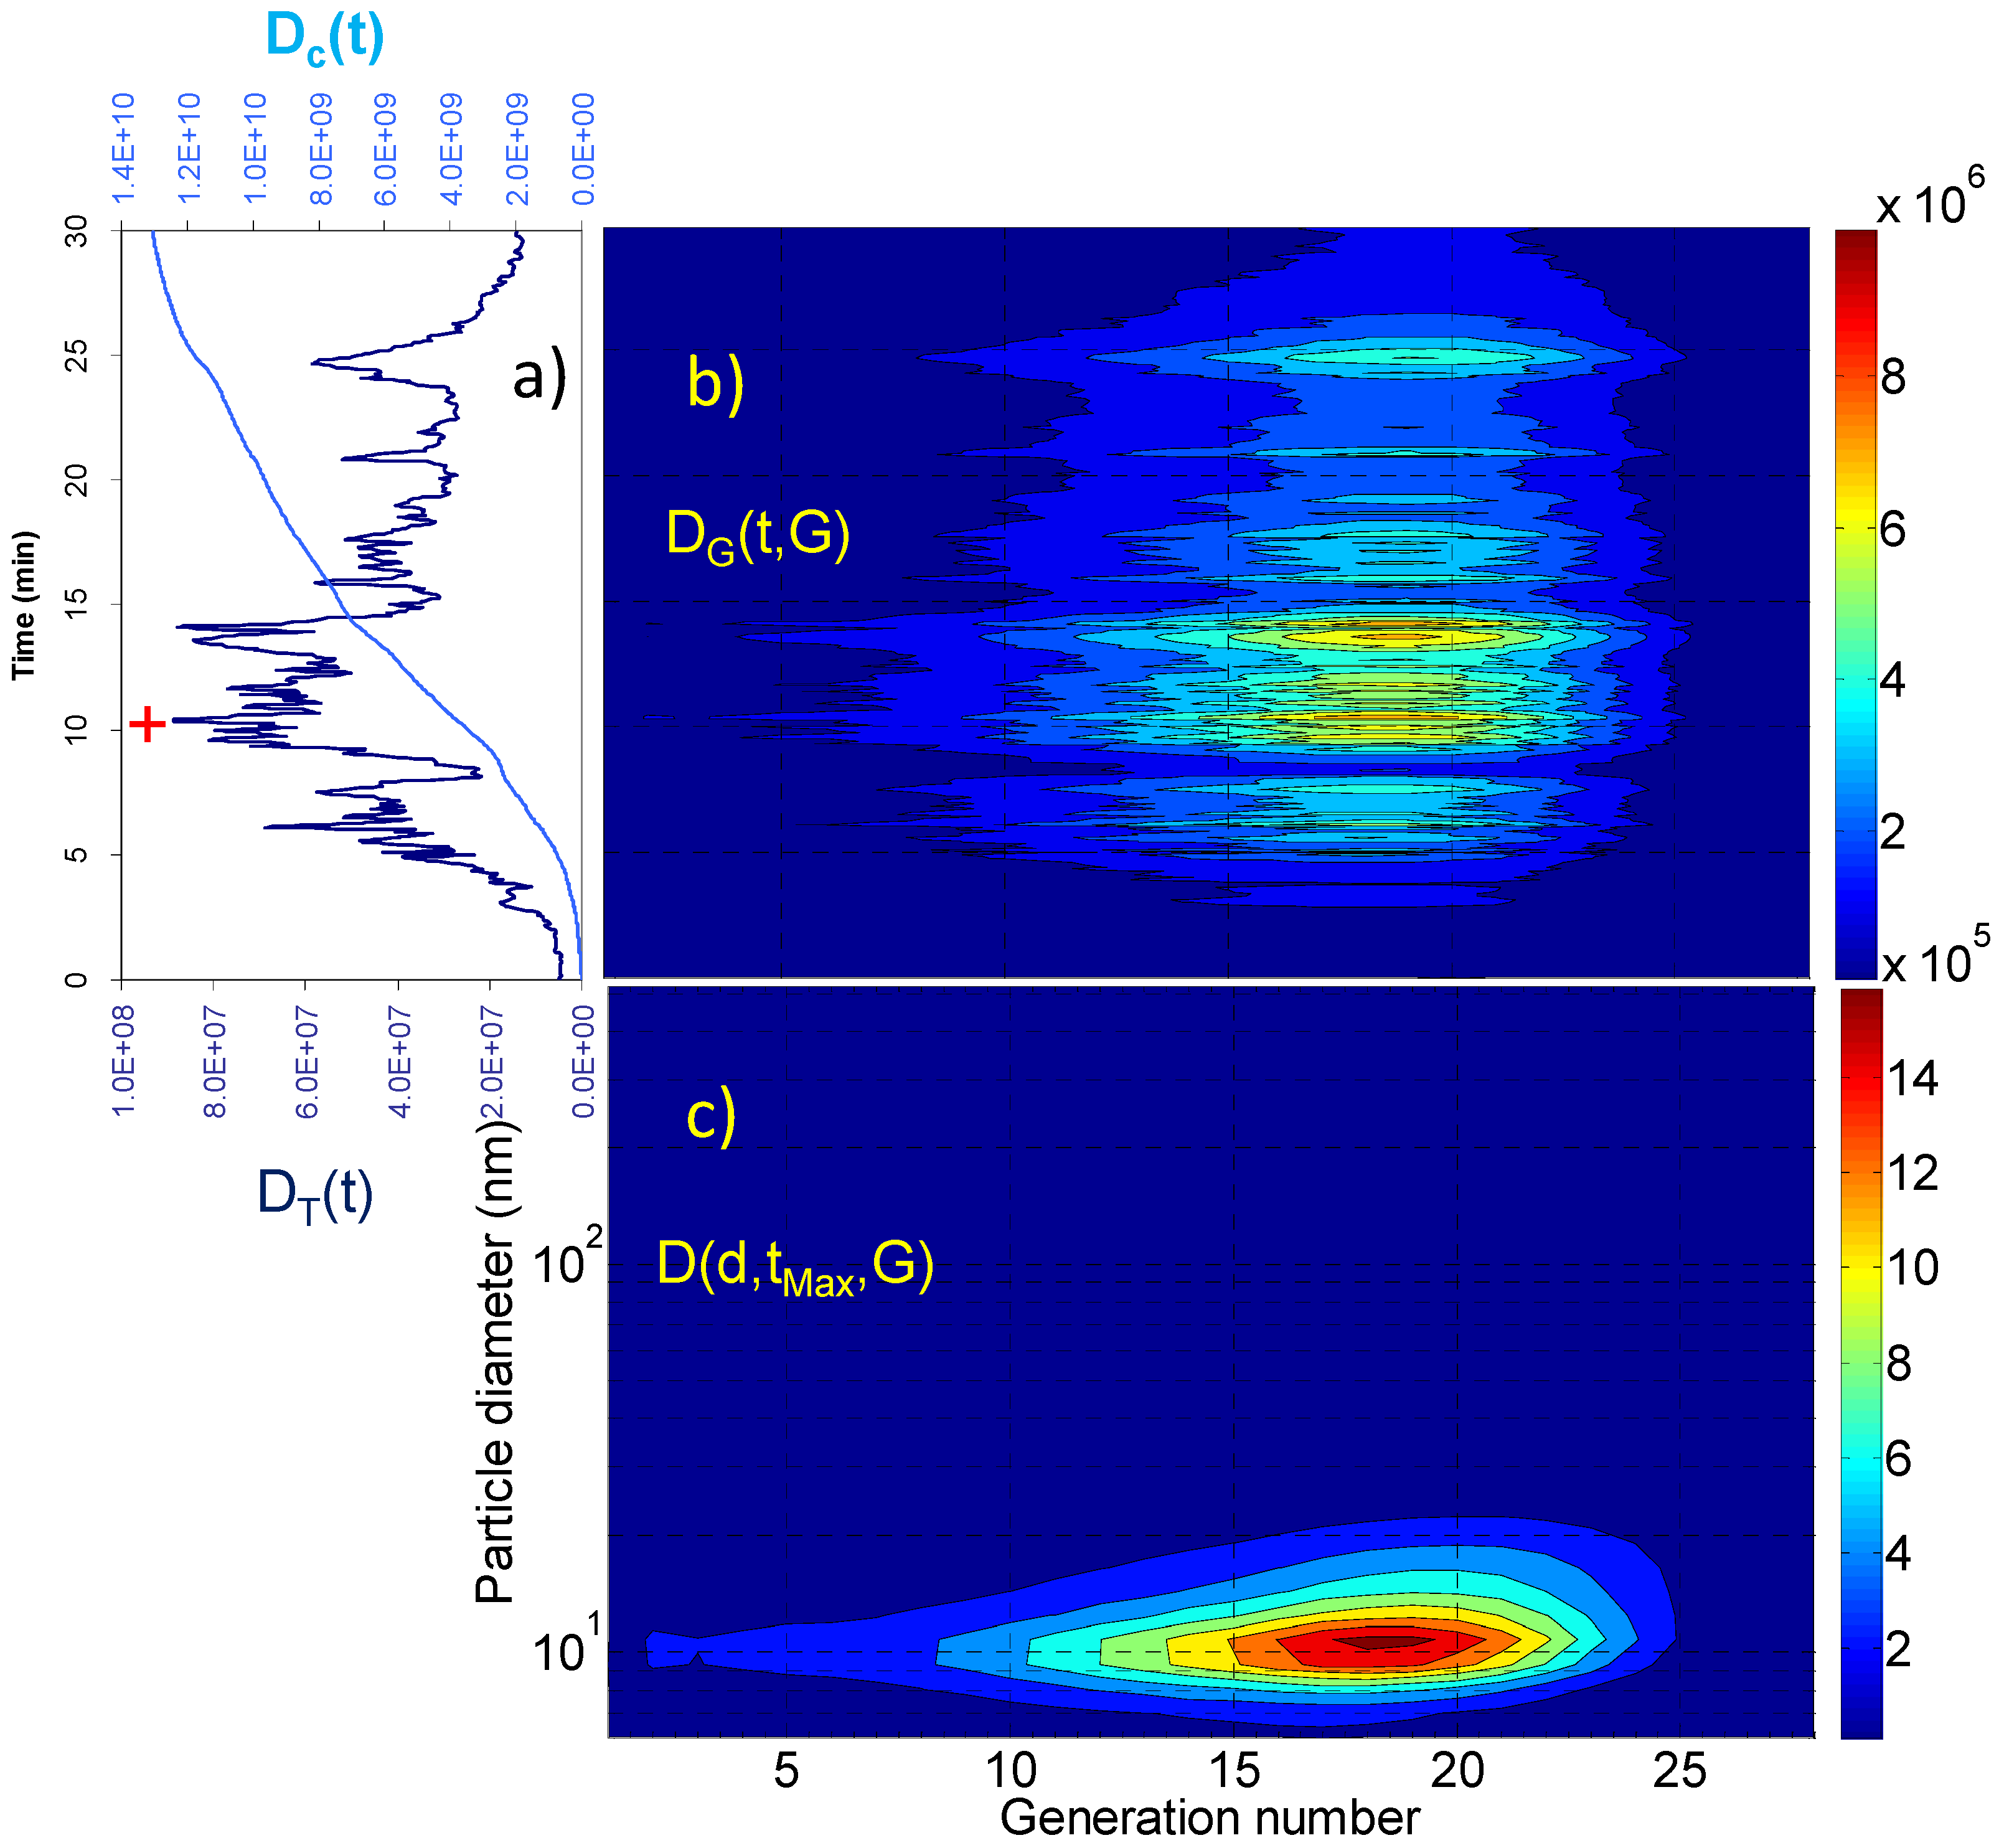
| Lunch | 1.31 × 10¹⁰ | 4.37 × 10⁸ | 8.86 × 10⁷ | 1.67 × 10⁶ | 18 | 10.8 |
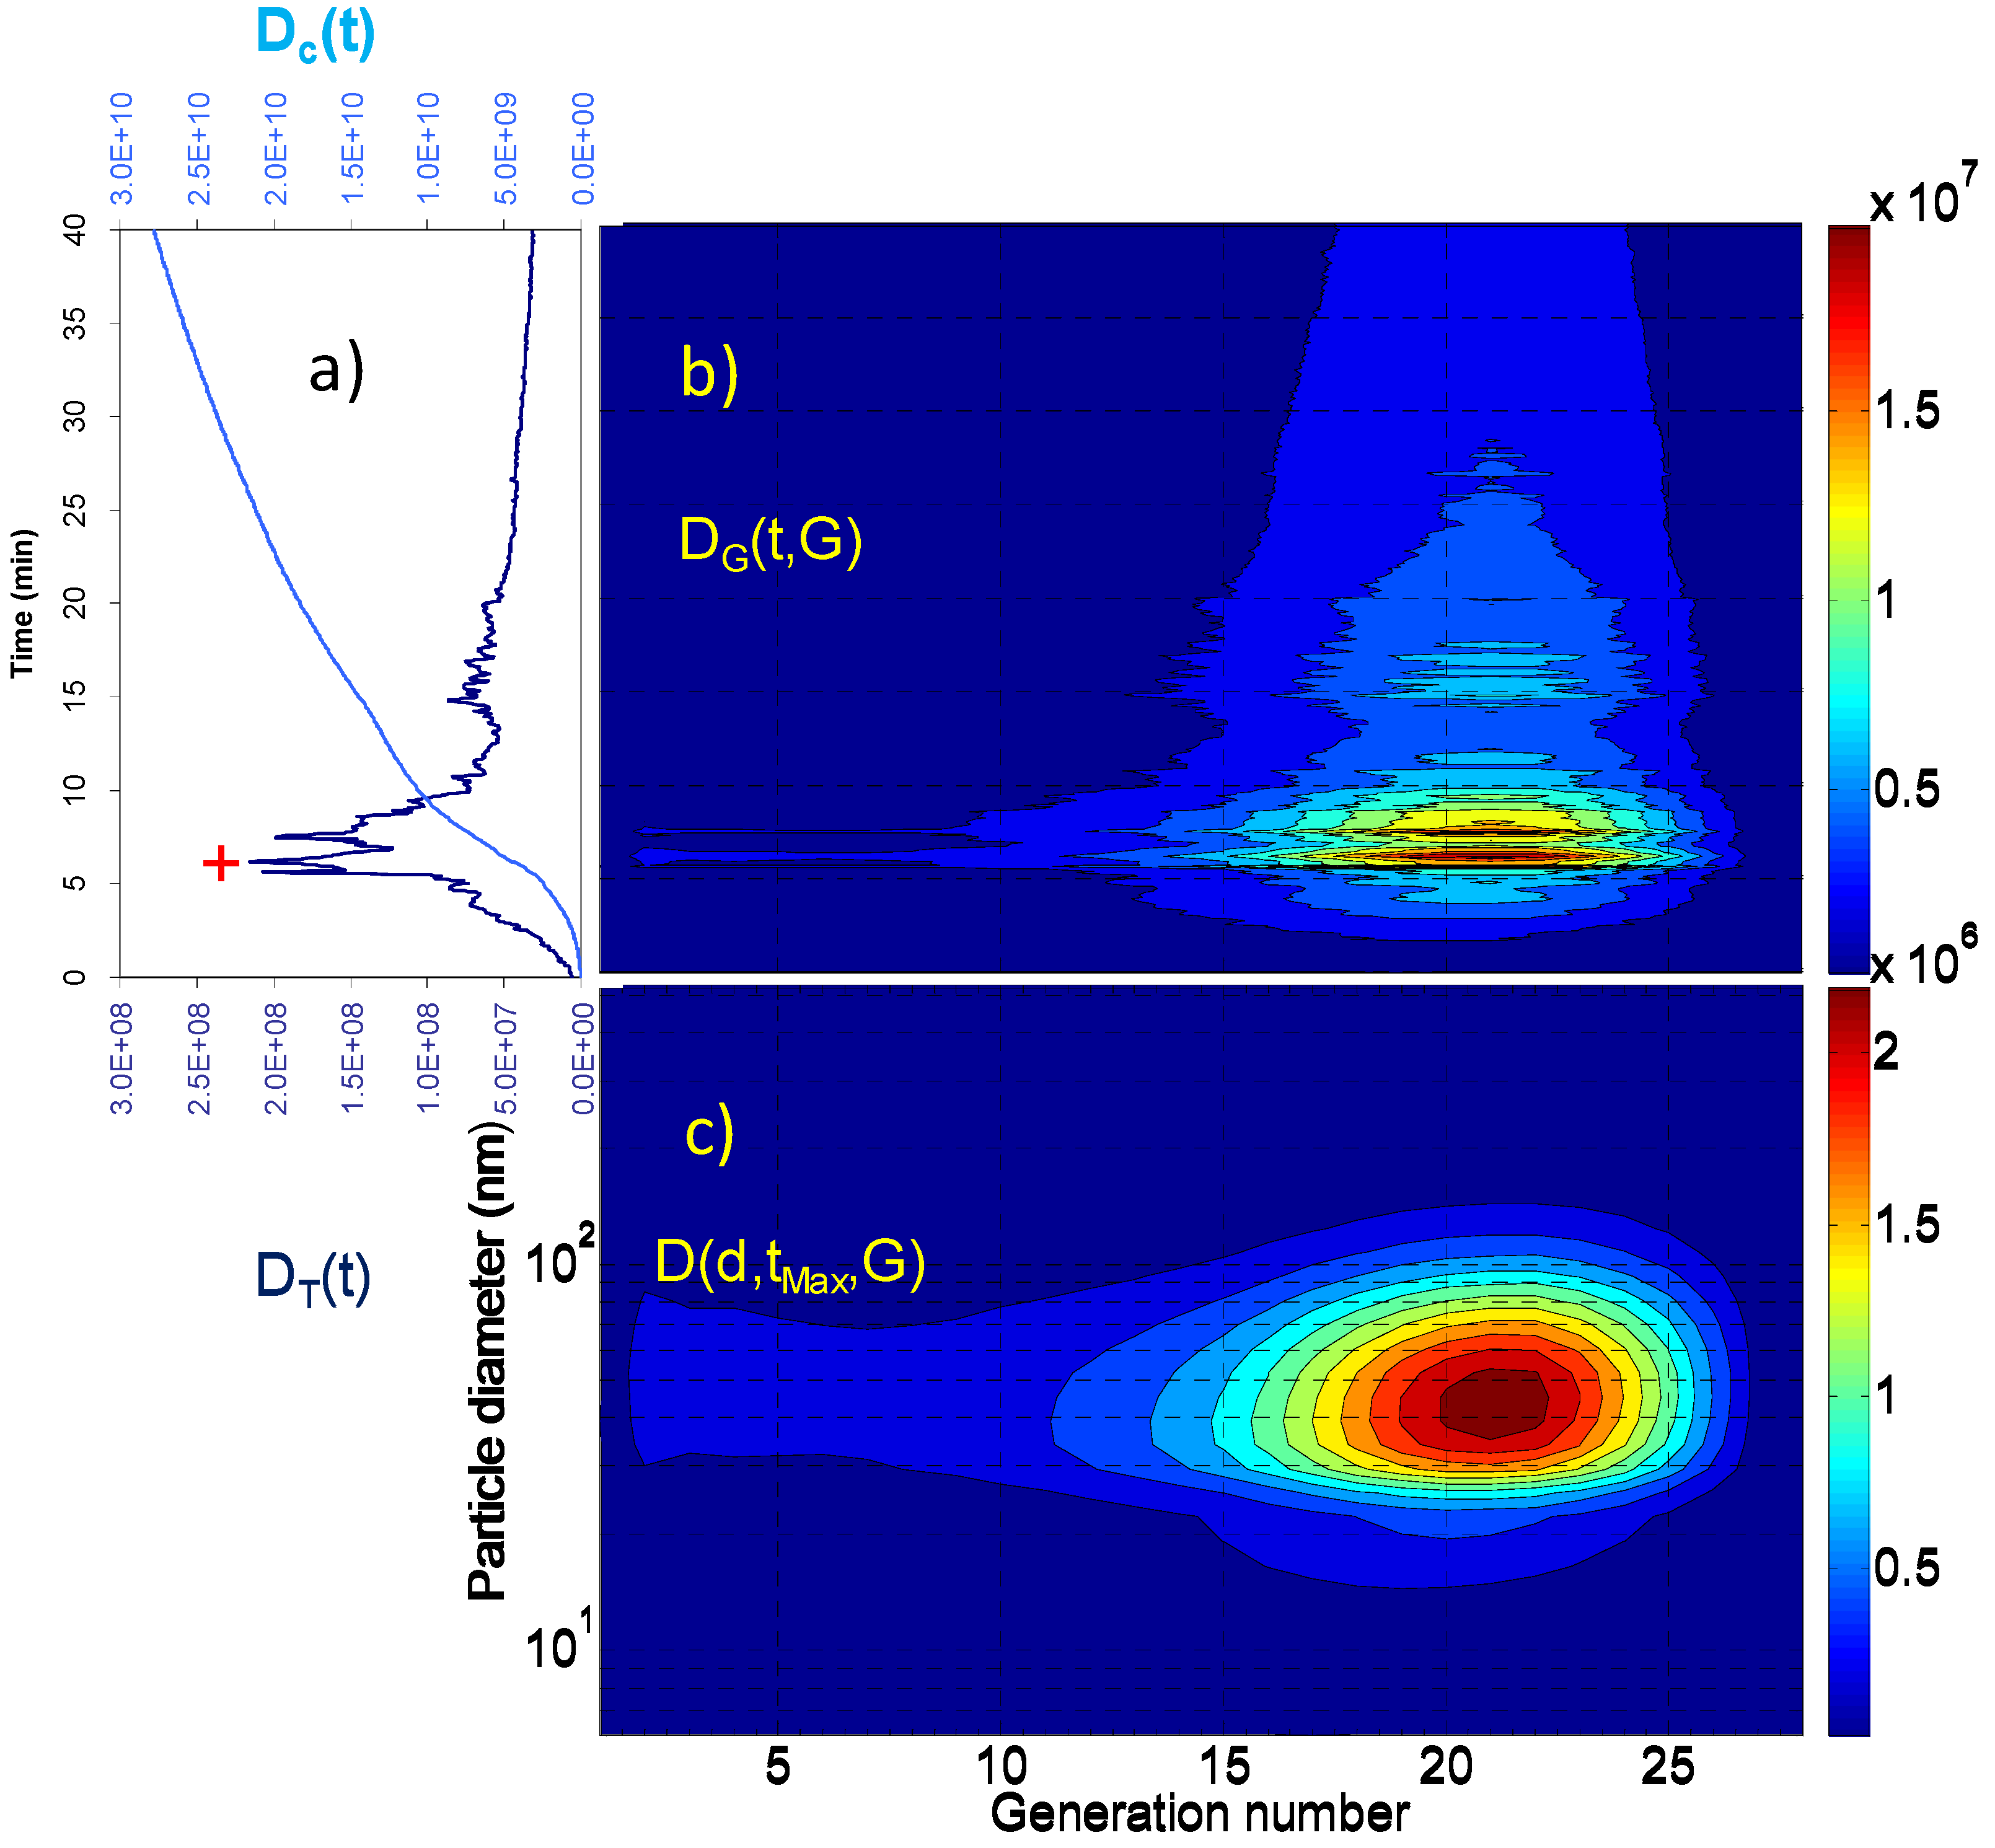
| Dinner | 2.78 × 10¹⁰ | 6.95 × 10⁸ | 2.15 × 10⁸ | 2.33 × 10⁶ | 21 | 45.3 |


3. Experimental Section
3.1. Aerosol Measurements
3.2. Particle Dose Evaluation
- (i)
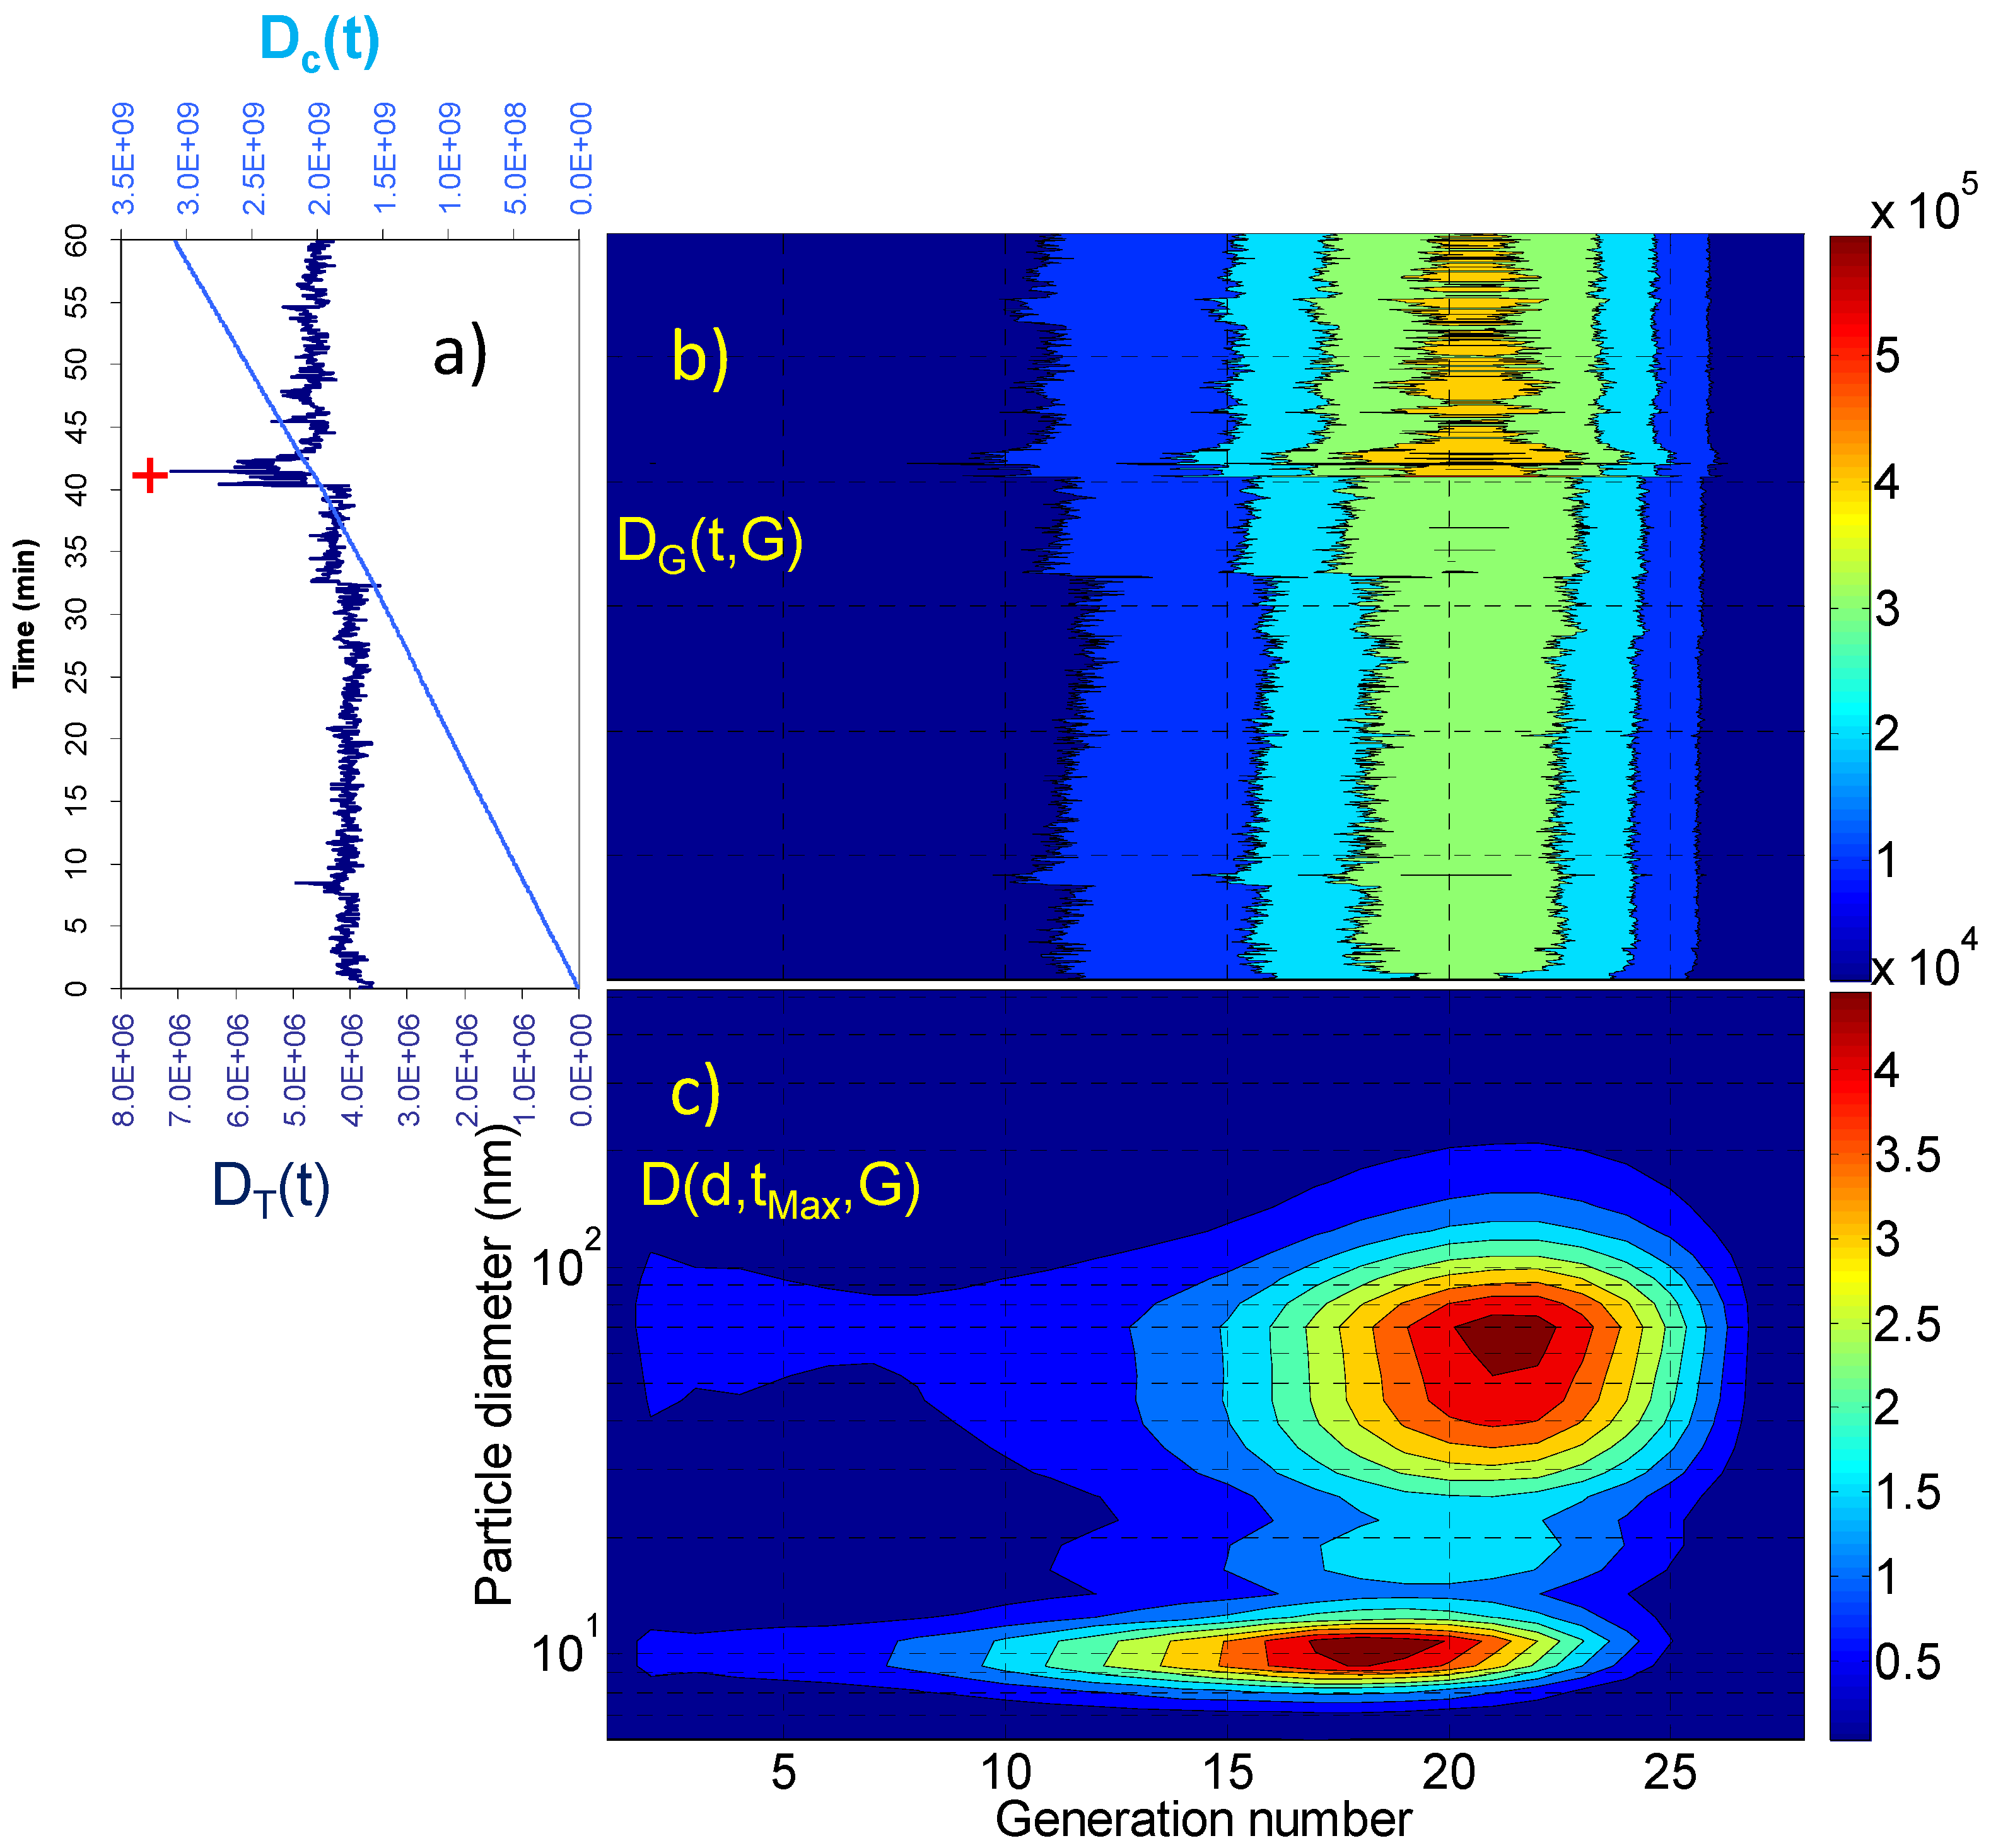
- instant doses D(d,t,G):where F(d,G) is the deposition fraction at a given airway generation and particle diameter and C(d,t) is the concentration of particles of diameter d at a given time t averaged over a single respiratory act time interval;
- (ii)
- instant dose per airway generation DG(t,G):The summation in Equation 3 is carried out over the 32 FMPS size classes;
- (iii)
- total instant doses DT(t):The summation in Equation 4 is carried out over the 28 airway generations;
- (iv)
- cumulative doses deposited at the end of a given residence time (tR) in each indoor environment Dc(tR):where tR was 60, 33, 30, 30 and 40 min, respectively, for living room residence (no aerosol generation), living room during vacuum cleaning, breakfast, lunch and dinner preparation and eating.
4. Conclusions
Acknowledgments
Author Contributions
Conflicts of Interest
References
- Brook, R.D.; Brook, J.R.; Urch, B.; Vincent, R.; Rajagopalan, S.; Silverman, F. Inhalation of fine particulate air pollution and ozone causes acute arterial vasoconstriction in healthy adults. Circulation 2002, 105, 1534–1536. [Google Scholar] [CrossRef] [PubMed]
- Simkhovich, B.Z.; Kleinman, M.T.; Kloner, R.A. Air pollution and cardiovascular injury epidemiology, toxicology, and mechanisms. J. Am. Coll. Cardiol. 2008, 52, 719–726. [Google Scholar] [CrossRef] [PubMed]
- Delfino, R.J.; Zeiger, R.S.; Seltzer, J.M.; Street, D.H. Symptoms in pediatric asthmatics and air pollution: differences in effects by symptom severity, anti-inflammatory medication use and particulate averaging time. Environ. Health Perspect. 1998, 106, 751–761. [Google Scholar] [CrossRef] [PubMed]
- Von Klot, S.; Wölke, G.; Tuch, T.; Heinrich, J.; Dockery, D.W.; Schwartz, J.; Kreylingz, W.G.; Wichmann, H.E.; Peters, A. Increased asthma medication use in association with ambient fine and ultrafine particles. Eur. Respir. J. 2002, 20, 691–702. [Google Scholar] [CrossRef] [PubMed]
- Dominici, F.; Peng, R.D.; Bell, M.L.; Pham, L.; McDermott, A.; Zeger, S.L.; Samet, J.M. Fine particulate air pollution and hospital admission for cardiovascular and respiratory diseases. J. Am. Med. Assoc. 2006, 295, 1127–1134. [Google Scholar] [CrossRef] [PubMed]
- International Agency for Research on Cancer. Outdoor Air Pollution: A Leading Environmental Cause of Cancer Deaths. Available online: http://www.iarc.fr/en/media-centre/iarcnews/pdf/pr221_E.pdf (17 October 2013).
- Loomis, D.; Grosse, Y.; Lauby-Secretan, B.; El Ghissassi, F.; Bouvard, V.; Benbrahim-Tallaa, L.; Guha, N.; Baan, R.; Mattock, H.; Straif, K. The carcinogenicity of outdoor air pollution. Lancet Oncol. 2013, 14, 1262–1263. [Google Scholar] [CrossRef]
- Hamra, G.B.; Guha, N.; Cohen, A.; Laden, F.; Raaschou-Nielsen, O.; Samet, J.M.; Vineis, P.; Forastiere, F.; Saldiva, P.; Yorifuji, T.; Loomis, D. Outdoor particulate matter exposure and lung cancer: a systematic review and meta-analysis. Environ. Health Perspect. 2014, 122, 906–911. [Google Scholar] [CrossRef] [PubMed]
- Jantunen, M.J.; Hänninen, O.; Katsouyanni, K.; Knöppel, H.; Künzli, N.; Lebret, E.; Maroni, M.; Saarela, K.; Srám, R.; Zmirou, D. Air pollution exposure in European cities: The “EXPOLIS” study. J. Expo. Anal. Environ. Epidemiol. 1999, 8, 495–518. [Google Scholar]
- Schweizer, C.; Edwards, R.D.; Bayer-Oglesby, L.; Gauderman, W.J.; Ilacqua, V.; Jantunen, M.J.; Laie, H.K.; Nieuwenhuijsen, M.; Künzli, N. Indoor time-microenvironment-activity patterns in seven regions of Europe. J. Expo. Sci.Environ. Epidemiol. 2007, 17, 170–181. [Google Scholar] [CrossRef] [PubMed]
- International Agency for Research on Cancer (IARC) Working Group on the Evaluation of Carcinogenic Risks to Humans. Some Non-heterocyclic Polycyclic Aromatic Hydrocarbons and Some Related Exposures; IARC: Lyon, France, 2010. [Google Scholar]
- Anderson, K.E.; Kadlubar, F.F.; Kulldorff, M.; Harnack, L.; Gross, M.; Lang, N.P.; Barber, C.; Rothman, N.; Sinha, R. Dietary intake of heterocyclic amines and benzo(a)pyrene: Associations with pancreatic cancer. Cancer Epidemiol. Biomark. Prev. 2005, 14, 2261–2265. [Google Scholar] [CrossRef] [PubMed]
- Butler, L.M.; Sinha, R.; Millikan, R.C.; Martin, C.F.; Newman, B.; Gammon, M.D.; Ammerman, A.S.; Sandler, R.S. Heterocyclic amines, meat intake, and association with colon cancer in a population-based study. Am. J. Epidemiol. 2003, 157, 434–445. [Google Scholar] [CrossRef] [PubMed]
- Lang, N.P.; Butler, M.A.; Massengill, J.; Lawson, M.; Stotts, R.C.; Hauer-Jensen, M.; Kadlubar, F.F. Rapid metabolic phenotypes for acetyltransferase and cytochrome P4501A2 and putative exposure to food-borne heterocyclic amines increase the risk for colorectal cancer or polyps. Cancer Epidemiol. Biomark. Prev. 1994, 3, 675–682. [Google Scholar]
- International Agency for Research on Cancer (IARC) Working Group on the Evaluation of Carcinogenic Risks to Humans, and World Health Organization. Re-Evaluation of Some Organic Chemicals, Hydrazine and Hydrogen Peroxide; IARC: Lyon, France, 1999. [Google Scholar]
- International Agency for Research on Cancer (IARC) Working Group on the Evaluation of Carcinogenic Risks to Humans. Formaldehyde, 2-Butoxyethanol and 1-tert-Butoxypropan-2-ol; IARC: Lyon, France, 2006; Volume 88. [Google Scholar]
- International Agency for Research on Cancer (IARC) Working Group on the Evaluation of Carcinogenic Risks to Humans. Household Use of Solid Fuels and High-Temperature Frying; IARC: Lyon, France, 2006. [Google Scholar]
- Donaldson, K.; Stone, V.; Seaton, A.; MacNee, W. Ambient particle inhalation and the cardiovascular system: potential mechanisms. Environ. Health Perspect. 2001, 109, 523–527. [Google Scholar] [CrossRef] [PubMed]
- Oberdörster, G.; Oberdörster, E.; Oberdörster, J. Nanotoxicology: An emerging discipline evolving from studies of ultrafine particles. Environ. Health Perspect. 2005, 113, 823–840. [Google Scholar] [CrossRef] [PubMed]
- Avino, P.; Casciardi, S.; Fanizza, C.; Manigrasso, M. Deep investigation of ultrafine particles in urban air. Aerosol Air Qual. Res. 2011, 13, 654–663. [Google Scholar] [CrossRef]
- Avino, P.; Lopez, F.; Manigrasso, M. Regional deposition in human respiratory system of submicrometer aerosol determined at 1 Hz frequency. Aerosol Air Qual. Res. 2013, 13, 1702–1711. [Google Scholar]
- Parkash, O. Lung cancer. A statistical study based on autopsy data from 1928 to 1972. Respiration 1977, 34, 295–304. [Google Scholar] [PubMed]
- Hornberg, C.; Maciuleviciute, L.; Seemayer, N.H. Sister chromatid exchanges in rodent tracheal epithelium exposed in vitro to environmental pollutants. Toxicol. Lett. 1996, 88, 45–53. [Google Scholar] [CrossRef]
- Hornberg, C.; Maciuleviciute, L.; Seemayer, N.H.; Kainka, E. Induction of sister chromatid exchanges (SCE) in human tracheal epithelial cells by the fractions PM10 and PM2.5 of airborne particulates. Toxicol. Lett. 1998, 96–97, 215–220. [Google Scholar] [CrossRef]
- Ji, W.; Zhao, B. Estimating mortality derived from indoor exposure to particles of outdoor origin. PLoS ONE 2015, 10, e0124238. [Google Scholar] [CrossRef] [PubMed]
- Knibbs, L.D.; Congrong, H.; Duchaine, C.; Morawska, L. Vacuum cleaner emissions as a source of indoor exposure to airborne particles and bacteria. Environ. Sci. Technol. 2012, 46, 534–542. [Google Scholar] [CrossRef] [PubMed]
- Veillette, M.; Knibbs, L.D.; Pelletier, A.; Charlebois, R.; Lecours, P.B.; Congrong, H.; Lidia Morawska, L.; Duchaine, C. Microbial contents of vacuum cleaner bag dust and emitted bioaerosols and their implications for human exposure indoors. Appl. Environ. Microbiol. 2013, 79, 6331–6336. [Google Scholar] [CrossRef] [PubMed]
- Szymczak, W.; Menzel, N.; Keck, L. Emission of ultrafine copper particles by universal motors controlled by phase angle modulation. J. Aerosol Sci. 2007, 38, 520–531. [Google Scholar] [CrossRef]
- Wagner, A.Y.; Livbjerg, H.; Kristensen, P.G.; Glarborg, P. Particle emissions from domestic gas cookers. Combust. Sci. Technol. 2010, 182, 1511–1527. [Google Scholar] [CrossRef]
- Manigrasso, M.; Stabile, L.; Avino, P.; Buonanno, G. Influence of measurement frequency on the evaluation of short-term dose of sub-micrometric particles during indoor and outdoor generation events. Atmos. Environ. 2013, 67, 130–142. [Google Scholar] [CrossRef]
- He, C.; Morawska, L.; Hitchins, J.; Gilbert, D. Contribution from indoor sources to particle number and mass concentrations in residential houses. Atmos. Environ. 2004, 38, 3405–3415. [Google Scholar] [CrossRef] [Green Version]
- Wallace, L. Indoor sources of ultrafine and accumulation mode particles: size distributions, size-resolved concentrations, and source strengths. Aerosol Sci. Technol. 2006, 40, 348–360. [Google Scholar] [CrossRef]
- Hussein, T.; Glytsos, T.; Ondráček, J.; Dohányosová, P.; Ždí´mal, V.; Hämeri, K.; Lazaridis, M.; Smoläk, J.; Kulmala, M. Particle size characterization and emission rates during indoor activities in a house. Atmos. Environ. 2006, 40, 4285–4307. [Google Scholar] [CrossRef]
- Afshari, A.; Matson, U.; Ekberg, L.E. Characterization of indoor sources of fine and ultrafine particles: a study conducted in a full-scale chamber. Indoor Air 2005, 15, 141–150. [Google Scholar] [CrossRef] [PubMed]
- Hussein, T.; Hämeri, K.; Heikkinen, M.S.A.; Kulmala, M. Indoor and outdoor particle size characterization at a family house in Espoo-Finland. Atmos. Environ. 2005, 39, 3697–3709. [Google Scholar] [CrossRef]
- Morawska, L.; He, C.; Hitchins, J.; Mengersen, K.; Gilbert, D. Characteristics of particle number and mass concentrations in residential houses in Brisbane, Australia. Atmos. Environ. 2003, 37, 4195–4203. [Google Scholar] [CrossRef] [Green Version]
- Dennekamp, M.; Howarth, S.; Dick, C.A.J.; Cherrie, J.W.; Donaldson, K.; Seaton, A. Ultrafine particles and nitrogen oxides generated by gas and electric cooking. Occup. Environ. Med. 2001, 58, 511–516. [Google Scholar] [CrossRef] [PubMed]
- Abt, E.; Suh, H.H.; Allen, G.; Koutrakis, P. Characterization of indoor particle sources: a study conducted in the0metropolitan Boston area. Environ. Health Perspect. 2000, 108, 35–40. [Google Scholar] [CrossRef] [PubMed]
- Siegmann, K.; Sattler, K. Aerosol from hot cooking oil, a possible health hazard. J. Aerosol Sci. 1996, 27, 493–494. [Google Scholar] [CrossRef]
- Wallace, L.; Wang, F.; Howard-Reed, C.; Persily, A. Contribution of gas and electric stoves to residential ultrafine particle concentrations between 2 and 64 nm: Size distributions and emission and coagulation rates. Environ. Sci. Technol. 2008, 42, 8641–8647. [Google Scholar] [CrossRef] [PubMed]
- Wallace, L.A.; Emmerich, S.J.; Howard-Reed, C. Source strengths of ultrafine and fine particles due to cooking with a gas stove. Environ. Sci. Technol. 2004, 38, 2304–2311. [Google Scholar] [CrossRef] [PubMed]
- Rim, D.; Green, M.; Wallace, L.; Persily, A.; Choi, J.I. Evolution of ultrafine particle size distributions following indoor episodic releases: relative importance of coagulation, deposition and ventilation. Aerosol Sci. Technol. 2012, 46, 494–503. [Google Scholar] [CrossRef]
- Yeh, H.C.; Schum, G.M. Models of human lung airways and their application to inhaled particle deposition. Bull. Math. Biol. 1980, 42, 461–480. [Google Scholar] [CrossRef] [PubMed]
- Manigrasso, M.; Avino, P. Fast evolution of urban ultrafine particles: Implications for deposition doses in the human respiratory system. Atmos. Environ. 2012, 51, 116–123. [Google Scholar] [CrossRef]
- Buonanno, G.; Giovinco, G.; Morawska, L.; Stabile, L. Tracheobronchial and alveolar dose of submicrometer particles for different population age groups in Italy. Atmos. Environ. 2011, 45, 6216–6224. [Google Scholar] [CrossRef] [Green Version]
- Morawska, L.; Afshari, L.; Bae, G.N.; Buonanno, G.; Chao, C.Y.H.; Hänninen, O.; Hofmann, W.; Isaxon, C.; Jayaratne, E.R.; Pasanen, P.; et al. Indoor aerosols: From personal exposure to risk assessment. Indoor Air 2013, 23, 462–487. [Google Scholar] [CrossRef] [PubMed] [Green Version]
- TSI Particle Technology. Available online: http://www.tsi.com/uploadedFiles/Product_Information/Literature/Catalogs/Particle_Catalog_Web.pdf (accessed on 15 July 2015).
- Manigrasso, M.; Avino, P.; Fanizza, C. Ultrafine particles in the urban area of Rome. Fresenius Environ. Bull. 2009, 18, 1341–1347. [Google Scholar]
- Stabile, L.; Buonanno, G.; Avino, P.; Fuoco, F.C. Dimensional and chemical characterization of airborne particles in schools: respiratory effects in children. Aerosol Air Qual. Res. 2013, 13, 887–900. [Google Scholar] [CrossRef]
- Jeong, C.H.; Greg, J.; Evans, G.J. Inter-comparison of a fast mobility particle sizer and a scanning mobility particle sizer incorporating an ultrafine water-based condensation particle counter. Aerosol Sci. Technol. 2009, 43, 364–373. [Google Scholar] [CrossRef]
- Laussmann, D.; Helm, D. Air change measurements using tracer gases: Methods and results. Significance of air change for indoor air quality. In Chemistry, Emission Control, Radioactive Pollution and Indoor Air Quality; Mazzeo, M., Ed.; InTech: Rijeka, Croatia, 2011; pp. 365–406. [Google Scholar]
- Anjilvel, S.; Asgharian, B.A. Multiple-path model of particle deposition in the rat lung. Fundam. Appl. Toxicol. 1995, 28, 41–50. [Google Scholar] [CrossRef] [PubMed]
- Price, O.T.; Asgharian, B.; Miller, F.J.; Cassee, F.R.; de Winter-Sorkina, R. Multiple Path Particle Dosimetry Model (MPPD v. 1.0): A Model for Human and Rat Airway Particle Dosimetry. Available online: http://www.ara.com/products/mppd.htm (accessed on 16 June 2015).
- Manigrasso, M.; Buonanno, G.; Fuoco, F.C.; Stabile, L.; Avino, P. Aerosol deposition doses in the human respiratory tree of electronic cigarette smokers. Environ. Pollut. 2015, 196, 257–267. [Google Scholar] [CrossRef] [PubMed]
- Manigrasso, M.; Buonanno, G.; Stabile, L.; Morawska, L.; Avino, P. Particle doses in the pulmonary lobes of electronic and conventional cigarette users. Environ. Pollut. 2015, 202, 24–31. [Google Scholar] [CrossRef] [PubMed]
- Avino, P.; Manigrasso, M.; Pandolfi, P.; Tornese, C.; Settimi, D.; Paolucci, N. Submicron particles during macro-and micro-weldings procedures in industrial indoor environments and health implications for welding operators. Metals 2015, 5, 1045–1060. [Google Scholar] [CrossRef]
- International Commission on Radiological Protection. Human Respiratory Tract Model for Radiological Protection. Available online: http://www.icrp.org/publication.asp?id=ICRP%20Publication%2066 (accessed on 29 July 2015).
- Asgharian, B.; Hofmann, W.; Bergmann, R. Particle deposition in a multiple-path model of the human lung. Aerosol Sci. Technol. 2001, 34, 332–339. [Google Scholar] [CrossRef]
© 2015 by the authors; licensee MDPI, Basel, Switzerland. This article is an open access article distributed under the terms and conditions of the Creative Commons Attribution license (http://creativecommons.org/licenses/by/4.0/).
Share and Cite
Manigrasso, M.; Guerriero, E.; Avino, P. Ultrafine Particles in Residential Indoors and Doses Deposited in the Human Respiratory System. Atmosphere 2015, 6, 1444-1461. https://doi.org/10.3390/atmos6101444
Manigrasso M, Guerriero E, Avino P. Ultrafine Particles in Residential Indoors and Doses Deposited in the Human Respiratory System. Atmosphere. 2015; 6(10):1444-1461. https://doi.org/10.3390/atmos6101444
Chicago/Turabian StyleManigrasso, Maurizio, Ettore Guerriero, and Pasquale Avino. 2015. "Ultrafine Particles in Residential Indoors and Doses Deposited in the Human Respiratory System" Atmosphere 6, no. 10: 1444-1461. https://doi.org/10.3390/atmos6101444