Article

Characteristics and Sources of Metals in TSP and PM2.5 in an Urban Forest Park at Guangzhou

1
Research Institute of Tropical Forestry, Chinese Academy of Forestry, Guangzhou 510520, China
2
Key Laboratory of Forest Ecology and Environment, China's State Forestry Administration, Institute of Forest Ecology, Environment and Protection, Chinese Academy of Forestry, Beijing 100091, China
3
College of Forestry, South China Agricultural University, Guangzhou 510642, China
4
Key Laboratory of Vegetation Restoration and Management of Degraded Ecosystems, South China Botanical Garden, Chinese Academy of Sciences, Guangzhou 510650, China
5
Guangdong Academy of Forestry, Guangzhou 510520, China
*
Author to whom correspondence should be addressed.
Atmosphere 2014, 5(4), 775-787; https://doi.org/10.3390/atmos5040775
Submission received: 3 September 2014 / Revised: 16 October 2014 / Accepted: 21 October 2014 / Published: 28 October 2014

Abstract

:
Urban forest parks play important roles in improving environments, protecting biodiversity and even public welfare. Aerosols, including total suspended particles (TSP) and particulate matter with aerodynamic diameter less than 2.5 µm (PM2.5), were simultaneously collected in an urban forest park (Dafushan) at Guangzhou, southern China, from January 2012 to December 2013. The concentrations of 12 metals (Al, Cd, Co, Cr, Cu, Hg, Mn, Mo, Ni, Pb, Se, and Zn) in both TSP and PM2.5 were quantified using an inductively coupled plasma-mass spectrometer. The origins and possible sources of the studied metals in the PM2.5 and TSP were evaluated using the crustal enrichment factors and the principal component analysis, respectively. The results showed that Dafushan urban forest park was polluted by PM2.5 rather than by TSP. The PM2.5 and TSP in the forest park exhibited seasonal patterns with significantly higher contents in the dry season compared with the rainy season. The metals Al, Zn, Pb were the most abundant, while Hg was the lowest metals in the aerosols. The ratios of PM2.5/TSP ratio indicated that the metals were predominant in the finer particles (PM2.5). The crustal enrichment factors indicated that Cd, Cu, Mo, Pb, Se and Zn in the aerosols originated from anthropogenic sources, while Al and Mn were mainly of crustal origin. The principal component analysis implied that industrial activities, traffic-related emissions, and soil dust were the main possible sources of the metals in both PM2.5 and TSP in Dafushan forest park.

1. Introduction

Total suspended particles (TSP) and especially particulate matter with aerodynamic diameter less than 2.5 µm (PM2.5) are frequently considered as atmospheric pollutants due to their ability to bind to toxic substances and hazardous matter. Numerous studies have confirmed the close relationships between the high concentrations of TSP, PM2.5 and an increased risk of respiratory symptoms, cancer and even mortality rates [1,2,3,4]. Besides their adverse effects on visibility [5], TSP and PM2.5 have been found to be the carriers of pathogenic bacteria that lead to fatal diseases [6] and toxic metals that result in human dysfunction and various diseases [4,7,8]. Metals in particulate matter (PM) usually have both anthropogenic and natural origins. Anthropogenic sources (e.g., industrial activities, waste incineration, fossil fuel burning [4,9,10,11], traffic emissions [12,13]), and natural sources (e.g., crustal minerals, forest fires and oceans) were the principal contributors to metals in the ambient air [14,15,16].
In recent years, China has undergone severe haze pollution due to the intensive emissions of air pollutants coupled with the rapid industrialization and urbanization [4,11]. A very high level of PM2.5 with an annual average concentration over 90 μg∙m−3 was recently estimated in the Pearl River Delta of southern China [17,18]. The toxic metals in aerosols originating from the intensive anthropogenic activities were reported at concentrations far higher than their natural background levels in many regions of China, especially in the city clusters such as the Yangtze River Delta, Beijing-Tianjin Area, and the Pearl River Delta [4,18,19,20,21]. In urban areas, the spatial-seasonal variability, characterization and sources assignation of PM as well as the concentrations of pollutants in PM, have been frequently of concern in areas such as traffic and residential districts and hospitals [18,19,20]. The characteristics and sources of metals in aerosols at recreational areas such as urban forest parks have seldom been considered [22,23,24]. Knowledge of metals (i.e., their characteristics and sources) in forest park aerosols is of great significance for the air quality and the public health of urban inhabitants.
Guangzhou is a highly industrialized and urbanized metropolitan located in the Pearl River Delta of southern China. It has a total area of greater than 7400 km2 and a population of more than 13 million people [25]. The reported daily average level of PM2.5 (107.5 ± 34.0 μg∙m−3) in the downtown area was considerably higher than the national standard of 35.0 μg∙m−3 [17]. Fortunately, for benefits such as environmental improvement, biodiversity protection, and public welfare, many urban forest parks have been built across the urban areas of southern China during the past years [23,26]. The public has become increasingly concerned about the air quality in urban forest parks. In the present study, we selected an urban forest park in Guangzhou (Dafushan forest park) to investigate (1) the characteristics of TSP, PM2.5 and their metal concentrations and (2) the potential origins and sources of the studied metals. Results of this type of research are expected to be useful for the characterization and planning of emissions control of metals around the urban forest parks and to be important for the welfare of the population, especially in highly polluted areas.

2. Results and Discussion

2.1. Seasonal PM Comparison

The mean concentrations of the TSP and PM2.5 in Dafushan forest park were showed in Table 1. The annual TSP level was comparable to the National Ambient Air Quality Standard (NAAQS) of 120 μg∙m−3, while the PM2.5 level was approximately twice as high as the NAAQS of 35 μg∙m−3 [27]. These results implied that the urban forest park was polluted by PM2.5 rather than TSP. In comparison with other urban areas in Guangzhou, this urban forest park had a lower PM2.5 than the hospitals (97.86 ± 51.81 μg∙m−3) [18], the residential districts (85.55 ± 37.25 μg∙m−3), the roadsides (109.70 ± 43.95 μg∙m−3), and the industrial plants (101.52 ± 30.41 μg∙m−3) [28]. In addition, the PM2.5 in this park was also lower than that in Chongming island forest park at Shanghai (89.2 μg∙m−3) [22], but considerably higher than that in K-pusta park of Hungary (12.7 μg∙m−3) [29], Hohenpeissenberg forest park of Germany (10.6 μg∙m−3) [30], and Triangle Park (20.1 μg∙m−3) of USA [31], which implied that the finer particle concentration in Dafushan forest park at Guangzhou was relatively high.
Table 1. Statistics of the particulate matters (total suspended particles (TSP) and particulate matter with aerodynamic diameter less than 2.5 µm (PM2.5)) (μg∙m−3), the PM2.5/TSP ratios, and the relationship between TSP and PM2.5 in Dafushan forest park.
SeasonPMValuesPM2.5/TSP
Max.Min.MeanSDCVSDCVMean
Rainy seasonTSP246.7159.85101.3243.290.430.441.120.40
PM2.5105.6918.2740.1819.110.48PM2.5 = 0.98TSP + 12.82 (r = 0.62)
Dry seasonTSP387.2348.96152.6582.870.550.340.690.49
PM2.5140.7226.3773.5828.320.38PM2.5 = 1.27TSP + 23.04 (r = 0.79)
AnnualTSP347.2348.96137.4166.340.460.511.170.43
PM2.5140.7218.2762.5233.580.54PM2.5 = 1.05TSP + 16.57 (r = 0.68)
As presented in Table 1, the concentrations of TSP and PM2.5 were significantly higher in the dry season than in the rainy season (p = 0.006 and 0.023, respectively). The significant difference in meteorological conditions between the seasons [32,33] might lead to the differences in PM concentrations. The stronger air convection activities, and more frequent and intensive precipitation in the rainy season compared with the dry season at Guangzhou facilitates the diffusion and the dilution of PM [28,33,34]. However, the prevailing wind from the north in winter could transport atmospheric pollutants from the inland area of China [28]. The lower ratio of PM2.5/TSP ratio in the rainy season implied that fine particulate matter exposed to higher humidity or precipitation might be easily removed [33]. Furthermore, the PM2.5 was strongly related to the TSP mass (the correlation coefficient r was 0.62, 0.79 and 0.68 for the rainy, dry season and annually, respectively, Table 1), and the correlation was stronger in the dry season compared with the rainy season.

2.2. Concentration of Metals in TSP and PM2.5

The mean ± SD of the studied metals in both the TSP and PM2.5 samples collected from the urban forest park were presented in Table 2. The metal concentrations in the TSP and PM2.5 decreased in the order of Al, Zn, Pb, Cu, Mn, Cr, Ni, Se, Mo, Cd, Co, and Hg. Aluminum, Zn and Pb were the most abundant, while Hg was the least abundant metals in both the TSP and PM2.5. Except for Co, Cr, Ni and Se, metals in PM2.5 and TSP in the dry season were significantly higher than those in the rainy season. The different behavior of those four metals might be associated with the rainy/dry seasons. There is a consistent and large demand for electric power in the Pearl River Delta in summer, which is mainly produced by thermal power plants burning coal, leading to a higher concentration of these metals in summer compared with winter [28]. These metals (especially Se) are often the indictors of coal combustion. Notably, metals in both the PM2.5 and TSP exhibited statistically different seasonal patterns except for Se and Hg. The higher p-values for Se and Hg might imply that both the metals had synchronous seasonal variations.
All the studied metals in the aerosols of Dafushan forest park were present in lower concentrations than those measured at hospitals, roadsides, residential and industrial areas at Guangzhou [5,18,28]. The relatively high PM2.5/TSP ratios (higher than 50%) indicated that the metals were predominant in the finer particles (PM2.5) in the rainy and dry seasons [4]. Our results were consistent with the findings in the aerosols from the hospitals, roadsides, residential districts and industrial plants at Guangzhou [5,18].
Table 2. Metal concentrations (mean ± SD) in the TSP and PM2.5 (ng∙m−3) in the rainy and dry seasons. The values of p-PM2.5 and p-TSP values indicated the significant differences in the same metal in the PM2.5 and TSP, respectively, between the rainy and dry seasons.
MetalsRainy SeasonDry Seasonp-PM2.5p-TSP
TSPPM2.5PM2.5/TSP (%)TSPPM2.5PM2.5/TSP (%)
Al983.64 ± 154.48708.17 ± 201.6572.021121.07 ± 268.94860.46 ± 188.3576.710.0340.018
Zn685.14 ± 92.37575.46 ± 61.5983.94732.70 ± 120.48636.41 ± 104.3386.890.0260.031
Pb77.93 ± 36.4971.99 ± 33.1892.31124.85 ± 41.27117.58 ± 37.8994.180.0180.011
Cu27.24 ± 12.5621.28 ± 10.5978.1262.71 ± 17.6357.89 ± 16.3792.310.0070.009
Mn21.61 ± 16.3415.22 ± 16.3570.4346.76 ± 28.4938.13 ± 24.0881.540.0150.036
Cr18.34 ± 6.6717.38 ± 6.2494.7714.39 ± 5.8112.47 ± 4.6786.660.0420.025
Ni12.17 ± 6.0610.65 ± 2.4987.517.62 ± 3.846.33 ± 1.8283.070.0310.013
Se4.68 ± 1.644.02 ± 1.2685.905.56 ± 1.524.31 ± 1.8177.520.0820.261
Mo2.52 ± 1.751.87 ± 1.1374.214.74 ± 2.983.85 ± 1.9181.210.0170.008
Cd3.09 ± 0.582.52 ± 0.6981.553.43 ± 0.723.06 ± 1.0489.230.0440.047
Co0.99 ± 0.420.72 ± 0.2772.730.82 ± 0.350.55 ± 0.2367.070.0130.029
Hg0.02 ± 0.020.01 ± 0.0250.000.03 ± 0.020.02 ± 0.0166.671.5882.863

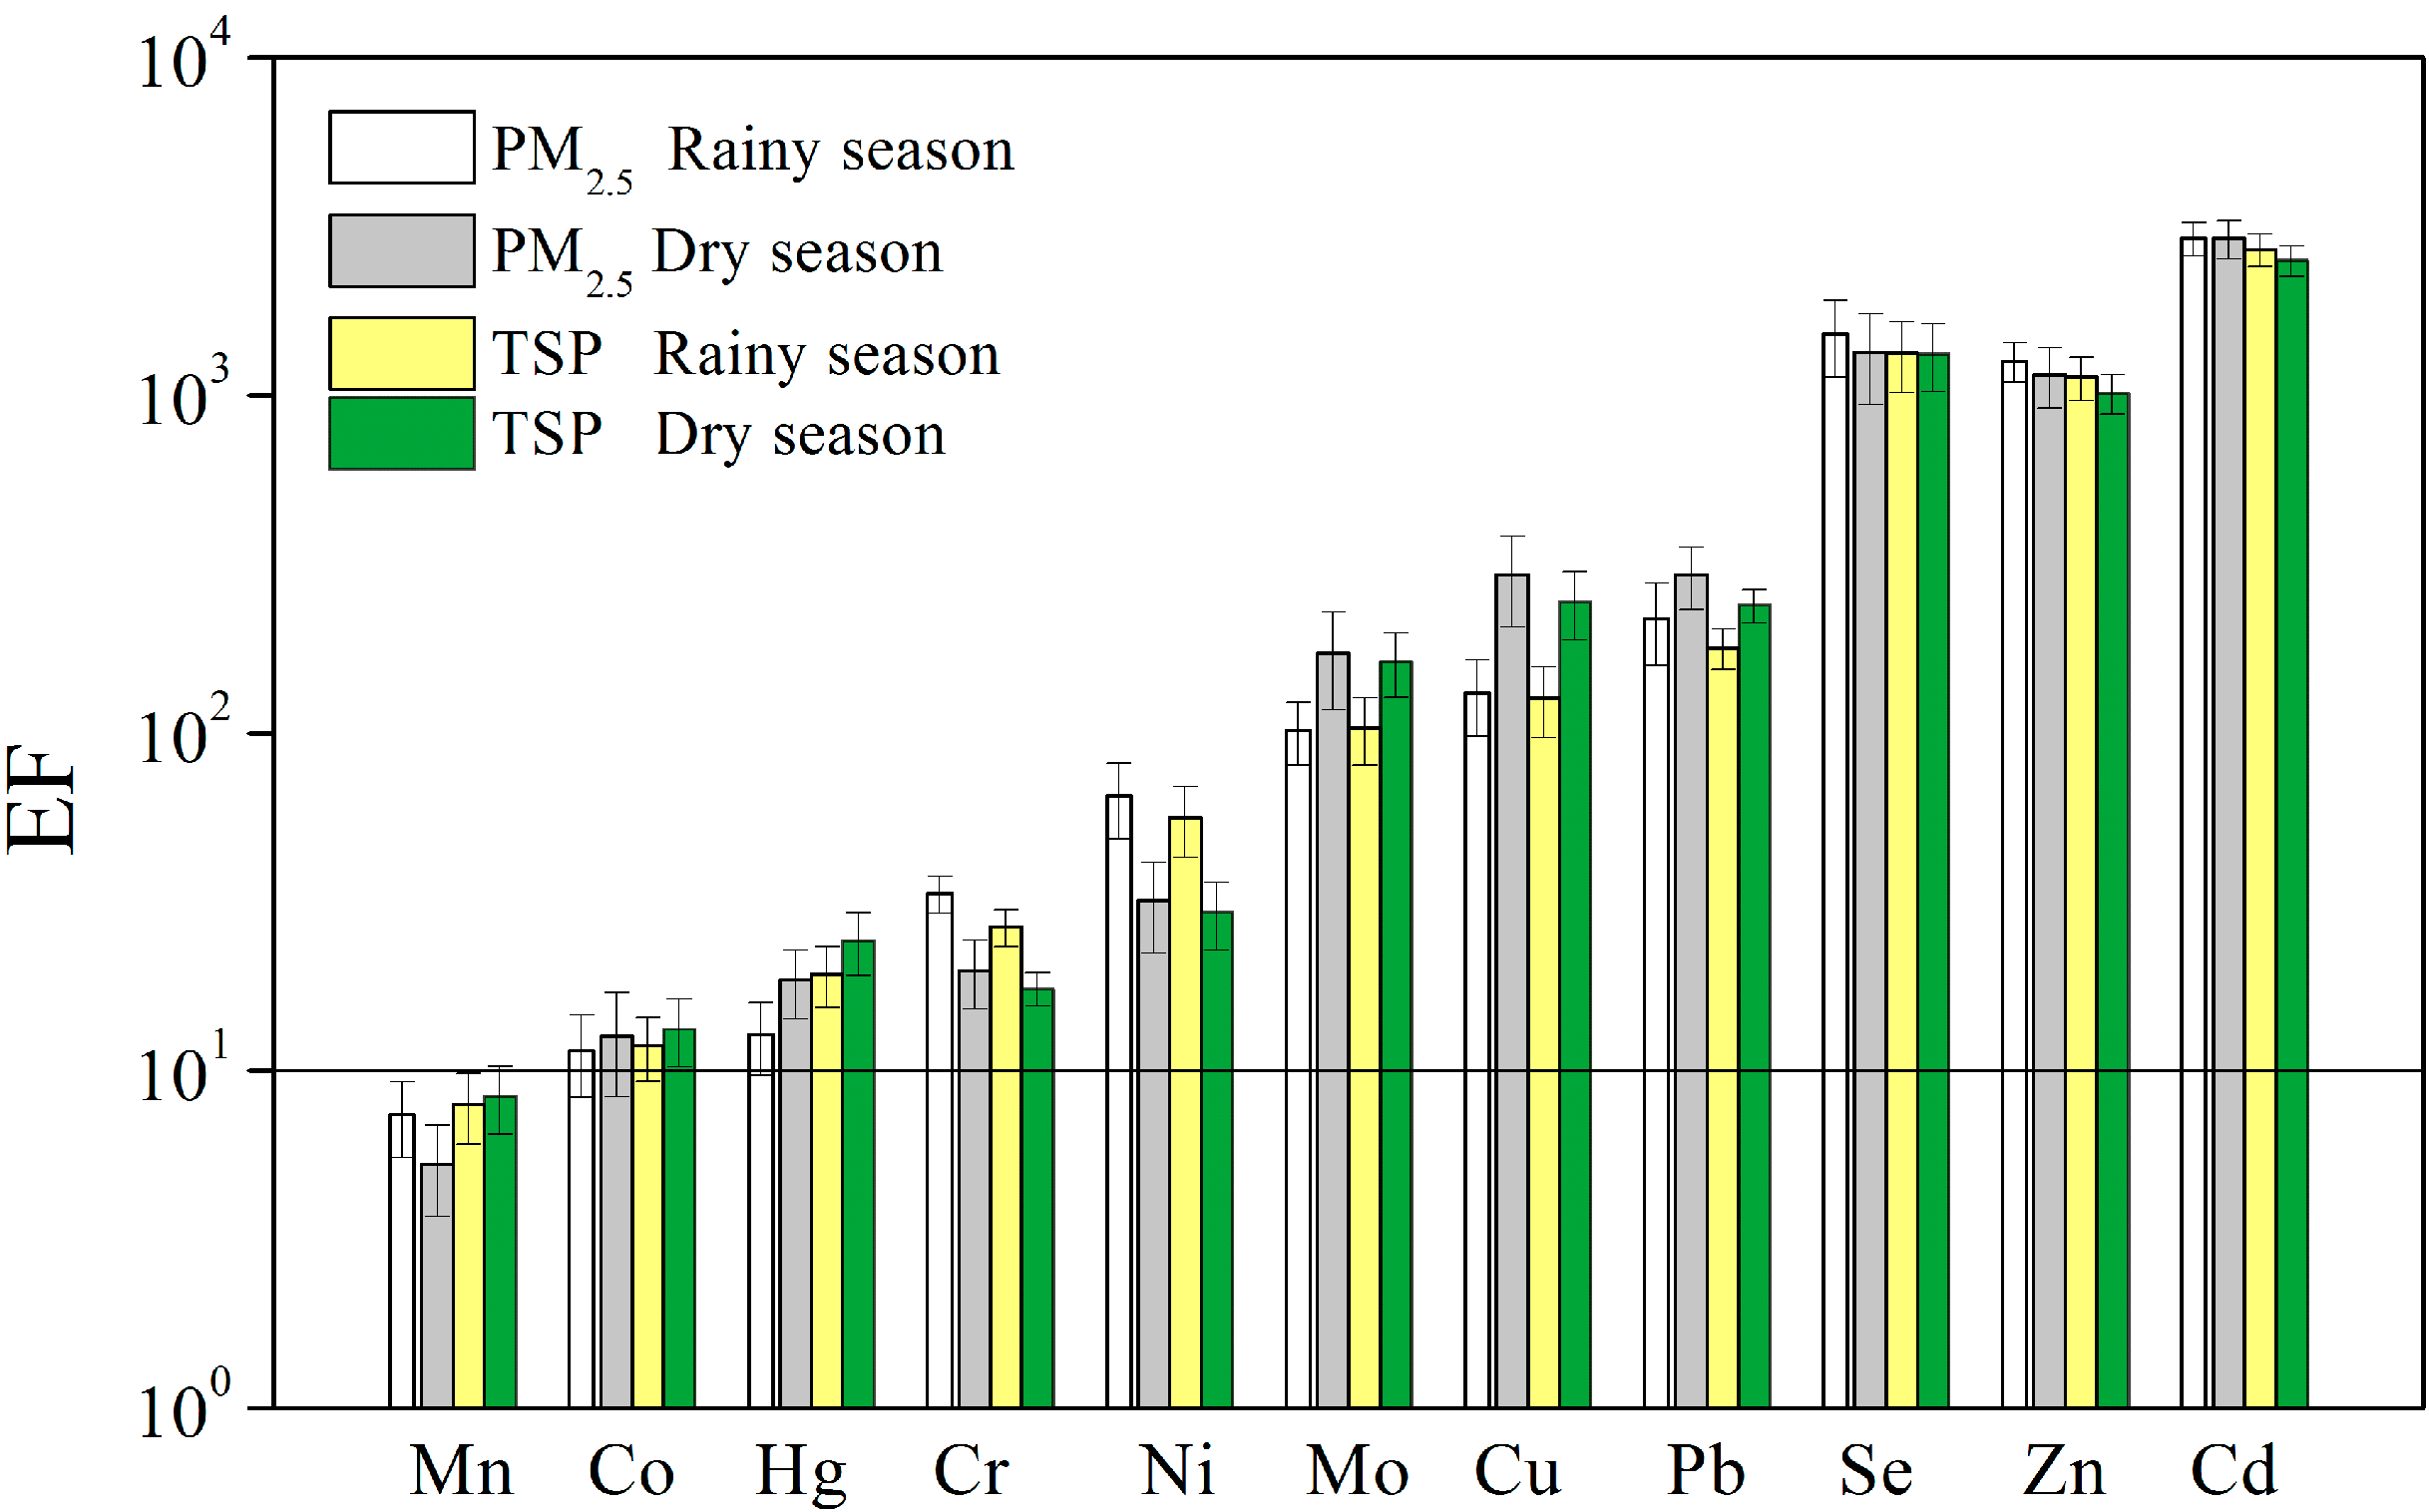
2.3. Enrichment Factors Analysis

The crustal enrichment factors (EFs), defined as:
E F X = ( C X / C REF ) aerosol ( C X / C REF ) soil
could be used to distinguish the crustal and the anthropogenic origins of elements detected in the aerosols [33]. Here, Cx is the concentration of a specific element and CREF is the concentration of an element known to be of crustal origin. Generally, the reference element could be Si, Al, or Fe for crustal particles in the calculation of EFs based on the crustal chemical composition provided [35]. In this study, the average upper-crust concentration of Al reported for Guangdong province [36] was selected for the evaluation of EFs. According to Cesari et al. [35], when the average upper-crust composition from literature data was used, an element with an EF less than 10 was likely of crustal origin, and likely of anthropogenic origin if the value was higher than 20. An element with an EF between 10 and 20 could be considered of mixed origins [35]. The enrichment factors of each element in the aerosols from Dafushan forest park between the rainy and dry seasons were presented in Figure 1.
Cadmium, Se and Zn had the highest EFs (>1000) in the PM2.5 and TSP samples, followed by Cu, Pb and Mo (>100) and Co, Cr, Hg and Ni (ranged from 10 to 99). Manganese had the lowest EF (<10). The metals with high EFs implied that their dominant source was anthropogenic emissions. Notably, the metals (Cd, Cu, Mo and Se) with high EFs (50–10,000) and low concentrations might imply a none-crustal origin. The relatively high concentration but considerably low EF (<10) of Mn indicated its crustal origin both in the TSP and the PM2.5. The results agreed well with the metal origins in urban residential, roadside and hospital areas at Guangzhou [18,28]. The EFs did not differ significantly between the seasons, which might be due to the synchronous seasonal variation of the reference element (Al).
Figure 1. Enrichment factors of the metals in PM2.5 and TSP sampled in dry and rainy seasons. The ANOVA test showed there were no significant differences between the seasons.
Atmosphere 05 00775 g001

2.4. Sources Identification Using PCA

Principal component analysis (PCA) with Varimax rotation was frequently used to determine the sources of metals in PM samples [13,35,37]. According to Henry et al. [38], the minimum number of samples (N) required to obtain a statistically stable PCA analysis was N > 30 + 0.5 × (V + 3), where V is the number of species considered. In addition, the signal-to-noise ratios (S/N) of the different species should be evaluated prior to the analysis [37,38]. Further, only elements with more than 60% of values higher than the LOD should be considered [39]. The dataset used in this work satisfied these limits and all variable included in the PCA were strong (S/N greater than 2 [40]), and all the metal concentrations were higher than the LOD.
In our dataset, three components were individuated that explained more than 80% of the variance of the PM2.5 and TSP. The matrix of loads (after rotation) was shown in Table 3 (only loads with absolute values greater than 0.3 were listed) together with the variance explained by each component and the commonality of each species. For the PM2.5, PC1 had high loading for Co, Mo, Hg, Ni, Cu, and Se, which explained 65.3% of the total variance. This factor might be associated with a mixed contribution of coal and oil combustion (Se and Ni), waste incinerators (Mo, Co, Cd, and Hg) and traffic-related emissions (Cu, Cr, and Ni) [14,16,41,42,43,44]. Thus, PC1 could be a mixed source from industrial activities and traffic-related emissions. PC2 explained 12.8% of the total variance with high loading on Pb, Se, and Cd, which represented traffic-related sources [45]. PC3 explained 7.4% of the total variance with high loading on Al and Mn, indicating a soil dust contribution [16].
Table 3. Rotated factor loading of trace metals in PM2.5 and TSP during sampled periods in Dafushan forest park. The principal components loading with absolute values greater than 0.3 were listed.
VariablePM2.5TSP
PC1PC2PC3PC1PC2PC3
Al 0.860.79−0.48
Cd0.740.53−0.320.750.45
Co0.94 −0.340.86
Cr0.58 0.78 −0.35
Cu0.86−0.38 0.65 0.51
Hg0.88 0.77−0.46
Mn0.46 0.630.96
Mo0.89 0.79−0.37
Ni0.86 0.30 0.77
Pb0.580.71 0.560.74
Se0.770.54 0.810.43
Zn0.75−0.41 0.720.530.41
% of variance65.312.87.458.314.510.6
Cumulative65.378.185.558.372.883.4
Main sourcesIndustry& TrafficTrafficSoil dustIndustry& Soil dustTrafficIndustry
For the TSP, the PCA results demonstrated three components accounting for 83.4% of the variance. The first component (PC1) explained approximately 58% of the total variance and was loaded with Al, Cd, Co, Cr, Cu, Hg, Mn, Mo, Ni, and Se, which indicated the likely sources of metals in the TSP were waste incinerators (Cd, Co, Hg, Mo, and Se), oil combustion (Cr and Ni) and crustal origin (Al and Mn) [9,35,43,44]. Thus, this factor could be associated with a mixed contribution from industry and soil dust origin. The second component (PC2) with high loading on Pb and Zn explained approximately 15% of the total variance and could be associated with traffic emissions. The third component (PC3) had relevant loads for Cu and Ni and explained 10.6% of the total variance. This factor could represent industrial emissions. In the present study, the PCA results showed that the used receptor model was unable to separate the sources affecting the measurement site. This was likely related to the limited number of metals used in the analysis. However, researchers that have used few metals in a PCA have still been able to identify the possible sources of these metals in aerosols [40,43].

3. Materials and Methods
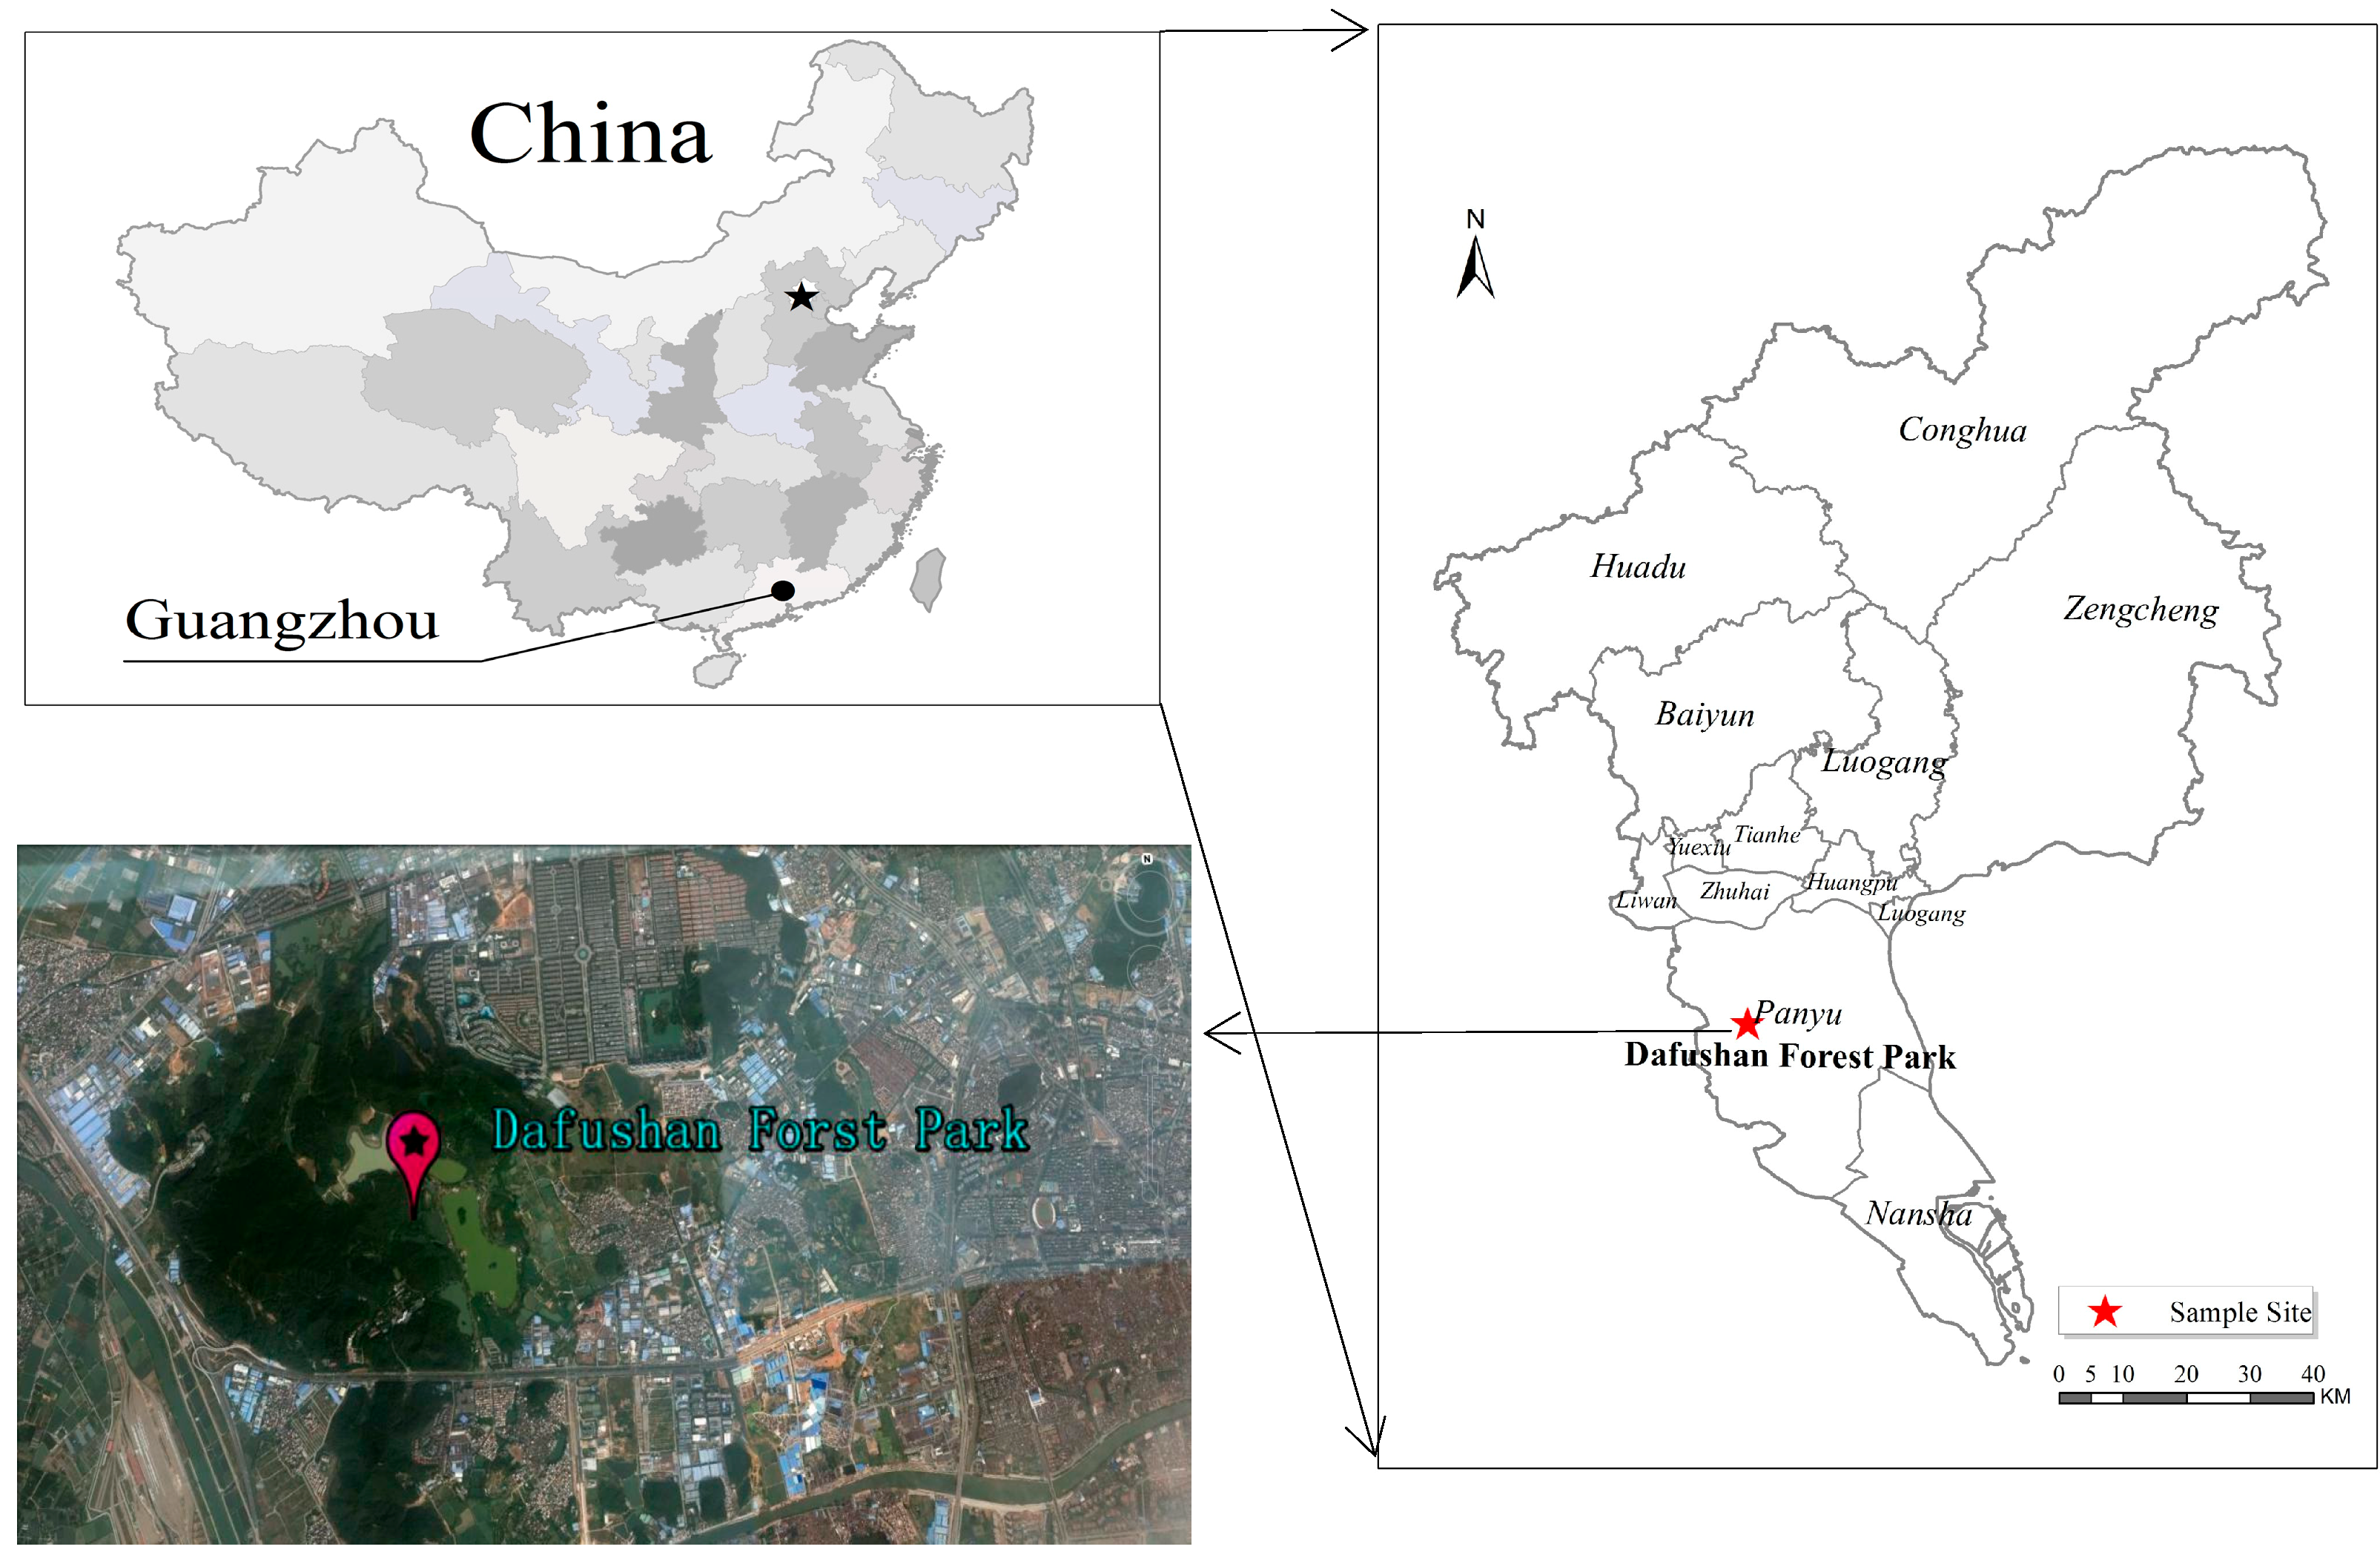
3.1. Sampling Site

Dafushan urban forest park is located in southern Guangzhou, Guangdong province (22°57′N–22°58′N, 113°17′E–113°18.8′E) (Figure 2) and was one of the venues for the 2010 Asian games. The park contains approximately 600 hm2 of forest vegetation and attracts more than one million visitors annually. Guangzhou is characterized by a subtropical climate with a mean annual rainfall of 1700 mm distributed seasonally, with approximately 80% falling in the rainy season (from April to September) and approximately 20% in the dry season (from October to March). The meteorological data for Dafushan forest park were listed in Table 4 [26]. In the rainy season, the prevailing wind from the south brings clean air from the Pacific Ocean and South China Ocean, while in the dry season, the prevailing wind from the north brings air from the inland area of China. There are no high buildings, factories or point-sources of contamination in this park; however, there are municipal traffic, residential and commercial activities around the park.
Figure 2. Locations of Dafushan forest park in Guangzhou.
Atmosphere 05 00775 g002
Table 4. Meteorological data for Dafushan forest park from 2008 to 2013 [26].
SeasonPrecipitation (mm)Diurnal Relative Humidity (%)Diurnal Air Temperature (°C)
MeanMax.Min.MeanMax.Min.MeanMax.Min.
Rainy season1383.41516.81296.288.398.840.625.135.311.6
Dry season315.3370.4281.761.295.618.317.428.11.8

3.2. Sample Collection

Continuous 24-h TSP and PM2.5 samples were simultaneously collected using separate air samplers located at a height of 1.5 m above ground. To minimize the impact of vegetation or the forest canopy on the aerosols and the metal contents, and to obtain overall levels of air quality in this park, the instruments were placed at the open sites in the forest park and kept as far away as possible from the trees. The aerosol samples were trapped on the quartz-fiber (tare weighted before sampling) attached to the hopper of a moderate-volume sampler (TH 150-III, Wuhan, China) operating at a flow rate of 100 L∙min−1. Aerosols were collected 3 times per month according to the Forestry Standards “Observation Methodology for Long-term Forest Ecosystem Research” of China [46]. The total number of PM2.5 and TSP samples collected during the monitoring period from January 2012 to December 2013 was 72 (for each). Prior to sampling, the quartz-fiber, including the bank filters, were pre-heated in a muffle furnace at 600 °C for 3 h to remove the volatile components. After sampling, the filters were stored in a dessicator at a constant temperature (22 ± 0.5 °C) for 48 h and then re-weighed using a precision balance (Mettler Toledo Inc., Greifensee, Switzerland) to determine the mass of TSP and PM2.5, respectively. Each filter was weighed at least three times, and the net mass was obtained by subtracting the pre-sampling weight from the post-sampling weight. The differences between replicate weights were less than 10 and 20 μg for the blanks and the samples, respectively. After weighting, the samples were stored in a freezer at −18 °C until to analysis to limit losses of volatile components.

3.3. Chemical Analyses

To quantify the concentrations of metals (Al, Cd, Co, Cr, Cu, Hg, Mn, Mo, Ni, Pb, Se, and Zn) in the TSP and PM2.5, the filters were separately digested referring to the method of Lee et al. [34] and the national standards of PR China (GB/T 1526-94) for the determination of aerosol metal contents [47]. One half of each filter was soaked in a mixture of 10 mL of concentrated HNO3 and H2O2 (v:v = 1:1) for 2 h and then heated to boiling for 10 min. After cooling down, the solution was added to 10 mL of H2O2 and heated until almost dry. Subsequently, 20 mL of diluted HNO3 (with a concentration of 1%) was added and boiled for 10 min. The solution was then diluted with 1% HNO3, poured into 50-mL volumetric flasks and finally filtered through polyethersulfone (PES) membrane filters (pore size: 0.45 µm, diameter: 13 mm; Membrana GmbH, Wuppertal, Germany). The blank filters were treated in a similar manner. The metal concentrations in the digestion solutions were measured using an inductively coupled plasma-mass spectrometer (ICP-MS, Angilent 7500cx, Tokyo, Japan). The limit of detection (LOD) for each metal was determined by measuring the signal to noise ratios. A signal to noise ratio of three was used to estimate the LOD. The LOD was 3.595 ng∙m−3 for Al, Cu and Zn, 0.013 ng∙m−3 for Cd, Co and Mo, 0.396 ng∙m−3 for Cr and Pb, 0.03 ng∙m−3 for Mn and Ni, 0.001 and 0.495 ng∙m−3 for Hg and Se, respectively. The experimental quality was controlled using blank filters and standard reference materials (US National Institute of Standards and Technology [NIST] standard reference materials (SRM 1648) Urban Particulate Matter, Gaithersburg, MD, USA). Five replicates of the standard SRM 1648 resulted in a minor recovery of 95.5% for Cu and a maximum recovery of 117% for Ni.

3.4. Statistical Analysis

A comparison of the PM and metal concentrations (mean and standard deviation, mean ± SD) between the rainy and dry seasons was performed using one-way analysis of variance (ANOVA). Principal component analysis (PCA), a well-established method for aerosol analysis, was used to analyze the main sources of metals in the aerosols [39]. A PCA with Varimax rotation, which was performed using the software package SPSS (SPSS 17.0 for Windows, SPSS Inc., Chicago, IL, USA), was applied to the matrix of loads. Only the principal components with eigenvalues larger than 1.0 (before rotation) were retained for subsequent analysis and only the principal components with absolute loading values greater than 0.3 were considered [39].

4. Conclusions

The results of this case study revealed that Dafushan urban forest park at Guangzhou was polluted by PM2.5 rather than by TSP. The contents of both the PM2.5 and TSP were significantly higher in the dry season than in the rainy season. Aluminum, Zn, and Pb were the most abundant while Hg was the least abundant metals in the aerosols. Concentrations of Cd, Cu, Hg, Mn, Mo, Pb, and Zn in the TSP and PM2.5 were significantly higher in the dry season compared with the rainy season. The metals were predominant in the finer particles. The crustal enrichment factors implied that Cd, Cu, Mo, Pb, Se, and Zn in the aerosols in the forest park had anthropogenic sources, while Al and Mn were mainly of crustal origin. Results from the PCA implied that industrial activities, traffic-related emissions, and soil dust were the main possible sources of the metals in the PM2.5 and TSP in Dafushan forest park.

Acknowledgments

This research was jointly funded by the Forestry Public Welfare Project of China (No. 20130430106), the Special Research Program of the Research Institute for Tropical Forestry, CAF (No. RITFYWZX201104), the Program of Forest Ecological Benefits Monitoring Network in Guangzhou (2014–2015), and CFERN & GENE Award Funds on Ecological Paper. We are very grateful for the support from the Pearl River Delta Forest Ecosystem Research Station.

Author Contributions

Fu-chun Tong, Shi-rong Liu, Yuan-wen Kuang, Bu-feng Chen and Yue-dong Guo were all involved in conceptualizing, designing, and implementing the project; Yi-hua Xiao performed the experiments. All data collected and drafted the manuscript by Yi-hua Xiao and Yuan-wen Kuang.

Conflicts of Interest

The authors declare no conflict of interest.

References

  1. Espinosa, A.J.F.; Rodríguez, M.T.; Barragán de la Rosa, F.J.; Jiménez Sánchez, J.C. Size distribution of metals in urban aerosols in Seville (Spain). Atmos. Environ. 2001, 35, 2595–2601. [Google Scholar] [CrossRef]
  2. Pope, C.A.; Dockery, D.W. Health effects of fine particulate air pollution: Lines that connect. J. Air Waste Manag. Assoc. 2006, 56, 709–742. [Google Scholar] [CrossRef] [PubMed]
  3. Contini, D.; Cesari, D.; Donateo, A.; Chirizzi, D.; Belosi, F. Characterization of PM10 and PM2.5 and their metals content in different typologies of sites in South-Eastern Italy. Atmosphere 2014, 5, 435–453. [Google Scholar] [CrossRef]
  4. Duan, J.C.; Tan, J. Atmospheric heavy metals and arsenic in China: Situation, sources and control policies. Atmos. Environ. 2013, 74, 93–101. [Google Scholar] [CrossRef]
  5. Tao, J.; Ho, K.F.; Chen, L.G.; Zhu, L.H.; Han, J.L.; Xu, Z.C. Effect of chemical composition of PM2.5 on visibility in Guangzhou, China, 2007 spring. Particuology 2009, 7, 68–75. [Google Scholar] [CrossRef]
  6. Gralton, J.; Tovey, E.R.; McLaws, M.L.; Rawlinson, W.D. Respiratory virus RNA is detectable in airborne and droplet particles. J. Med. Virol. 2013, 85, 2151–2159. [Google Scholar] [PubMed]
  7. He, K.M.; Wang, S.Q.; Zhang, J.L. Blood lead levels of children and its trend in China. Sci. Total Environ. 2009, 407, 3986–3993. [Google Scholar] [CrossRef] [PubMed]
  8. Bollati, V.; Marinelli, B.; Apostoli, P.; Bonzini, M.; Nordio, F.; Hoxha, M.; Pegoraro, V.; Motta, V.; Tarantini, L.; Cantone, L.; et al. Exposure to metal-rich particulate matter modifies the expression of candidate microRNAs in peripheral blood leukocytes. Environ. Health Perspect. 2010, 118, 763–768. [Google Scholar] [CrossRef] [PubMed]
  9. Zabalza, J.; Ogulei, D.; Hopke, P.K.; Lee, J.H.; Hwang, I.; Querol, X.; Alastuey, A.S.; SantamarÃa, J.S. Concentration and sources of PM10 and its constituents in Alsasua, Spain. Water Air Soil Pollut. 2006, 174, 385–404. [Google Scholar] [CrossRef]
  10. Zheng, N.; Liu, J.S.; Wang, Q.C.; Liang, Z.Z. Health risk assessment of heavy metal exposure to street dust in the zinc smelting district, northeast of China. Sci. Total. Environ. 2010, 408, 726–733. [Google Scholar] [CrossRef] [PubMed]
  11. Tian, H.Z.; Wang, Y.; Xue, Z.G.; Cheng, K.; Qu, Y.P.; Chai, F.H. Trend and characteristics of atmospheric emissions of Hg, As, and Se from coal combustion in China, 1980–2007. Atmos. Chem. Phys. 2010, 10, 11905–11919. [Google Scholar] [CrossRef] [Green Version]
  12. El-Fadel, M.; Hashisho, Z. Vehicular emissions in roadway tunnels: A critical review. Crit. Rev. Environ. Sci. Technol. 2001, 31, 125–174. [Google Scholar] [CrossRef]
  13. Kothai, P.; Saradhi, I.V.; Prathibha, P.; Hopke, P.K.; Pandit, G.G.; Puranik, V.D. Source apportionment of coarse and fine particulate matter at Navi Mumbai, India. Aerosol. Air Qual. Res. 2008, 8, 423–436. [Google Scholar]
  14. Chang, S.H.; Wang, K.S.; Chang, H.F.; Ni, W.W.; Wu, B.J.; Wong, R.H.; Lee, H.S. Comparison of source identification of metals in road-dust and soil. Soil Sediment Contam. 2009, 18, 669–683. [Google Scholar] [CrossRef]
  15. Fang, G.C.; Chang, C.N.; Wu, Y.S.; Wang, V.; Fu, P.P.C.; Yang, D.G.; Chen, S.C.; Chu, C.C. The study of fine and coarse particles, and metallic elements for the daytime and night-time in a suburban area of central Taiwan, Taichung. Chemosphere 2000, 41, 639–644. [Google Scholar] [CrossRef] [PubMed]
  16. Fang, G.C.; Wu, Y.S.; Chang, S.Y.; Huang, S.H.; Rau, J.Y. Size Distributions of ambient air particles and enrichment factor analyses of metallic elements at Taichung Harbor near the Taiwan Strait. Atmos. Res. 2006, 81, 320–333. [Google Scholar] [CrossRef]
  17. Duan, J.C.; Tan, J.H.; Cheng, D.X.; Bi, X.H.; Deng, W.J.; Sheng, G.Y.; Fu, J.M.; Wong, M.H. Sources and characteristics of carbonaceous aerosol in two largest cities in Pearl River Delta Region, China. Atmos. Environ. 2007, 41, 2895–2903. [Google Scholar] [CrossRef]
  18. Wang, X.H.; Bi, X.H.; Sheng, G.Y.; Fu, J.M. Hospital indoor PM10/PM2.5 and associated trace elements in Guangzhou, China. Sci. Total. Environ. 2006, 366, 124–135. [Google Scholar] [CrossRef] [PubMed]
  19. Cao, J.J.; Shen, Z.X.; Chow, J.C.; Watson, J.G.; Lee, S.C.; Tie, X.X.; Ho, K.F.; Wang, G.H.; Han, Y.M. Winter and summer PM2.5 chemical compositions in fourteen Chinese cities. J. Air Waste Manag. 2012, 62, 1214–1226. [Google Scholar] [CrossRef]
  20. Niu, L.L.; Ye, H.J.; Xu, C.; Yao, Y.J.; Liu, W.P. Highly time- and size-resolved fingerprint analysis and risk assessment of airborne elements in a megacity in the Yangtze River Delta, China. Chemosphere 2015, 119, 112–121. [Google Scholar] [CrossRef]
  21. Zhao, P.S.; Dong, F.; He, D.; Zhao, X.J.; Zhang, X.L.; Zhang, W.Z.; Yao, Q.; Liu, H.Y. Characteristics of concentrations and chemical compositions for PM2.5 in the region of Beijing, Tianjin, and Hebei, China. Atmos. Chem. Phys. 2013, 13, 4631–4644. [Google Scholar] [CrossRef]
  22. Li, L.; Wang, W.; Feng, J.; Zhang, D.; Li, H.; Gu, Z.P.; Wang, B.J.; Sheng, G.Y.; Fu, J.M. Composition, source, mass closure of PM2.5 aerosols for four forests in eastern China. J. Environ. Sci. 2010, 22, 405–412. [Google Scholar] [CrossRef]
  23. Li, S.N.; Lu, S.W.; Pan, Q.H.; Zhang, Y.P.; Chen, B.; Yang, X.Y. Research on the eco-purification function of urban forests in Beijing. J. Food Agric. Environ. 2013, 11, 1247–1254. [Google Scholar]
  24. Sun, F.B.; Yin, Z.; Lun, X.X.; Zhao, Y.; Li, R.N.; Shi, F.T.; Yu, X.X. Deposition velocity of PM2.5 in the winter and spring above deciduous and coniferous forests in Beijing, China. PLoS One 2014. [Google Scholar] [CrossRef]
  25. Statistical Bureau of Guangdong Province. Guangdong Year Book (1950–2012); Guangdong Publishing House: Guangzhou, China, 2013. (In Chinese)
  26. Xiao, Y.H.; Chen, B.F.; Su, J.; Yu, R.; Pan, Y.J.; Shi, X.; Chen, J. Variations of air pollutant concentrations and their evaluation in Dafushan forest park, a case in Guangzhou. J. Chin. Urban For. 2010, 8, 43–45. (In Chinese) [Google Scholar]
  27. Ministry of Environmental Protection. Ambient Air Quality Standards (GB 3095-1996). 2012. Available online: http://kjs.mep.gov.cn/hjbhbz/bzwb/dqhjbh/dqhjzlbz/201203/W020120302359392037286.pdf (accessed on 29 August 2014). (In Chinese) [Google Scholar]
  28. Huang, H.; Lee, S.C.; Cao, J.J.; Zou, C.W.; Chen, X.G.; Fan, S.J. Characteristics of indoor/outdoor PM2.5 and elemental components in generic urban, roadside and industrial plant areas of Guangzhou city, China. J. Environ. Sci. 2007, 19, 35–43. [Google Scholar] [CrossRef]
  29. Maenhaut, W.; Raes, N.; Chi, X.G.; Cafmeyer, J.; Wang, W. Chemical composition and mass closure for PM2.5 and PM10 aerosols at K-puszta, Hungary, in summer 2006. X-ray Spectrom. 2008, 37, 193–197. [Google Scholar] [CrossRef]
  30. Hock, N.; Schneider, J.; Borrmann, S.; Rompp, A.; Moortgat, G.; Franze, T.; Schauer, C.; Pöschl, U.; Plass-Dülmer, C.; Berresheim, H. Rural continental aerosol properties and processes observed during the Hohenpeissenberg Aerosol Characterization Experiment (HAZE2002). Atmos. Chem. Phys. 2008, 8, 603–623. [Google Scholar] [CrossRef]
  31. Edney, E.O.; Kleindienst, T.E.; Conver, T.S.; McIver, C.D.; Corse, E.W.; Weathers, W.S. Polar organic oxygenates in PM2.5 at a southeastern site in the United States. Atmos. Environ. 2003, 37, 3947–3965. [Google Scholar] [CrossRef]
  32. Pillai, P.S.; Babu, S.S.; Krishna, M.K. A Study of PM, PM10 and PM2.5 concentration at a tropical coastal station. Atmos. Res. 2002, 61, 149–167. [Google Scholar] [CrossRef]
  33. Glavas, S.D.; Nikolakis, P.; Ambatzoglou, D.; Mihalopoulos, N. Factors affecting the seasonal variation of mass and ionic composition of PM2.5 at a central Mediterranean coastal site. Atmos. Environ. 2008, 42, 5365–5373. [Google Scholar] [CrossRef]
  34. Lee, C.S.L.; Li, X.D.; Zhang, G.; Li, J.; Ding, A.J.; Wang, T. Heavy metals and Pb isotopic composition of aerosols in urban and suburban areas of Hong Kong and Guangzhou, south China—Evidence of the long-range transport of air contaminants. Atmos. Environ. 2007, 41, 432–447. [Google Scholar] [CrossRef]
  35. Cesari, D.; Contini, D.; Genga, A.; Siciliano, M.; Elefante, C.; Baglivi, F.; Daniele, L. Analysis of raw soils and their re-suspended PM10 fractions: Characterisation of source profiles and enrichment factors. Appl. Geochem. 2012, 27, 1238–1246. [Google Scholar] [CrossRef]
  36. Soil Census Office of Guangdong province. Guangdong Soil; Science Press: Beijing, China, 1993. (In Chinese) [Google Scholar]
  37. Dongarrà, G.; Manno, E.; Varrica, D.; Voltaggio, M. Mass levels, crustal component and trace elements in PM10 in Palermo, Italy. Atmos. Environ. 2007, 41, 7977–7986. [Google Scholar] [CrossRef]
  38. Henry, R.C.; Lewis, C.W.; Hopke, P.K.; Williamson, H.J. Review of receptor model fundamentals. Atmos. Environ. 1984, 18, 1507–1515. [Google Scholar] [CrossRef]
  39. Contini, D.; Belosi, F.; Gambaro, A.; Cesari, D.; Stortini, A.M.; Bove, M.C. Comparison of PM10 concentrations and metal content in three different sites of the Venice Lagoon: An analysis of possible aerosols sources. J. Environ. Sci. 2012, 24, 1954–1965. [Google Scholar] [CrossRef]
  40. Contini, D.; Genga, A.; Cesari, D.; Siciliano, M.; Donateo, A.; Bove, M.C.; Guascito, M.R. Characterisation and source apportionment of PM10 in an urban background site in Lecce. Atmos. Res. 2010, 95, 40–54. [Google Scholar] [CrossRef]
  41. Baumann, K.; Jayanty, R.K.M.; Flanagan, J.B. Fine particulate matter source apportionment for the chemical speciation trends network site at Birmingham, Alabama, using positive matrix factorization. J. Air Waste Manag. Assoc. 2008, 58, 27–44. [Google Scholar] [CrossRef] [PubMed]
  42. Fung, Y.S.; Wong, L.W.Y. Apportionment of air pollution sources by receptor models in Hong Kong. Atmos. Environ. 1995, 29, 2041–2048. [Google Scholar] [CrossRef]
  43. Stortini, A.M.; Freda, A.; Cesari, D.; Cairns, W.R.L.; Contini, D.; Barbante, C.; Prodi, F.; Cescon, P.; Gambaro, A. An evaluation of the PM2.5 trace elemental composition in the Venice Lagoon area and an analysis of the possible sources. Atmos. Environ. 2009, 43, 6296–6304. [Google Scholar] [CrossRef] [Green Version]
  44. Janssen, N.; van Mansom, D.F.M.; van der Jagt, K.; Harseema, H.; Hoek, G. Mass concentration and elemental composition of airborne particulate matter at street and background locations. Atmos. Environ. 1997, 31, 1185–1193. [Google Scholar] [CrossRef]
  45. Manoli, E.; Voutsa, D.; Samara, C. Chemical characterization and source identification/apportionment of fine and coarse air particles in Thessaloniki, Greece. Atmos. Environ. 2002, 36, 949–961. [Google Scholar] [CrossRef]
  46. “Observation Methodology for Long-term Forest Ecosystem Research” of People’s Republic of China. Available online: http://www.cfern.org/wjpicture/upload/bzgf/bzgf 2011-10-10-8-13-39.pdf (accessed on 29 August 2014). (In Chinese)
  47. Ministry of Environmental Protection. Ambient Air-Determination of Lead-Flame Atomic Absorption Spectrophotometric Method (GB/T 15264-94). 1995. Available online: http://www.shuigongye.com/standard/20096/2009061816220200001.html (accessed on 2 September 2014).

