Flash Drought Characteristics Based on U.S. Drought Monitor
by
L. Gwen Chen
1,2,*, 
Jon Gottschalck
2,
Adam Hartman
2,
David Miskus
2,
Rich Tinker
2 and
Anthony Artusa
2 1
Earth System Science Interdisciplinary Center/Cooperative Institute for Climate and Satellites, University of Maryland, College Park, MD 20740, USA
2
Climate Prediction Center, NCEP/NWS/NOAA, College Park, MD 20740, USA
*
Author to whom correspondence should be addressed.
Atmosphere 2019, 10(9), 498; https://doi.org/10.3390/atmos10090498
Submission received: 25 July 2019
/
Revised: 20 August 2019
/
Accepted: 24 August 2019
/
Published: 27 August 2019
(This article belongs to the Special Issue Meteorological and Hydrological Droughts)
Abstract
:Understanding the characteristics of flash drought events and further predicting the onset of such events on subseasonal timescales is of critical importance for impact assessment, disaster mitigation, and loss prevention. In this study, we employ a rate-of-change approach and define a flash drought event as a drought event with greater than or equal to two categories degradation in a four-week period based on the U.S. Drought Monitor. Unlike conventional drought, which can occur year-round and everywhere in the United States, flash drought has preferred seasons and locations to occur, mostly in the warm season and over the central United States. Widespread flash drought over the United States is largely correlated with La Niña episodes. In contrast with conventional drought, which is mainly driven by precipitation deficits, anomalously high evapotranspiration rates, caused by anomalously high temperatures, winds, and/or incoming radiation, are usually present before the onset of flash drought. Comparing to precipitation and soil moisture, evapotranspiration typically has the largest decline rate during the fast-development phase. Three-month Standardized Precipitation Indexes are mostly dry right before flash drought onset, but large deficits are not required. As a result, monitoring rapid changes in evapotranspiration, along with precipitation and soil moisture conditions, can provide early warnings of flash drought development.
1. Introduction
Drought can develop and intensify in a short period of time and result in major agricultural losses if it is not predicted and detected in a timely manner. Such phenomena were noted in the early 2000s when the U.S. Drought Monitor (USDM) [1] was inaugurated, and they were termed “flash drought” by USDM authors. In summer 2012, widespread areas over the central Great Plains experienced greater than three categories drought intensification over a two-month period, causing major agricultural and crop losses in the American heartland [2]. The inflation-adjusted cost of this flash drought is estimated to exceed $30 billion across the nation [3]. The sudden onset of this drought and its devastating impacts have led to an increasing awareness of flash drought and quests for more research and understanding.
Early research of flash drought is focused on the meteorological and hydrological conditions leading to flash drought development. For example, Hunt et al. (2009) [4] developed a soil moisture index to monitor soil water stress in the top 50 cm soil layer for flash drought alerts. Mo and Lettenmaier (2015 and 2016) [5,6] identified two types of flash drought, namely heat wave flash drought and precipitation deficit flash drought, based on precipitation (P), temperature (T), evapotranspiration (ET), and/or soil moisture (SM) conditions. Another topic of research is focused on changes in evaporative stress and its relation to flash drought development. For instance, Otkin et al. (2013) [7] examined the sudden onset of drought using a satellite-derived drought index, and further developed the Rapid Change Index to highlight areas undergoing quick changes in moisture stress [8]. More recently, Christian et al. (2019) [9] presented a methodology to identify flash drought using Standardized Evaporative Stress Ratio (SESR) values and changes in SESR over some period. U.S. Geological Survey, in collaboration with the National Drought Mitigation Center (NDMC) and others, also released a new operational product—Quick Drought Response Index (QuickDRI)—to provide early detection of flash drought (available at https://quickdri.unl.edu/). QuickDRI is a short-term drought index that combines multiple input data of P, SM, ET, vegetation health, and landscape characteristics to indicate anomalously dry or wet conditions over the past four weeks. Otkin et al. (2018) [10] provided a comprehensive review of flash drought literature to date.
At the National Oceanic and Atmospheric Administration’s Climate Prediction Center (NOAA/CPC), a primary responsibility is to monitor and predict drought by issuing official weekly USDM (every Tuesday), Seasonal Drought Outlook (SDO; in the middle of the month), and Monthly Drought Outlook (MDO; at the end of the month). The 2017 Northern Plains Flash Drought [11,12] caught forecasters off guard and the April MDO and SDO did not verify well. In order to improve our understanding of flash drought and hence better forecast its onset, we carry out a climatological analysis by examining fast-developing drought events identified from USDM. This approach is different from the approach used by Christian et al. (2019) [9] or QuickDRI. Our goal is to provide a pertinent reference directly aligned with CPC’s work. In this study, we define a flash drought event as a drought event with greater than or equal to two categories degradation in a four-week period based on USDM. Our objectives are to (1) summarize the characteristics of flash drought events, including when and where these events occur, (2) assess antecedent conditions of these events prior to drought intensification, and (3) identify potential natural precursors for flash drought prediction.
In the following, Section 2 describes the USDM and North American Land Data Assimilation System (NLDAS) data used in the study; Section 3 presents the analysis on the frequency of occurrence for both flash drought and conventional drought; Section 4 discusses the relation between flash drought coverage and the El Niño–Southern Oscillation (ENSO); Section 5 examines the antecedent conditions and evolution of five selected flash droughts; Section 6 carries out composite analysis of flash drought events; and finally, Section 7 summarizes the major findings and conclusions from the investigation.
2. Data
2.1. U.S. Drought Monitor (USDM)
The U.S. Drought Monitor is a joint effort by NOAA’s CPC and National Centers for Environmental Information, NDMC at the University of Nebraska–Lincoln, and the United States Department of Agriculture. USDM maps are produced weekly through expert synthesis of various data sources, including precipitation, soil moisture, streamflow, snow water equivalent and snowpack, crop and vegetation conditions, and reservoir and groundwater levels. These data sources are coupled with inputs from local, state, regional, and federal levels (e.g., local impact reports) to depict short- and long-term drought conditions. USDM is officially released on a Thursday morning and includes data up through 12Z the previous Tuesday morning. Svoboda et al. (2002) [1] provided an extensive overview of the production process of USDM maps. On USDM maps, drought conditions are classified into five categories: D0 (abnormally dry), D1 (moderate drought), D2 (severe drought), D3 (extreme drought), and D4 (exceptional drought). USDM maps contain valuable information of drought occurrence, severity, and extent, and are used by U.S. government agencies for official drought declarations. The original USDM maps are created in ArcGIS shapefile format. In order to use USDM as a data source for numerical analysis, we rasterized USDM maps into gridded outputs with 1/8 degree resolution, covering the contiguous United States (CONUS). For each grid point, we assigned a numerical value of 0, 1, 2, 3, or 4 in correspondence to the D0, D1, D2, D3, and D4 categories. For areas with no drought, we assigned the grid points with a value of −1. In this study, we used the USDM maps from 4 January 2000 to 26 December 2017 on every Tuesday (939 maps in total).
2.2. Phase 2 of the North American Land Data Assimilation System (NLDAS-2)
Because long-term, in situ measurements of soil moisture and evapotranspiration are either unavailable or limited in areal coverage, model-simulated data are often used as a proxy for observations [13]. In this study, we use P, T at 2 m, ET, total column SM, and total surface runoff (R) data from the Phase 2 of NLDAS (NLDAS-2) to examine meteorological and hydrological conditions prior to rapid drought intensification and in the evolution of drought. In NLDAS-2, different land surface models are forced by hourly precipitation, radiation, and low-level winds to produce land surface states and fluxes at a horizontal resolution of 1/8 degree [14,15]. The P forcing is derived from CPC’s gauge-based precipitation analysis [16] and the atmospheric forcing (temperature, radiation, etc.) is obtained from the North American Regional Reanalysis [17]. NLDAS-2 consists of four land surface models running uncoupled: (1) The NOAH model [18]; (2) NASA’s Mosaic model [19,20]; (3) the Variable Infiltration Capacity (VIC) model [21,22]; and (4) the Sacramento SAC model [23,24]. In this study, we use the ET, SM, and R data from the VIC model. The strategy of using the VIC model outputs permits alignment with the CFSv2_VIC forecast system developed at CPC by Mo et al. (2012) [25], which will be used in subsequent research for flash drought prediction. The hourly NLDAS-2 outputs were aggregated to daily data from 00Z to 00Z for the analyses, and the rasterized USDM data were mapped to the NLDAS-2 grid system to be consistent.
3. Frequency of Occurrence
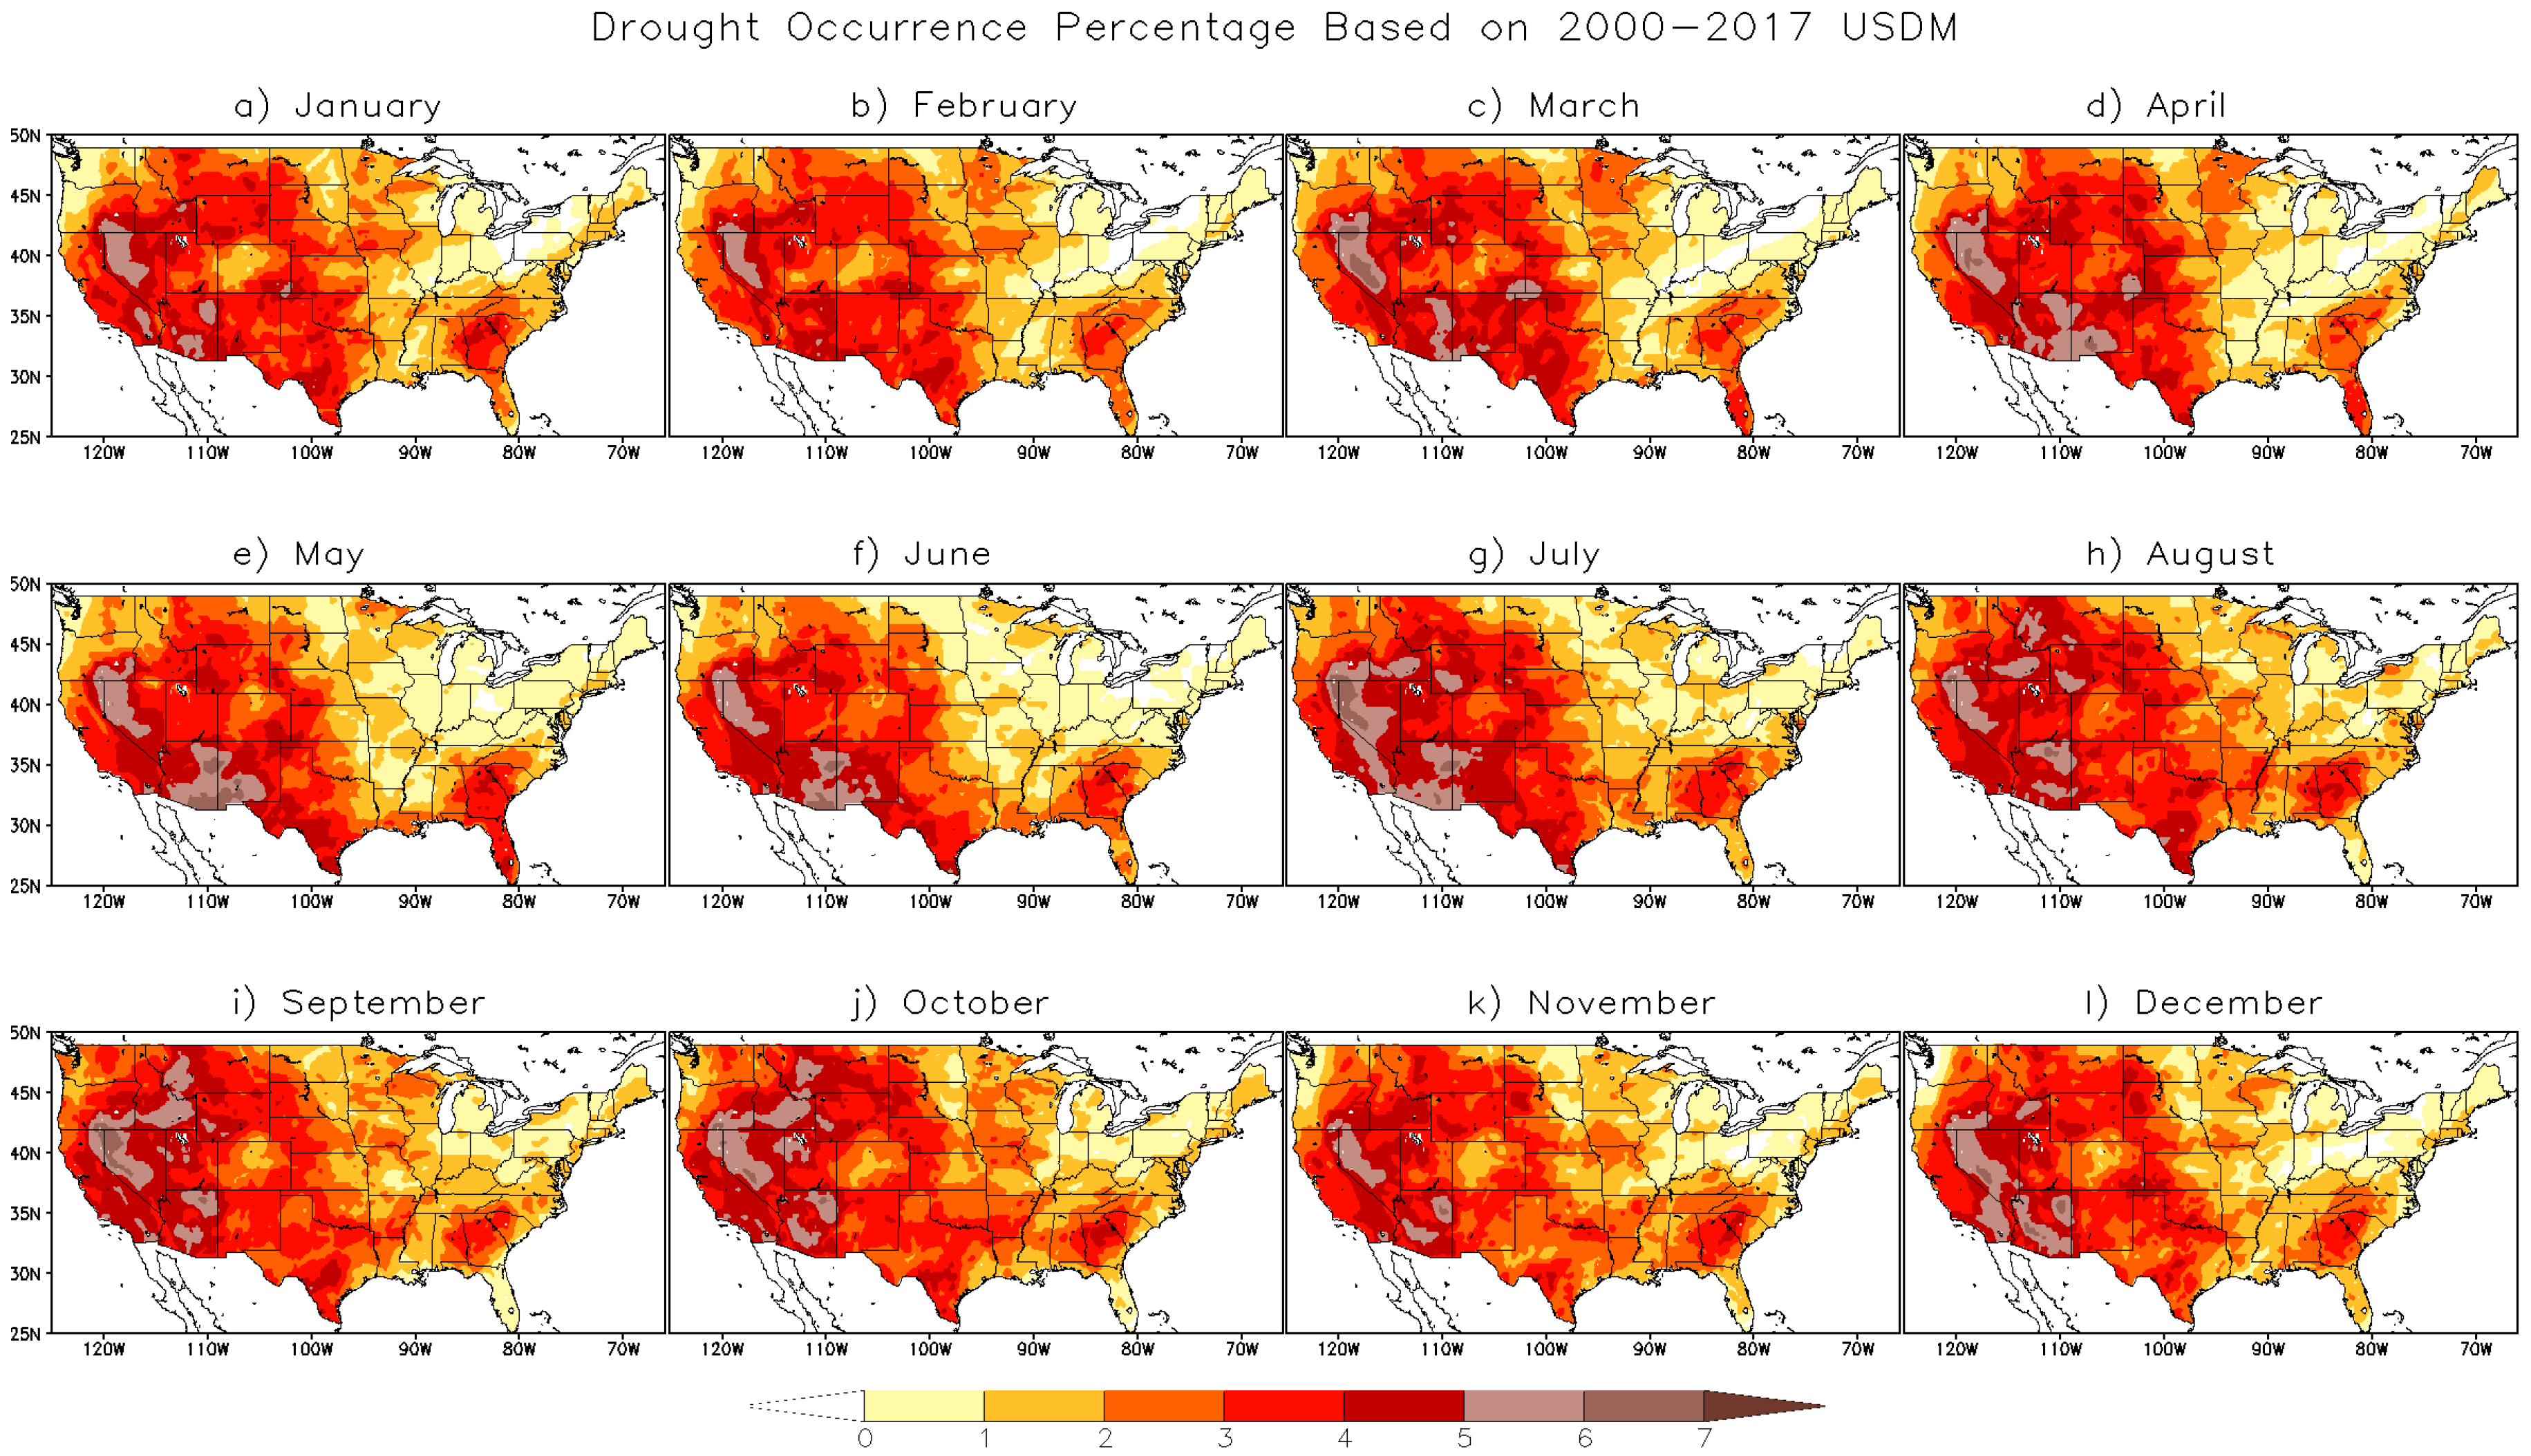
To improve our understanding of flash droughts (i.e., when and where these events occur), we examine their frequency of occurrence using historical USDM data. In this analysis, we first compute the occurrence frequency for all drought events. A drought event is defined as an event with drought category of D1, D2, D3, or D4 on a USDM map. At each grid point, the number of drought events is counted for each month based on the issued dates of USDM, and then the percentage is calculated by dividing the number of drought events by the total number of USDM maps. Figure 1 shows the maps of drought occurrence frequency (in percentage) based on the rasterized 2000–2017 USDM data (sample size of 939) for all 12 months. Drought can occur year-round and everywhere in the United States. However, some regions, such as Nevada, Arizona, and southern California, are more prone to drought than others, and drought occurrence is largely dependent on geographical location. In the maps, an east–west contrast is observed for all months, indicating that the western United States are more vulnerable to drought. Due to the slowly evolving nature of drought, there are small variations among seasons. Yet, a slight increase in drought occurrence appears over the central and southern United States during the warm season, implying that temperature (T) or its related quantities (e.g., ET) may play a role in drought manifestation in summertime.
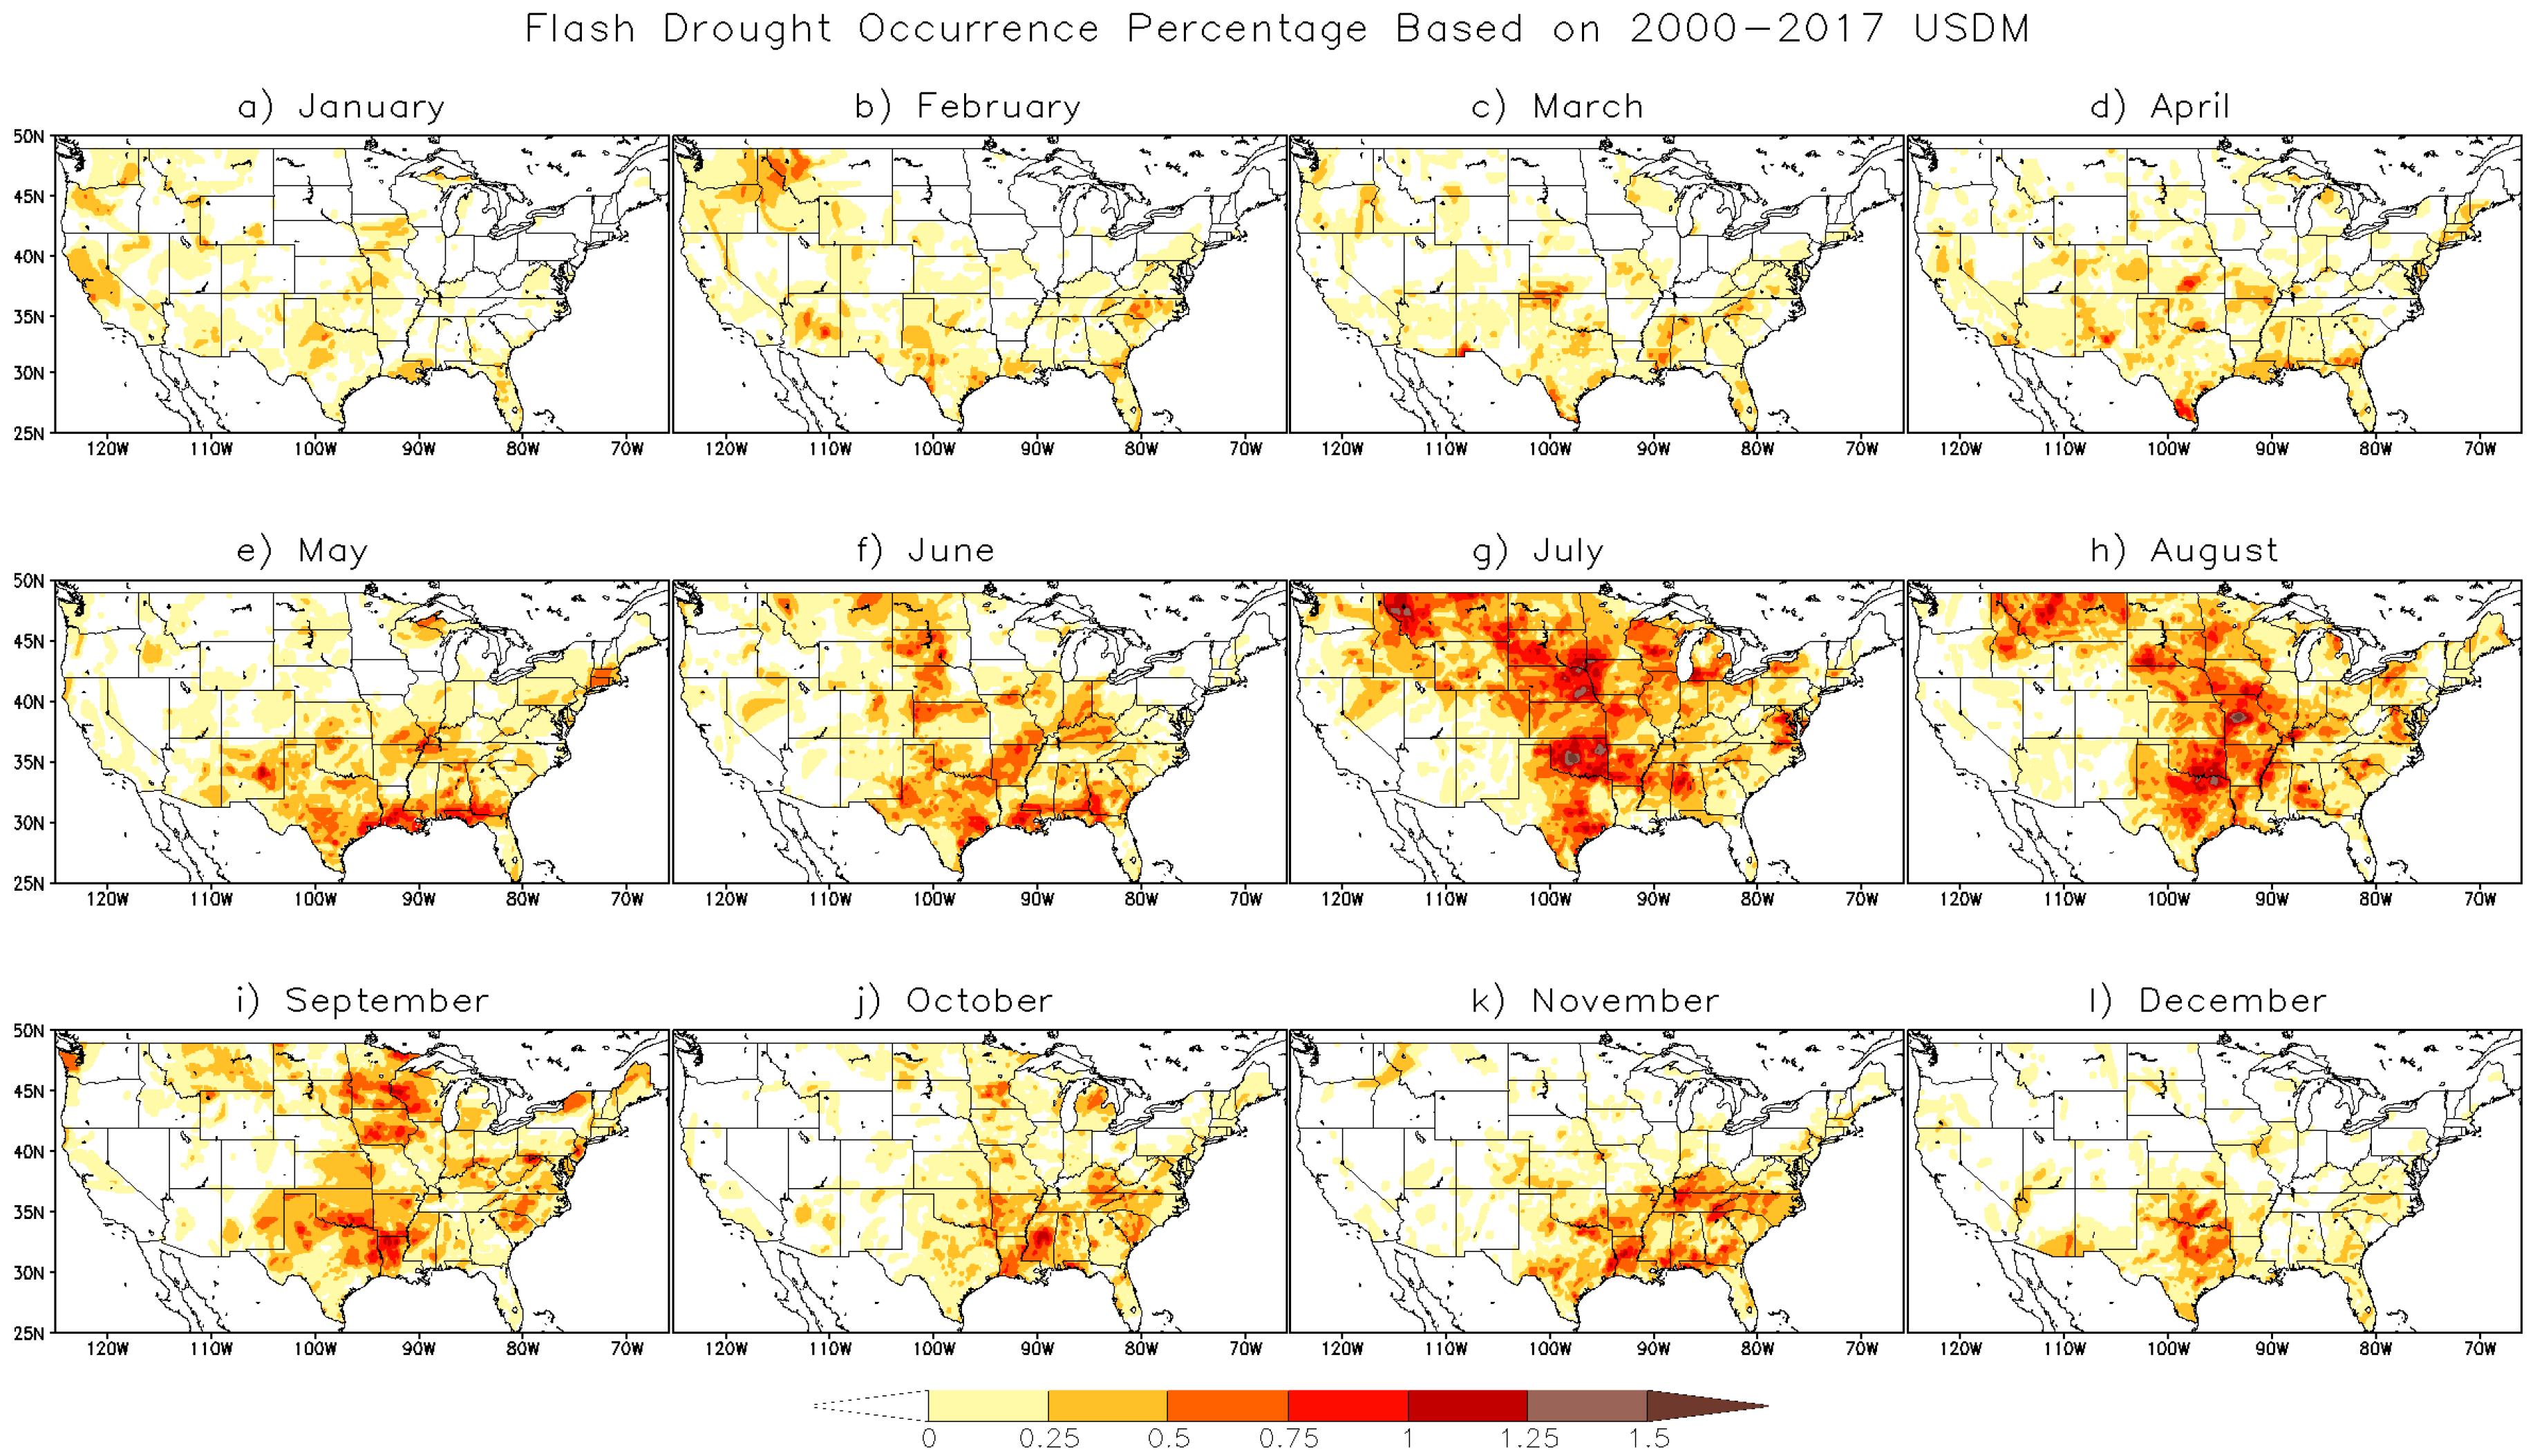
Figure 2 presents the maps of flash drought occurrence frequency (in percentage) for all 12 months. In this analysis, a flash drought event is defined as a drought event with greater than or equal to two categories degradation in a four-week period based on USDM, and each event is labeled with a date the same as the ending date of the four-week period. That is, for a given grid point and a given week, if its drought category on USDM is two or more categories worse than four weeks ago, this drought is identified as a flash drought event. The percentage is calculated in a similar fashion to the frequency of occurrence of all drought events, but with a sample size of 935. Clearly, there are preferred seasons and regions for flash drought to occur. Unlike conventional, slowly evolving drought that can occur year-round, most events occurred in the warm season and over the central United States. This characteristic is very different from conventional drought driven mainly by P deficits, suggesting that different approaches may be needed to predict flash drought.
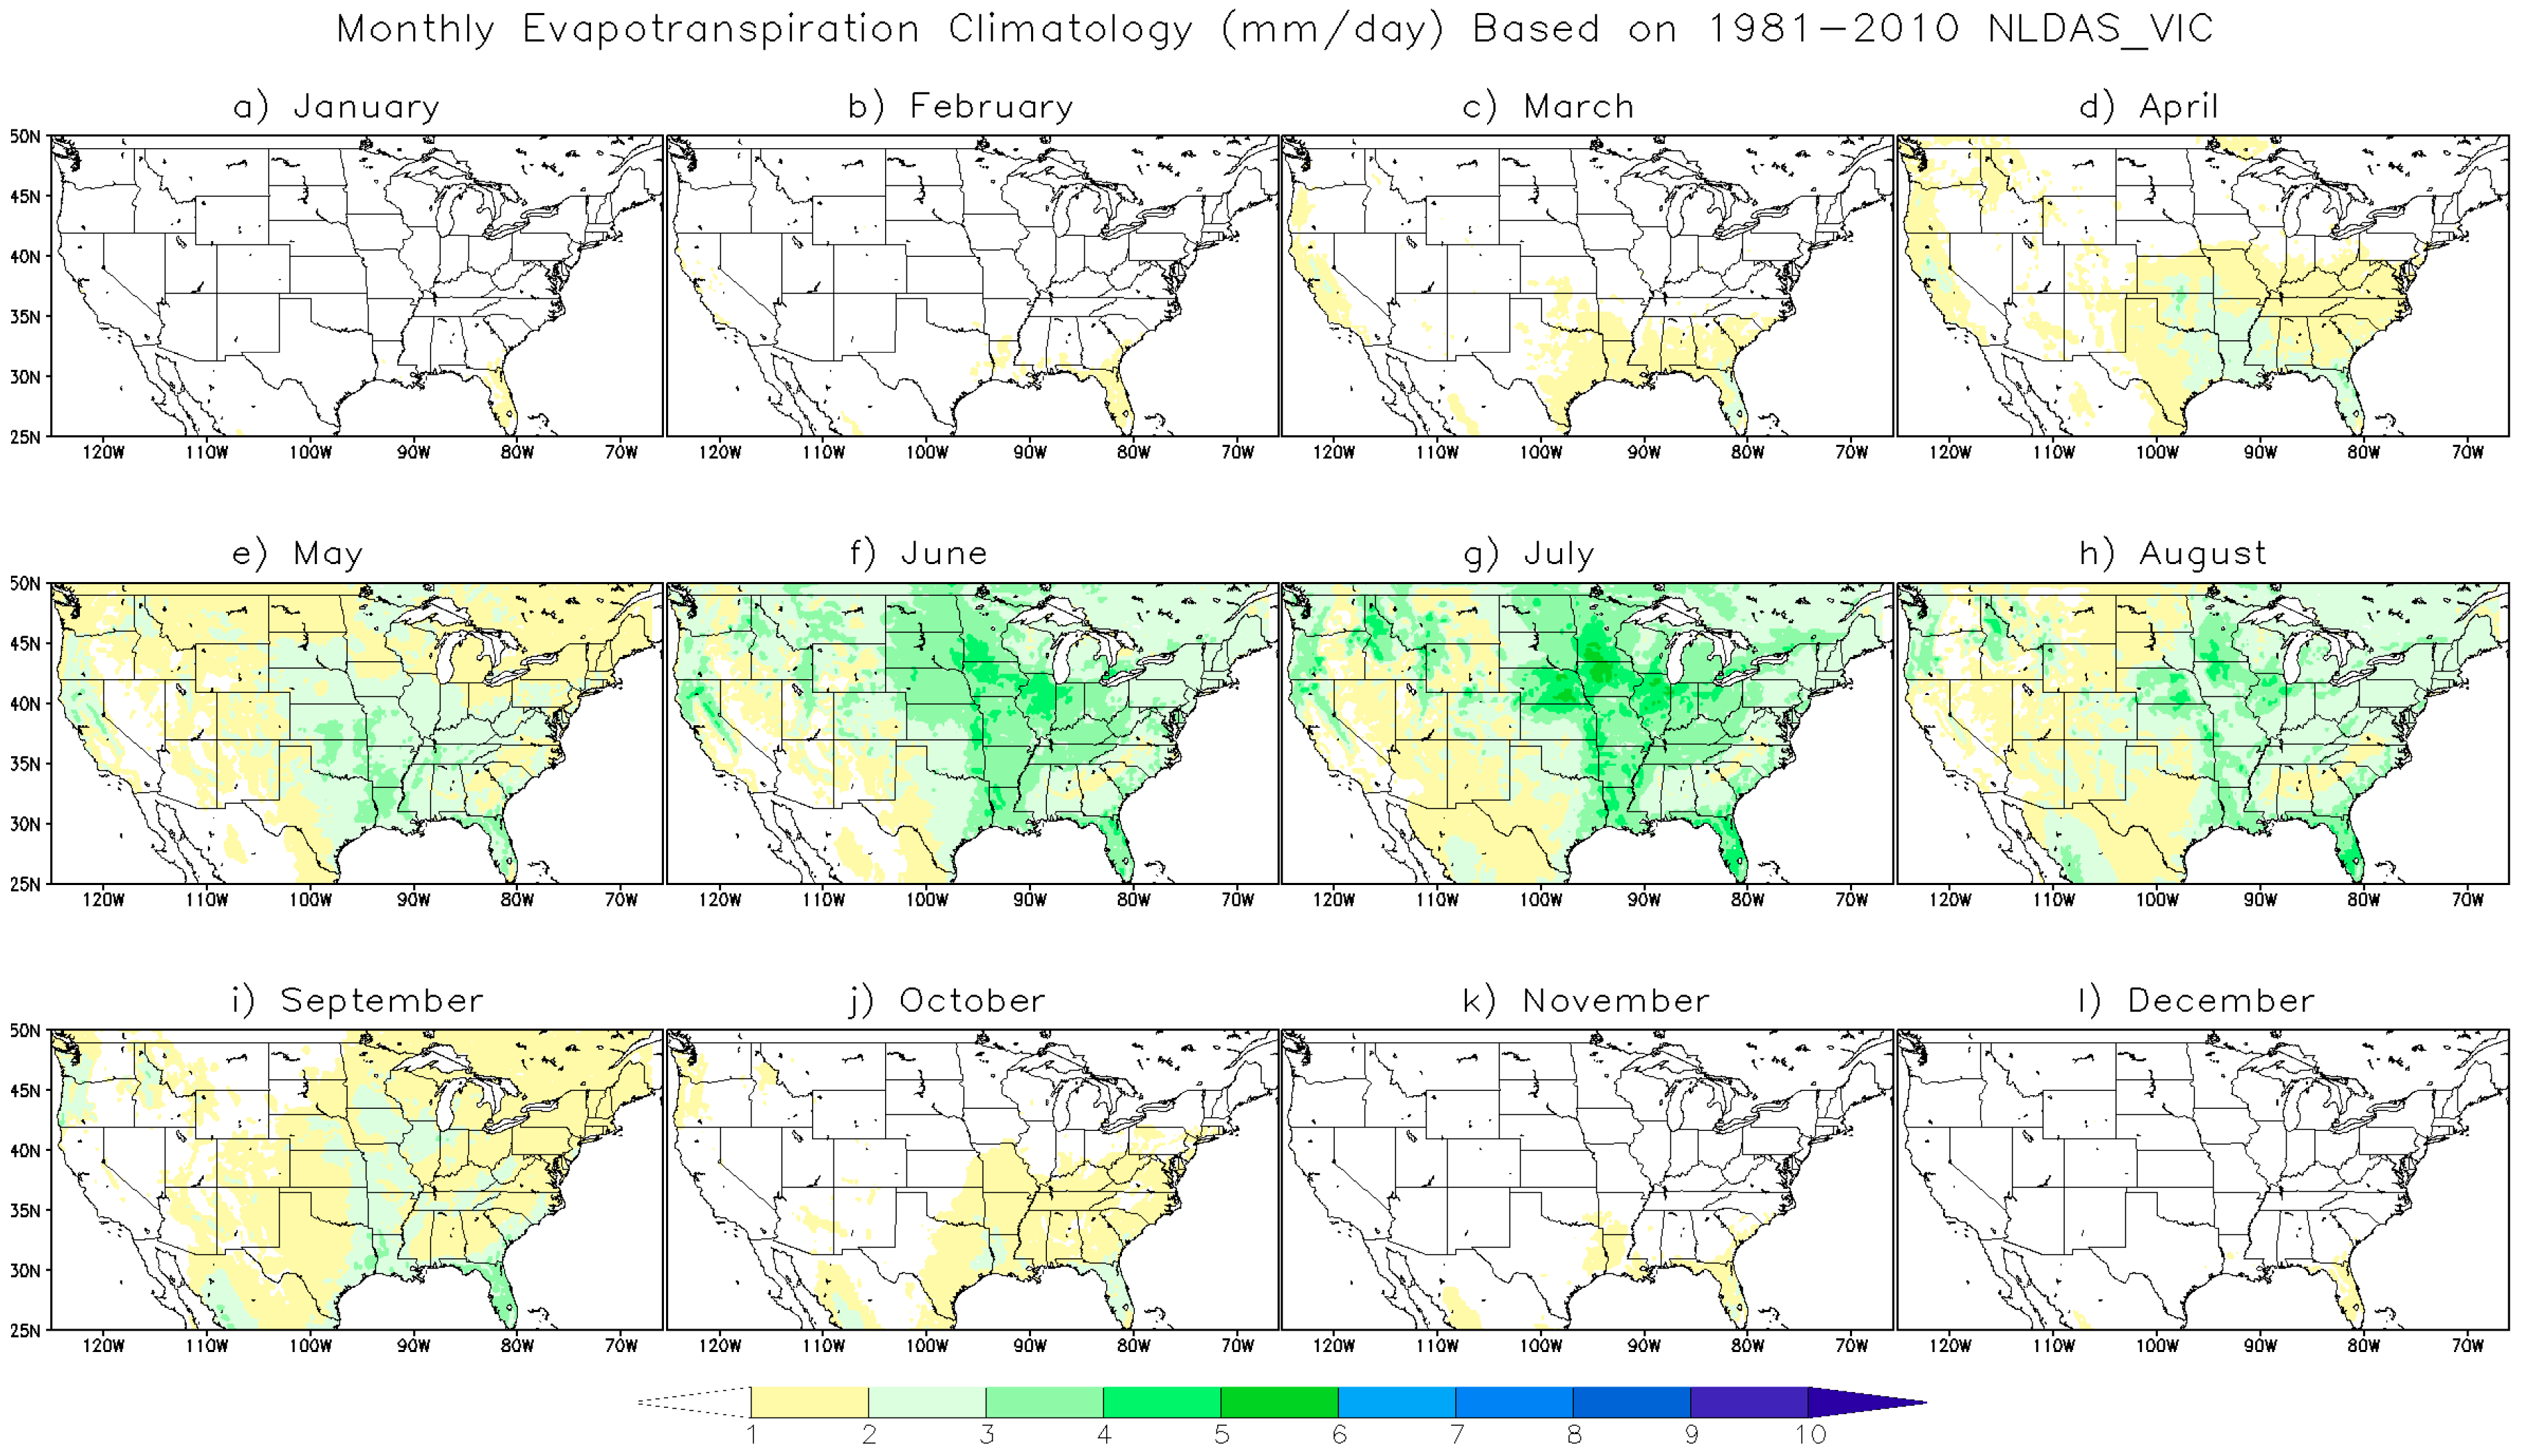
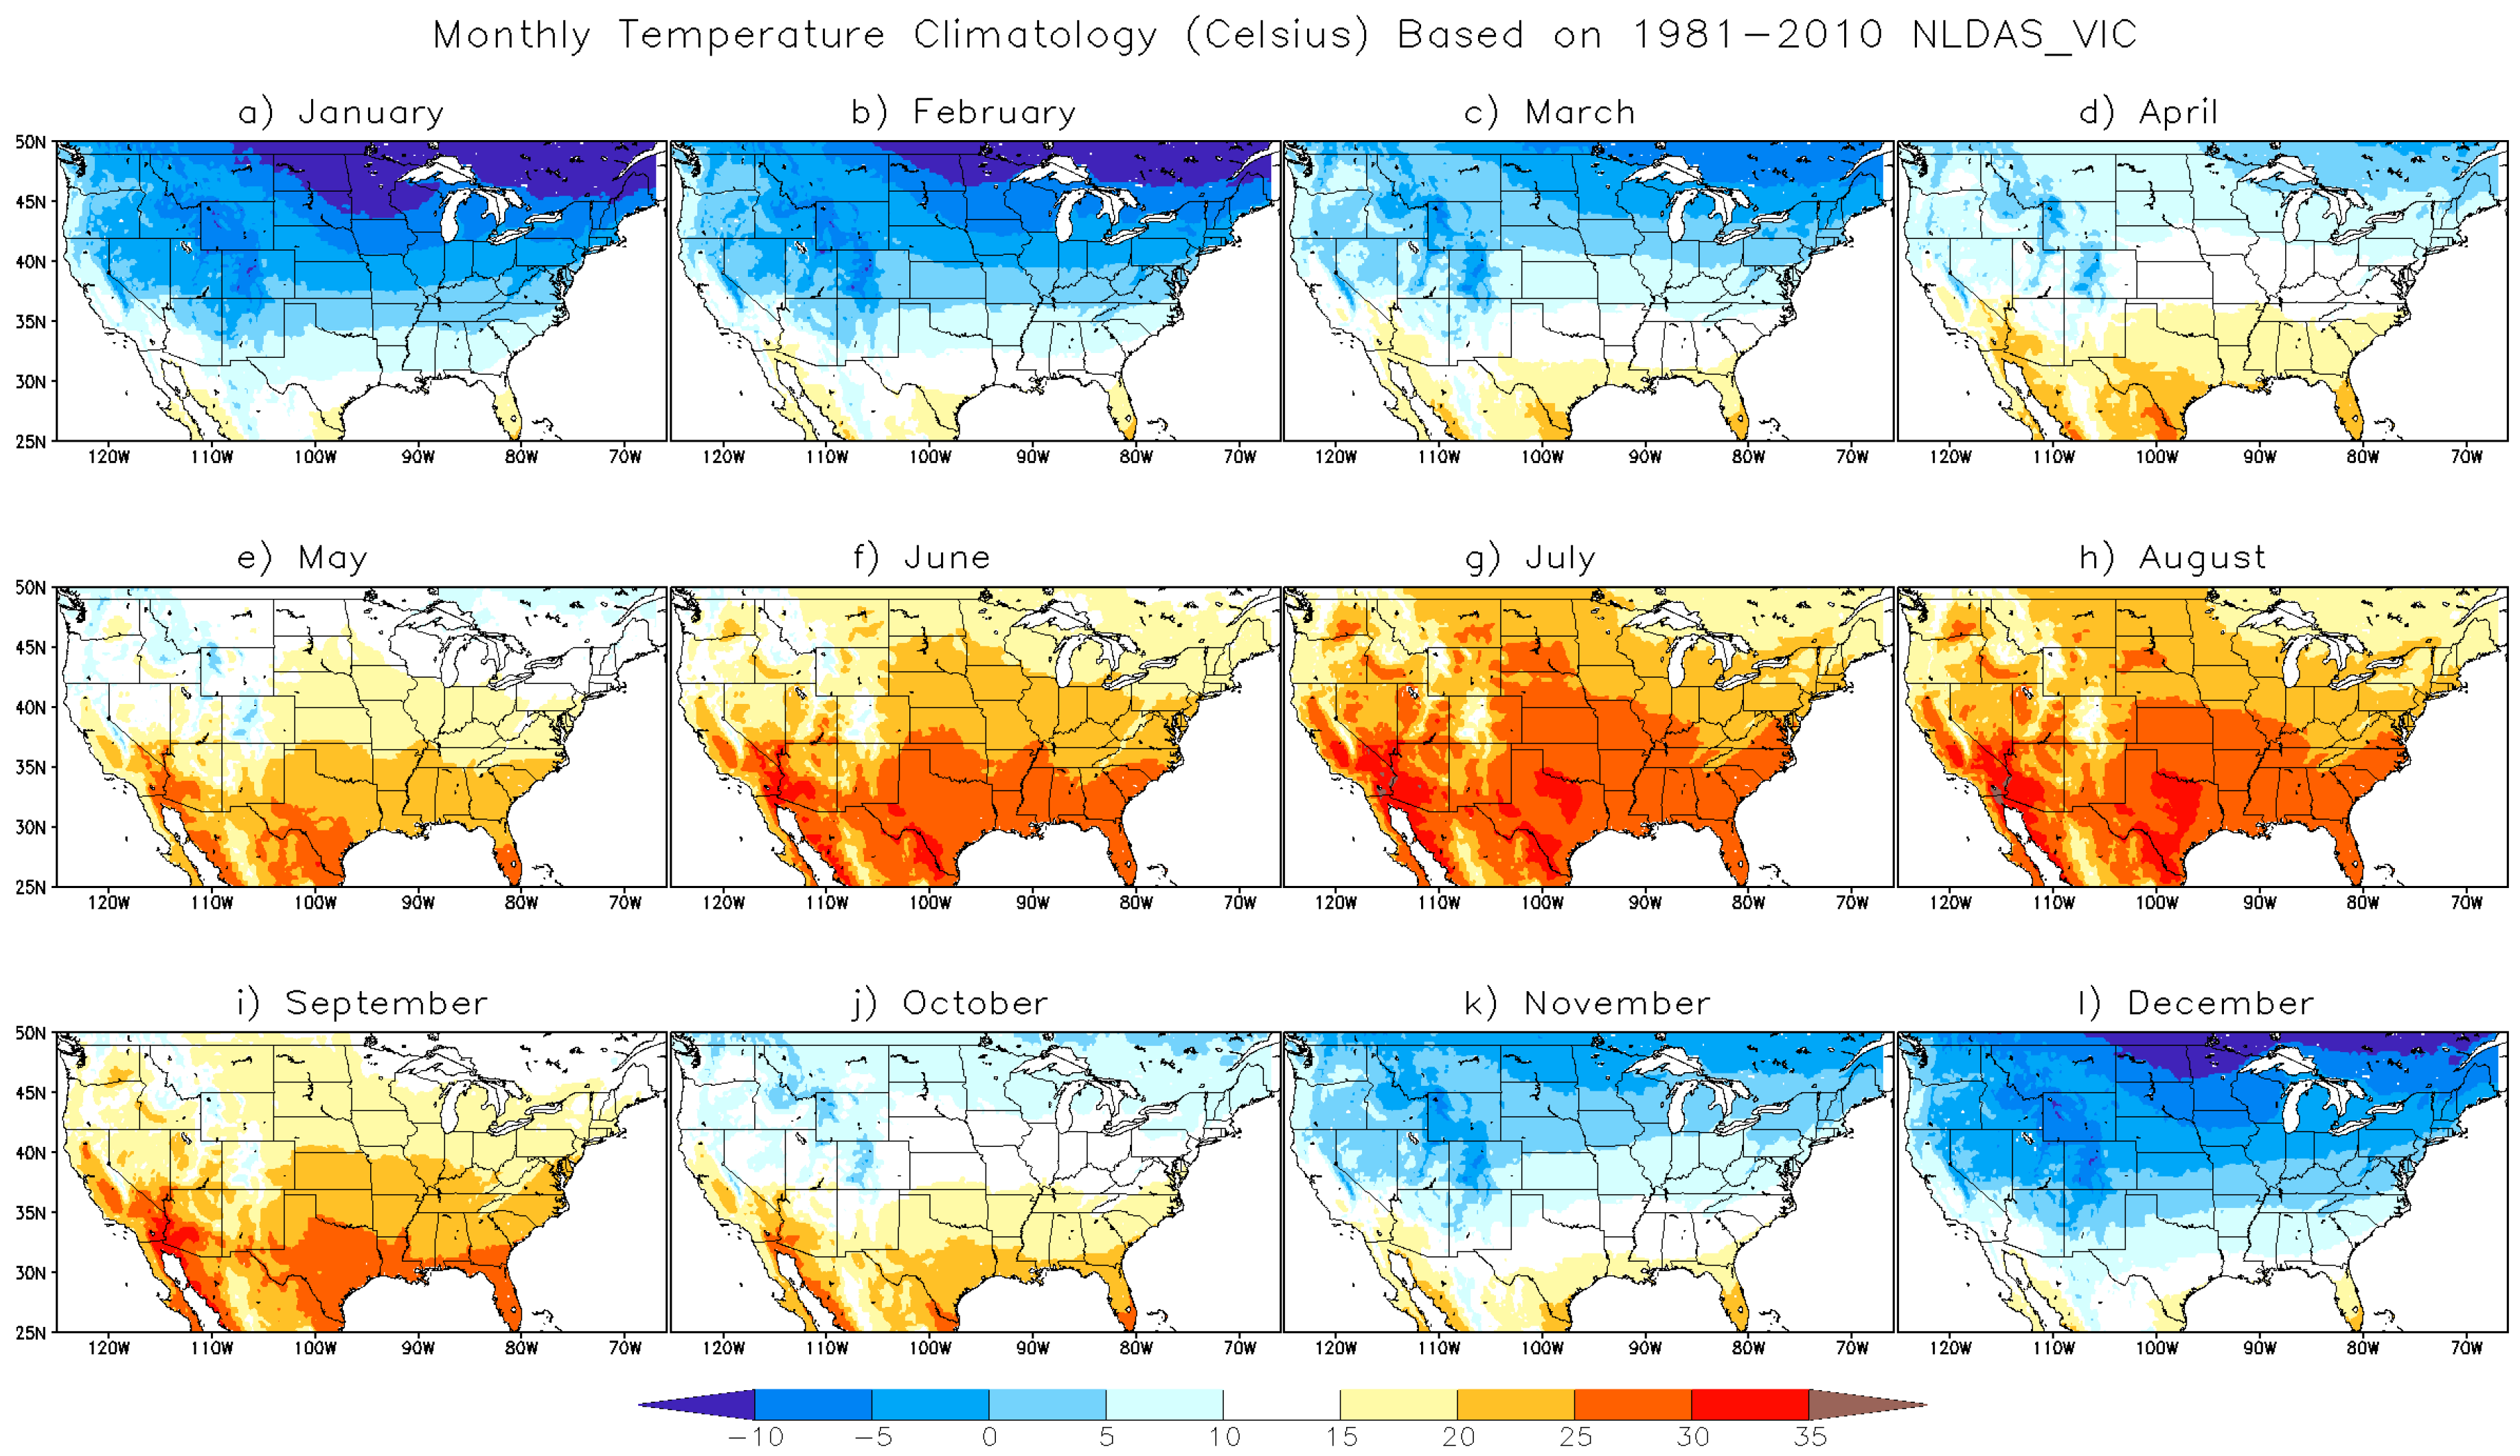
By cross-examining the spatial and temporal patterns of flash drought occurrence with ET and T climatological maps derived from 1981–2010 NLDAS-2 data (Figure 3 and Figure 4, respectively), there is strong coherence between the flash drought occurrence maps and ET climatological maps. Both sets of maps have large numbers in the warm season and over the central United States. In the cold season, most flash drought events and ET activities are apparent over the southern United States. In contrast, the T climatological maps present a south–north progression from cold season to warm season. This south–north progression is consistent across the eastern, central, and western United States with small variations. Most differences observed are associated with elevation differences. The similarity between the patterns of flash drought occurrence maps and ET climatological maps suggests that flash drought development is more related to ET processes than T effects, since ET processes are affected by not only T, but also vegetation and soil types. The various vegetation and soil types across the CONUS (figures not shown) contribute to the preferred seasons and regions of flash drought occurrence.
4. Flash Drought and ENSO
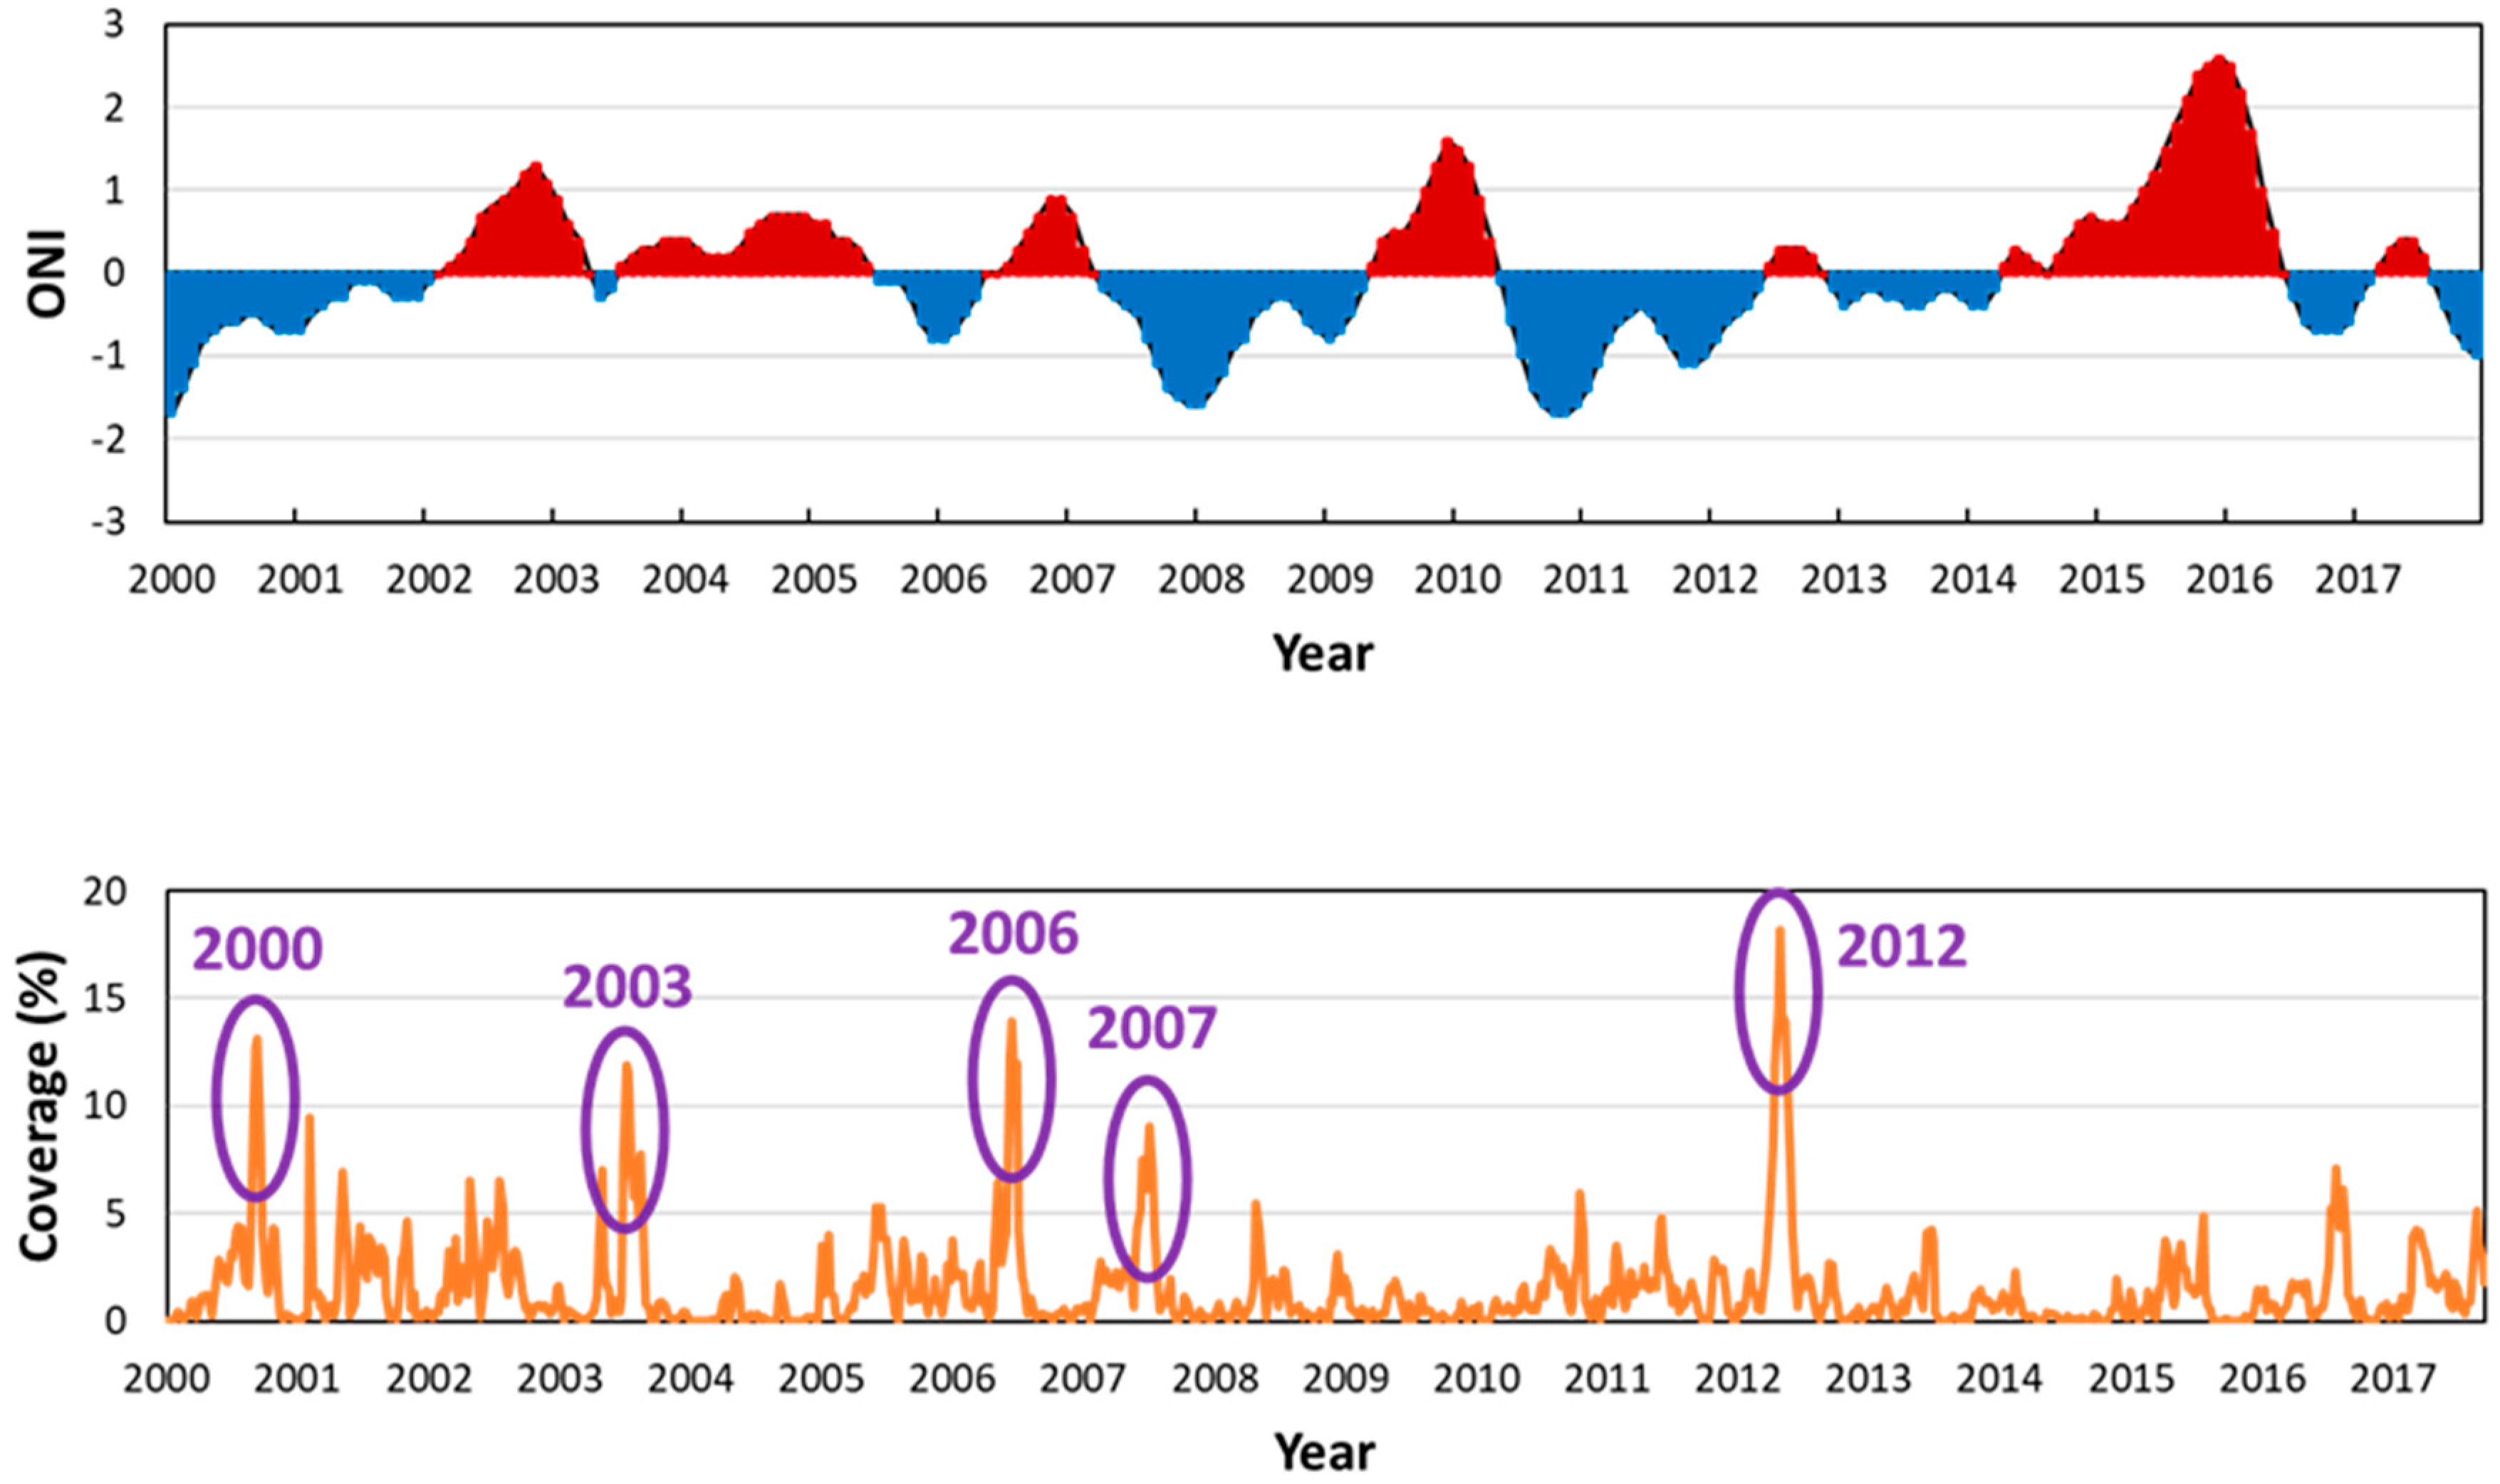
To illustrate how flash droughts occurred over time, the bottom row of Figure 5 shows the time series of flash drought coverage over the CONUS from 2000 to 2017. Contradicting the common perception that flash droughts are rare events, they occurred frequently throughout the 18-year period. Some years only have a small fraction of the CONUS experiencing flash drought development, and most of these flash droughts went unnoticed. Although the 2017 Northern Plains Drought caused significant agricultural damages and losses, the flash drought coverage of this event was limited to the northern High Plains and did not stand out on the time series.
The top row of Figure 5 shows the time series of the Oceanic Nino Index (ONI) [26] from 2000 to 2017. The ONI is one of the primary indices used to monitor the El Niño–Southern Oscillation (ENSO) at CPC. The ONI is the three-month running mean of sea surface temperature anomalies in the Niño-3.4 region (5° S to 5° N; 170° W to 120° W) of the east-central equatorial Pacific Ocean. The historical ONI (starting from 1950) is published on the CPC website at http://www.cpc.ncep.noaa.gov/products/analysis_monitoring/ensostuff/ensoyears.shtml. During the 2000–2017 period, five years (i.e., 2000, 2003, 2006, 2007, and 2012) had widespread fast development of drought, and four out of the five years (except 2003) occurred after or during a La Niña episode, indicating that the ENSO plays an important role in widespread flash drought development over the United States. The correlation coefficients between the ONI and three-month average of flash drought coverage under La Niña conditions are 0.39, 0.44, and 0.45 for zero lag, one-month lag, and two-month lag, respectively, a significant increase from the correlation coefficients calculated based on the entire time series, which are −0.11, −0.15, and −0.18 for zero lag, one-month lag, and two-month lag, respectively.
During La Niña years, the effects of changes in Pacific Ocean temperatures are usually larger during the winter months when the jet stream is stronger over the United States, causing warmer and drier than normal conditions across the South and cooler and wetter conditions in the Pacific Northwest [27,28]. The warmer and drier winter conditions set the stage for potential drought development if the conditions persist into spring or summer. The conditions can be exacerbated if followed by abnormally warm spring or summer heatwaves, resulting in flash drought development. The physical mechanism of how a La Niña episode attributed to a flash drought in the United States varies case by case and is beyond the scope of this study. This topic will be further investigated in subsequent research.
The 2012 flash drought over the central Great Plains [29] is historic, with about 18% of the CONUS experiencing sudden deterioration of conditions at the peak of drought development. This drought occurred after back-to-back La Niña episodes, further highlighting the effects of ENSO on rapid drought development over the United States. The causes, evolution, impacts, and predictability of this drought have been studied by many and are well documented [29,30,31,32]. The significance of this drought (and the damages it caused) has led to the awareness of flash drought and motivated the inauguration of the MDO at CPC in 2013.
5. Antecedent Conditions and Evolution of Selected Flash Droughts
In order to investigate the antecedent conditions prior to the rapid development of drought, NLDAS-2 data of the five years with widespread flash drought development were gathered and analyzed. Table 1 lists the specific location and time period of the five selected flash droughts used in the analysis. We looked at the time series of P, T, SM, ET, and R, their anomalies, and standardized drought indices, as well as the evolution of these five droughts. Our goal is to look for common features during the drought development phase. Here, we use the 2000 southern U.S. flash drought as an example to illustrate these features.
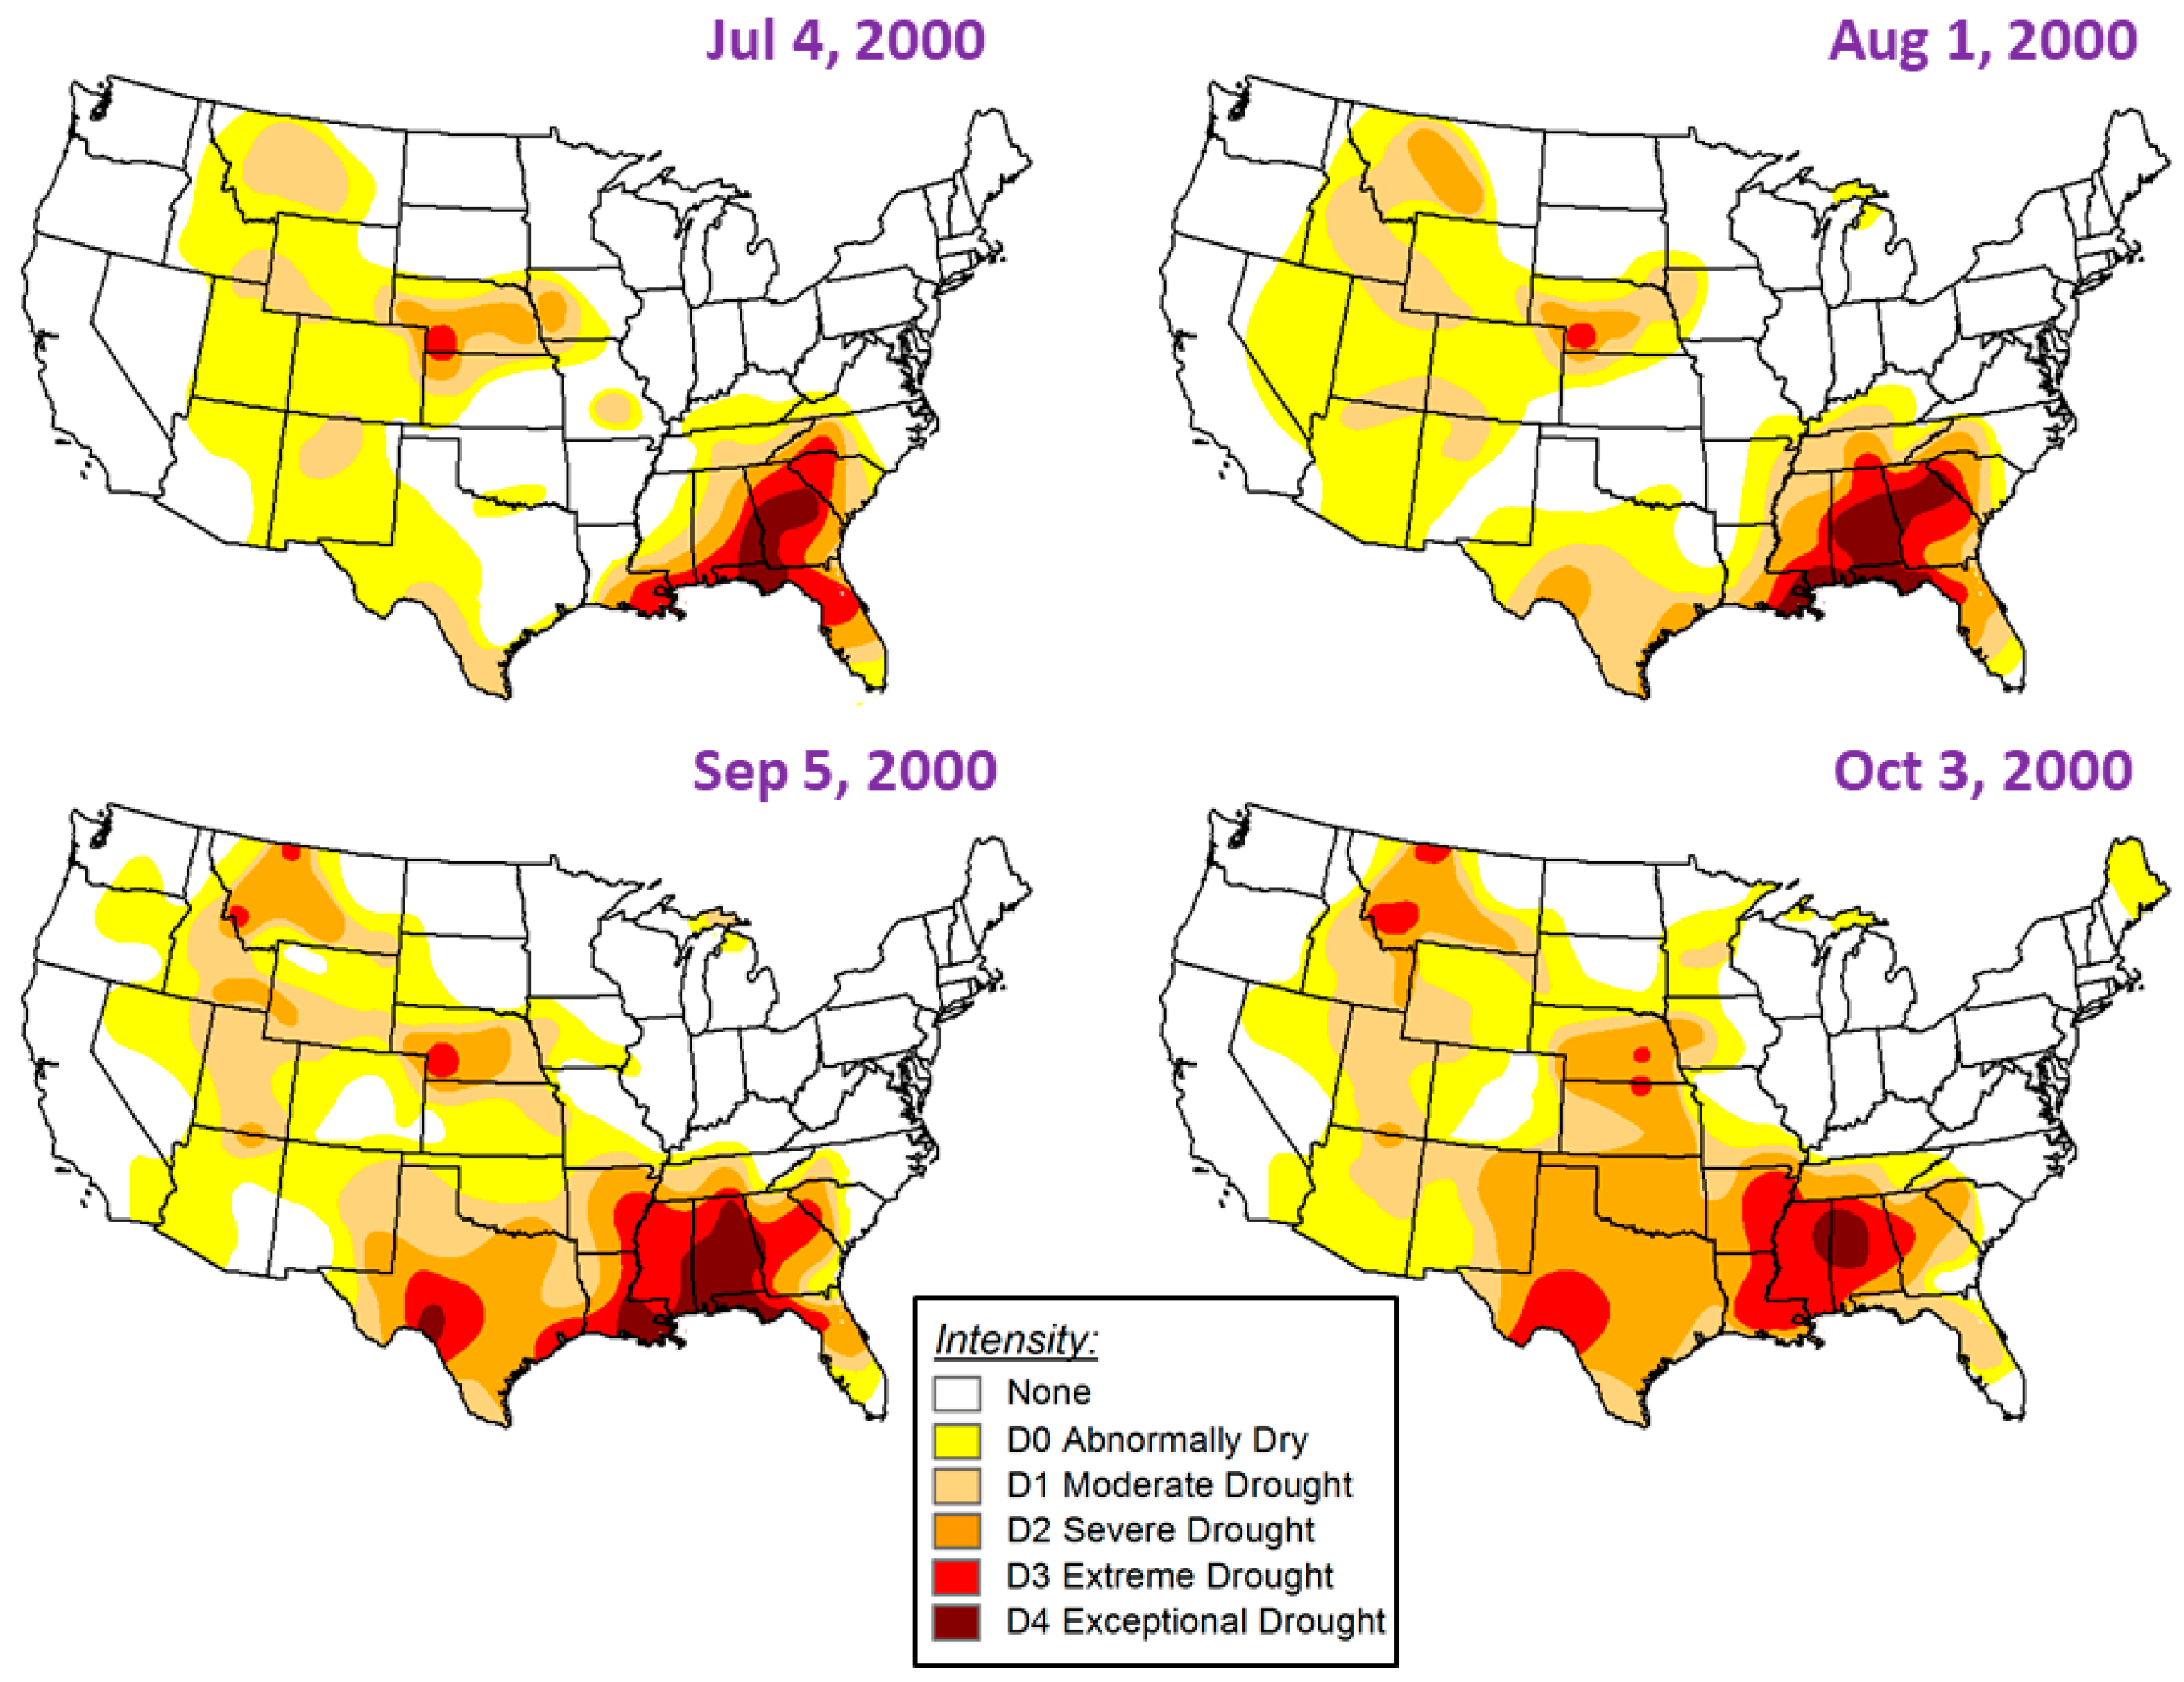
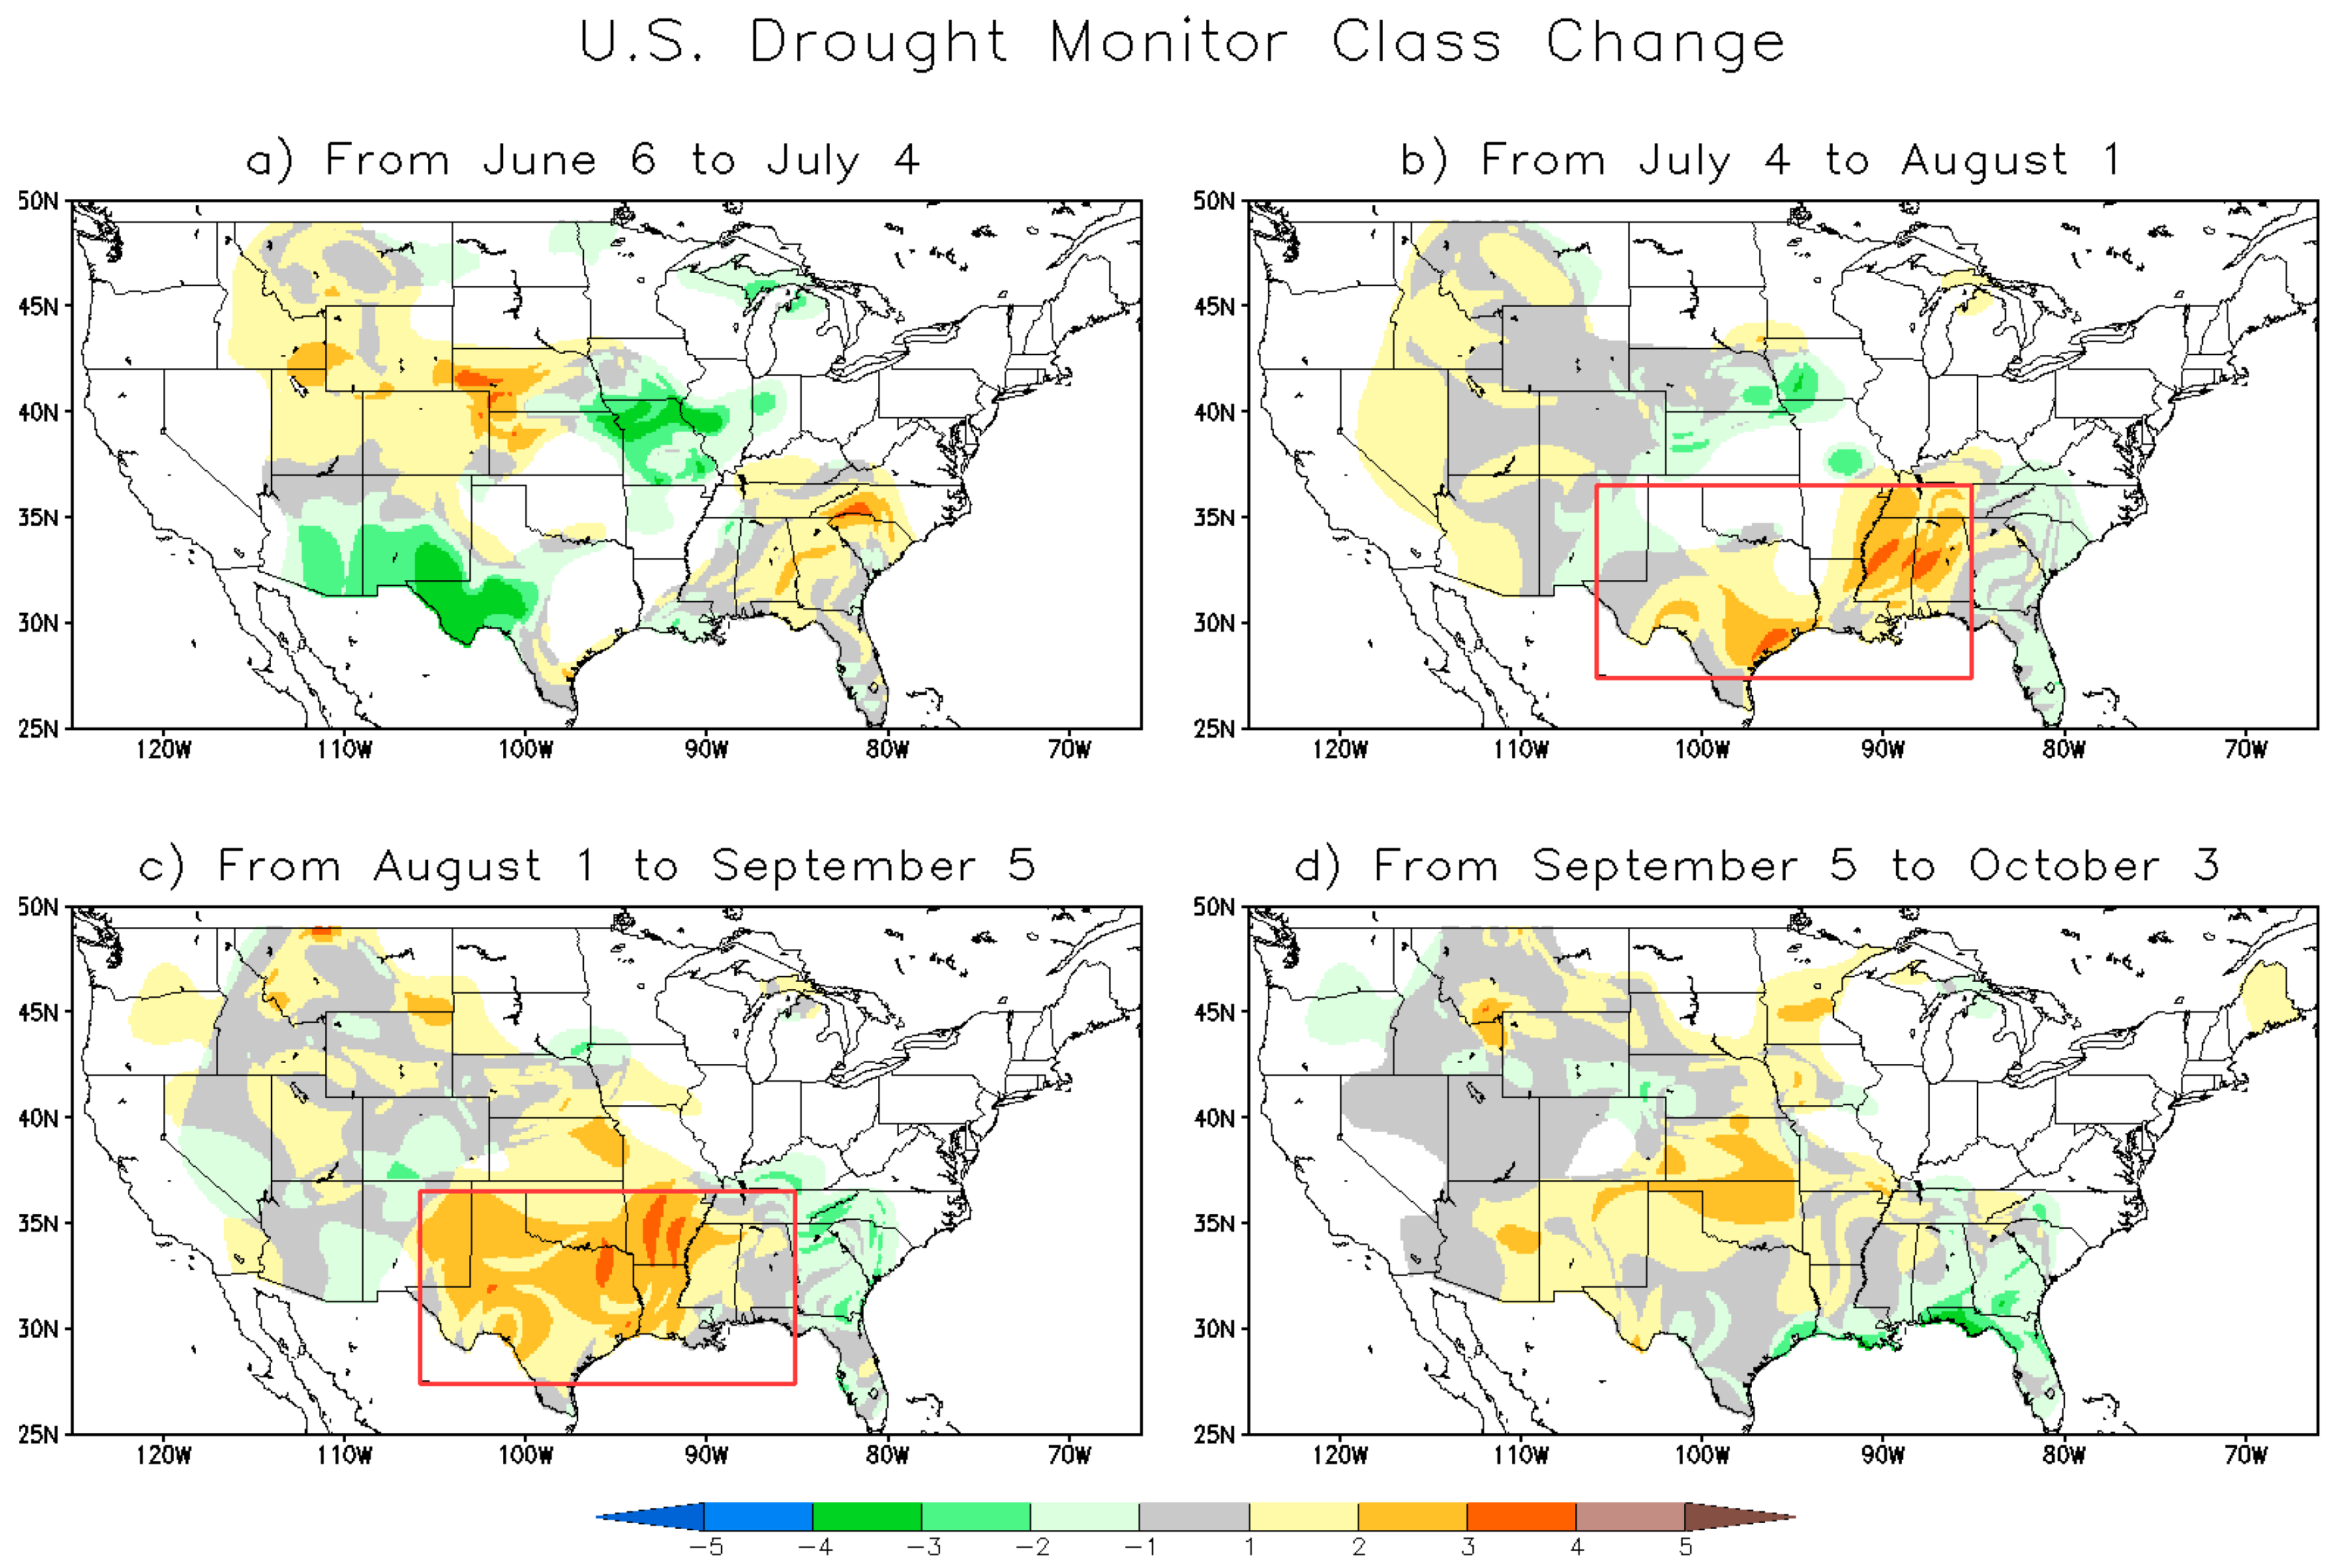
Figure 6 presents the USDM maps at the beginning of the months from July to October for the 2000 southern U.S. flash drought. On 4 July 2000, exceptional drought existed from the Florida panhandle stretching into southeastern Alabama and central Georgia. There was only a small band of moderate drought along the Texas–Mexico boundary, and the majority parts of Texas, Oklahoma, and Arkansas were drought-free. From 4 July to 1 August, drought suddenly developed over central Texas, Mississippi, and western Alabama. Some of these areas experienced three categories of degradation in drought, as seen in Figure 7 (top right panel). The rapid intensification continued from 1 August to 5 September over northern Texas, Arkansas, and Louisiana (Figure 7, bottom left panel). On September 5, all Gulf states were in drought with large areas of exceptional drought over Alabama and portions of Louisiana.
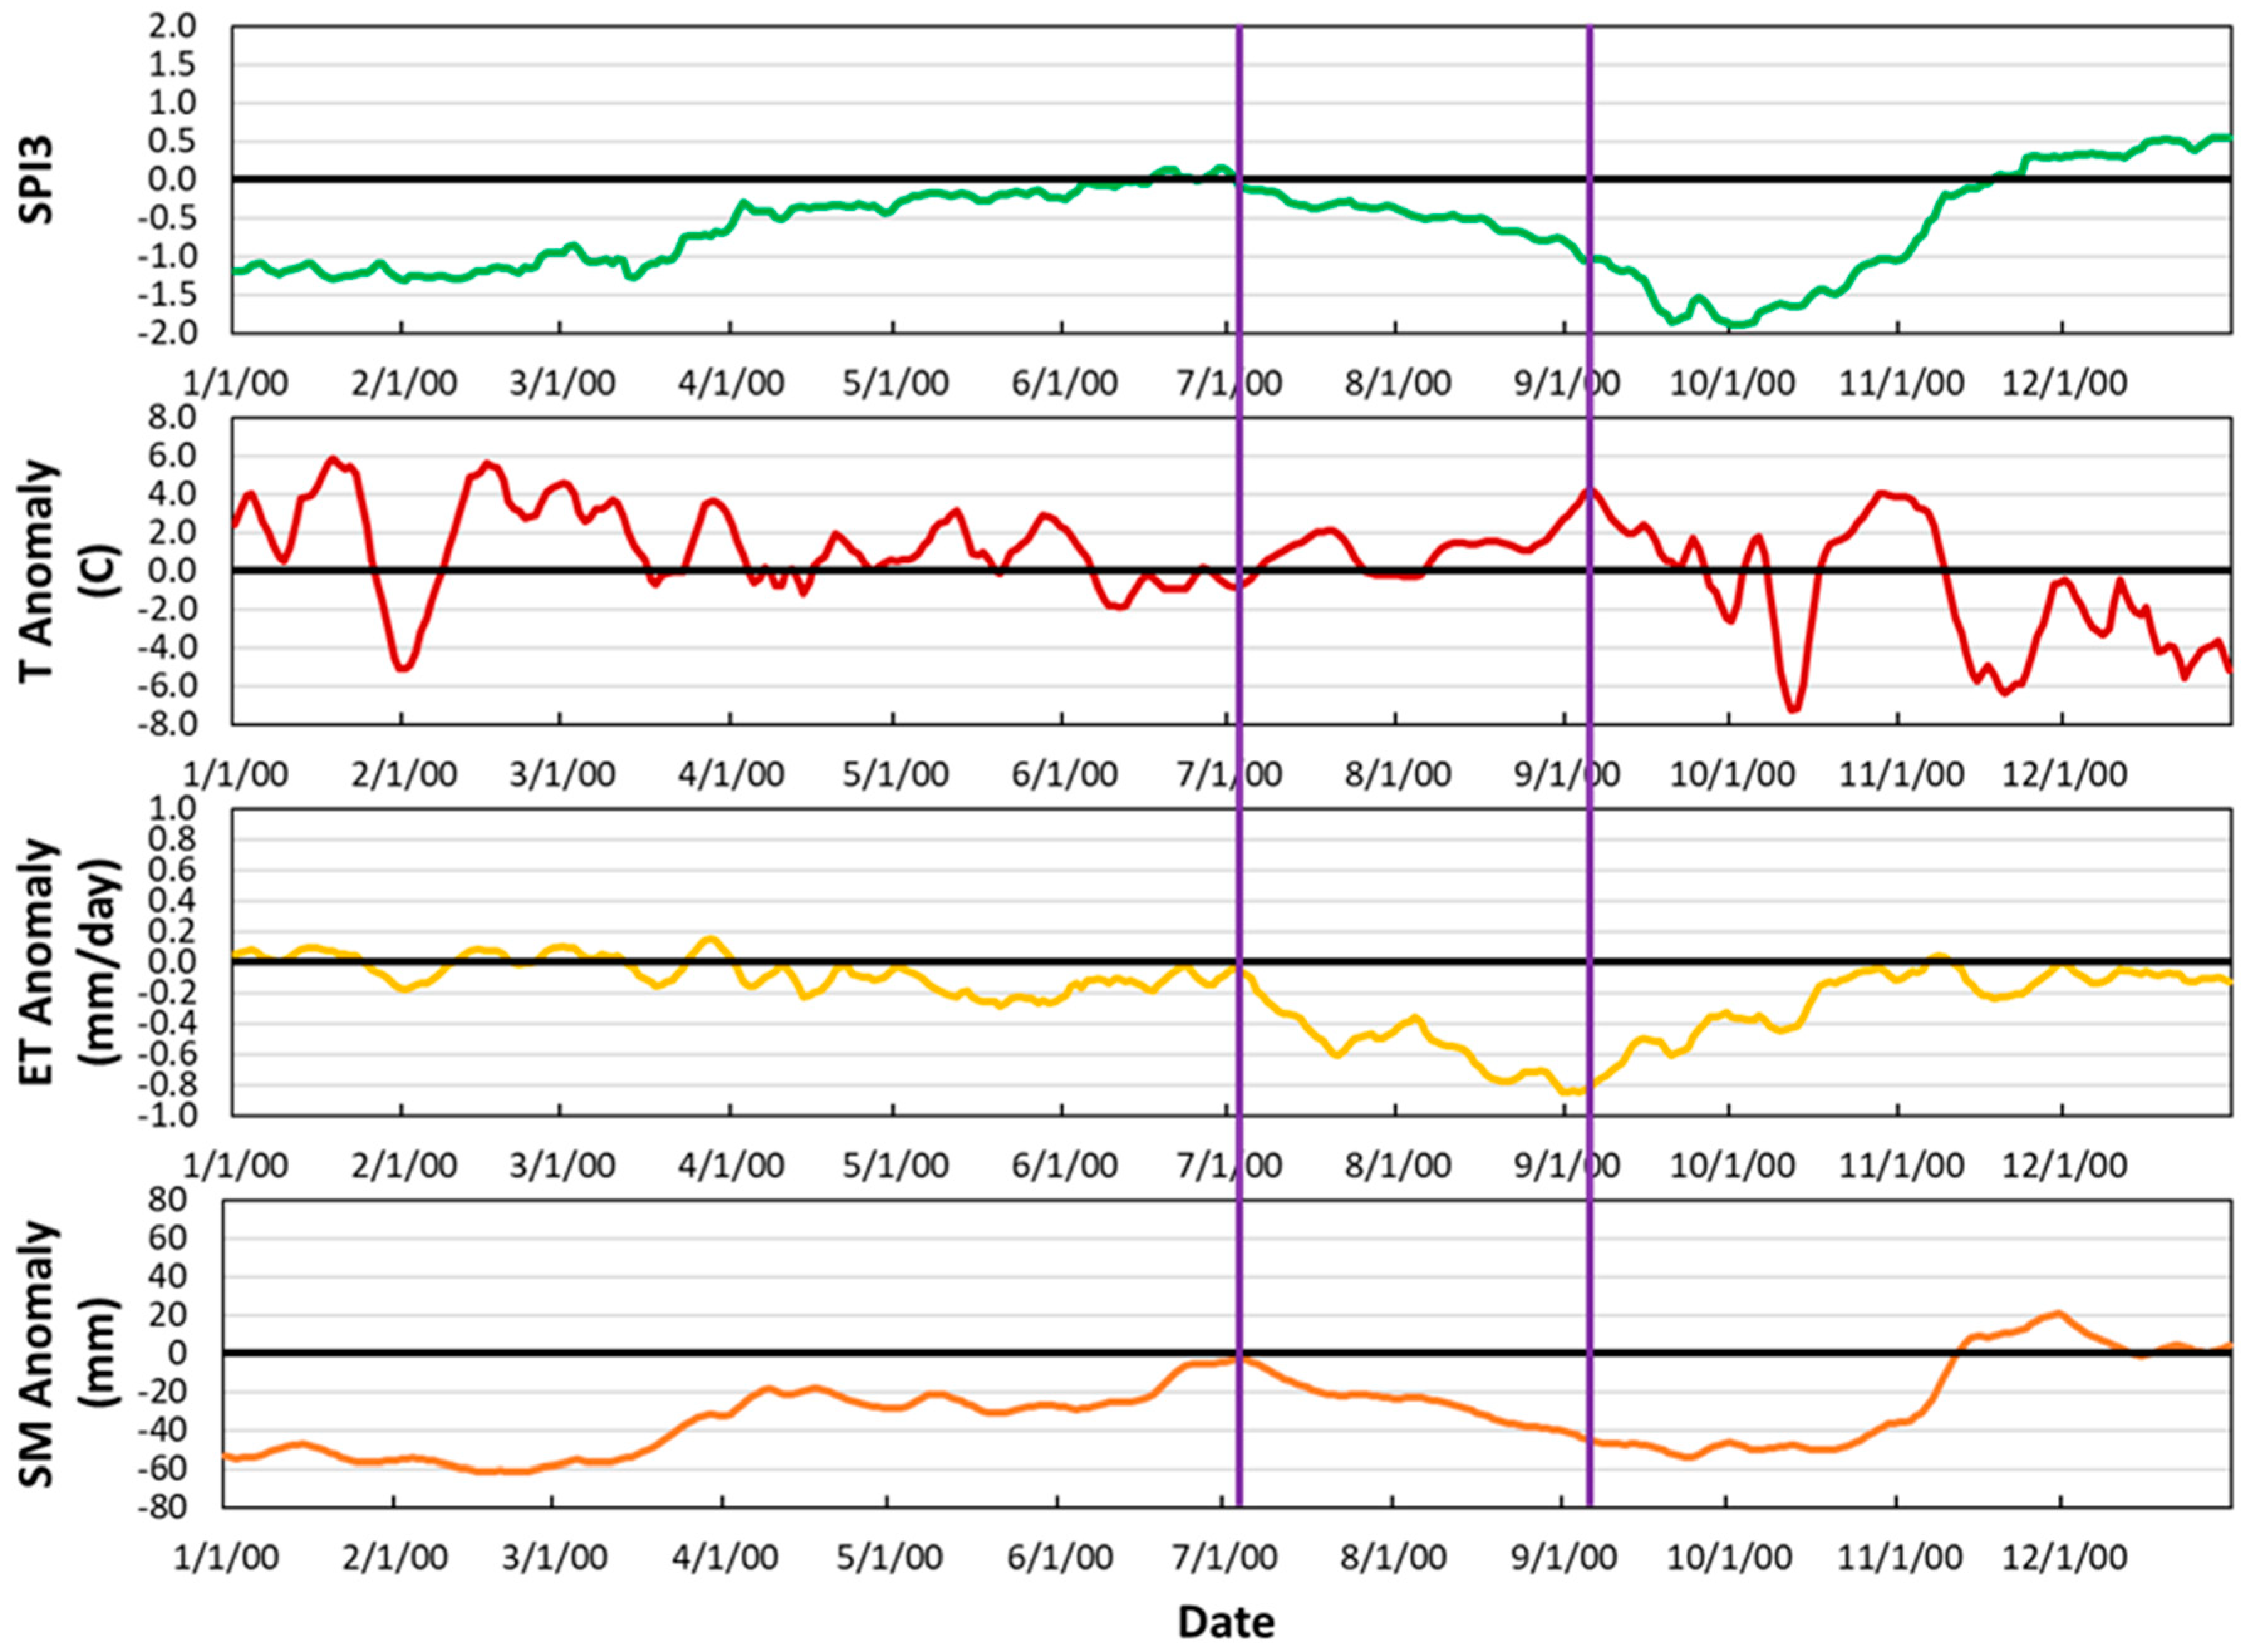
Figure 8 depicts the time series of areal averaged three-month Standardized Precipitation Index (SPI) [33] and seven-day mean anomalies of T, ET, and SM from 1 January 2000 to 31 December 2000. All anomalies are departures from the average over the 1981–2010 period. Plotted values were averaged over the latitude–longitude box area, indicated in Table 1 (also shown in Figure 7, top right panel). Before the flash drought onset, this area was preceded by warmer and drier than normal conditions in the winter, as shown by the time series of three-month SPI and seven-day mean T anomaly. This is a typical La Niña pattern in the southern United States and Year 2000 was the second year of back-to-back La Niña episodes. As a result, the areal averaged SM anomalies were below normal during the wintertime, and ET activities in the area were minor from winter to spring. Spring showers had recharged the area and brought the three-month SPI and seven-day mean SM anomaly up to normal right before the flash drought onset. At the beginning of July, warm air/heatwave moved into the region and there was a sudden decrease in seven-day mean ET anomaly, associated with a sudden decrease in seven-day mean SM anomaly and three-month SPI over the region, causing the rapid development of drought.
The sudden decreases in seven-day mean ET and SM anomalies were not only observed in the 2000 southern U.S. flash drought; they also appeared in four other flash droughts. All five flash droughts experienced warmer than normal temperatures during the rapid intensification periods as well. Their three-month SPIs were all negative during their deteriorations, but not all five droughts displayed sharp declines. Some droughts were preceded by a warm spring or winter and above normal ET activities. However, SM anomalies and three-month SPIs can be wetter than normal before the flash drought onset. Table 2 provides a summary of the antecedent conditions prior to the drought onset and features during the fast-development phase.
Rapid changes in ET anomaly during flash drought development were also observed by Otkin et al. (2013) [7] using remote sensing data. Among the four cases they studied, the events could be generally characterized by warm air temperature and low cloud cover anomalies, accompanied by high winds and dewpoint depressions, resulting in swift depletion of SM storages through ET processes. Sun et al. (2015) [30] examined the onset mechanism of the 2012 Great Plains Flash Drought, using satellite observations, and found similar results. They attributed the rapid onset of the 2012 drought to unusually high temperatures in early summer, which activated strong ET activities and depleted SM in a short amount of time. The 2017 Northern Plains Flash Drought [11,12] exhibited comparable features, with much of the area in central to eastern Montana experiencing abnormally high ET rates during May 2017. As May progressed to June, the lack of P and depleted SM led to an accelerated decline in ET amounts, and exceptionally low ET anomalies were presented in large areas of central to eastern Montana and the Dakotas at the beginning of July.
Evapotranspiration varies regionally and seasonally (Figure 3) and depends on a number of factors, including air temperature, water availability, humidity, wind speed, and incoming radiation. If SM supply/water availability is sufficient, ET increases during warm and windy atmospheric conditions (energy-limited regime), and vegetation can accelerate depletion of root-zone SM due to enhanced ET. As SM decreases, ET decreases because plants will limit transpiration in order to conserve water, leading to water-limited conditions. As transpiration continues to decrease, ET anomalies change sign from positive to negative during the onset of flash drought, and plants reduce their growth to limit the potential for mortality, resulting in declines in vegetation health and agriculture production. This unique feature of changing sign from positive to negative makes ET an excellent predictor for flash drought development. Although SM also presents sharp declines during the fast-development phase, its unspecified state in the antecedent conditions creates more uncertainties/difficulties to foresee the future; however, below-normal SM and P are necessary for drought to occur. Therefore, closely monitoring rapid changes in ET, along with soil moisture and precipitation/vegetation conditions, is the key to predicting the onset and evolution of flash drought.
6. Composite Analysis
To provide a more comprehensive analysis, we compute the composites under flash drought conditions (based on the ending dates of identified flash drought events from USDM), four weeks before drought onset (based on the beginning dates of identified flash drought events from USDM), and three months before drought onset. Composites are commonly used in climatological analysis to identify general patterns under a specific condition, such as ENSO [27,28]. The composites were constructed using standardized indices by rescaling the distribution of a drought variable to standard normal distribution with a mean of 0 and a standard deviation of 1, so they can be easily compared across regions with different climates. In this study, for example, the three-month SPI composite under flash drought conditions is the average of three-month SPI of the flash drought events identified from USDM. That is, at each grid point, only the dates of identified flash drought events are used. The composite is an overall representation of similar mechanisms under flash drought conditions, and therefore, is physically meaningful.
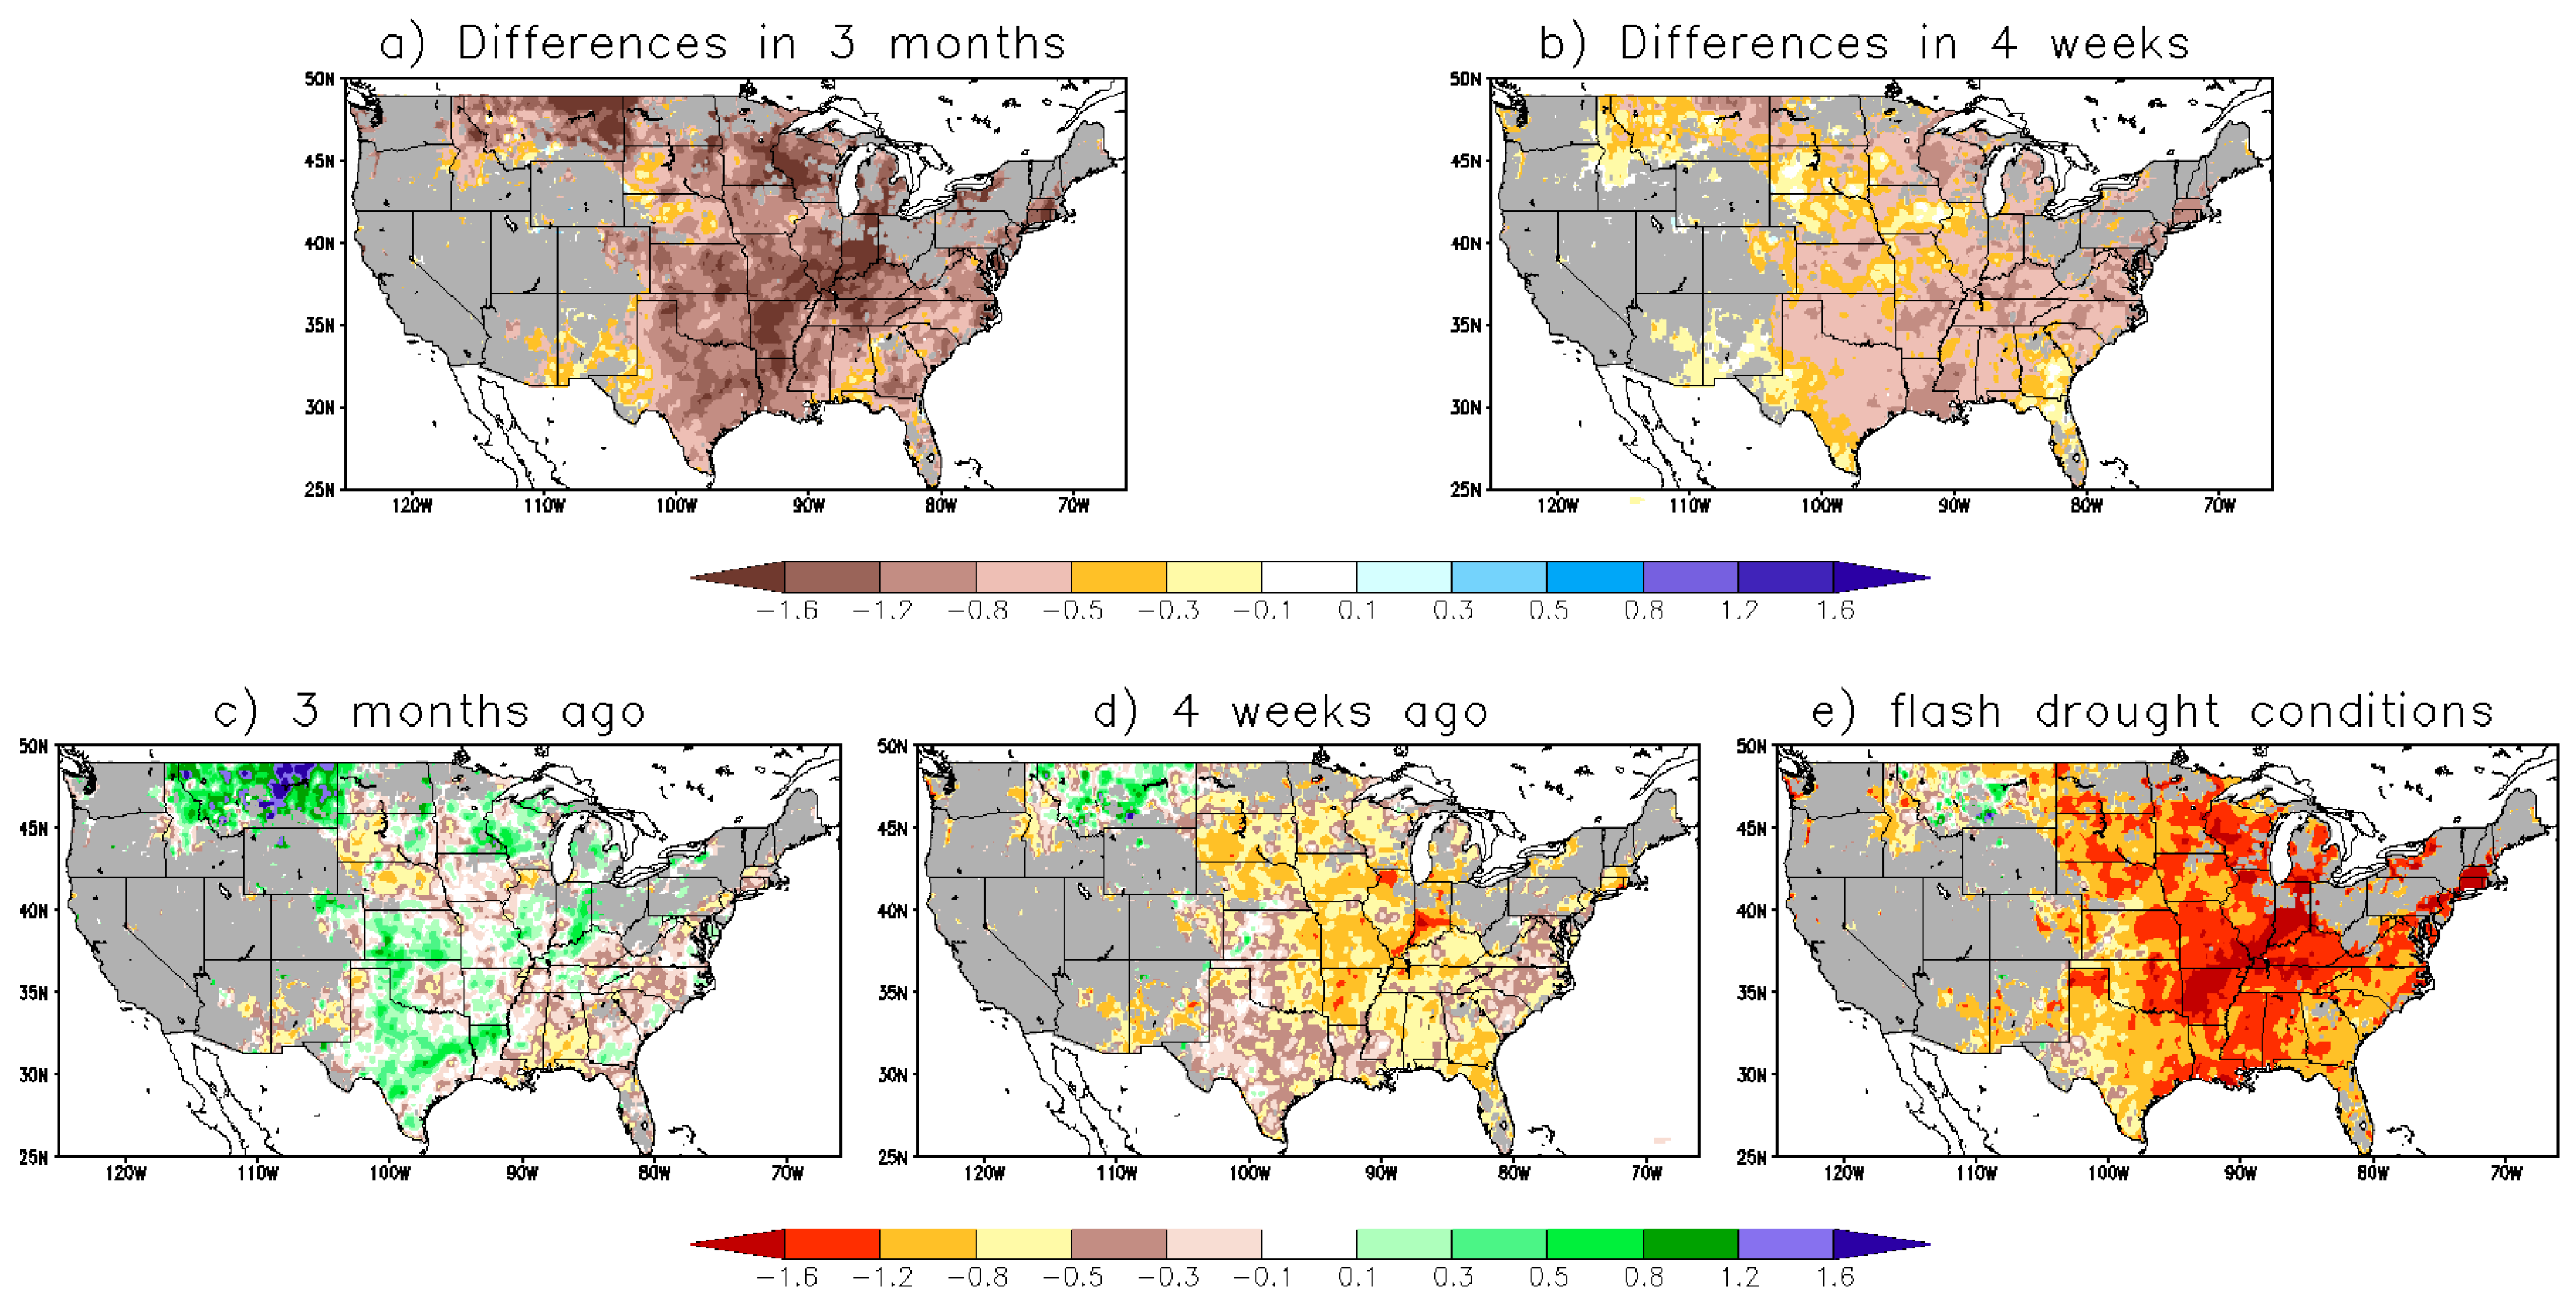
Figure 9, Figure 10 and Figure 11 show the composites for the seven-day Standardized Evapotranspiration Index (SETI), three-month SPI, and seven-day Standardized Soil Moisture Index (SSMI), respectively. The seven-day SETIs and three-month SPIs were derived by fitting three-parameter gamma distributions to ET and P data, respectively, and then transforming the distributions to standard normal distribution [33], and the seven-day SSMIs were calculated by fitting normal distributions to SM data and then rescaling the distributions to standard normal distribution. McKee et al. (1993) [33] provided the standard procedure of SPI calculation. Since flash drought has preferred locations to occur, areas with less than 1% flash drought occurrence were excluded in the composites to ensure a sufficient sample for the analysis. In the figures, we also show the differences of composites between flash drought conditions and the conditions three months ago (Figure 9a, Figure 10a and Figure 11a), as well as the conditions four weeks ago (Figure 9b, Figure 10b and Figure 11b).
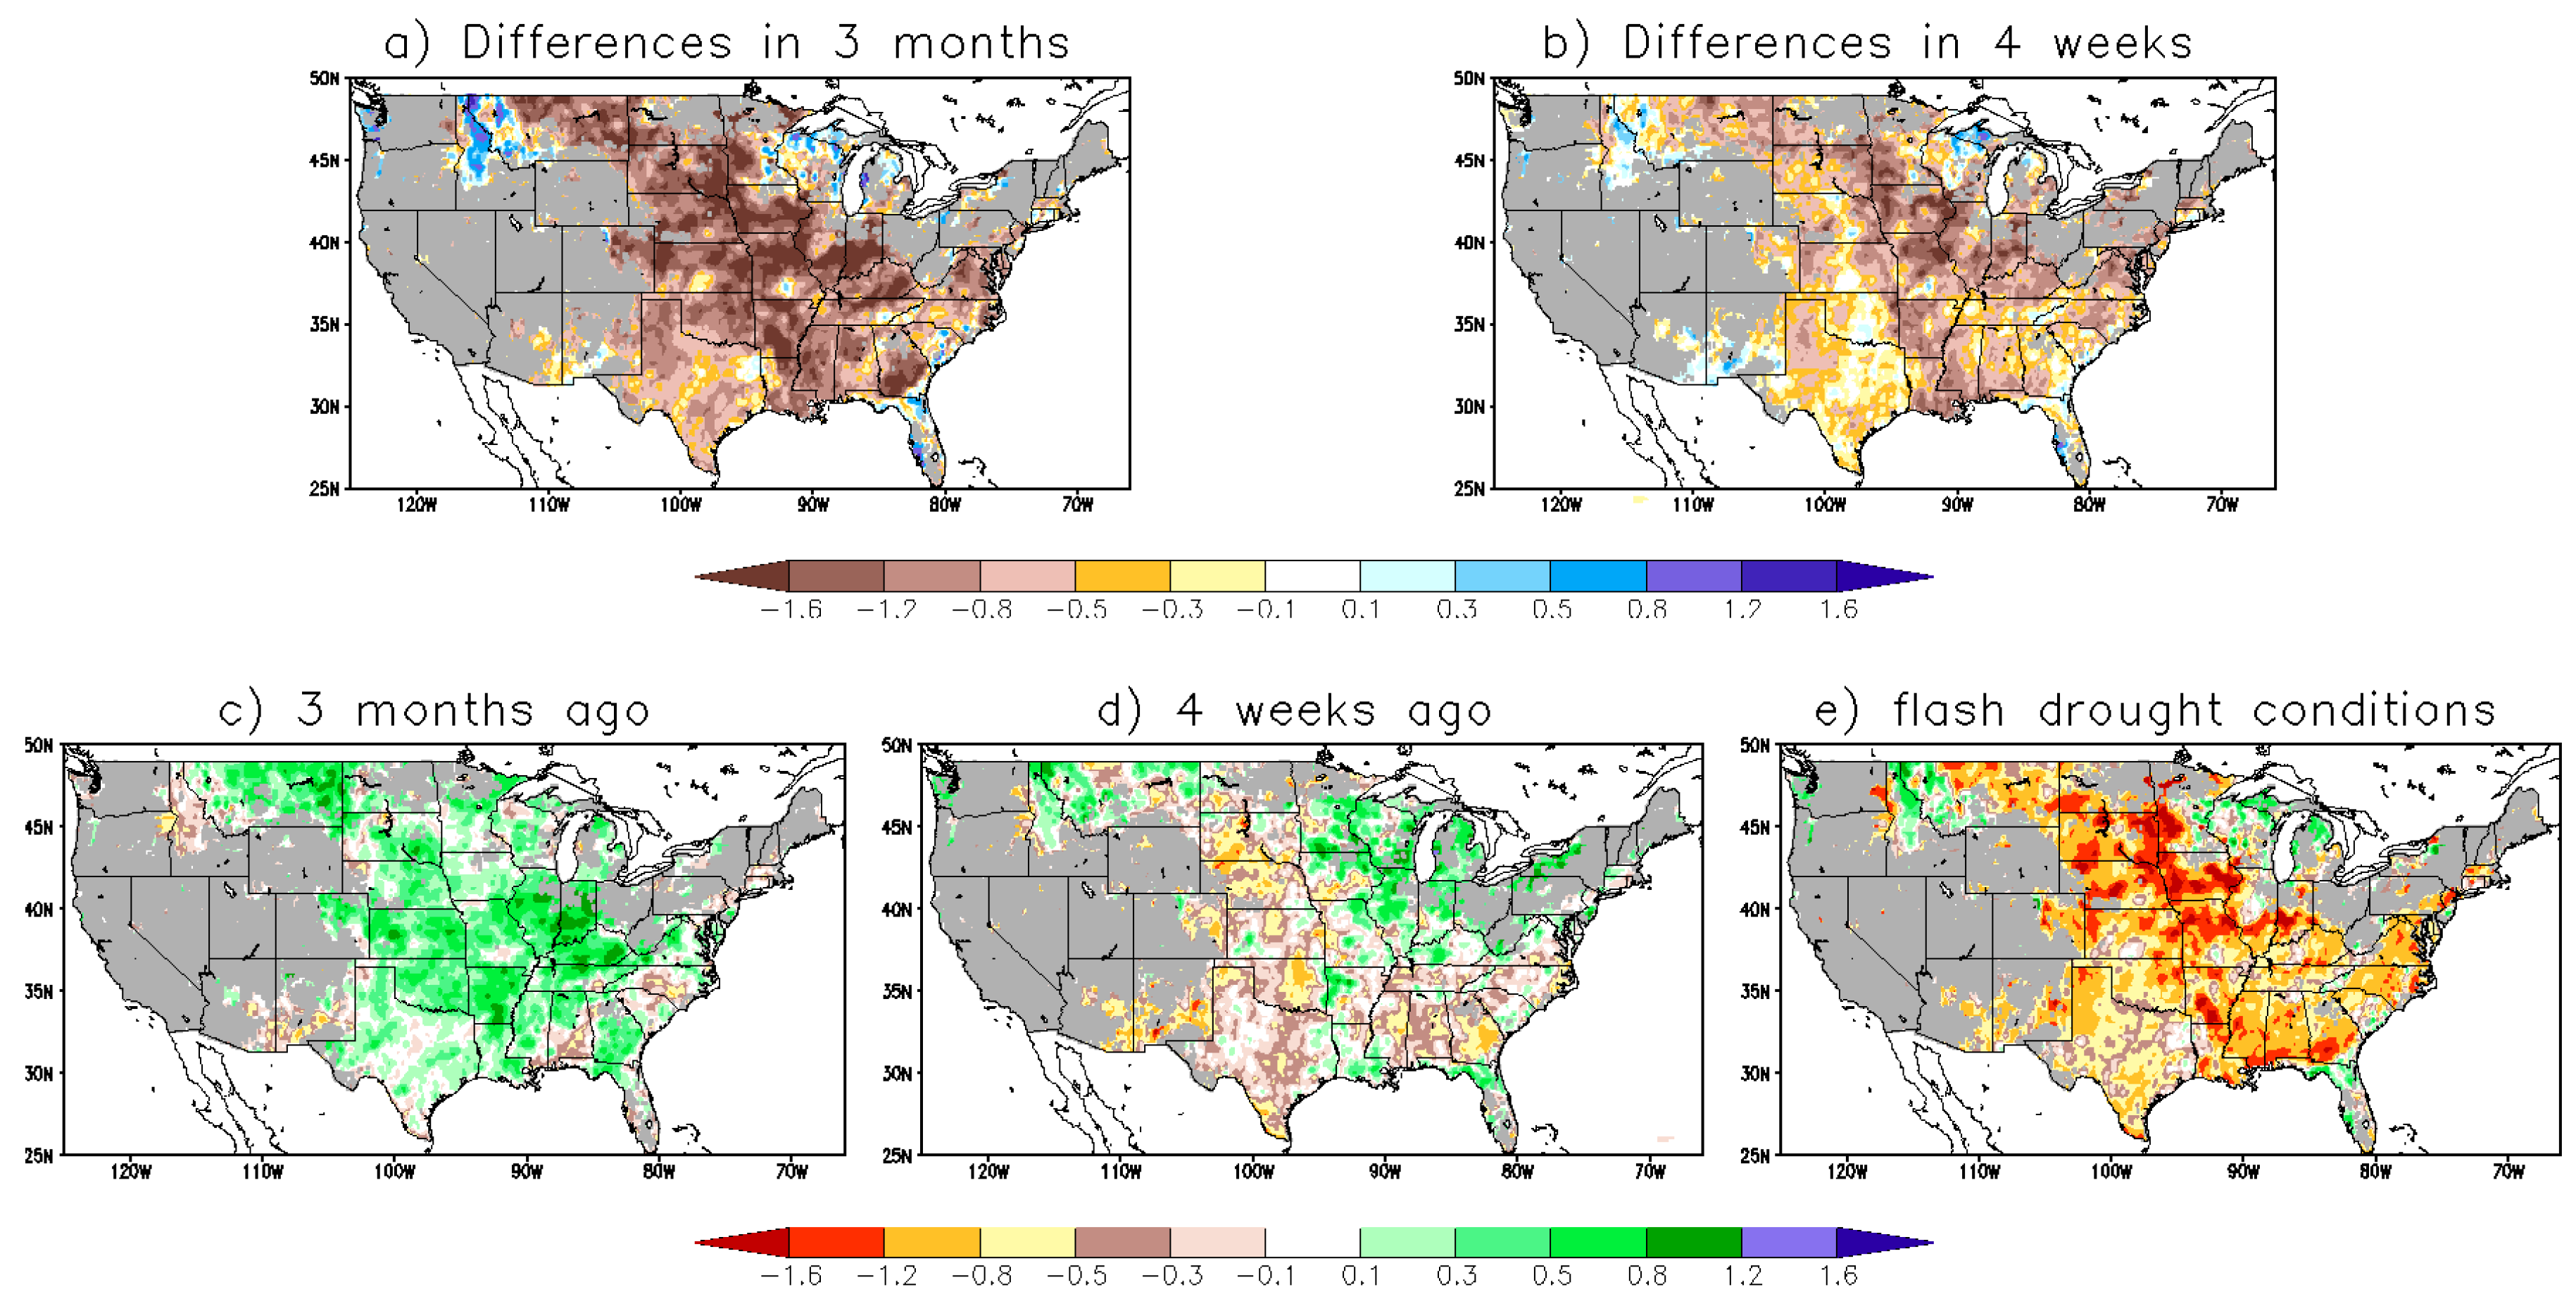
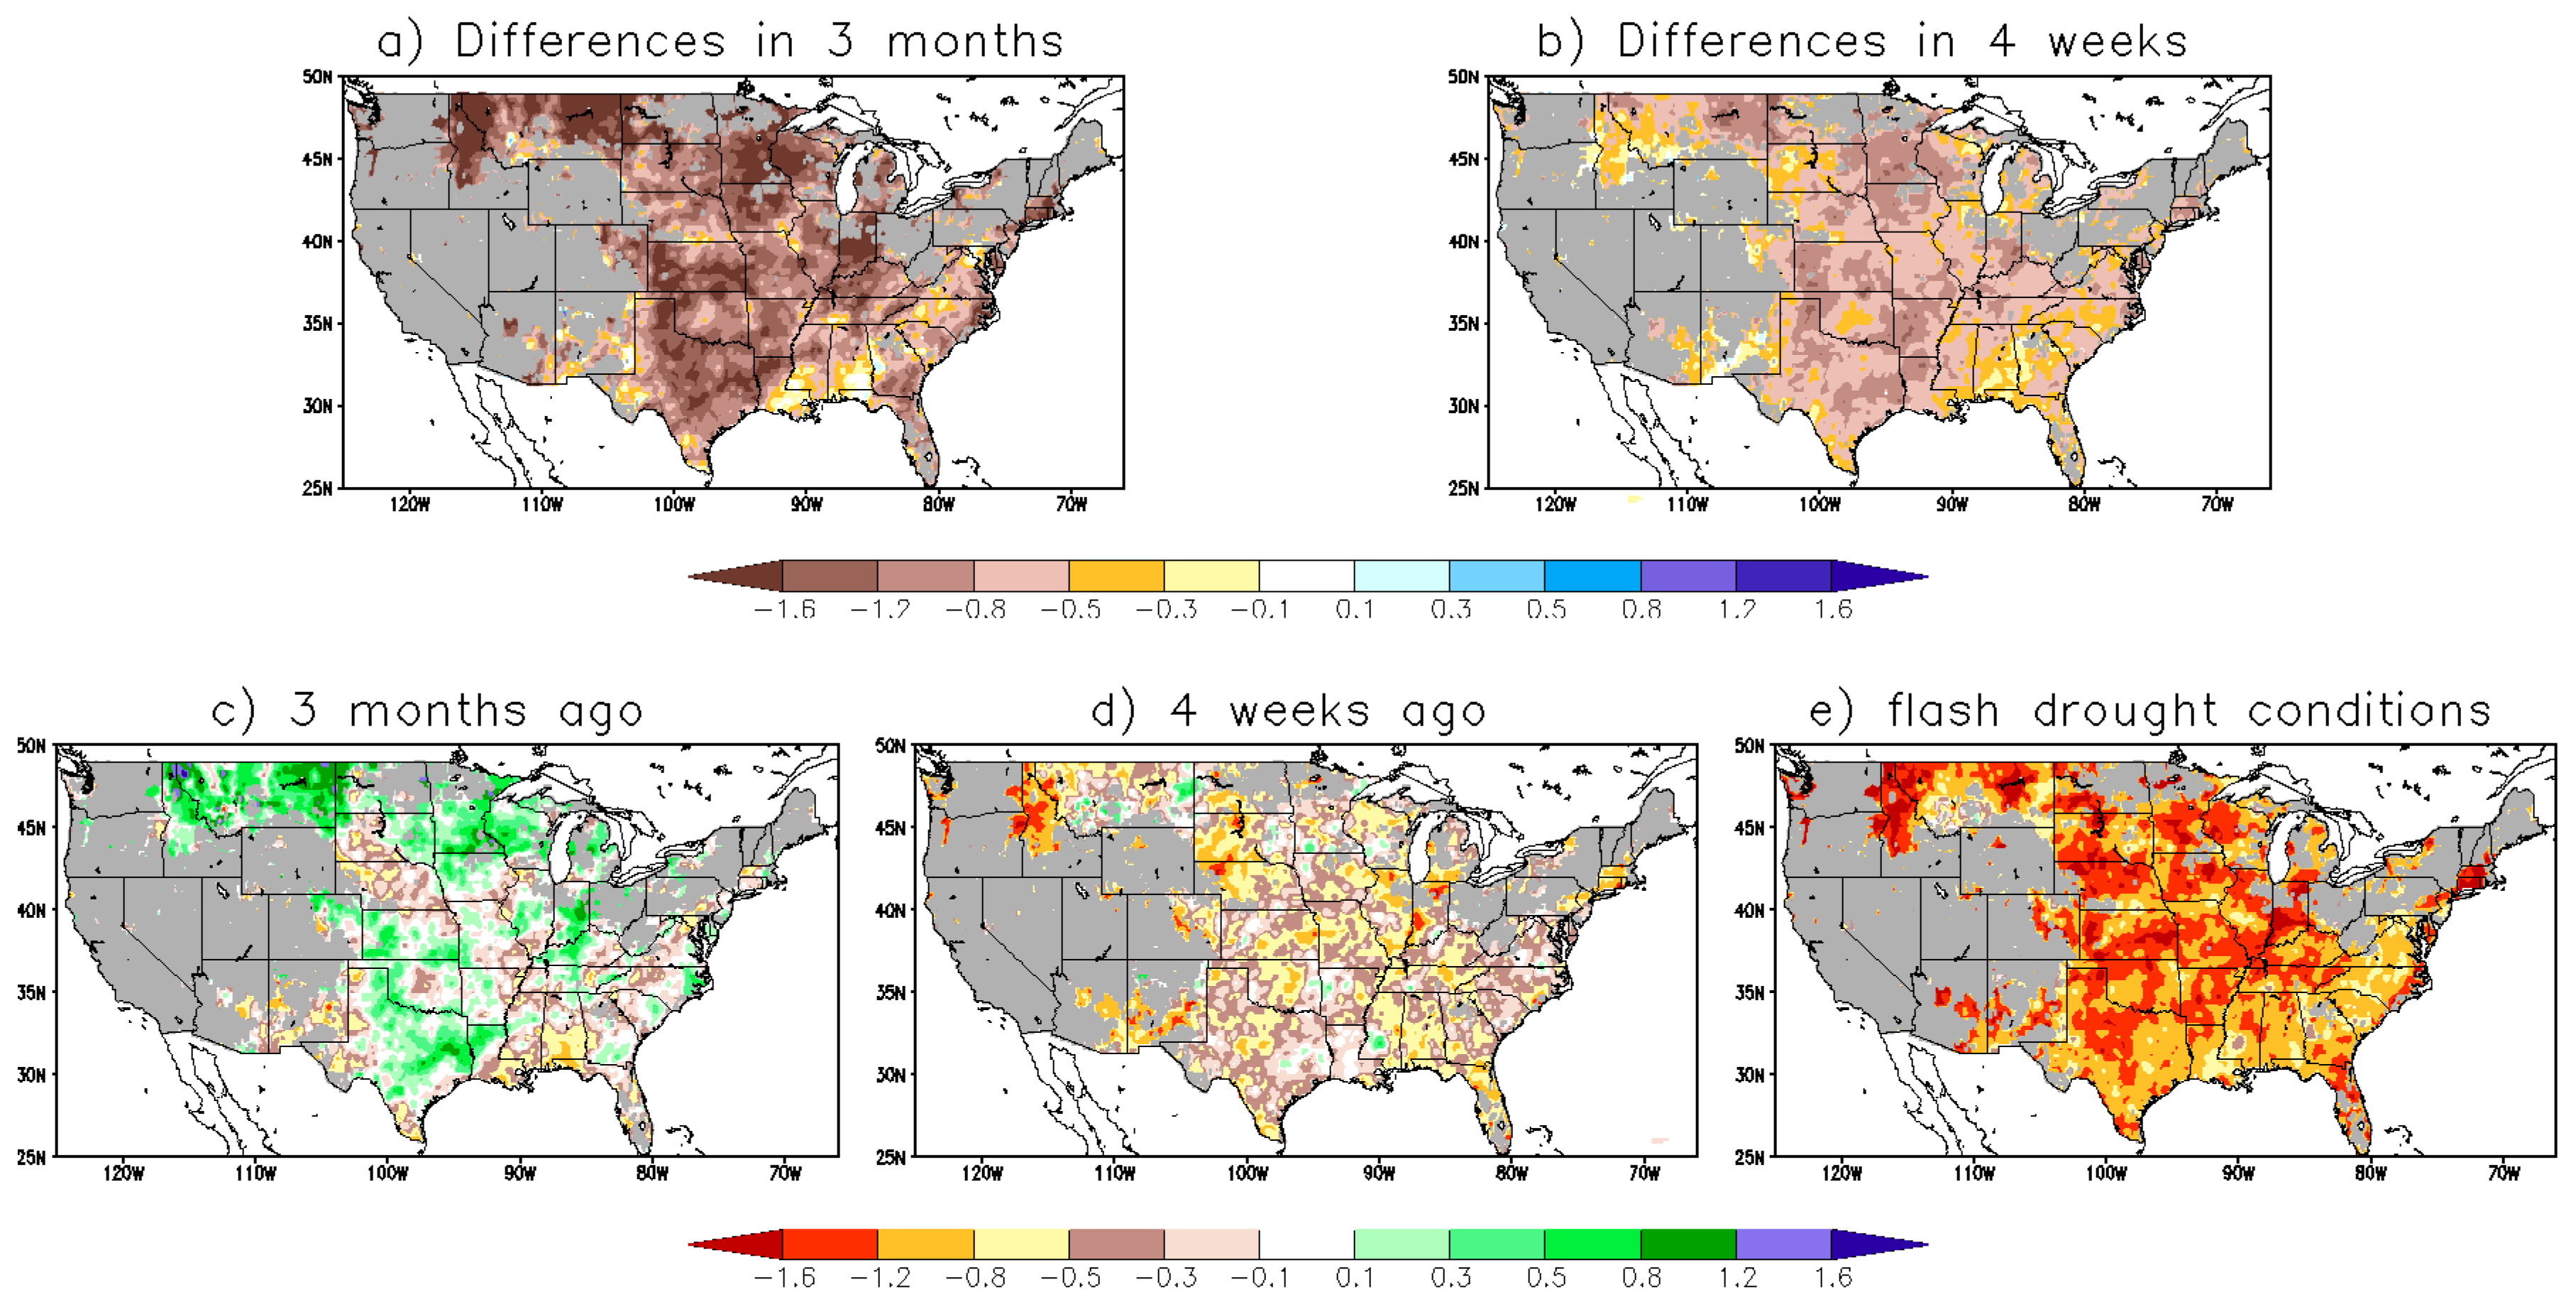
Several important features were noticed from this analysis. First, three months before drought onset, seven-day SETIs were positive in most areas (Figure 9c), while there were a mix of positives and negatives in three-month SPI and seven-day SSMI composites (Figure 10c and Figure 11c). This feature suggests that monitoring unseasonal above-normal ET activities can provide early hints of potential flash drought development. Second, four weeks before drought onset, three-month SPIs were mostly in the range between 0 and −0.8, except a few areas (Figure 10d), indicating that P deficit is a necessary component for flash drought to occur, but large deficit is not required. Third, although seven-day SSMIs tended to be dry four weeks before drought onset, some areas (e.g., Montana) could still have above-normal SM prior to the swift development (Figure 11d). This feature makes SM less favorable to be used as a primary predictor for flash drought because it can be wet or dry before drought onset. Lastly, for all three drought indices, the conditions quickly deteriorated in three months (Figure 9a, Figure 10a and Figure 11a) for flash drought events. Nevertheless, they declined in different rates during the fast-development phase. Although ET is a small quantity, its standardized index (seven-day SETI) had the largest rates of change in four weeks in some areas (Figure 9b). Comparing to the other two drought indices, seven-day SSMIs tended to have smaller rates of change in four weeks (Figure 11b).
These results are consistent with the analysis of selected flash droughts and further support the findings from the previous section. From this analysis, we can characterize a typical flash drought event, while keeping in mind that many factors can affect drought development under various situations and contribute to different flavors of flash drought. About three months before flash drought onset, above-normal ET (due to anomalously high temperatures, winds, and/or incoming radiation) is presented. Before flash drought onset, three-month SPIs are mostly below normal, but P deficits do not need to be large. SM can be wet or dry before drought onset, although below-normal SM will enhance odds for flash drought development. Most critically, large rates of change in ET occur during the fast-development phase. Therefore, closely monitoring rapid changes in ET, along with P and SM conditions, can provide early warnings of potential flash drought development.
7. Summary and Conclusions
In this study, we employ a rate-of-change approach and define a flash drought event as a drought event with greater than or equal to two categories degradation in a four-week period. We have examined flash drought characteristics using historical USDM and NLDAS-2 data. Unlike conventional drought, which can occur year-round and everywhere in the United States, there are preferred seasons and regions for flash drought to occur, mostly in the warm season and over the central United States. In contrast to conventional, slowly evolving drought, mainly driven by precipitation deficits, the spatial and temporal patterns of flash drought occurrence over the CONUS correspond to ET activities, suggesting that ET processes may be a major mechanism responsible for the rapid intensification of drought conditions. Widespread flash drought over the United States is largely correlated with La Niña episodes. ENSO has been known to have strong connections to drought over the United States and around the world [34,35,36,37]. It also plays an important role in widespread flash drought development over the United States.
To further investigate the causes leading to swift drought development, we have analyzed the antecedent conditions and evolution of five selected flash droughts using NLDAS-2 data. Overall, we found that all five droughts had sudden decreases in ET anomaly over the drought regions before onset. We also noticed sharp declines in soil moisture anomaly associated with the sudden decreases in ET anomaly. Temperatures during the development periods were warmer than normal, due to heatwaves in the regions, and the three-month Standardized Precipitation Indexes were negative for all five droughts. These results, consistent with the findings from the composite analysis and by others [7,10], suggest that closely monitoring rapid changes in ET (a responding variable to temperature), along with soil moisture and precipitation conditions, can provide early warnings of flash drought development.
Although the term “flash drought” is relatively new in the literature, it occurs more often than the common perception. Flash droughts can cause major agricultural losses if they are not predicted and detected in a timely manner, and the prediction of the onset of such events on subseasonal timescales is of critical importance for impact assessment, disaster mitigation, and loss prevention. One core mission of CPC is to issue Monthly Drought Outlooks and deliver subseasonal drought prediction information to the public. In this study, we have identified ET as a primary natural precursor to predict flash drought development. In subsequent research, we will utilize the knowledge gained from this study to develop a flash drought prediction tool to advance our ability to forecast these events.
Author Contributions
Conceptualization, L.G.C.; methodology, L.G.C.; software, L.G.C., A.H., and R.T.; validation, D.M. and R.T.; formal analysis, L.G.C.; investigation, L.G.C.; resources, J.G.; data curation, D.M., R.T., and A.A.; writing—original draft preparation, L.G.C.; writing—review and editing, A.H., A.A., and D.M.; visualization, L.G.C.; supervision, J.G.; project administration, J.G.; funding acquisition, J.G.
Funding
This research was funded by the National Oceanic and Atmospheric Administration, grant number NA14NES4320003, to the Cooperative Institute for Climate and Satellites at the University of Maryland (CICS–MD).
Acknowledgments
We would like to thank four anonymous reviewers for their thorough comments and wonderful suggestions to help improve the manuscript. This research is a part of White House Office of Science and Technology Policy initiatives. Funding support from NOAA/NWS Office of Science and Technology Integration is greatly appreciated.
Conflicts of Interest
The authors declare no conflict of interest. The funders had no role in the design of the study; in the collection, analyses, or interpretation of data; in the writing of the manuscript; or in the decision to publish the results.
References
- Svoboda, M.; LeComte, D.; Hayes, M.; Heim, R.; Gleason, K.; Angel, J.; Rippey, B.; Tinker, R.; Palecki, M.; Stooksbury, D.; et al. The Drought Monitor. Bull. Amer. Meteor. Soc. 2002, 83, 1181–1190. [Google Scholar] [CrossRef]
- Otkin, J.A.; Anderson, M.C.; Hain, C.; Svoboda, M.; Johnson, D.; Mueller, R.; Tadesse, T.; Wardlow, B.; Brown, J. Assessing the evolution of soil moisture and vegetation conditions during the 2012 United States flash drought. Agric. For. Meteor. 2016, 218–219, 230–242. [Google Scholar] [CrossRef]
- NOAA National Centers for Environmental Information (NCEI), 2019: U.S. Billion-Dollar Weather and Climate Disasters. Available online: https://www.ncdc.noaa.gov/billions/ (accessed on 25 July 2019).
- Hunt, E.; Hubbard, K.G.; Wilhite, D.A.; Arkebauer, T.J.; Dutcher, A.L. The development and evaluation of a soil moisture index. Int. J. Climatol. 2009, 29, 747–759. [Google Scholar] [CrossRef]
- Mo, K.C.; Lettenmaier, D.P. Heat wave flash droughts in decline. Geophys. Res. Lett. 2015, 42, 2823–2829. [Google Scholar] [CrossRef]
- Mo, K.C.; Lettenmaier, D.P. Precipitation deficit flash droughts over the United States. J. Hydrometeor. 2016, 17, 1169–1184. [Google Scholar] [CrossRef]
- Otkin, J.A.; Anderson, M.C.; Hain, C.; Mladenova, I.; Basara, J.; Svoboda, M. Examining rapid onset drought development using the thermal infrared-based evaporative stress index. J. Hydrometeor. 2013, 14, 1057–1074. [Google Scholar] [CrossRef]
- Otkin, J.A.; Anderson, M.C.; Hain, C.; Svoboda, M. Examining the relationship between drought development and rapid changes in the evaporative stress index. J. Hydrometeor. 2014, 15, 938–956. [Google Scholar] [CrossRef]
- Christian, J.I.; Basara, J.B.; Otkin, J.A.; Hunt, E.D.; Wakefield, R.A.; Flanagan, P.X.; Xiao, X. A Methodology for Flash Drought Identification: Application of Flash Drought Frequency across the United States. J. Hydrometeor. 2019, 20, 833–846. [Google Scholar] [CrossRef] [Green Version]
- Otkin, J.A.; Svoboda, M.; Hunt, E.D.; Ford, T.W.; Anderson, M.C.; Hain, C.; Basara, J.B. Flash Droughts: A Review and Assessment of the Challenges Imposed by Rapid-Onset Droughts in the United States. Bull. Am. Meteor. Soc. 2018, 99, 911–919. [Google Scholar] [CrossRef]
- Hoell, A.; Perlwitz, J.; Dewes, C.; Wolter, K.; Rangwala, I.; Quan, X.; Eischeid, J. Anthropogenic Contributions to the Intensity of the 2017 United States Northern Great Plains Drought. Bull. Am. Meteor. Soc. 2019, 100, S19–S24. [Google Scholar] [CrossRef] [Green Version]
- Wang, H.; Schubert, S.D.; Koster, R.D.; Chang, Y. Attribution of the 2017 Northern High Plains Drought. Bull. Am. Meteor. Soc. 2019, 100, S25–S29. [Google Scholar] [CrossRef] [Green Version]
- Maurer, E.P.; Wood, A.W.; Adam, J.C.; Lettenmaier, D.P.; Nijssen, B. A Long-Term Hydrologically Based Dataset of Land Surface Fluxes and States for the Conterminous United States. J. Clim. 2002, 15, 3237–3251. [Google Scholar] [CrossRef]
- Xia, Y.; Mitchell, K.; Ek, M.; Sheffield, J.; Cosgrove, B.; Wood, E.; Luo, L.; Alonge, C.; Wei, H.; Meng, J.; et al. Continental-scale water and energy flux analysis and validation for the North American Land Data Assimilation System project phase 2 (NLDAS-2): 1. Intercomparison and application of model products. J. Geophys. Res. 2012, 117, D03109. [Google Scholar] [CrossRef]
- Xia, Y.; Mitchell, K.; Ek, M.; Cosgrove, B.; Sheffield, J.; Luo, L.; Alonge, C.; Wei, H.; Meng, J.; Livneh, B.; et al. Continental-scale water and energy flux analysis and validation for the North American Land Data Assimilation System project phase 2 (NLDAS-2): 2. Validation of model-simulated streamflow. J. Geophys. Res. 2012, 117, D03110. [Google Scholar] [CrossRef]
- Chen, M.; Shi, W.; Xie, P.; Silva, V.B.S.; Kousky, V.E.; Higgins, R.W.; Janowiak, J.E. Assessing objective techniques for gauge-based analyses of global daily precipitation. J. Geophys. Res. 2008, 113, D04110. [Google Scholar] [CrossRef]
- Mesinger, F.; DiMego, G.; Kalnay, E.; Mitchell, K.; Shafran, P.C.; Ebisuzaki, W.; Jović, D.; Woollen, J.; Rogers, E.; Berbery, E.H.; et al. North American Regional Reanalysis. Bull. Am. Meteorol. Soc. 2006, 87, 343–360. [Google Scholar] [CrossRef] [Green Version]
- Mitchell, K.E.; Lohmann, D.; Houser, P.R.; Wood, E.F.; Schaake, J.C.; Robock, A.; Cosgrove, B.A.; Sheffield, J.; Duan, Q.; Luo, L.; et al. The multi-institution North American Land Data Assimilation System (NLDAS): Utilizing multiple GCIP products and partners in a continental distributed hydrological modeling system. J. Geophys. Res. 2004, 109, D07S90. [Google Scholar] [CrossRef]
- Koster, R.; Suarez, M. The components of the SVAT scheme and their effects on a GCM’s hydrological cycle. Adv. Water Resour. 1994, 17, 61–78. [Google Scholar] [CrossRef]
- Koster, R.; Suarez, M. Energy and Water Balance Calculations in the Mosaic LSM; NASA Technical Memorandum-104606; NASA: Greenbelt, MD, USA, 1996; Volume 9, p. 60.
- Liang, X.; Lettenmaier, D.P.; Wood, E.F.; Burges, S.J. A Simple hydrologically Based Model of Land Surface Water and Energy Fluxes for GSMs. J. Geophys. Res. 1994, 99, 14415–14428. [Google Scholar] [CrossRef]
- Liang, X.; Lettenmaier, D.P.; Wood, E.F. One-dimensional Statistical Dynamic Representation of Subgrid Spatial Variability of Precipitation in the Two-Layer Variable Infiltration Capacity Model. J. Geophys. Res. 1996, 101, 21403–21422. [Google Scholar] [CrossRef]
- Burnash, R.J.C.; Ferral, R.L.; McGuire, R.A. A Generalized Streamflow Simulation System: Conceptual Modeling for Digital Computer; U.S. Department of Commerce; National Weather Service; State of California, Department of Water Resources: Sacramento, CA, USA, 1973.
- Burnash, R.J.C. The NWS River Forecast System–Catchment Modeling, in Computer Models of Watershed Hydrology; Singh, V.P., Ed.; Water Resources Publications: Colorado, CO, USA, 1995; pp. 311–366. [Google Scholar]
- Mo, K.C.; Shukla, S.; Lettenmaier, D.P.; Chen, L.-C. Do Climate Forecast System (CFSv2) forecasts improve seasonal soil moisture prediction? Geophys. Res. Lett. 2012, 39, L23703. [Google Scholar] [CrossRef]
- Kousky, V.E.; Higgins, R.W. An Alert Classification System for Monitoring and Assessing the ENSO Cycle. Wea. Forecast. 2007, 22, 353–371. [Google Scholar] [CrossRef]
- Ropelewski, C.F.; Halpert, M.S. North American Precipitation and Temperature Patterns Associated with the El Niño/Southern Oscillation (ENSO). Mon. Wea. Rev. 1986, 114, 2352–2362. [Google Scholar] [CrossRef]
- Chen, L.-C.; Van den Dool, H.; Becker, E.; Zhang, Q. ENSO Precipitation and Temperature Forecasts in the North American Multimodel Ensemble: Composite Analysis and Validation. J. Clim. 2017, 30, 1103–1125. [Google Scholar] [CrossRef]
- Hoerling, M.; Eischeid, J.; Kumar, A.; Leung, R.; Mariotti, A.; Mo, K.; Schubert, S.; Seager, R. Causes and Predictability of the 2012 Great Plains Drought. Bull. Am. Meteor. Soc. 2014, 95, 269–282. [Google Scholar] [CrossRef] [Green Version]
- Sun, Y.; Fu, R.; Dickinson, R.; Joiner, J.; Frankenberg, C.; Gu, L.; Xia, Y.; Fernando, N. Drought onset mechanisms revealed by satellite solarinduced chlorophyll fluorescence: Insights from two contrasting extreme events. J. Geophys. Res. Biogeosci. 2015, 120. [Google Scholar] [CrossRef]
- Rippey, B.R. The U.S. Drought of 2012. Weather Clim. Extremes 2015, 10, 57–64. [Google Scholar] [CrossRef]
- Wolf, S.; Keenan, T.F.; Fisher, J.B.; Baldocchi, D.D.; Desai, A.R.; Richardson, A.D.; Scott, R.L.; Law, B.E.; Litvak, M.E.; Brunsell, N.A.; et al. Warm spring reduced carbon cycle impact of the 2012 US summer drought. Proc. Natl. Acad. Sci. USA 2016, 113, 5880–5885. [Google Scholar] [CrossRef] [Green Version]
- McKee, T.B.; Doesken, N.J.; Kliest, J. The Relationship of Drought Frequency and Duration to Time Scales. In Proceedings of the 8th Conference on Applied Climatology, Anaheim, CA, USA, 17–22 January 1993; pp. 179–184. [Google Scholar]
- Janicot, S.; Moron, V.; Fontaine, B. Sahel droughts and ENSO dynamics. Geophys. Res. Lett. 1996, 23, 515–518. [Google Scholar] [CrossRef]
- Rajagopalan, B.; Cook, E.; Lall, U.; Ray, B.K. Spatiotemporal Variability of ENSO and SST Teleconnections to Summer Drought over the United States during the Twentieth Century. J. Clim. 2000, 13, 4244–4255. [Google Scholar] [CrossRef]
- Barlow, M.; Nigam, S.; Berbery, E.H. ENSO, Pacific Decadal Variability, and U.S. Summertime Precipitation, Drought, and Stream Flow. J. Clim. 2001, 14, 2105–2128. [Google Scholar] [CrossRef] [Green Version]
- Mo, K.C.; Schemm, J.E.; Yoo, S. Influence of ENSO and the Atlantic Multidecadal Oscillation on Drought over the United States. J. Clim. 2009, 22, 5962–5982. [Google Scholar] [CrossRef] [Green Version]
Figure 1.
Maps of drought occurrence frequency (in percentage) based on rasterized 2000–2017 U.S. Drought Monitor (USDM) data for (a) January, (b) February, (c) March, (d) April, (e) May, (f) June, (g) July, (h) August, (i) September, (j) October, (k) November, and (l) December.
Figure 1.
Maps of drought occurrence frequency (in percentage) based on rasterized 2000–2017 U.S. Drought Monitor (USDM) data for (a) January, (b) February, (c) March, (d) April, (e) May, (f) June, (g) July, (h) August, (i) September, (j) October, (k) November, and (l) December.
Figure 2.
Maps of flash drought occurrence frequency (in percentage) based on rasterized 2000–2017 USDM data for (a) January, (b) February, (c) March, (d) April, (e) May, (f) June, (g) July, (h) August, (i) September, (j) October, (k) November, and (l) December.
Figure 2.
Maps of flash drought occurrence frequency (in percentage) based on rasterized 2000–2017 USDM data for (a) January, (b) February, (c) March, (d) April, (e) May, (f) June, (g) July, (h) August, (i) September, (j) October, (k) November, and (l) December.

Figure 3.
Monthly evapotranspiration climatology (mm/day) based on 1981–2010 North American Land Data Assimilation System (NLDAS-2) data.
Figure 3.
Monthly evapotranspiration climatology (mm/day) based on 1981–2010 North American Land Data Assimilation System (NLDAS-2) data.

Figure 4.
Monthly temperature climatology (°C) based on 1981–2010 NLDAS-2 data.

Figure 5.
Time series of the National Oceanic and Atmospheric Administration’s Oceanic Nino Index (top) and flash drought coverage over the contiguous United States (bottom) from 2000 to 2017.
Figure 5.
Time series of the National Oceanic and Atmospheric Administration’s Oceanic Nino Index (top) and flash drought coverage over the contiguous United States (bottom) from 2000 to 2017.

Figure 6.
USDM maps on July 4 (top left), August 1 (top right), September 5 (bottom left), and October 3 (bottom right) in Year 2000.
Figure 6.
USDM maps on July 4 (top left), August 1 (top right), September 5 (bottom left), and October 3 (bottom right) in Year 2000.

Figure 7.
USDM change maps for the periods from June 6 to July 4 (a), July 4 to August 1 (b), August 1 to September 5 (c), and September 5 to October 3 (d) in Year 2000. Areas without drought are shown in white.
Figure 7.
USDM change maps for the periods from June 6 to July 4 (a), July 4 to August 1 (b), August 1 to September 5 (c), and September 5 to October 3 (d) in Year 2000. Areas without drought are shown in white.

Figure 8.
Time series of areal averaged three-month Standardized Precipitation Index (first row), seven-day mean temperature anomaly (second row), seven-day mean evapotranspiration anomaly (third row), and seven-day mean soil moisture anomaly (fourth row) from 1 January 2000 to 31 December 2000. The time period within the vertical purple lines is the fast-development period.

Figure 9.
Composites of seven-day Standardized Evapotranspiration Index for (a) differences between flash drought conditions and the conditions three months ago, (b) differences between flash drought conditions and the conditions four weeks ago, (c) the conditions three months before drought onset, (d) the conditions four weeks before drought onset, and (e) the conditions under flash drought onset. Areas with less than 1% flash drought occurrence are shown in grey.
Figure 10.
Composites of three-month Standardized Precipitation Index for (a) differences between flash drought conditions and the conditions three months ago, (b) differences between flash drought conditions and the conditions four weeks ago, (c) the conditions three months before drought onset, (d) the conditions four weeks before drought onset, and (e) the conditions under flash drought onset. Areas with less than 1% flash drought occurrence are shown in grey.

Figure 11.
Composites of seven-day Standardized Soil Moisture Index for (a) differences between flash drought conditions and the conditions three months ago, (b) differences between flash drought conditions and the conditions four weeks ago, (c) the conditions three months before drought onset, (d) the conditions four weeks before drought onset, and (e) the conditions under flash drought onset. Areas with less than 1% flash drought occurrence are shown in grey.


Table 1.
Location and time period of five selected flash droughts used in this study.
| No. | Drought Year | Fast-Development Period | Location | Lat-Lon Box |
|---|---|---|---|---|
| 1 | 2000 | 4 July to 5 September | Southern U.S. | 28–37° N; 85–106° W |
| 2 | 2003 | 1 July to 2 September | Central U.S. | 32–47° N; 88–104° W |
| 3 | 2006 | 6 June to 1 August | Northern Plains | 40–49° N; 89–117° W |
| 4 | 2007 | 3 July to 7 August | Northern Rocky | 42–49° N; 108–118° W |
| 5 | 2012 | 1 May to 7 August | Central U.S. | 33–47° N; 80–114° W |
Table 2.
Summary of antecedent conditions prior to drought onset and features during the fast-development phase for the five selected flash droughts.
Table 2.
Summary of antecedent conditions prior to drought onset and features during the fast-development phase for the five selected flash droughts.
| Drought No. | Three-month SPI (Sharp Decline?) | T Anomaly (Sharp Decline?) | ET Anomaly (Sharp Decline?) | SM Anomaly (Sharp Decline?) |
|---|---|---|---|---|
| a. Within 3 Months before Drought Onset | ||||
| 1 | BN to NN (N) | AN (N) | BN (N) | BN (N) |
| 2 | AN (N) | NN (N) | AN (N) | NN (N) |
| 3 | AN (N) | AN (N) | AN (N) | AN (Y) |
| 4 | BN (N) | AN (N) | AN (N) | AN to BN (Y) |
| 5 | NN (N) | AN (N) | AN (N) | BN (N) |
| b. During the Fast-Development Phase | ||||
| 1 | BN (Y) | AN (N) | BN (Y) | BN (Y) |
| 2 | AN to BN (Y) | AN (N) | BN (Y) | BN (Y) |
| 3 | BN (Y) | AN (N) | AN to BN (Y) | BN (Y) |
| 4 | BN (N) | AN (N) | AN to BN (Y) | BN (Y) |
| 5 | BN (Y) | AN (N) | AN to BN (Y) | BN (Y) |
Note: AN—above normal, NN—near normal, and BN—below normal. Inside parentheses: Y—yes, and N—no.
© 2019 by the authors. Licensee MDPI, Basel, Switzerland. This article is an open access article distributed under the terms and conditions of the Creative Commons Attribution (CC BY) license (http://creativecommons.org/licenses/by/4.0/).
Share and Cite
MDPI and ACS Style
Chen, L.G.; Gottschalck, J.; Hartman, A.; Miskus, D.; Tinker, R.; Artusa, A. Flash Drought Characteristics Based on U.S. Drought Monitor. Atmosphere 2019, 10, 498. https://doi.org/10.3390/atmos10090498
AMA Style
Chen LG, Gottschalck J, Hartman A, Miskus D, Tinker R, Artusa A. Flash Drought Characteristics Based on U.S. Drought Monitor. Atmosphere. 2019; 10(9):498. https://doi.org/10.3390/atmos10090498
Chicago/Turabian StyleChen, L. Gwen, Jon Gottschalck, Adam Hartman, David Miskus, Rich Tinker, and Anthony Artusa. 2019. "Flash Drought Characteristics Based on U.S. Drought Monitor" Atmosphere 10, no. 9: 498. https://doi.org/10.3390/atmos10090498
Note that from the first issue of 2016, this journal uses article numbers instead of page numbers. See further details here.