1. Introduction
In recent years, environmental authorities have been putting much effort into collecting air quality data with a focus on particulate matter (PM), especially in the size range of PM
10 and PM
2.5. Most of the used PM monitoring equipment reveals only the mass of ultrafine particles (UFP), not taking into account the particular number concentration or size distribution. The composition of sizes is important though, as the biological interaction in the human respiratory tract increases with the decrease of particle size. Inhaled aerosol particles with a diameter smaller than 5 μm can reach virtually all alveoli of the lung [
1]. Ultrafine particles have a relatively large area compared to larger inhaled particles; this provides the opportunity for surface chemistry to have a profound effect [
2].
Air pollution has been linked directly to health effects for many years. Its impact on human well-being is of great relevance, depending not only on the quantity of a pollutant but additionally on its particle size. Particulate air pollution influences a range of symptoms in humans; asthma exacerbation, increased respiratory symptoms, decreased lung function, increased medication use, and increased hospital admissions [
3,
4]. Studies revealed positive association with lung cancer and cardiopulmonary disease; mortality was most strongly associated with air pollution containing fine particulates [
5]. Andersen
et al. [
6] found that adverse health effects of particulate matter on cardiovascular disease- and respiratory disease-related hospital admissions in the elderly were mainly mediated by PM
10 and accumulation mode particles. In contrast to fine particles, inhaled ultrafine particles seem to follow different routes in the organism [
7] and may be translocated from the respiratory tract to subsequent target organs. As deposition in the lung is inhomogeneous and depends on particle size [
8], aerosol diameter is a key factor in risk assessment. Air pollution affects health in a gender- and age-specific manner and should be considered a relevant risk factor in urban environments [
9]. In their study in downtown Milan, Cattaneo
et al. [
10] found highest exposure to UFP occurs while moving along busy streets or in their immediate proximity, either afoot or by motorized vehicles. Individuals may especially gain a substantial contribution to their daily total exposure when spending a lot of time in these highly-polluted environments.
However, not only exposure while being outside is a risk factor, as outdoor pollution is also of importance for indoor exposure. In a study in Athens, PM
10 and PM
2.5 concentrations exhibited increased short-term variability with high peak concentrations during morning and afternoon/night rush hours. Indoor and outdoor concentrations are highly correlated (r = 0.84 for PM
10, r = 0.96 for PM
2.5); the calculated indoor-to-outdoor concentrations ratios (I/O) indicate that indoor concentration levels are mainly affected by PM of outdoor origin. Diurnal cycles of PM concentration indoors follow the outdoor ones, with a delay of approximately 1 h [
11]. Dockery
et al. [
12] concluded that fine-particulate air pollution, or a more complex pollution mixture associated with fine particulate matter, contributes to excess mortality in certain U.S. cities. According to the latest data from the European Environmental Agency (EEA) data, since 1997, up to 50% of Europe's urban population may have been exposed to concentrations of particulate matter above the EU limit set to protect human health. It has been estimated that PM
2.5 in air has reduced the statistical life expectancy for humans in the EU by more than eight months [
13]. Recently the European Commission has taken this into account, trying to regulate particle number based limit values [
14].
The importance and significance of monitoring air quality requires tools for authorities to act accordingly. Considering the consequences of the smallest nano-particles observed in this study, authorities should take the lead by incorporating new monitoring devices that account for recent findings. Unfortunately, the challenge of monitoring the size range distribution by particle counting methods is not only a considerable complex issue but, moreover, the financial burden involved in acquiring and operating this kind of measurement equipment is still regarded as a major obstacle. While health effects do not only influence individual life qualities, they also put a financial burden on communities [
15]. Increased funding for air quality monitoring may be well invested to help prevent later cost increases in the health care sector.
The residential sector is an important source of several pollutants. Energy use by households—the burning of wood, gas, coal—is the most important source of PM
2.5 (and an important source of both SO
x and NO
x). In addition, traffic remains a major air pollutant in the European Union. Passenger cars are among the top six emitters of PM
2.5, while heavy duty vehicles are the single most important source of NO
x [
16]. With this in mind, our study encompassed several sites to monitor and compare various sources of air pollution.
This campaign investigated particle number concentrations in the range below 1 µm at various collecting sites. The many influences particulate matter of this size can have on humans, and therefore on public health, set the focus of investigation for this research. The EPA environmental authorities of Salzburg, Austria, who are well aware of the health risks particulate matter can pose, were interested in an UFP data inventory of the city and county of Salzburg, to be prepared for possible future changes in legislation. A proposal from the European Commission is expected to include stricter emission upper limits for 2020, and for the first time, national limits on the emissions of fine particulate matter PM
2.5 (NEC Directive status report 2009) [
17]. As authorities need to assess risks fast and if possible without the need of additional resources, we also investigated the relevance of in-place air quality monitoring for UFP concentrations.
Therefore, the primary objectives of this study were (i) to examine the particle number concentration and particle size distributions at the different locations, and (ii) reveal whether environmental data (especially PM10 and/or NOx, NO2, CO) has significance for actual UFP burden and could serve as proxy-indicators for data retrieved by the particle counting method.
2. Experimental Section
In order to comply with the objectives, for both the rural as well as the urban sites, a heavy traffic site within a low traffic/residential area were sampled. Outside of urban Salzburg, a rural hillside location (Haunsberg, 30 km north of Salzburg, altitude 800 m a.s.l.) served as a background observation site, while a location at a major motorway (A10 = E55, 30 km south of Salzburg) was chosen for the heavy traffic site. The downtown sites were split into a residential area with little traffic (Lehen, northern sector) and a traffic roundabout on a main city intersection (Rudolfsplatz, downtown city center). Our investigation also compared the effects of high speed traffic (motorway) to low speed traffic (downtown), while being exposed to comparable vehicle frequency. All measurements took place at locations fitted with existing environmental monitoring stations of local environmental authorities.
To monitor the particle size inventory, a SMPS—scanning mobility particle sizer (Grimm, model 5400)—was used. It combines a CPC (Condensation Particle Counter) and a DMA (Differential Mobility Analyzer). Measurements were taken in a size range between 11.1 nm–1083.3 nm (large DMA) and 5.5 nm to 354 nm (small DMA), respectively. The SMPS was operated in the “slow scan” mode, allowing a single measurement cycle over all size classes to be performed in approximately 8 min for the large DMA and approximately 5 min for the small DMA, working with a 0.3 l/s air flow. The SMPS was set up at existing sampling sites with the other equipment, collecting air samples from the same locality as the remaining instruments.
In order to detect daily fluctuations, measurements at each site were carried out 24 h a day for several successive days, including weekends. One set of data was taken in summer and one in winter. Parallel to recording the UFP inventory, local authorities were constantly monitoring a range of environmental data These included: micro-climate data and air quality parameters (PM
10, NO
x, NO
2, CO), providing the raw data of these measurements to us. Each of these parameters is provided as half-hourly averages, measured in monitoring stations according to the Austrian national emission regulations [
18,
19,
20]. Standard statistic operations (ANOVA, regression analysis) were performed using Microcal Origin statistic software.
3. Results and Discussion
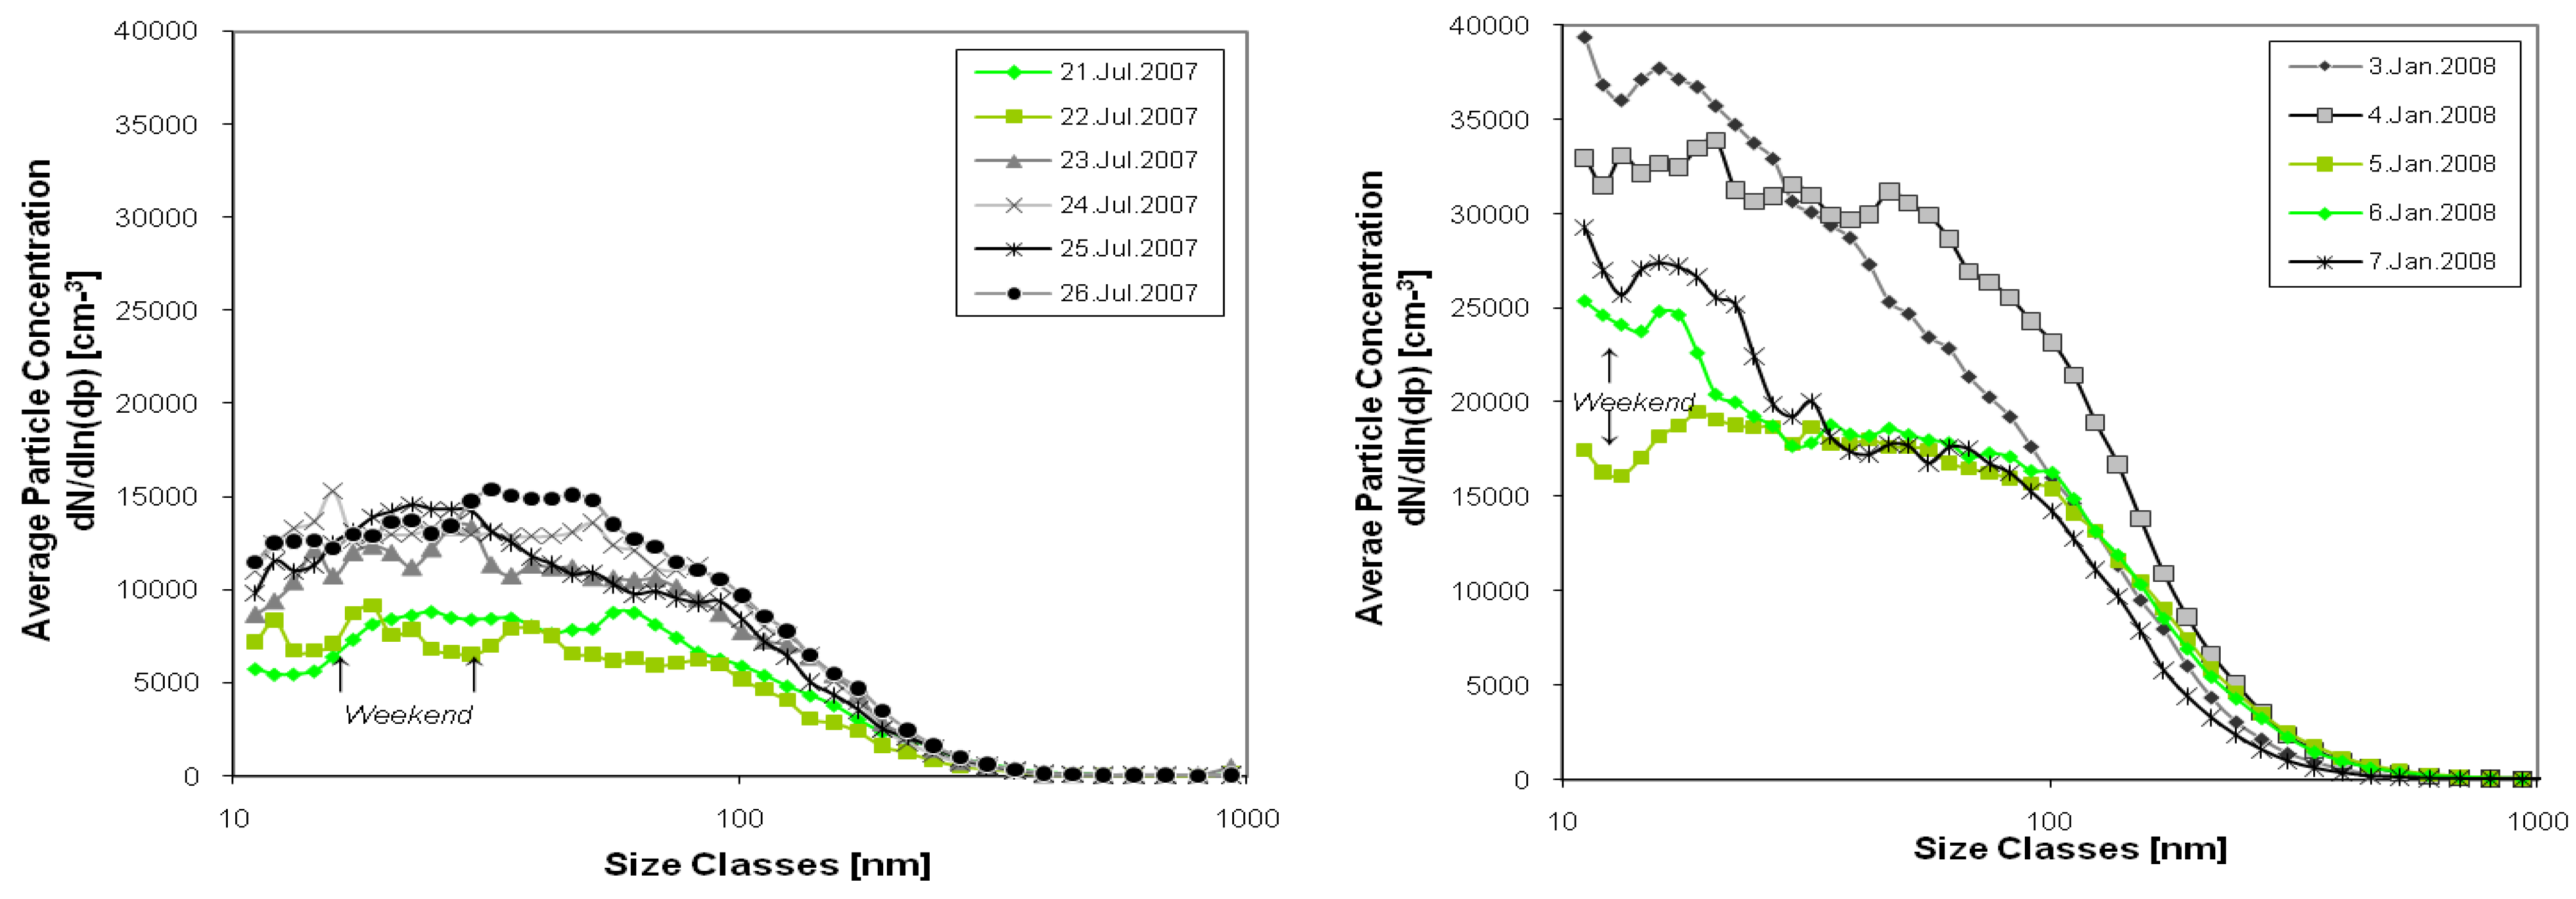
The downtown sampling site (Rudolfsplatz), with intense traffic during the week and considerably less on weekends, revealed the most intense particle loads (
Figure 1). The average daily vehicle load was found to be approximately 58,000 vehicles per day, while the average daily vehicle count along the motorway site A10 was determined to be around 50,000 vehicles per day.
The comparison of the average particle concentration shows less particle burden during summer measurements for both heavy traffic sites (
Figure 1 and
Figure 2). Also, the size distribution shows apparent differences: along the motorway, more UFP in the smallest size range appear, followed by a steep drop above 100 nm. Downtown measurements show a less steep curve along the size range with a slope dropping past 100 nm. Analysis of covariance shows that these differences in particle concentration are significant (p < 0.0001 for downtown summer/winter as well as A10 summer/winter measurements).
Figure 1.
Daily average UFP size distribution at the downtown site (Salzburg—Rudolfsplatz). Left panel: summer measurement, right panel: winter measurement. Significant drop in UFP on weekends is highlighted.
Figure 1.
Daily average UFP size distribution at the downtown site (Salzburg—Rudolfsplatz). Left panel: summer measurement, right panel: winter measurement. Significant drop in UFP on weekends is highlighted.
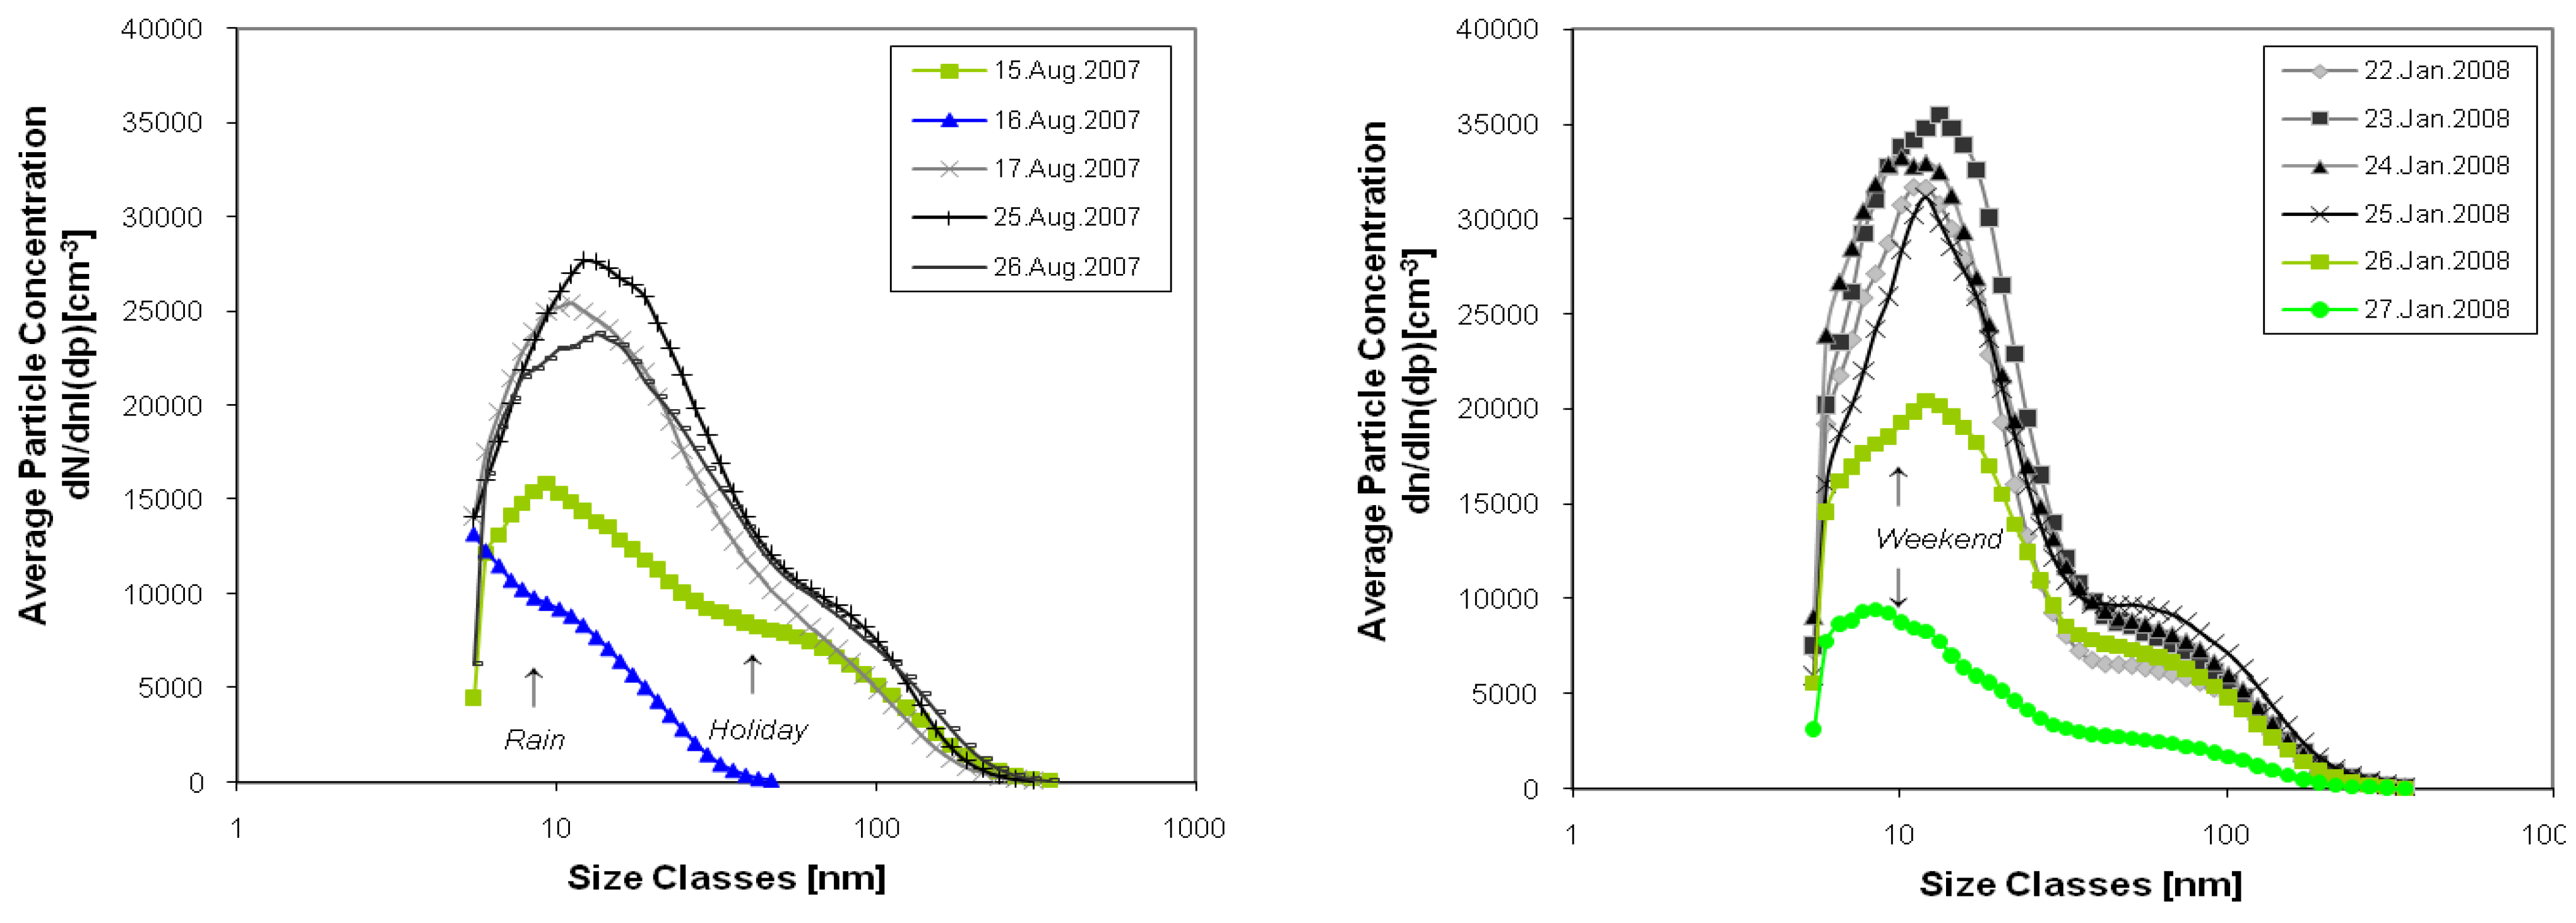
Weekdays, weekends and holidays are reflected in different curves in
Figure 2, e.g., 15 August, 26 and 27 January show a lower average particle concentration being public holidays/Sundays. 16 August—showing a very low particle concentration—was a rainy day (
Figure 2, left panel).
Comparison between slow city traffic (site Rudolfsplatz) with speeding motorway traffic (site A10) revealed a drastic shift of particle size spectrum towards the smaller particle sizes (see
Figure 1 and
Figure 2). Even though the average daily vehicles count on the motorway was slightly lower, the particle burden was significantly higher in contrast to the downtown site, showing that heavy duty traffic on motorways accounts for a high amount of UFP [
21,
22]. There was also a notable difference in the size distribution of particles depending on the season, as on this particular motorway, summer months reflect peak traffic frequency due to southbound vacation travelling. The influence of weekend/weekday and holiday traffic is visible, although the reduction of UFP on weekends is not as great as expected. The decline in particle number concentration and change in particle size distribution is most likely caused by dilution with background air [
23] and is therefore dependent on weather and wind conditions. This is more visible at the motorway site A10, as it is an open area, where weather conditions have more influence. The downtown site resembles a street-canyon, exhaust from traffic is rather stagnant where high-rising buildings along the road protect from wind and reduce air exchange.
Although the weekend curves appear not to have extensively lower particle concentrations at the downtown site, the differences are statistically significant. A one-way ANOVA was performed for downtown and A10 sites during both seasons, comparing weekend to weekdays (downtown) and weekend/holiday/rain to weekdays (A10), respectively. The means are significantly different at the 0.05 level (p < 0.0001 in all four situations).
Figure 2.
UFP size distribution of daily averages at the rural site along the motorway A10. Left panel: summer measurement, right panel: winter measurement. Significant drop of UFP on weekend/holiday and weather-influence is highlighted.
Figure 2.
UFP size distribution of daily averages at the rural site along the motorway A10. Left panel: summer measurement, right panel: winter measurement. Significant drop of UFP on weekend/holiday and weather-influence is highlighted.
At all sites, temperature and humidity data were relatively stable and did not appear to influence ultrafine particle concentrations considerably (except some light rain on August 16, which is reflected in a lower particle concentration). Wind direction and wind speed seemed to have little influence on particle concentration at sites close to highly frequented roads.
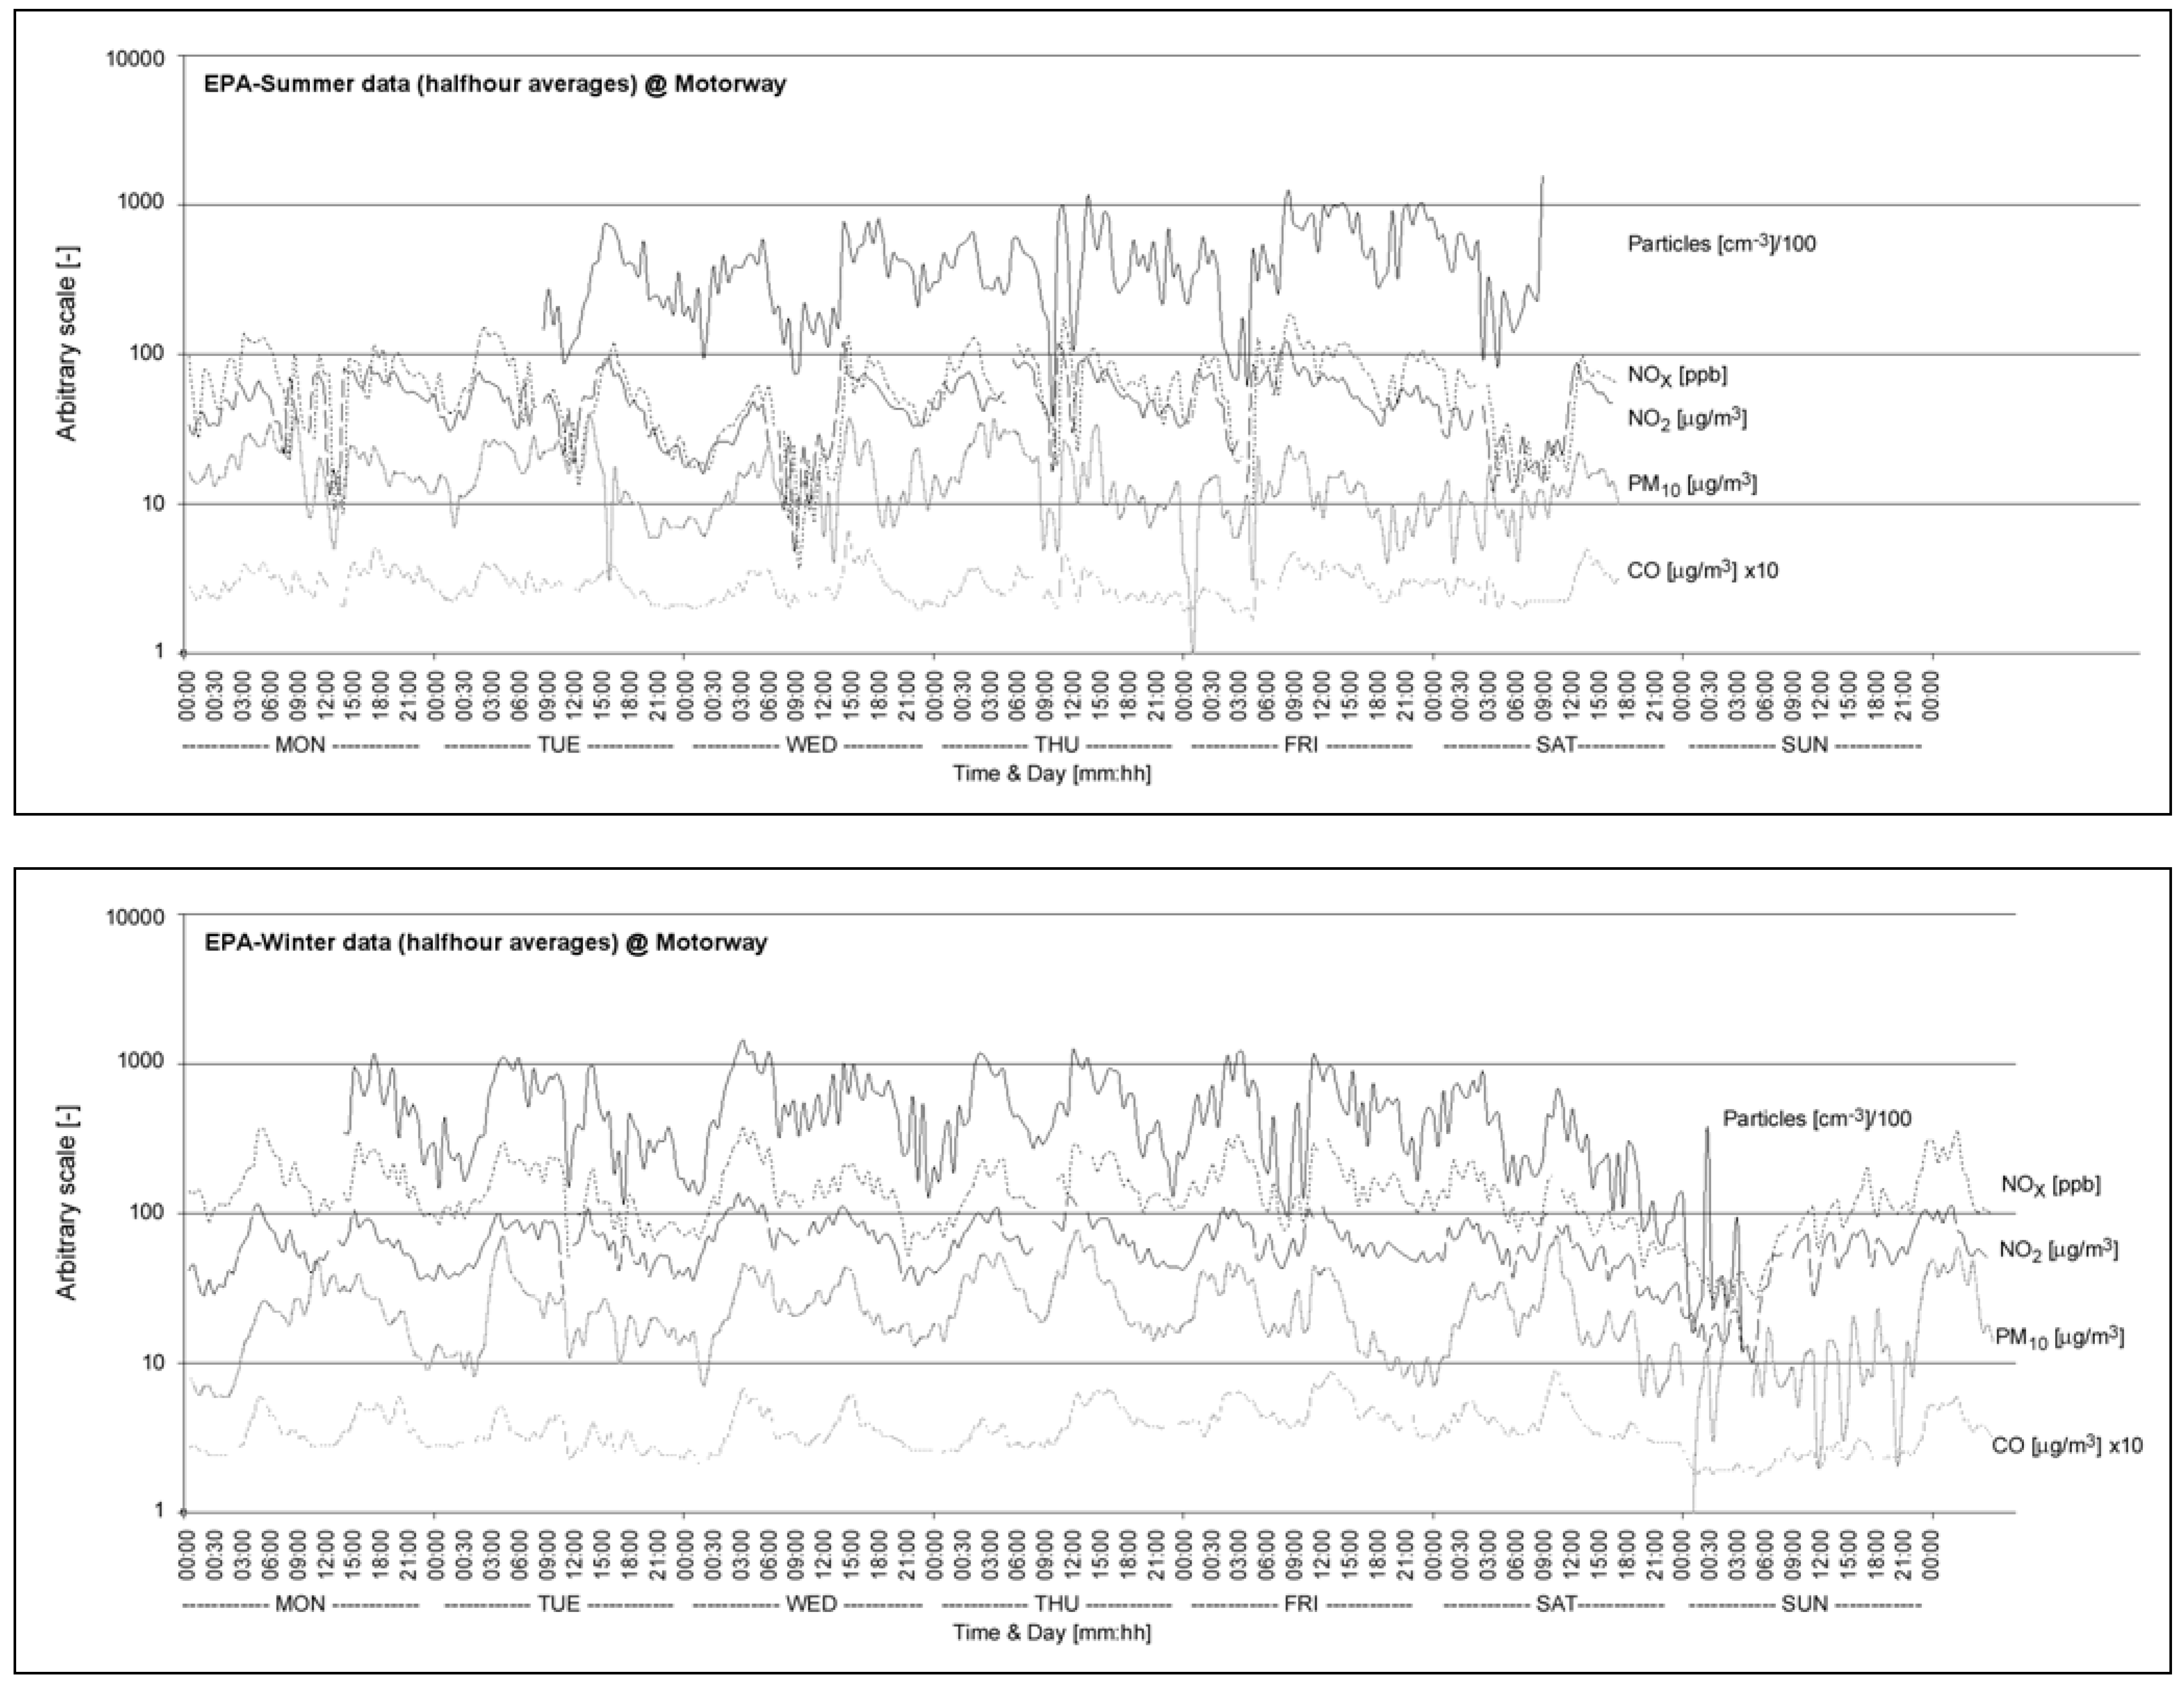
Figure 3.
Environmental data (from EPA) as a time series; recorded over several days compared with ultrafine UFP number concentration at the motorway location for summer (upper panel) and winter (lower panel) measurements.
Figure 3.
Environmental data (from EPA) as a time series; recorded over several days compared with ultrafine UFP number concentration at the motorway location for summer (upper panel) and winter (lower panel) measurements.
The monitored environmental sets of data made it possible to establish correlating trends between the nano-particle spectrum and environmental parameters PM
10, NO
X, and NO
2.
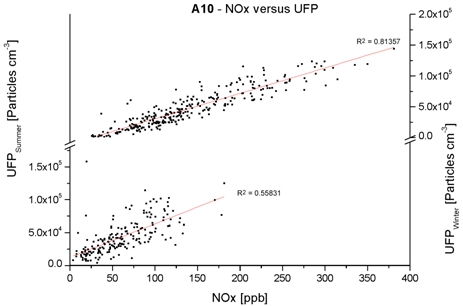
Figure 3 shows the pattern of these factors at the motorway site; the other sites show comparable trends. The display of these datasets as a time series shows apparent correlations of UFP with environmental factors, especially with NO
x and NO
2. To better estimate the extent of this relationship, scatter plots of UFP with other parameters were created to break up time lines. The scatter plot in
Figure 4 uses NO
X versus UFP data of the time series shown in
Figure 3. Statistical tools, like regression analysis, are used to estimate the correlations between data sets and are provided in
Table 1. It contains regression statistics for
Figure 3 and
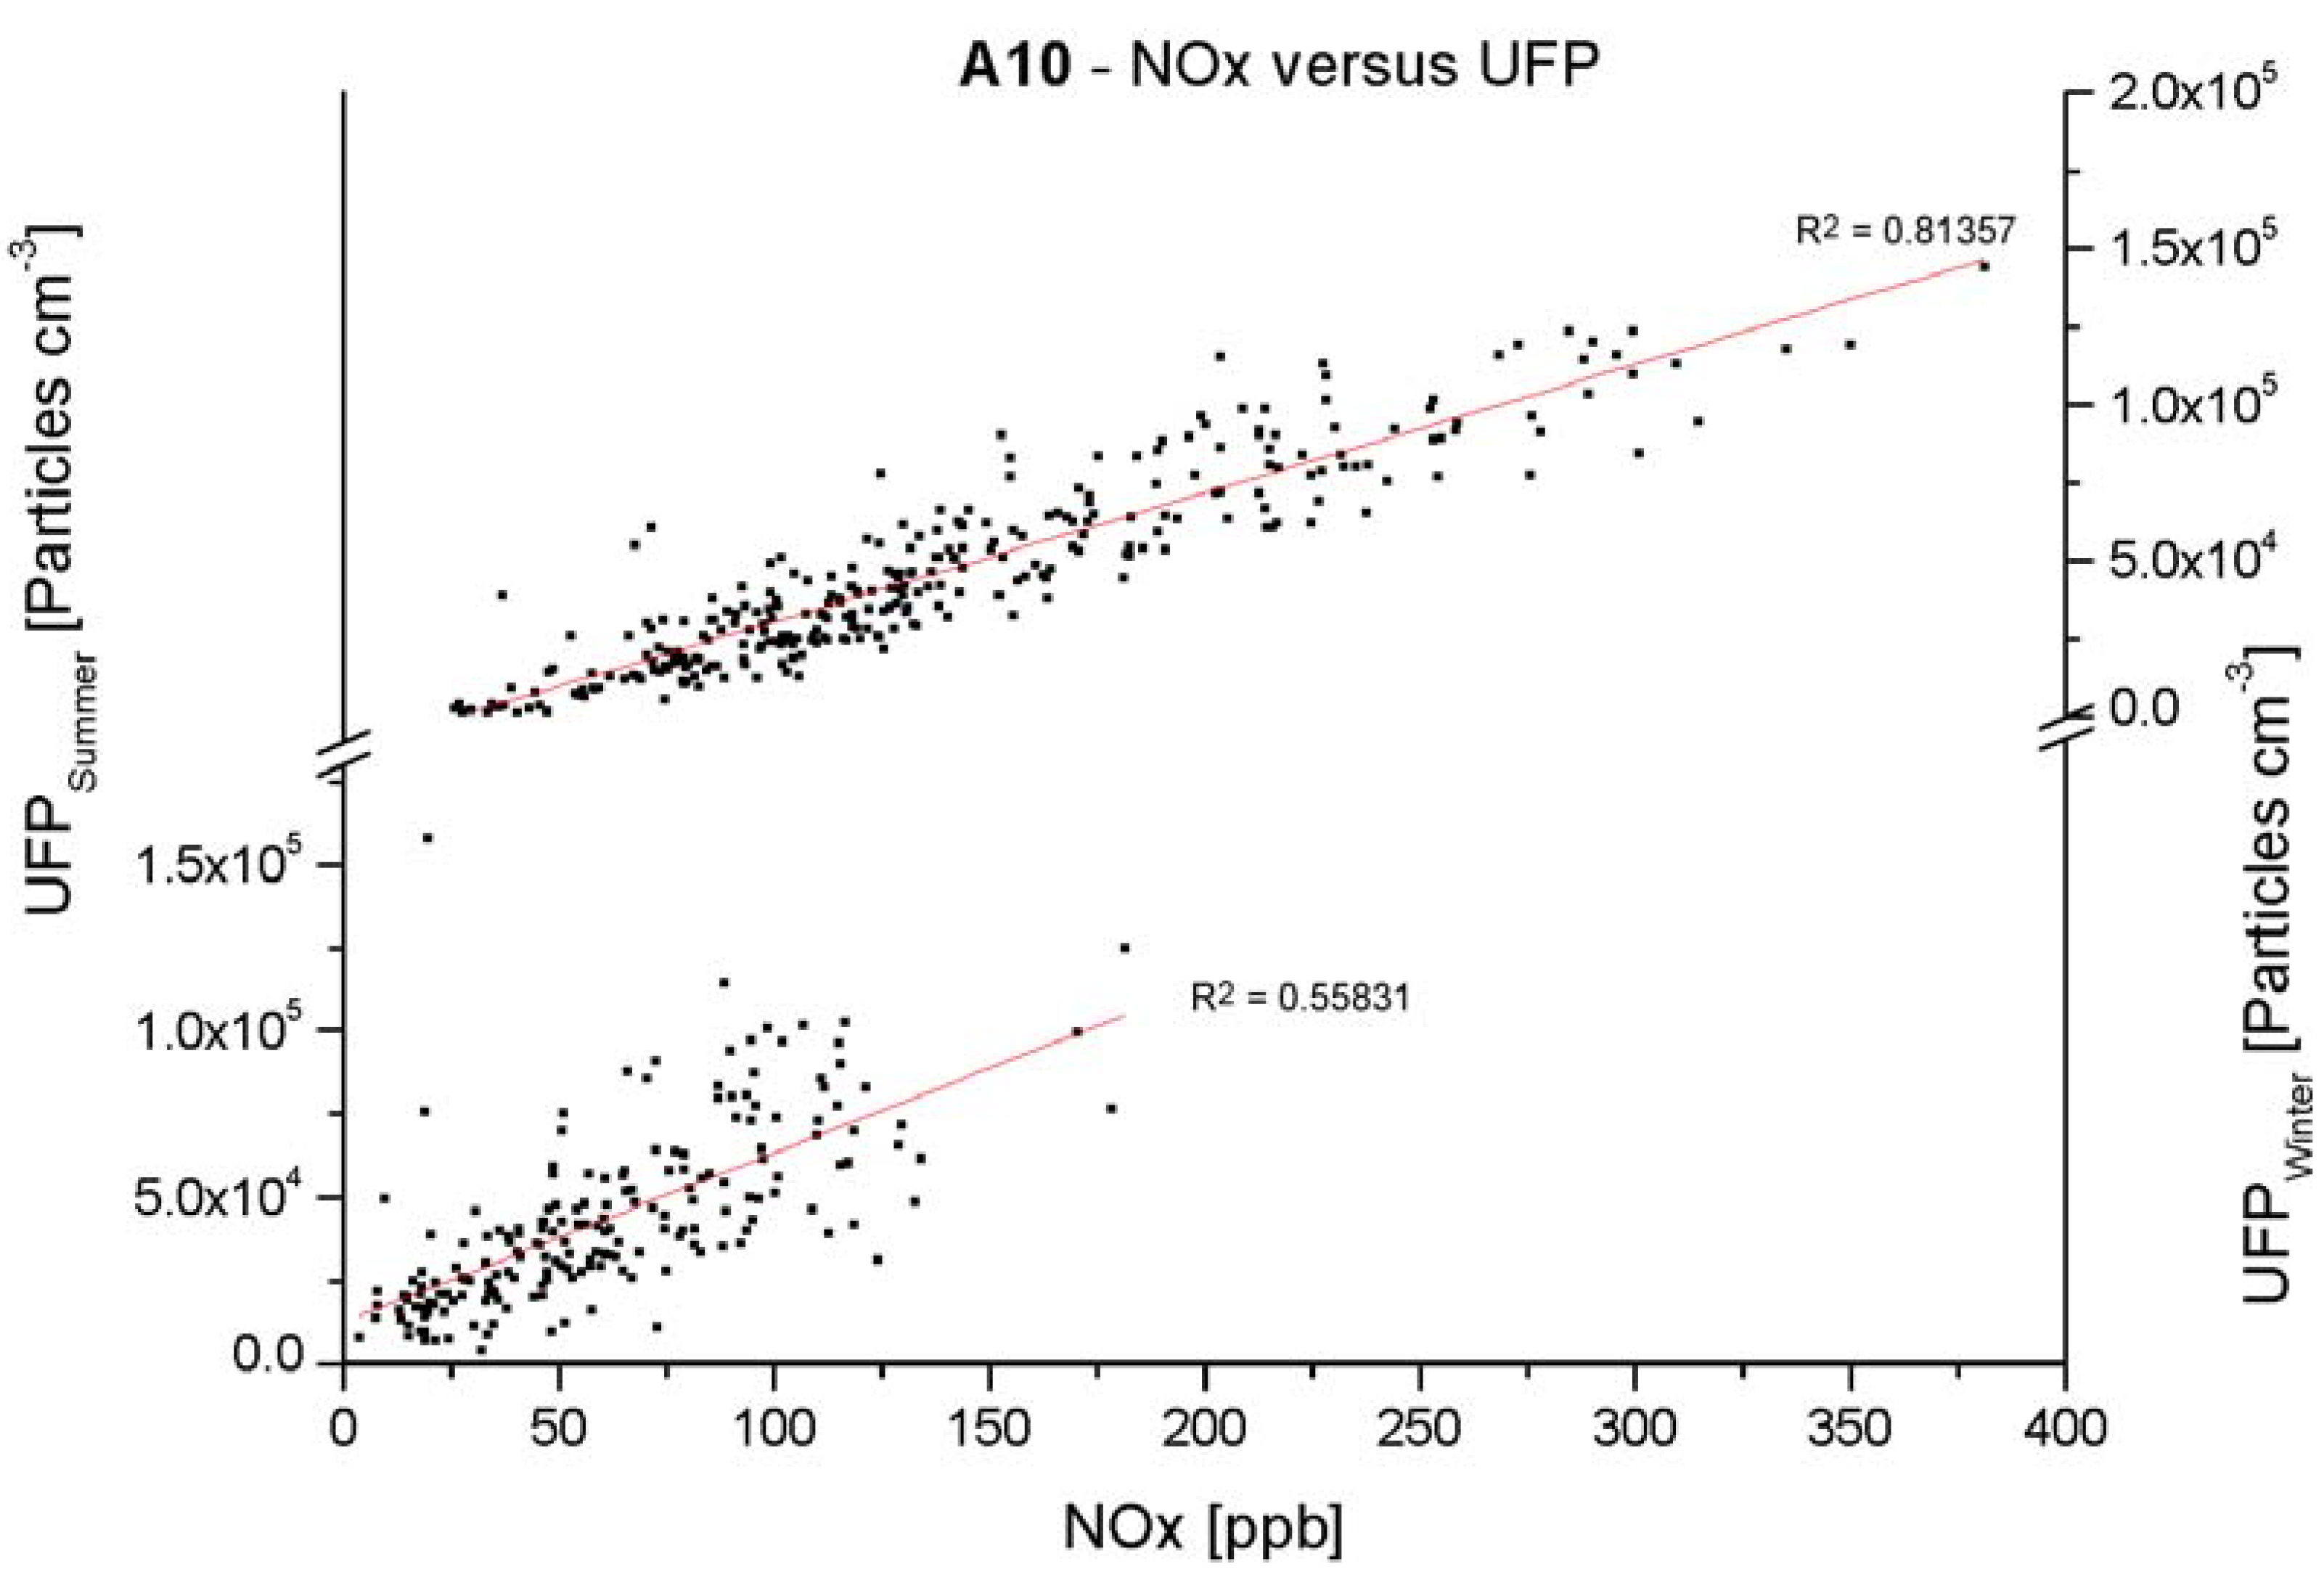
Figure 4 as well as all other sites (not depicted in graphical form). In winter, nitric-oxide concentrations monitored close to the source are strongly correlated with UFP (R
2 = 0.81 for motorway, 0.69 downtown); whereas relationships with particle mass are weakly correlations with UFP (R
2 = 0.54 for motorway, 0.002 downtown). For summer measurements, correlations with nitric-oxides diminishes (R
2 = 0.56 for motorway, 0.20 for downtown) whereas it is almost inexistent for PM
10 (R
2 = 0.01 for motorway, 0.14 for downtown). For the urban background site (Lehen), correlations for winter UFP and NO
X are given (R
2 = 0.78), however this correlation collapses during summer months (R
2 = 0.07 for NO
2). A similar trend is observable for the rural background site (Haunsberg, winter: R
2 = 0.61, summer: R
2 = 0.15) but cannot be associated to summer data as PM10 data are not sampled there. Further details of the analysis are given in
Table 1.
Figure 4.
Scatter-plots of environmental factor NOx in relation to UFP; two examples are shown: UFP/NOX at motorway A10 in summer (lower section) and winter (upper section).
Figure 4.
Scatter-plots of environmental factor NOx in relation to UFP; two examples are shown: UFP/NOX at motorway A10 in summer (lower section) and winter (upper section).
Table 1.
Statistics describing the relationship between UFP and the independent variables (PM10, NOX, NO2 and CO). Legend: n = sample size; R2 = for regression line; SEI = standard error for intercept; SES = standard error for slope; MSE = mean squared error.
Table 1.
Statistics describing the relationship between UFP and the independent variables (PM10, NOX, NO2 and CO). Legend: n = sample size; R2 = for regression line; SEI = standard error for intercept; SES = standard error for slope; MSE = mean squared error.
| dense traffic | Downtown (Rudolfsplatz) | Motorway (A10) |
|---|
| Summer | Winter | Summer | Winter |
|---|
| PM10 | NOX | NO2 | CO | PM10 | NOX | NO2 | CO | PM10 | NOX | NO2 | CO | PM10 | NOX | NO2 | CO |
|---|
| n | 347 | 348 | 340 | 340 | 338 | 335 | 335 | 336 | 200 | 195 | 195 | 196 | 201 | 193 | 196 | 196 |
| R2 | 0.14 | 0.20 | 0.19 | 0.13 | 0.002 | 0.69 | 0.57 | 0.32 | 0.01 | 0.56 | 0.40 | 0.34 | 0.54 | 0.81 | 0.78 | 0.34 |
| Intercept | 0.16 | 0.22 | 0.11 | 0.14 | 0.38 | 0.08 | -0.01 | 0.13 | 0.23 | 0.07 | 0.06 | -0.09 | 0.07 | -0.05 | 0.06 | -0.09 |
| SEI | 0.02 | 0.01 | 0.02 | 0.03 | 0.02 | 0.01 | 0.02 | 0.02 | 0.02 | 0.01 | 0.02 | 0.04 | 0.02 | 0.02 | 0.02 | 0.04 |
| Slope | 0.42 | 0.42 | 0.47 | 0.48 | 0.01 | 0.50 | 0.55 | 0.37 | 0.10 | 0.61 | 0.52 | 0.85 | 0.93 | 1.06 | 0.51 | 0.85 |
| SES | 0.05 | 0.06 | 0.05 | 0.07 | 0.02 | 0.02 | 0.03 | 0.03 | 0.06 | 0.04 | 0.05 | 0.08 | 0.06 | 0.04 | 0.04 | 0.08 |
| Prob > F | <0.0001 | <0.0001 | <0.0001 | <0.0001 | 0.65 | <0.0001 | <0.0001 | <0.0001 | 0.08 | <0.0001 | <0.0001 | <0.0001 | <0.0001 | <0.0001 | <0.0001 | <0.0001 |
| MSE | 0.03 | 0.03 | 0.03 | 0.03 | 0.03 | 0.01 | 0.03 | 0.02 | 0.03 | 0.01 | 0.02 | 0.02 | 0.02 | 0.01 | 0.01 | 0.03 |
| no traffic | Background I (City, Lehen) | Background II (rural area, Haunsberg) |
| Summer | Winter | Summer | Winter |
| PM10 | NOX | NO2 | CO | PM10 | NOX | NO2 | CO | PM10 | NOX | NO2 | CO | PM10 | NOX | NO2 | CO |
| n | 311 | - | 320 | - | 239 | 234 | 234 | - | - | 183 | 185 | - | - | 189 | 189 | - |
| R2 | 0.01 | - | 0.07 | - | 0.47 | 0.78 | 0.46 | - | - | 0.15 | 0.13 | - | - | 0.61 | 0.54 | - |
| Intercept | 0.37 | - | 0.34 | - | 0.17 | 0.12 | 0.00 | - | - | 0.27 | 0.27 | - | - | 0.17 | 0.20 | - |
| SEI | 0.01 | - | 0.01 | - | 0.01 | 0.01 | 0.03 | - | - | 0.02 | 0.02 | - | - | 0.01 | 0.01 | - |
| Slope | 0.09 | - | 0.23 | - | 0.61 | 0.68 | 0.68 | - | - | 0.32 | 0.30 | - | - | 0.61 | 0.58 | - |
| SES | 0.04 | - | 0.05 | - | 0.04 | 0.02 | 0.05 | - | - | 0.05 | 0.06 | - | - | 0.03 | 0.03 | - |
| Prob > F | 0.05 | - | <0.0001 | | <0.0001 | <0.0001 | <0.0001 | | | <0.0001 | <0.0001 | | | <0.0001 | <0.0001 | |
| MSE | 0.01 | - | 0.02 | | 0.01 | 0.01 | 0.01 | | | 0.02 | 0.02 | | | 0.01 | 0.01 | |
Table 1 shows that PM
10 is not well correlated with trends in ultrafine particles; this sampling campaign does not provide any evidence that particle number concentration can be considered simply as a fraction of PM
10, simply because particles close to the 10 μm-extreme reveal a more inertia-like behavior, whereas particles around 100 nm predominantly behave like gases. CO shows a better link to UFP, but not as closely as NO
x and NO
2.
The traffic related exhaust pollutants NO
x and NO
2 indeed unveiled a close link to the measured ultrafine particle number concentrations. The correlation is strongest for measurements taken during winter. The UFP/NO
x and NO
2 correlation for the motorway A10 site correlate strongly also during summer measurement. NO
x shows the strongest link with UFP at all measurement sites and times. Although the slopes in
Table 1 apparently vary for locations and seasons, this exhaust chemical can be used to some extent as an indicator for particle number concentration in close proximity to road traffic conditions [
24].
Special consideration has to be paid to atmospheric temperature inversions; these are regularly occurring phenomena during the winter season, notably affecting the investigated area. During such events, an accumulation of the particle load takes place, leading to an increased exposure of UFP as we could see in a previous study in the same area [
25].
The rural site approached background concentrations of anthropogenic produced aerosols. Although it did not closely follow the day/night and weekend patterns, the fluctuations and influence of traffic exhaust was still recognizable and was most likely associated with the long-range transport of aerosols [
26].
Monitoring weather patterns remains a necessity, as they can influence particle distribution. Duringdays with high amounts of precipitation, the concentration of particulates, both indoors and outdoors, decrease significantly [
27], which we could observe as well (
Figure 2, summer).
4. Conclusions
Here we showed that PM
10-data is not a reliable tool for estimating ultrafine particle burdens. A link between traffic related exhaust pollutants, NO
x and NO
2, with UFP exists, and is strongest during the winter season. In addition, nitric-oxide values correlate best with UFP when monitored close to the source. While it is reasonable to use NO
x as a proxy indicator during the cooler season, in fact, the same can not be deduced from the presented data for the warmer months (see
Table 1). NO
x can only be used as a proxy indicator in rural areas during the warmer months if the gathered data are sampled close to the site where these are generated, because a) warmer temperatures during summer months facilitate particle dynamics and accelerated particle agglomeration, and b) photochemical induced reactions due to the more intense solar radiation in summer drastically alters NO
x -concentrations. Both effects generate a situation where the dynamics of UFP and NO
x seem to deviate from one another rather than to be interdependent via the correlations that are observable during the cooler months. Hence, nitric-oxide proxy indicators may be used in temperate regions, but are unsuitable parameters for warmer or even tropic regions.
This study confirms our assumption that cooler temperatures moderate the thermodynamic behavior of the nano-particle load, thereby slowing down the subsequent chemo-physical particle kinetics. Higher temperatures, on the other hand, speed up the divergence between UFP and nitric oxides, making them less fit to be used as proxy indicators. Hence, using NOx and NO2 as indicators is only appropriate for regions where temperature extremes do not distort their relationship with UFP.
NOx correlates best with UFP, while NO2 still shows a good correlation and can be used as an indicator where NOx is not monitored. Since these parameters are regularly monitored with the existing equipment, the environmental authorities have the possibility to use existing data in anticipating excessive UFP accumulation. This is valuable in the investigated area; where air pollution is dominated by motor vehicle emissions. As this is mainly true for winter measurements, solely relying on these proxy-indicators for estimating UFP is not sufficient.
An increase of the chosen reference values should encourage authorities to perform supplementary UFP measurements by using SMPS or ELPI to monitor particle number concentrations. That way, if particle number measurements are performed only to verify trends when the chemical indicators are apparently elevated, operational costs can be kept as low as possible while still providing a feasible monitoring tool demanded by future changes in legislation. However, where exact monitoring of UFP is required, reference values cannot provide a fully reliable tool and should only be used with caution. Their use as a full surrogate for UFP measurements would prove problematic; but utilizing certain exhaust chemicals as indicators appears to be a helpful tool.
Differences occurring in seasonal particle-size composition should play a role in exposure and health assessments, in particular, as winter measurements revealed a higher amount in the spectrum of particles which easily penetrate deep into the lungs. As this study shows, particle emissions are elevated in close proximities to highly frequented traffic points and therefore need regulation when considering public health concerns regarding air pollution.


