Analysis of the Genetic Diversity and Population Structure of Austrian and Belgian Wheat Germplasm within a Regional Context Based on DArT Markers

 ,
, 
 ,
,
Abstract
:1. Introduction
2. Materials and Methods
2.1. Plant Germplasm
2.1.1. Austrian and Belgian Wheat Breeding Pools
2.1.2. European Wheat Breeding Pool
2.2. DNA Extraction and DArT Analysis
2.3. Data Analysis
2.3.1. Genetic Diversity and Population Structure of Austrian and Belgian Wheat Pools
2.3.2. Diversity, Population Structure and Relationships among Wheat Varieties from Nine Countries
3. Results
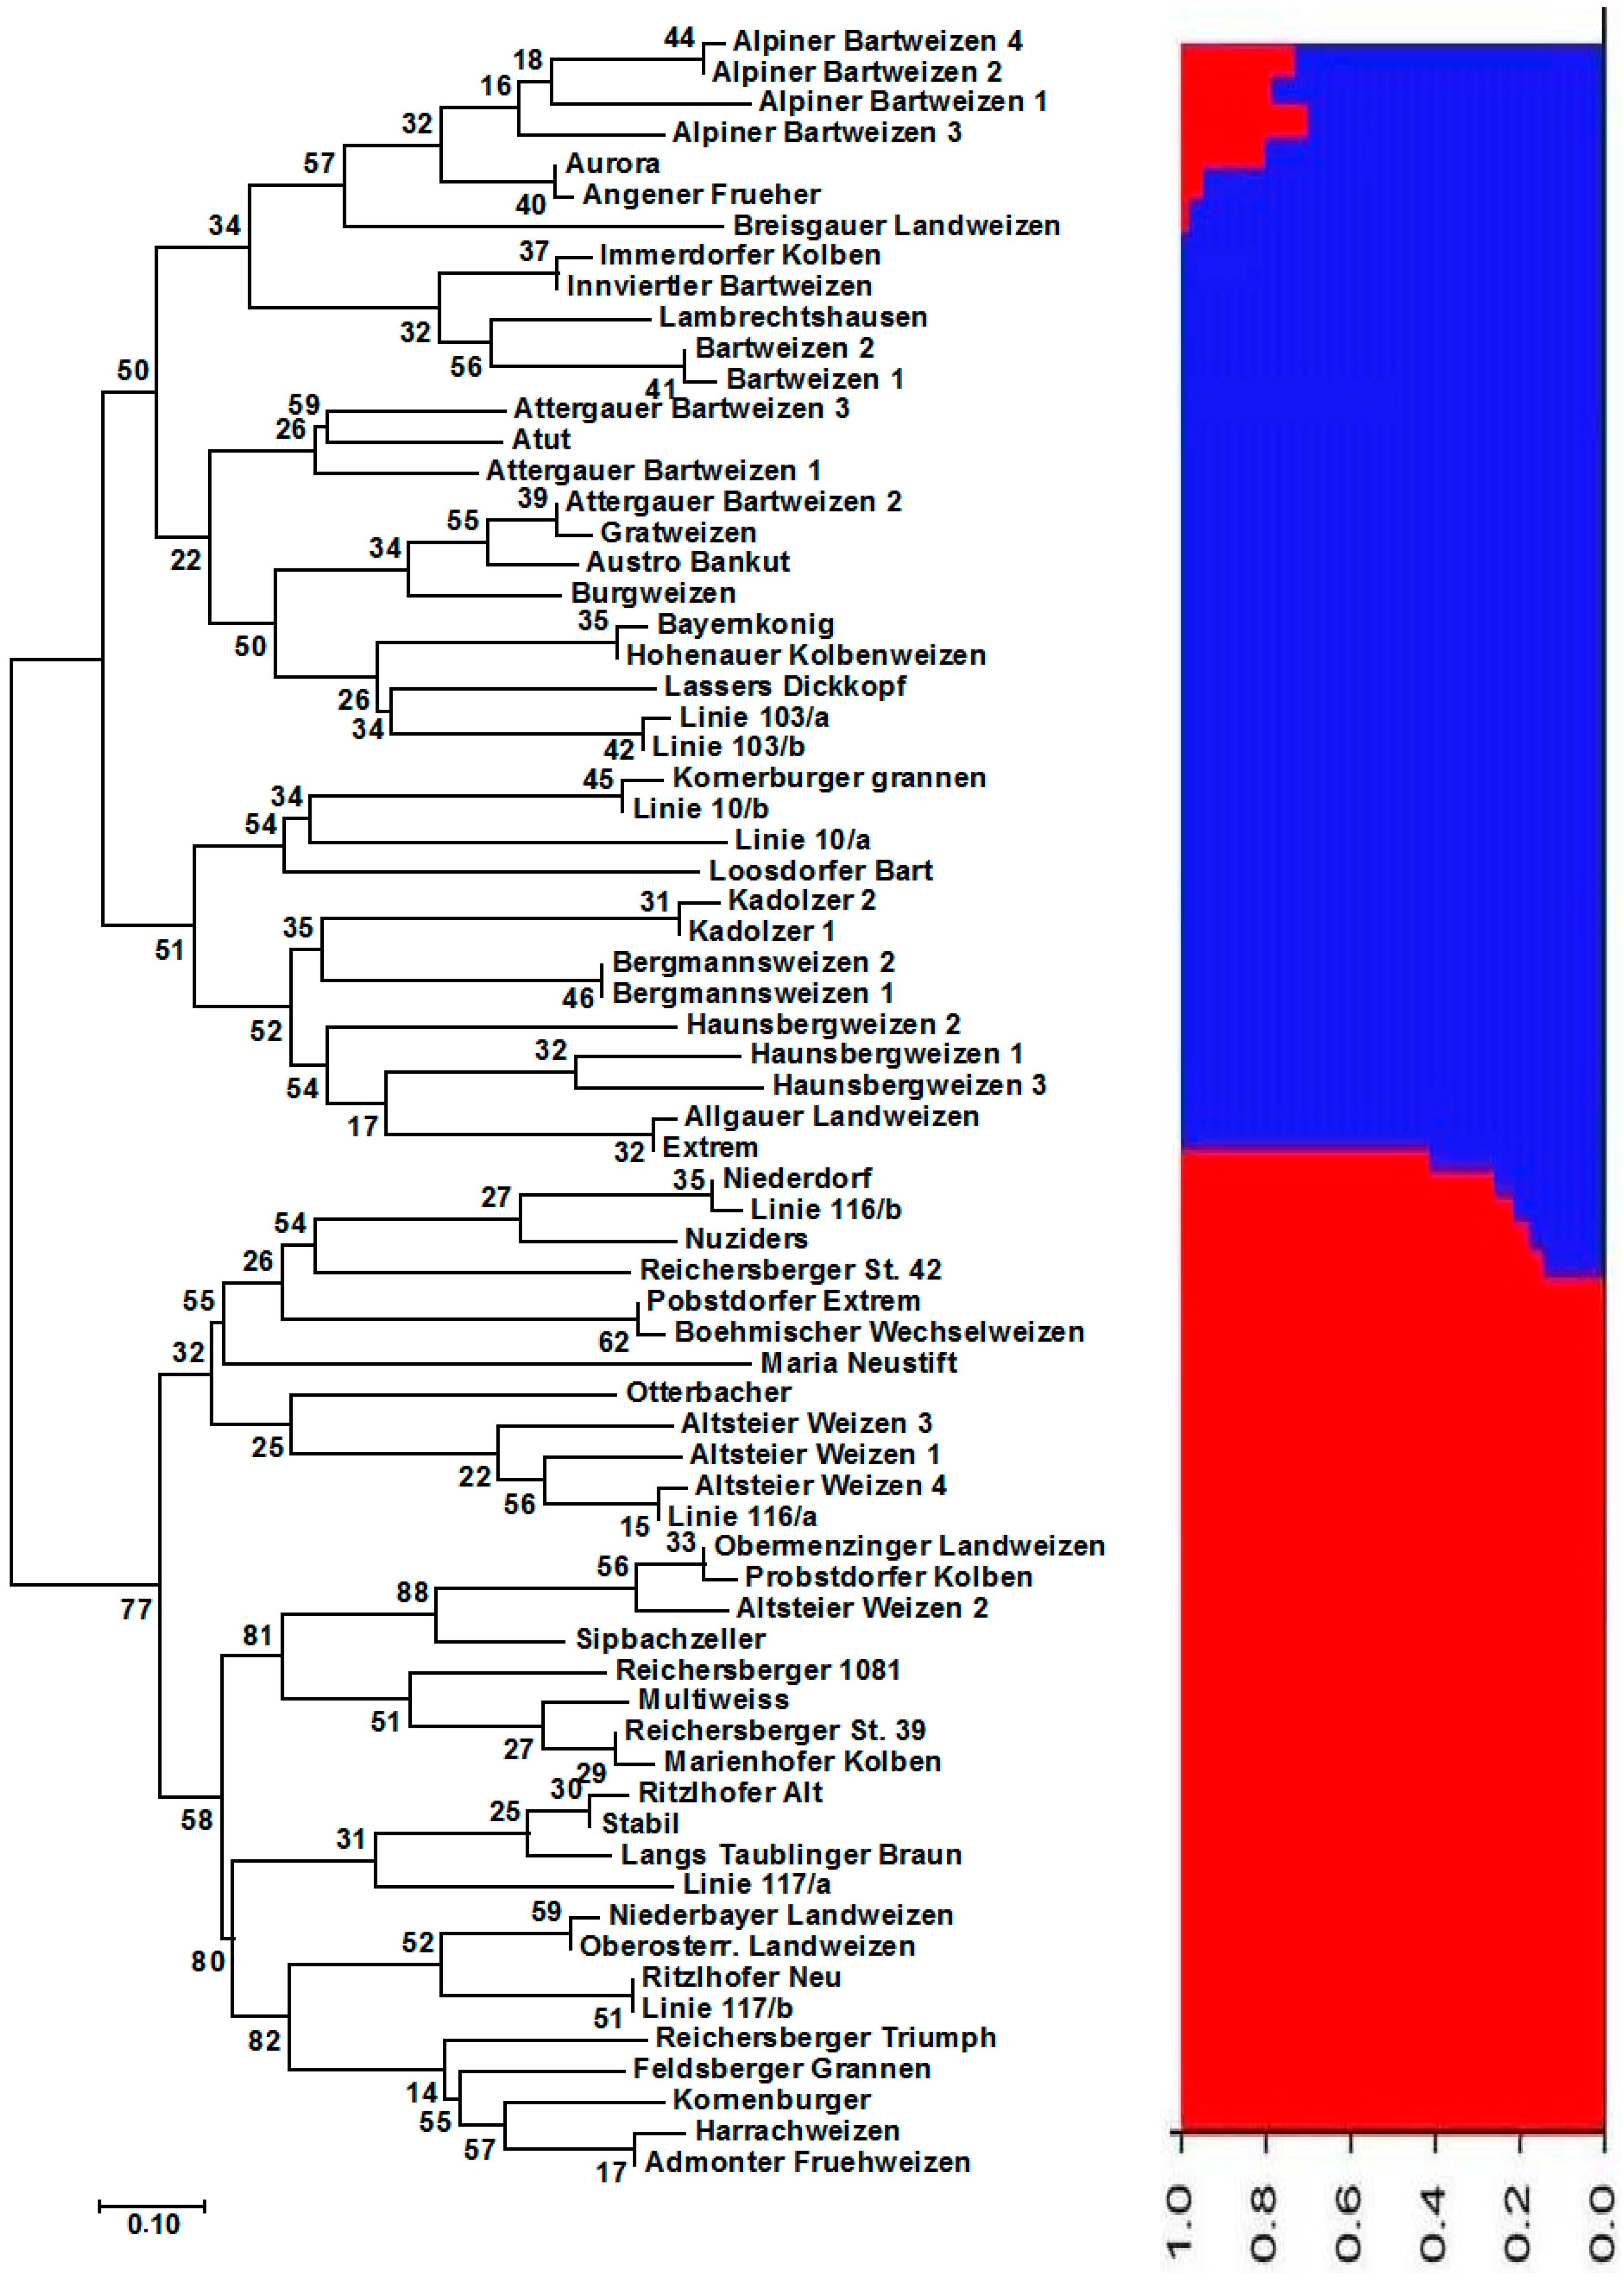
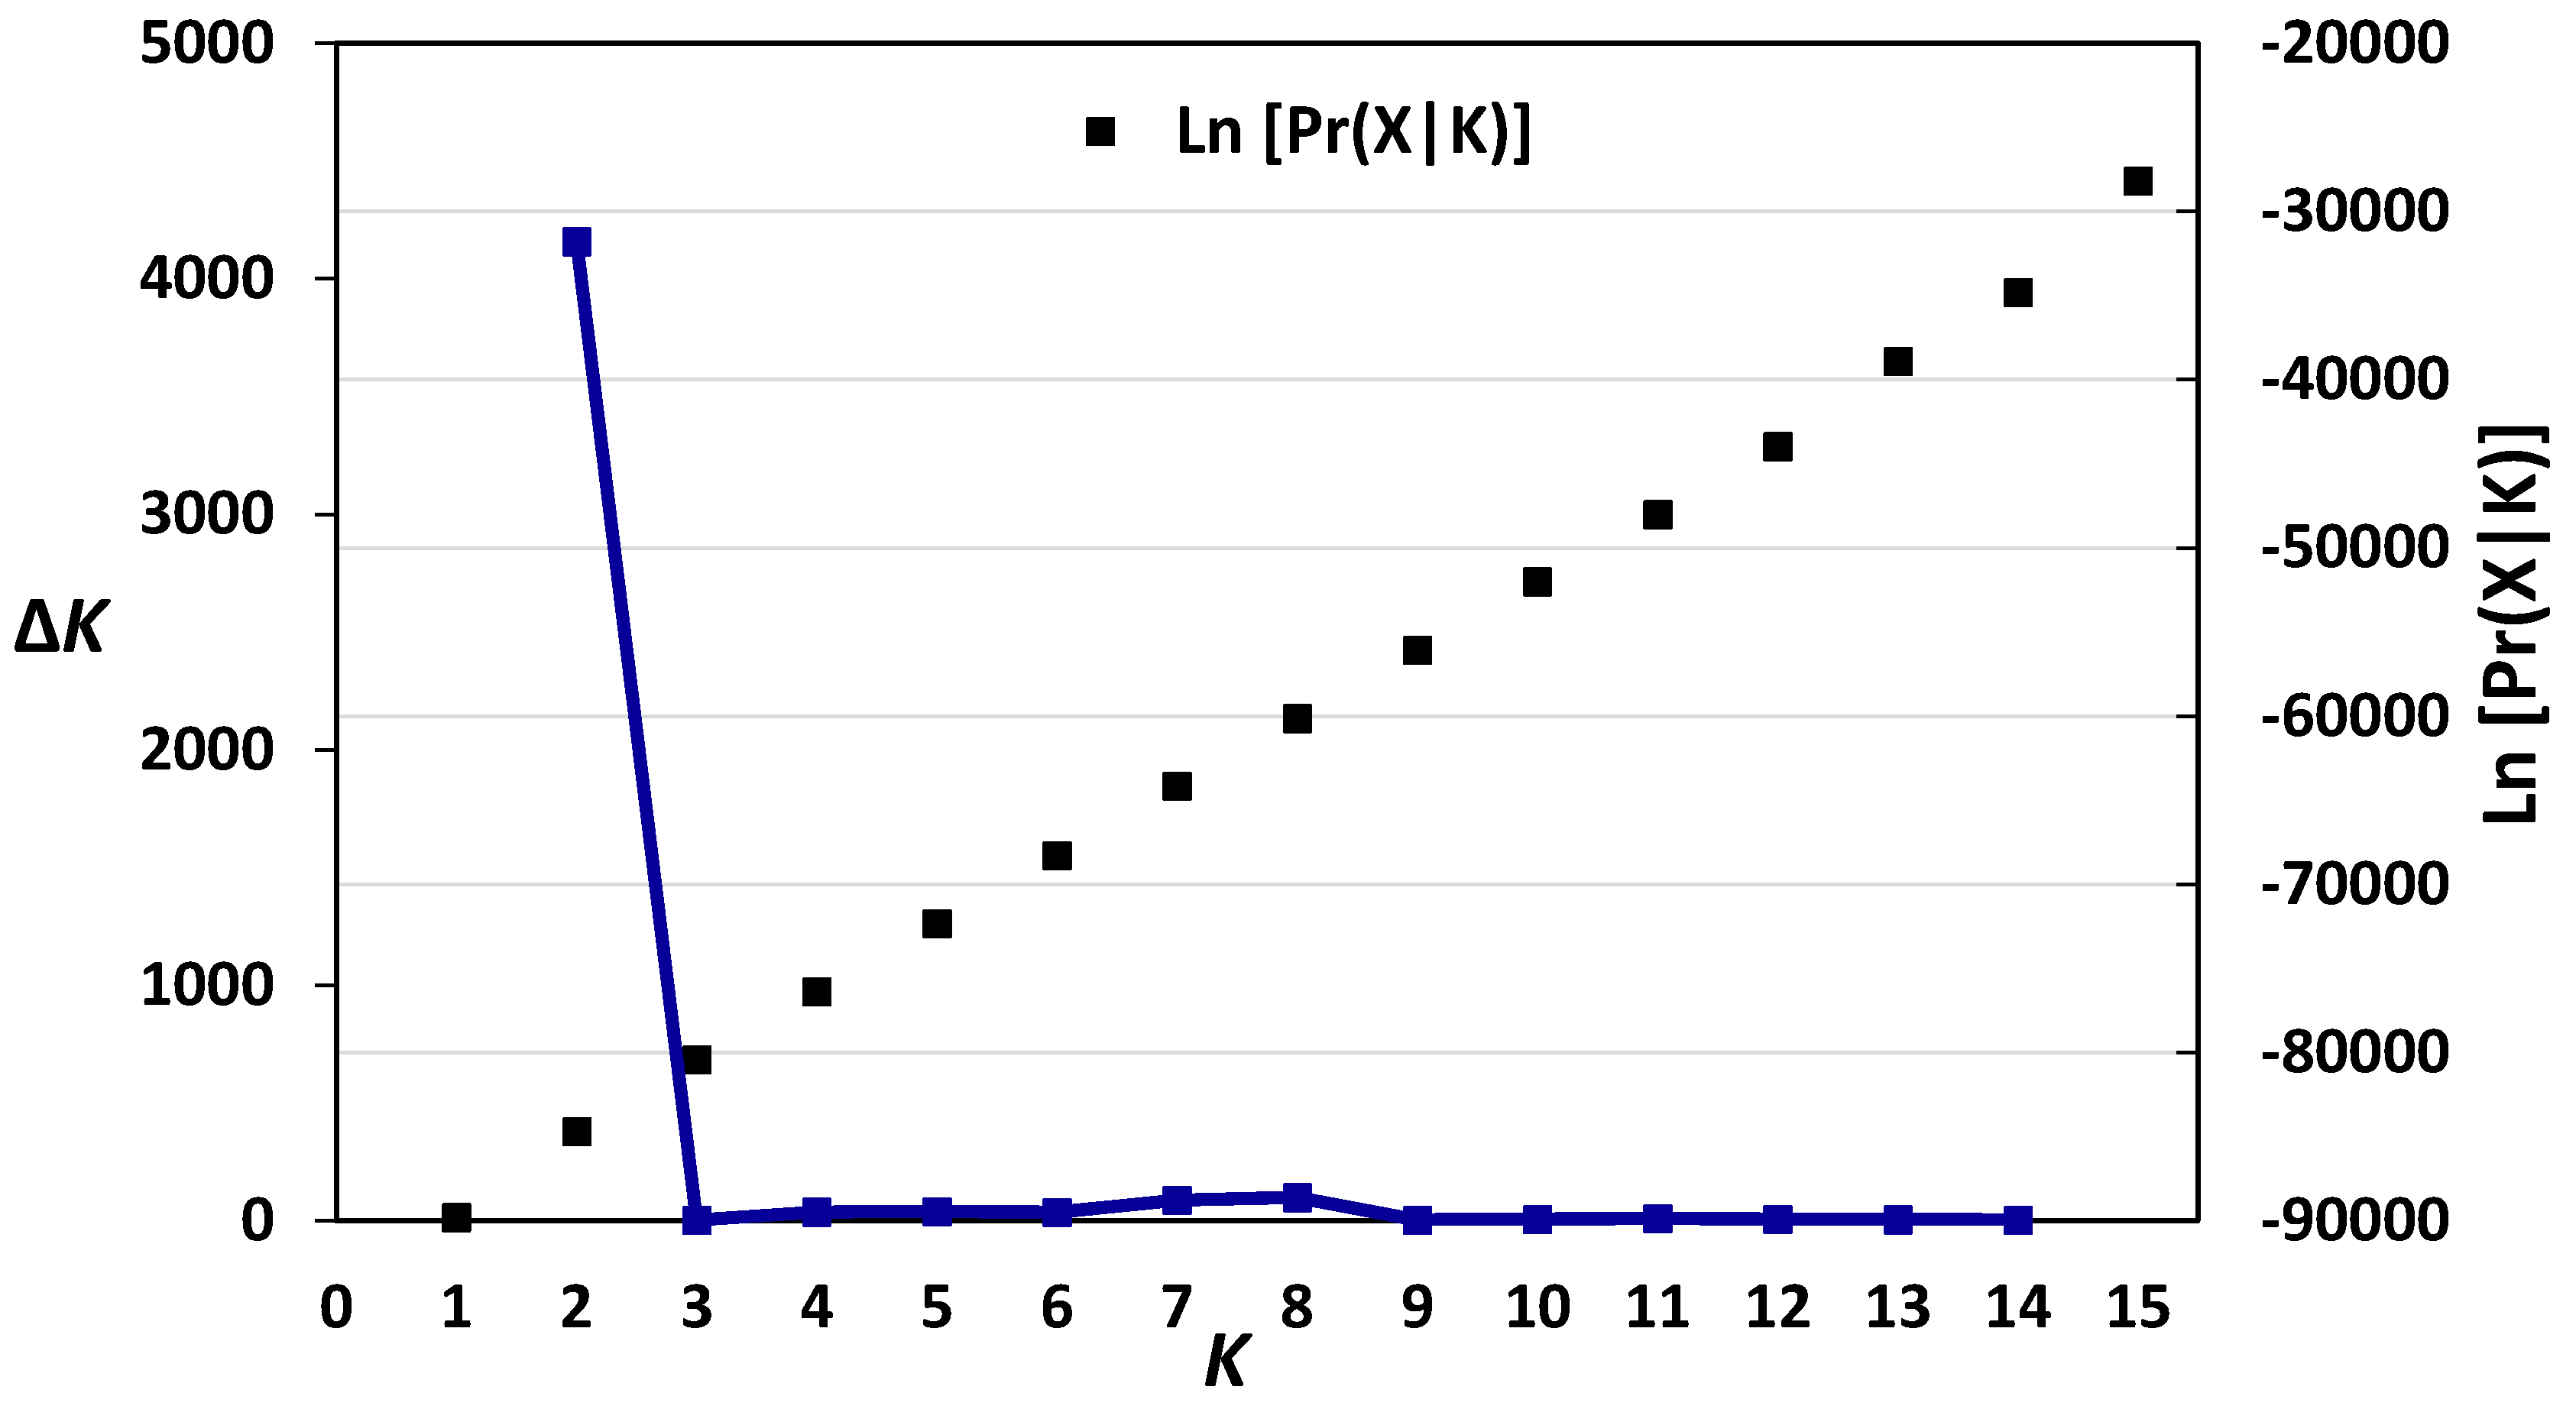
3.1. Genetic Diversity and Population Structure of Austrian and Belgian Wheat Pools
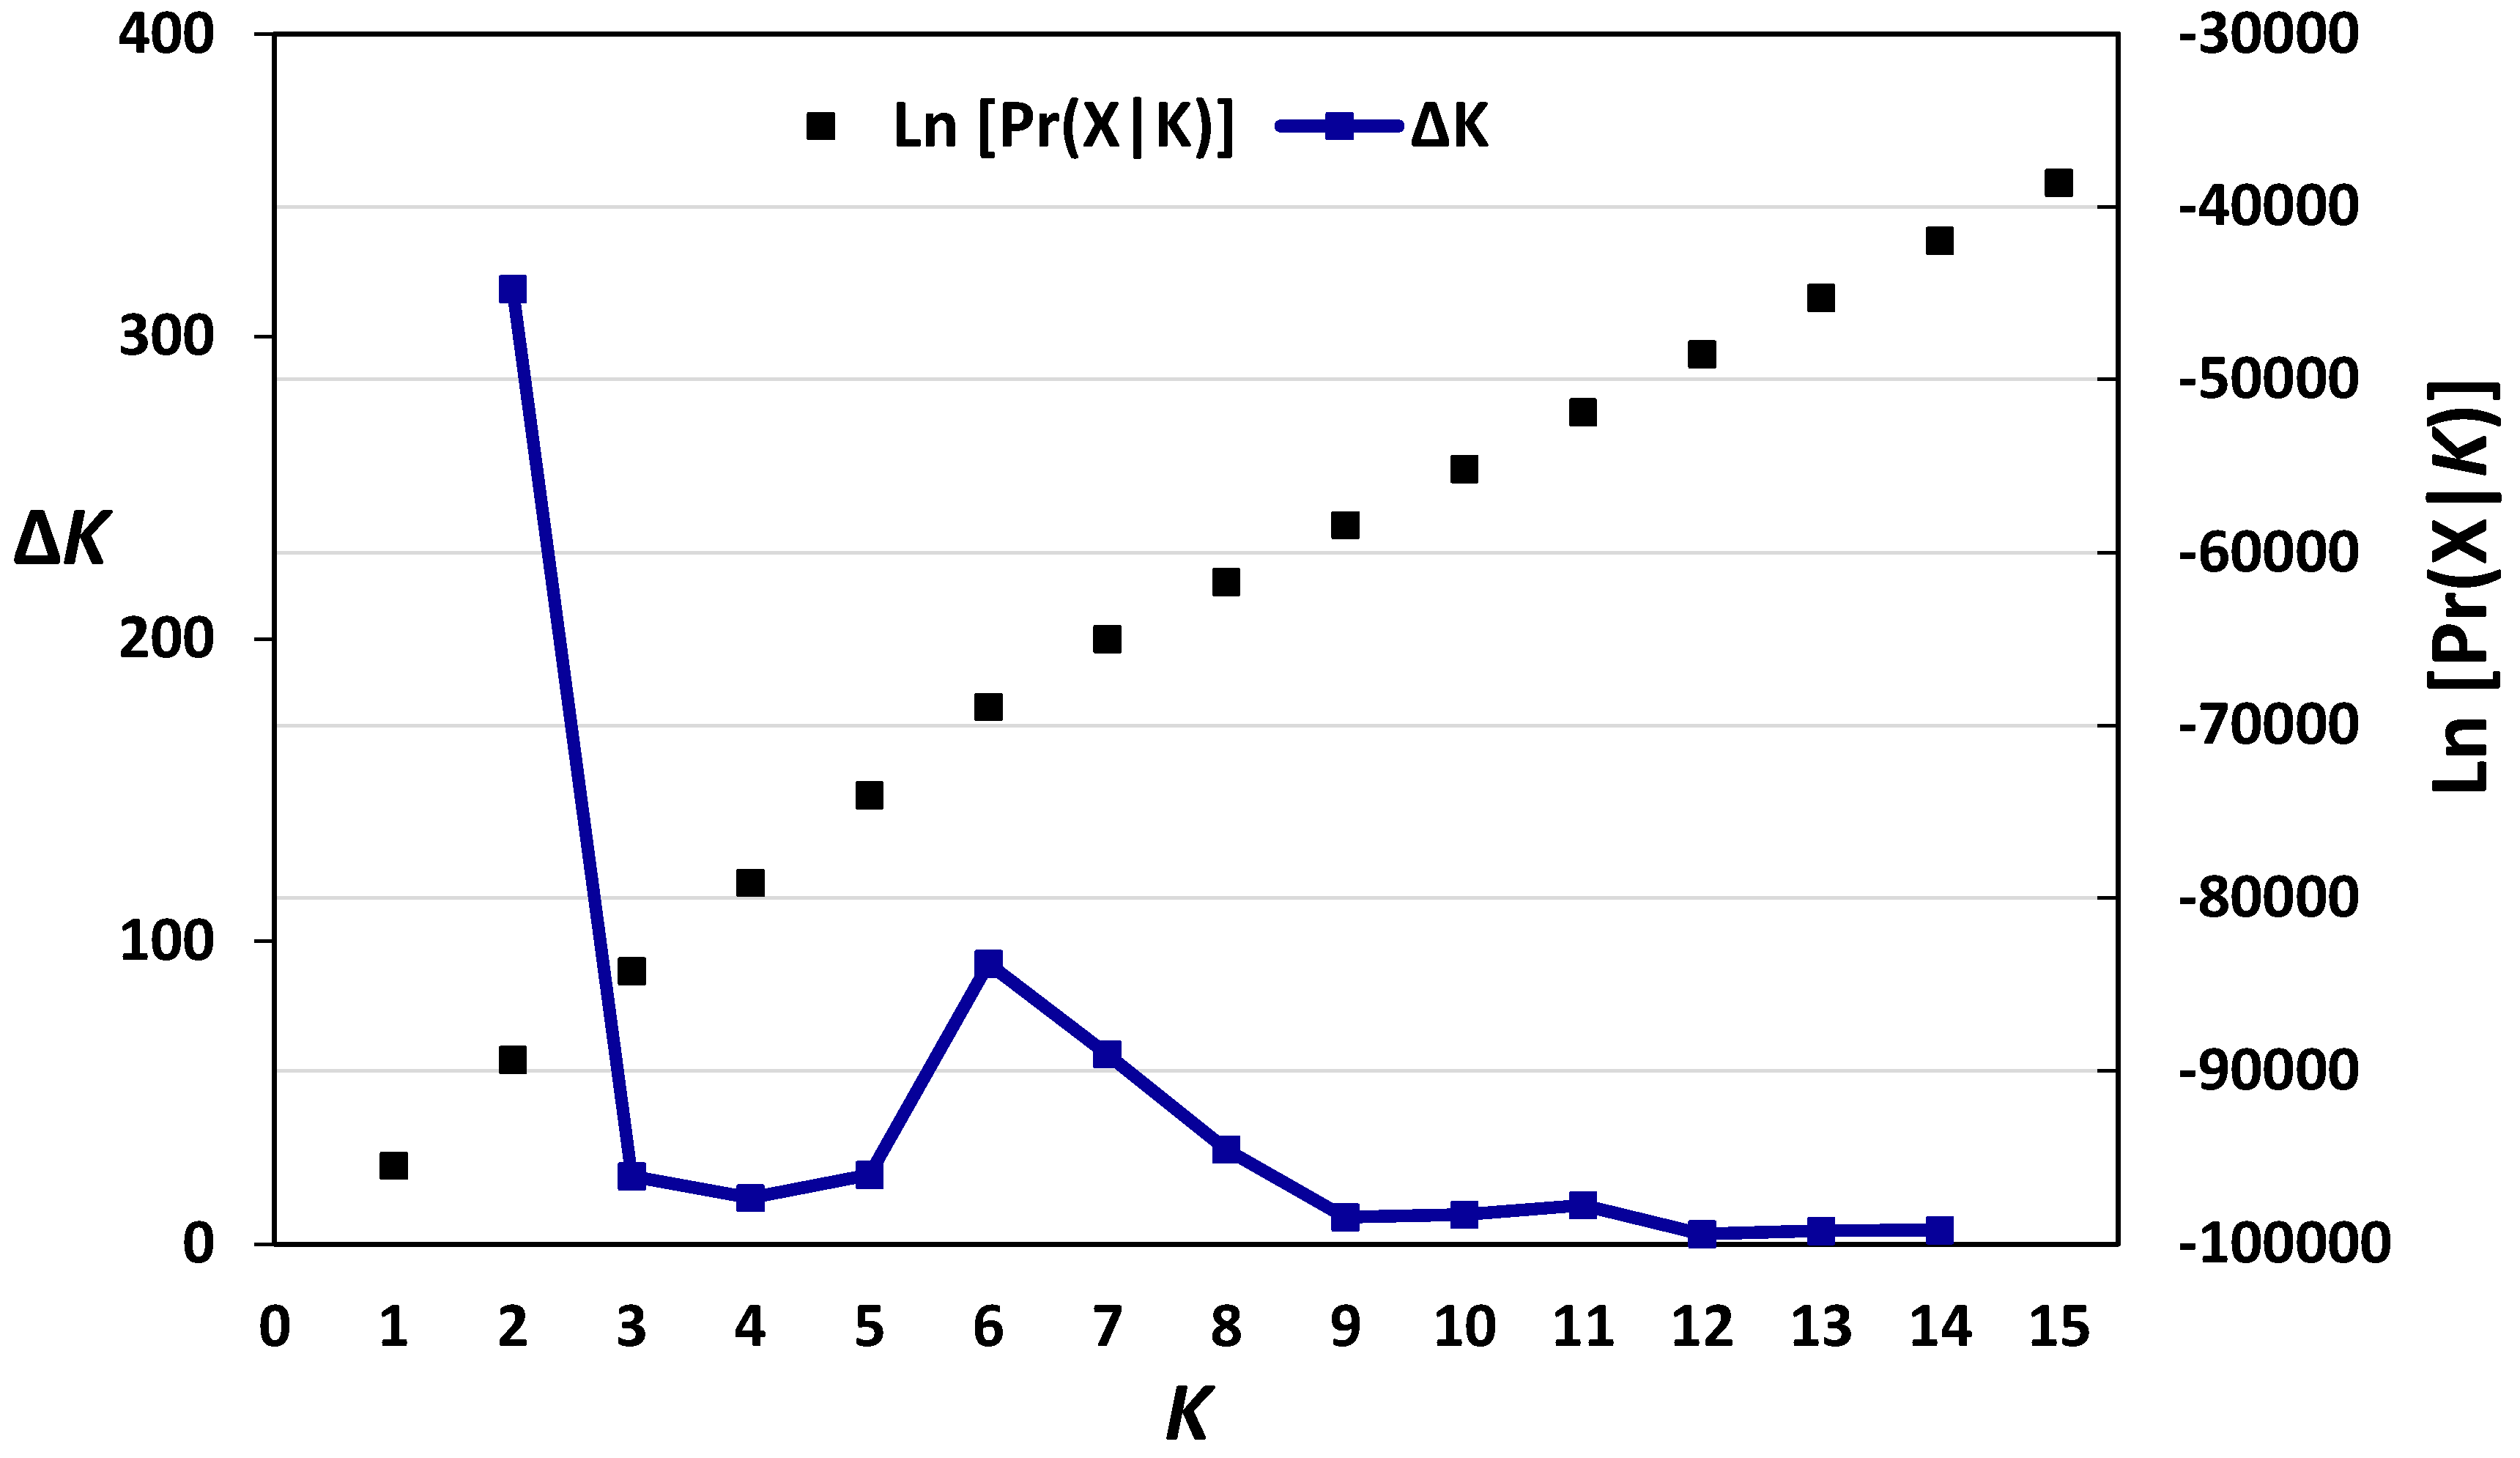
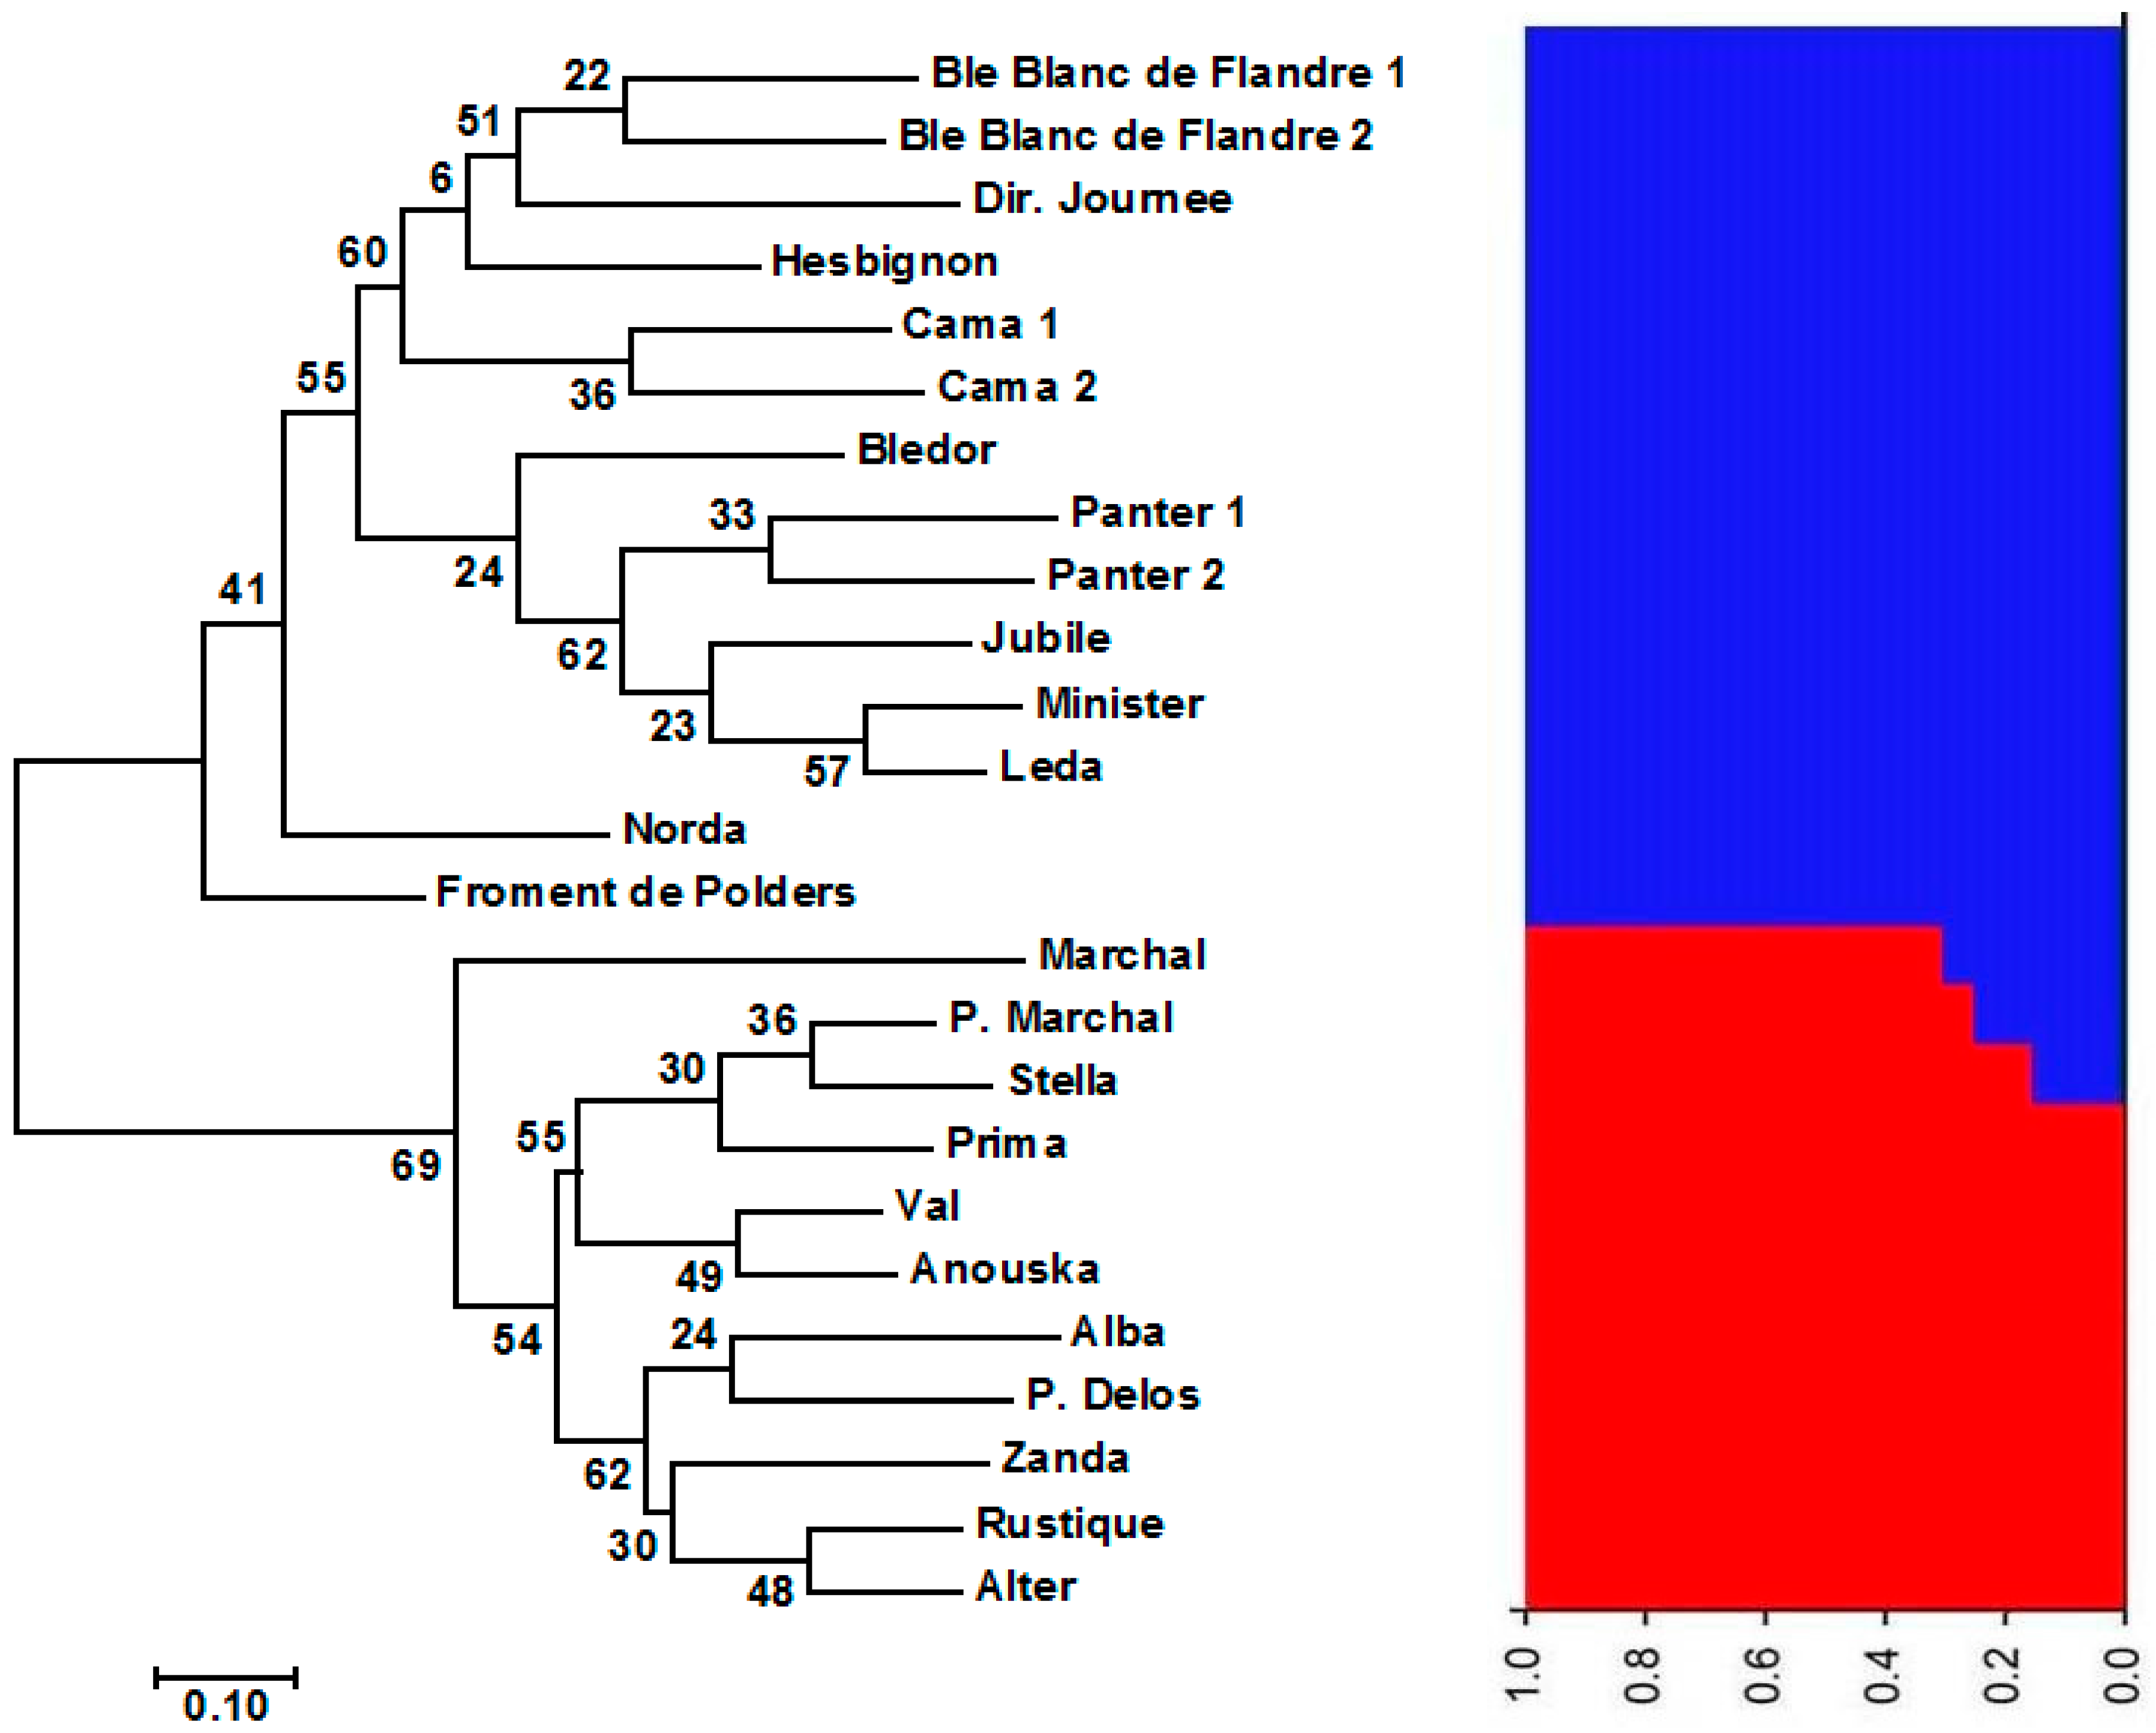
3.2. Diversity, Population Structure and Relationships among European Wheat Varieties from Nine Countries
4. Discussion
Supplementary Materials
Acknowledgments
Author Contributions
Conflicts of Interest
References
- Raman, H.; Stodart, B.J.; Cavanagh, C.; Mackay, M.; Morrel, M.; Milgate, A.; Martin, P. Molecular diversity and genetic structure of modern and traditional landrace cultivars of wheat (Triticum aestivum L.). Crop Pasture Sci. 2010, 61, 222–229. [Google Scholar] [CrossRef]
- Zohary, D.; Harlan, J.H.; Vardi, A. The wild diploid progenitors of wheat and their breeding value. Euphytica 1969, 18, 58–65. [Google Scholar] [CrossRef]
- Novoselović, D.; Bentley, A.R.; Šimek, R.; Dvojković, K.; Sorrells, M.E.; Gosman, N.; Horsnell, R.; Drezner, G.; Šatović, Z. Characterizing Croatian wheat germplasm diversity and structure in a European context by DArT markers. Front. Plant Sci. 2016, 7, 184. [Google Scholar] [CrossRef] [PubMed]
- Morgante, M.; Salamini, F. From plant genomics to breeding practice. Curr. Opin. Biotechnol. 2003, 14, 214–219. [Google Scholar] [CrossRef]
- Van de Wouw, M.; van Hintum, T.; Kik, C.; van Treuren, R.; Visser, B. Genetic diversity trends in twentieth century crop cultivars: A meta analysis. Theor. Appl. Genet. 2010, 120, 1241–1252. [Google Scholar] [CrossRef] [PubMed]
- Reeves, T.G.; Pinstrup-Anderson, P.; Pandya-Lorch, R. Food Security and the Role of Agricultural Research; CIMMYT: Mexico City, Mexico, 1997. [Google Scholar]
- Hoisington, D.; Khairallah, M.; Reeves, T.; Ribaut, J.-M.; Skovmand, B.; Taba, S.; Warburton, M. Plant genetic resources: What can they contribute toward increased crop productivity? Proc. Natl. Acad. Sci. USA 1999, 96, 5937–5943. [Google Scholar] [CrossRef] [PubMed]
- El-Esawi, M.A.; Sammour, R. Karyological and phylogenetic studies in the genus Lactuca L. (Asteraceae). Cytologia 2014, 79, 269–275. [Google Scholar] [CrossRef]
- El-Esawi, M.A.; Germaine, K.; Bourke, P.; Malone, R. Genetic diversity and population structure of Brassica oleracea germplasm in Ireland using SSR markers. C. R. Biol. 2016, 339, 133–140. [Google Scholar] [CrossRef] [PubMed]
- El-Esawi, M.A.; Germaine, K.; Bourke, P.; Malone, R. AFLP analysis of genetic diversity and phylogenetic relationships of Brassica oleracea in Ireland. C. R. Biol. 2016, 339, 163–170. [Google Scholar] [CrossRef] [PubMed]
- El-Esawi, M.A.; Mustafa, A.; Badr, S.; Sammour, R. Isozyme analysis of genetic variability and population structure of Lactuca L. germplasm. Biochem. Syst. Ecol. 2017, 70, 73–79. [Google Scholar] [CrossRef]
- El-Esawi, M.A. Genetic diversity and evolution of Brassica genetic resources: From morphology to novel genomic technologies—A review. Plant Genet. Resour. 2017, 15, 388–399. [Google Scholar] [CrossRef]
- Smith, J.S.C.; Smith, O.S. Associations among inbred lines of maize using electrophoretic, chromatographic, and pedigree data 1. Multivariate and cluster analysis of data from ‘Lancaster Sure Crop’ derived lines. Theor. Appl. Genet. 1987, 73, 654–664. [Google Scholar] [CrossRef] [PubMed]
- Smith, J.S.C.; Smith, O.S. Associations among inbred lines of maize using electrophoretic, chromatographic, and pedigree data 2. Multivariate and cluster analysis of data from Iowa Stiff Stalk Synthetic derived lines. Theor. Appl. Genet. 1988, 76, 39–44. [Google Scholar] [CrossRef] [PubMed]
- Cox, T.S.; Kiang, Y.T.; Gorman, M.B.; Rodgers, D.M. Relationship between coefficient of parentage and genetic similarity indices in the soybean. Crop Sci. 1985, 25, 529–532. [Google Scholar] [CrossRef]
- Martin, J.M.; Blake, T.K.; Hockett, E.A. Diversity among North American spring barley cultivars based on coefficients of parentage. Crop Sci. 1991, 31, 1131–1137. [Google Scholar] [CrossRef]
- Souza, E.; Fox, P.N.; Byerlee, D.; Skovmand, B. Spring wheat diversity in irrigated areas of two developing countries. Crop Sci. 1994, 34, 774–783. [Google Scholar] [CrossRef]
- DeLacy, I.H.; Skovmand, B.; Huerta, J. Characterization of Mexican wheat landraces using agronomically useful attributes. Genet. Resour. Crop Evol. 2000, 47, 591–602. [Google Scholar] [CrossRef]
- Guadagnuolo, R.; Bianchi, D.S.; Felber, F. Specific genetic markers for wheat, spelt, and four wild relatives: Comparison of isozymes, RAPDs, and wheat microsatellites. Genome 2001, 44, 610–621. [Google Scholar] [CrossRef] [PubMed]
- Caballero, L.; Martín, L.M.; Alvarez, J.B. Genetic variability of the low molecular-weight glutenin subunits in spelt wheat (Triticum aestivum ssp. spelta L. em Thell.). Theor. Appl. Genet. 2004, 108, 914–919. [Google Scholar] [CrossRef] [PubMed]
- Joshi, C.P.; Nguyen, H.T. RAPD (random amplified polymorphic DNA) analysis based intervarietal genetic relationships among hexaploid wheats. Plant Sci. 1993, 93, 95–103. [Google Scholar] [CrossRef]
- Plaschke, J.; Ganal, M.W.; Röder, M.S. Detection of genetic diversity in closely related bread wheat using microsatellite markers. Theor. Appl. Genet. 1995, 91, 1001–1007. [Google Scholar] [CrossRef] [PubMed]
- Paull, J.G.; Chalmers, K.J.; Karakousis, A.; Kretschmer, J.M.; Manning, S.; Langridge, P. Genetic diversity in Australian wheat varieties and breeding material based on RFLP data. Theor. Appl. Genet. 1998, 96, 435–446. [Google Scholar] [CrossRef] [PubMed]
- Eujayl, I.; Sorrells, M.; Baum, M.; Wolters, P.; Powell, W. Assessment of genotypic variation among cultivated durum wheat based on EST-SSRs and genomic SSRs. Euphytica 2001, 119, 39–43. [Google Scholar] [CrossRef]
- Soleimani, V.D.; Baum, B.R.; Johnson, D.A. AFLP and pedigree-based genetic diversity estimates in modern cultivars of durum wheat (Triticum turgidum L. subsp. durum (Desf.) Husn.). Theor. Appl. Genet. 2002, 104, 350–357. [Google Scholar] [CrossRef] [PubMed]
- Reif, J.C.; Zhang, P.; Dreisigacker, S.; Warburton, M.L.; van Ginkel, M.; Hoisington, D.; Bohn, M.; Melchinger, A.E. Wheat genetic diversity trends during domestication and breeding. Theor. Appl. Genet. 2005, 110, 859–864. [Google Scholar] [CrossRef] [PubMed]
- Huang, Q.; Borner, A.; Roder, S.; Ganal, W. Assessing genetic diversity of wheat (Triticum aestivum L.) germplasm using microsatellite markers. Theor. Appl. Genet. 2002, 105, 699–707. [Google Scholar] [PubMed]
- Laidò, G.; Mangini, G.; Taranto, F.; Gadaleta, A.; Blanco, A.; Cattivelli, L.; Marone, D.; Mastrangelo, A.M.; Papa, R.; De Vita, P. Genetic diversity and population structure of tetraploid wheats (Triticum turgidum L.) Estimated by SSR, DArT and pedigree data. PLoS ONE 2013, 8, e67280. [Google Scholar] [CrossRef] [PubMed]
- Chen, X.; Min, D.; Yasir, T.A.; Hu, Y.-G. Genetic diversity, population structure and linkage disequilibrium in elite Chinese winter wheat investigated with SSR markers. PLoS ONE 2012, 7, e44510. [Google Scholar] [CrossRef] [PubMed]
- El-Esawi, M.A. SSR analysis of genetic diversity and structure of the germplasm of faba bean (Vicia faba L.). C. R. Biol. 2017, 340, 474–480. [Google Scholar] [CrossRef] [PubMed]
- Jaccoud, D.; Peng, K.; Feinstein, D.; Killian, A. Diversity arrays: A solid state technology for sequence information independent genotyping. Nucleic Acids Res. 2001, 29, e25. [Google Scholar] [CrossRef] [PubMed]
- Akbari, M.; Wenzl, P.; Caig, V.; Carling, J.; Xia, L.; Yang, S.; Uszynski, G.; Mohler, V.; Lehmensiek, A.; Kuchel, H.; et al. Diversity arrays technology (DArT) for high-throughput profiling of the hexaploid wheat genome. Theor. Appl. Genet. 2006, 113, 1409–1420. [Google Scholar] [CrossRef] [PubMed]
- Stodart, B.J.; Mackay, M.C.; Raman, H. Assessment of molecular diversity in landraces of bread wheat (Triticum aestivum L.) held in an ex situ collection with Diversity Array Technology (DArT). Aust. J. Agric. Res. 2007, 58, 1174–1182. [Google Scholar] [CrossRef]
- Nielsen, N.H.; Backes, G.; Stourgaard, J.; Andersen, S.U.; Jahoor, A. Genetic diversity and population structure analysis of European hexaploid bread wheat (Triticum aestivum L.) varieties. PLoS ONE 2014, 9, e94000. [Google Scholar] [CrossRef] [PubMed]
- Bentley, A.R.; Scutari, M.; Gosman, N.; Faure, S.; Bedford, F.; Howell, P.; Cockram, J.; Rose, G.A.; Barber, T.; Irigoyen, J.; et al. Applying association mapping and genomic selection to the dissection of key traits in elite European wheat. Theor. Appl. Genet. 2014, 127, 2619–2633. [Google Scholar] [CrossRef] [PubMed]
- Goudet, J. FSTAT version 1.2: A computer program to calculate F-statistics. J. Hered. 1995, 86, 485–486. [Google Scholar] [CrossRef]
- Peakall, R.; Smouse, P.E. GENALEX 6: Genetic analysis in excel. population genetic software for teaching and research. Mol. Ecol. Notes 2006, 6, 288–295. [Google Scholar] [CrossRef]
- Liu, K.; Muse, S.V. PowerMarker: An integrated analysis environment for genetic marker analysis. Bioinformatics 2005, 21, 2128–2129. [Google Scholar] [CrossRef] [PubMed]
- Pritchard, J.K.; Stephens, M.; Donnelly, P. Inference of population structure using multilocus genotype data. Genetics 2000, 155, 945–959. [Google Scholar] [PubMed]
- Earl, D.A.; von Holdt, B.M. STRUCTURE HARVESTER: A website and program for visualizing STRUCTURE output and implementing the Evanno method. Conserv. Genet. Resour. 2012, 4, 359–361. [Google Scholar] [CrossRef]
- Evanno, G.; Regnaut, S.; Goudet, J. Detecting the number of clusters of individuals using the software STRUCTURE: A simulation study. Mol. Ecol. 2005, 14, 2611–2620. [Google Scholar] [CrossRef] [PubMed]
- Zhang, L.Y.; Liu, D.C.; Guo, X.L.; Yang, W.L.; Sun, J.Z.; Wang, D.W.; Sourdille, P.; Zhang, A. Investigation of genetic diversity and population structure of common wheat cultivars in northern China using DArT markers. BMC Genet. 2011, 12, 42. [Google Scholar] [CrossRef] [PubMed]
- Hai, L.; Wagner, C.; Friedt, W. Quantitative structure analysis of genetic diversity among spring bread wheats (Triticum aestivum L.) from different geographical regions. Genetica 2007, 130, 213–225. [Google Scholar] [CrossRef] [PubMed]
- White, J.; Law, J.R.; MacKay, I.; Chalmers, K.J.; Smith, J.S.C.; Kilian, A.; Powell, W. The genetic diversity of UK, US and Australian cultivars of Triticum aestivum measured by DArT markers and considered by genome. Theor. Appl. Genet. 2008, 116, 439–453. [Google Scholar] [CrossRef] [PubMed]
- Le Couviour, F.; Faure, S.; Poupard, B.; Flodrops, Y.; Dubreuil, P.; Praud, S. Analysis of genetic structure in a panel of elite wheat varieties and relevance for association mapping. Theor. Appl. Genet. 2011, 123, 715–727. [Google Scholar] [CrossRef] [PubMed]


| Wheat Panel | Number of Countries | Number of Cultivars | Markers | Number of Markers | Reference |
|---|---|---|---|---|---|
| Austrian Panel | 1 | 70 | DArT | 1052 | Current Study |
| Belgian Panel | 1 | 25 | DArT | 1052 | Current Study |
| TriticeaeGenome Panel | 3 | 376 | DArT/SNPs | 2712/324 | Bentley et al. [35] |
| European Diversity Panel | 16 | 94 | DArT | 1849 | Nielsen et al. [34] |
| Croatian Panel | 1 | 89 | DArT | 1229 | Novoselović et al. [3] |
| Combined dataset | 9 | 618 | DArT | 141 |
| Wheat Panels | N | %P | NE | A25 | HE | PIC |
|---|---|---|---|---|---|---|
| Austrian Panel | 70 | 93.79 | 1.698 | 1.396 | 0.411 | 0.337 |
| Belgian Panel | 25 | 91.46 | 1.602 | 1.341 | 0.375 | 0.298 |
| Wheat Panels | Source of Variation | Variance Components | % Total Variance | Probability |
|---|---|---|---|---|
| Austrian Panel | Between populations | 59.239 | 20% | 0.0001 |
| Within populations | 236.847 | 80% | ||
| Belgian Panel | Between populations | 40.161 | 19% | 0.0001 |
| Within populations | 169.985 | 81% | ||
| All European Wheat Panels from Nine Countries * | Between regions | 8.152 | 26.53% | 0.0001 |
| Among countries Within regions | 1.732 | 5.64% | 0.0001 | |
| Within countries | 20.847 | 67.83% | 0.0001 |
| Country | N | %P | NE | A10 | HE | PIC |
|---|---|---|---|---|---|---|
| Austria | 70 | 92.8 | 1.588 | 1.397 | 0.372 | 0.301 |
| Belgium | 25 | 91.2 | 1.515 | 1.308 | 0.282 | 0.231 |
| Croatia | 89 | 100 | 1.538 | 1.331 | 0.351 | 0.296 |
| Hungary | 11 | 92.6 | 1.515 | 1.344 | 0.341 | 0.287 |
| France | 214 | 100 | 1.468 | 1.302 | 0.319 | 0.278 |
| Germany | 99 | 93.3 | 1.389 | 1.262 | 0.279 | 0.229 |
| Denmark | 22 | 90.7 | 1.332 | 1.224 | 0.250 | 0.202 |
| Sweden | 10 | 88.4 | 1.380 | 1.335 | 0.276 | 0.221 |
| United Kingdom | 78 | 90.5 | 1.333 | 1.248 | 0.251 | 0.204 |
| Country | Membership in Population A (Pop. A) % | Membership in Population B (Pop. B) % |
|---|---|---|
| Austria | 10 | 90 |
| Croatia | 25 | 75 |
| Hungary | 12 | 88 |
| Germany | 61 | 39 |
| Sweden | 67 | 33 |
| France | 79 | 21 |
| Belgium | 91 | 09 |
| United Kingdom | 87 | 13 |
| Denmark | 82 | 18 |
© 2018 by the authors. Licensee MDPI, Basel, Switzerland. This article is an open access article distributed under the terms and conditions of the Creative Commons Attribution (CC BY) license (http://creativecommons.org/licenses/by/4.0/).
Share and Cite
El-Esawi, M.A.; Witczak, J.; Abomohra, A.E.-F.; Ali, H.M.; Elshikh, M.S.; Ahmad, M. Analysis of the Genetic Diversity and Population Structure of Austrian and Belgian Wheat Germplasm within a Regional Context Based on DArT Markers. Genes 2018, 9, 47. https://doi.org/10.3390/genes9010047
El-Esawi MA, Witczak J, Abomohra AE-F, Ali HM, Elshikh MS, Ahmad M. Analysis of the Genetic Diversity and Population Structure of Austrian and Belgian Wheat Germplasm within a Regional Context Based on DArT Markers. Genes. 2018; 9(1):47. https://doi.org/10.3390/genes9010047
Chicago/Turabian StyleEl-Esawi, Mohamed A., Jacques Witczak, Abd El-Fatah Abomohra, Hayssam M. Ali, Mohamed S. Elshikh, and Margaret Ahmad. 2018. "Analysis of the Genetic Diversity and Population Structure of Austrian and Belgian Wheat Germplasm within a Regional Context Based on DArT Markers" Genes 9, no. 1: 47. https://doi.org/10.3390/genes9010047