Article

Responsive Proteins in Wheat Cultivars with Contrasting Nitrogen Efficiencies under the Combined Stress of High Temperature and Low Nitrogen

1
Department of Botany, Jamia Hamdard, New Delhi 110062, India
2
Plant Production Department, College of Food and Agricultural Sciences, King Saud University, P.O. Box. 2460, Riyadh 11451, Saudi Arabia
3
Department of Botany, Aligarh Muslim University, Aligarh 251002, India
4
Botany and Microbiology Department, College of Science, King Saud University, P.O. Box. 2460, Riyadh 11451, Saudi Arabia
*
Author to whom correspondence should be addressed.
Genes 2017, 8(12), 356; https://doi.org/10.3390/genes8120356
Submission received: 30 September 2017 / Revised: 13 November 2017 / Accepted: 23 November 2017 / Published: 29 November 2017
(This article belongs to the Special Issue Genetic Regulation of Abiotic Stress Responses)

Abstract

:
Productivity of wheat (Triticum aestivum) is markedly affected by high temperature and nitrogen deficiency. Identifying the functional proteins produced in response to these multiple stresses acting in a coordinated manner can help in developing tolerance in the crop. In this study, two wheat cultivars with contrasting nitrogen efficiencies (N-efficient VL616 and N-inefficient UP2382) were grown in control conditions, and under a combined stress of high temperature (32 °C) and low nitrogen (4 mM), and their leaf proteins were analysed in order to identify the responsive proteins. Two-dimensional electrophoresis unravelled sixty-one proteins, which varied in their expression in wheat, and were homologous to known functional proteins involved in biosynthesis, carbohydrate metabolism, energy metabolism, photosynthesis, protein folding, transcription, signalling, oxidative stress, water stress, lipid metabolism, heat stress tolerance, nitrogen metabolism, and protein synthesis. When exposed to high temperature in combination with low nitrogen, wheat plants altered their protein expression as an adaptive means to maintain growth. This response varied with cultivars. Nitrogen-efficient cultivars showed a higher potential of redox homeostasis, protein stability, osmoprotection, and regulation of nitrogen levels. The identified stress-responsive proteins can pave the way for enhancing the multiple-stress tolerance in wheat and developing a better understanding of its mechanism.

1. Introduction

The burgeoning global population, on one hand, and a decrease in plant productivity, on the other, have led the world to a situation of food crisis [1]. Anthropogenic turbulences in the environment are the main setbacks to the global food production, among which elevated temperature deserves special mention [2,3,4]. Atmospheric temperature has been estimated to rise by 0.2 °C per decade, attaining a rise of 1.8–4.0 °C by the end of this century [5]. As per the recent report of Intergovernmental Panel on Climate Change, a temperature rise of only 1 °C above pre-industrial era is likely to have a negative impact on the yield of major crops (wheat, rice, and maize) in both tropical and temperate regions [6]. It is estimated that Indian lowlands, that produce almost 15% of global production, will change into heat-stressed and short-season production places [7].
Deficiency of inorganic nitrogen is another key limiting factor in agricultural productivity. The increased crop productivity has been associated with a 20-fold increase in the global use of nitrogen (N) fertilizer during the past five decades [8], and this is expected to increase by 3-fold by the year 2050 [9].
Although increase in cereal productivity has matched population growth during the past years, it is a matter of concern how the predicted environmental conditions will affect crop production in future [10,11]. The problems associated with plant productivity are due to multiple stresses acting in a coordinated manner. Studies have focused largely on response mechanisms of plants to single-stress conditions [12,13], and the combinational effects of different stresses are still poorly understood.
Stress-responsive genes are often identified by expression profiling, following exposure to high level of stresses, leading to identification of numerous signalling components and downstream effectors [14,15,16,17]. Abiotic stress experiments have identified processes, and genes involved in plant survival under extreme conditions [18,19]. Despite these successes, there are few examples of extension of such research to crop species [20,21].
Wheat is the most widely grown crop of the world in terms of the total harvested area [22], and currently fulfils about 20 per cent of the human calorie consumption [23]. Production of wheat is affected markedly by high temperature [24,25,26], and low nitrogen [27]. Asseng et al. [28] reported about 6% decrease in global wheat production for each degree of temperature increase. Elevated temperature alters uptake and allocation of N, thus intensifying N deficiency in plants [29]. Nitrogen stress also restricts biomass accumulation and overall growth in wheat [30]. It is therefore desirable to examine the response of wheat plants to the combined stress at different levels, in order to develop multiple-stress-tolerant smart plants This study is focused on proteins expressed in wheat cultivars exposed to a combined stress of high temperature and low nitrogen, with a hope that it will help in determining a regulatory network and developing tolerance to stress conditions in this crop.

2. Materials and Methods

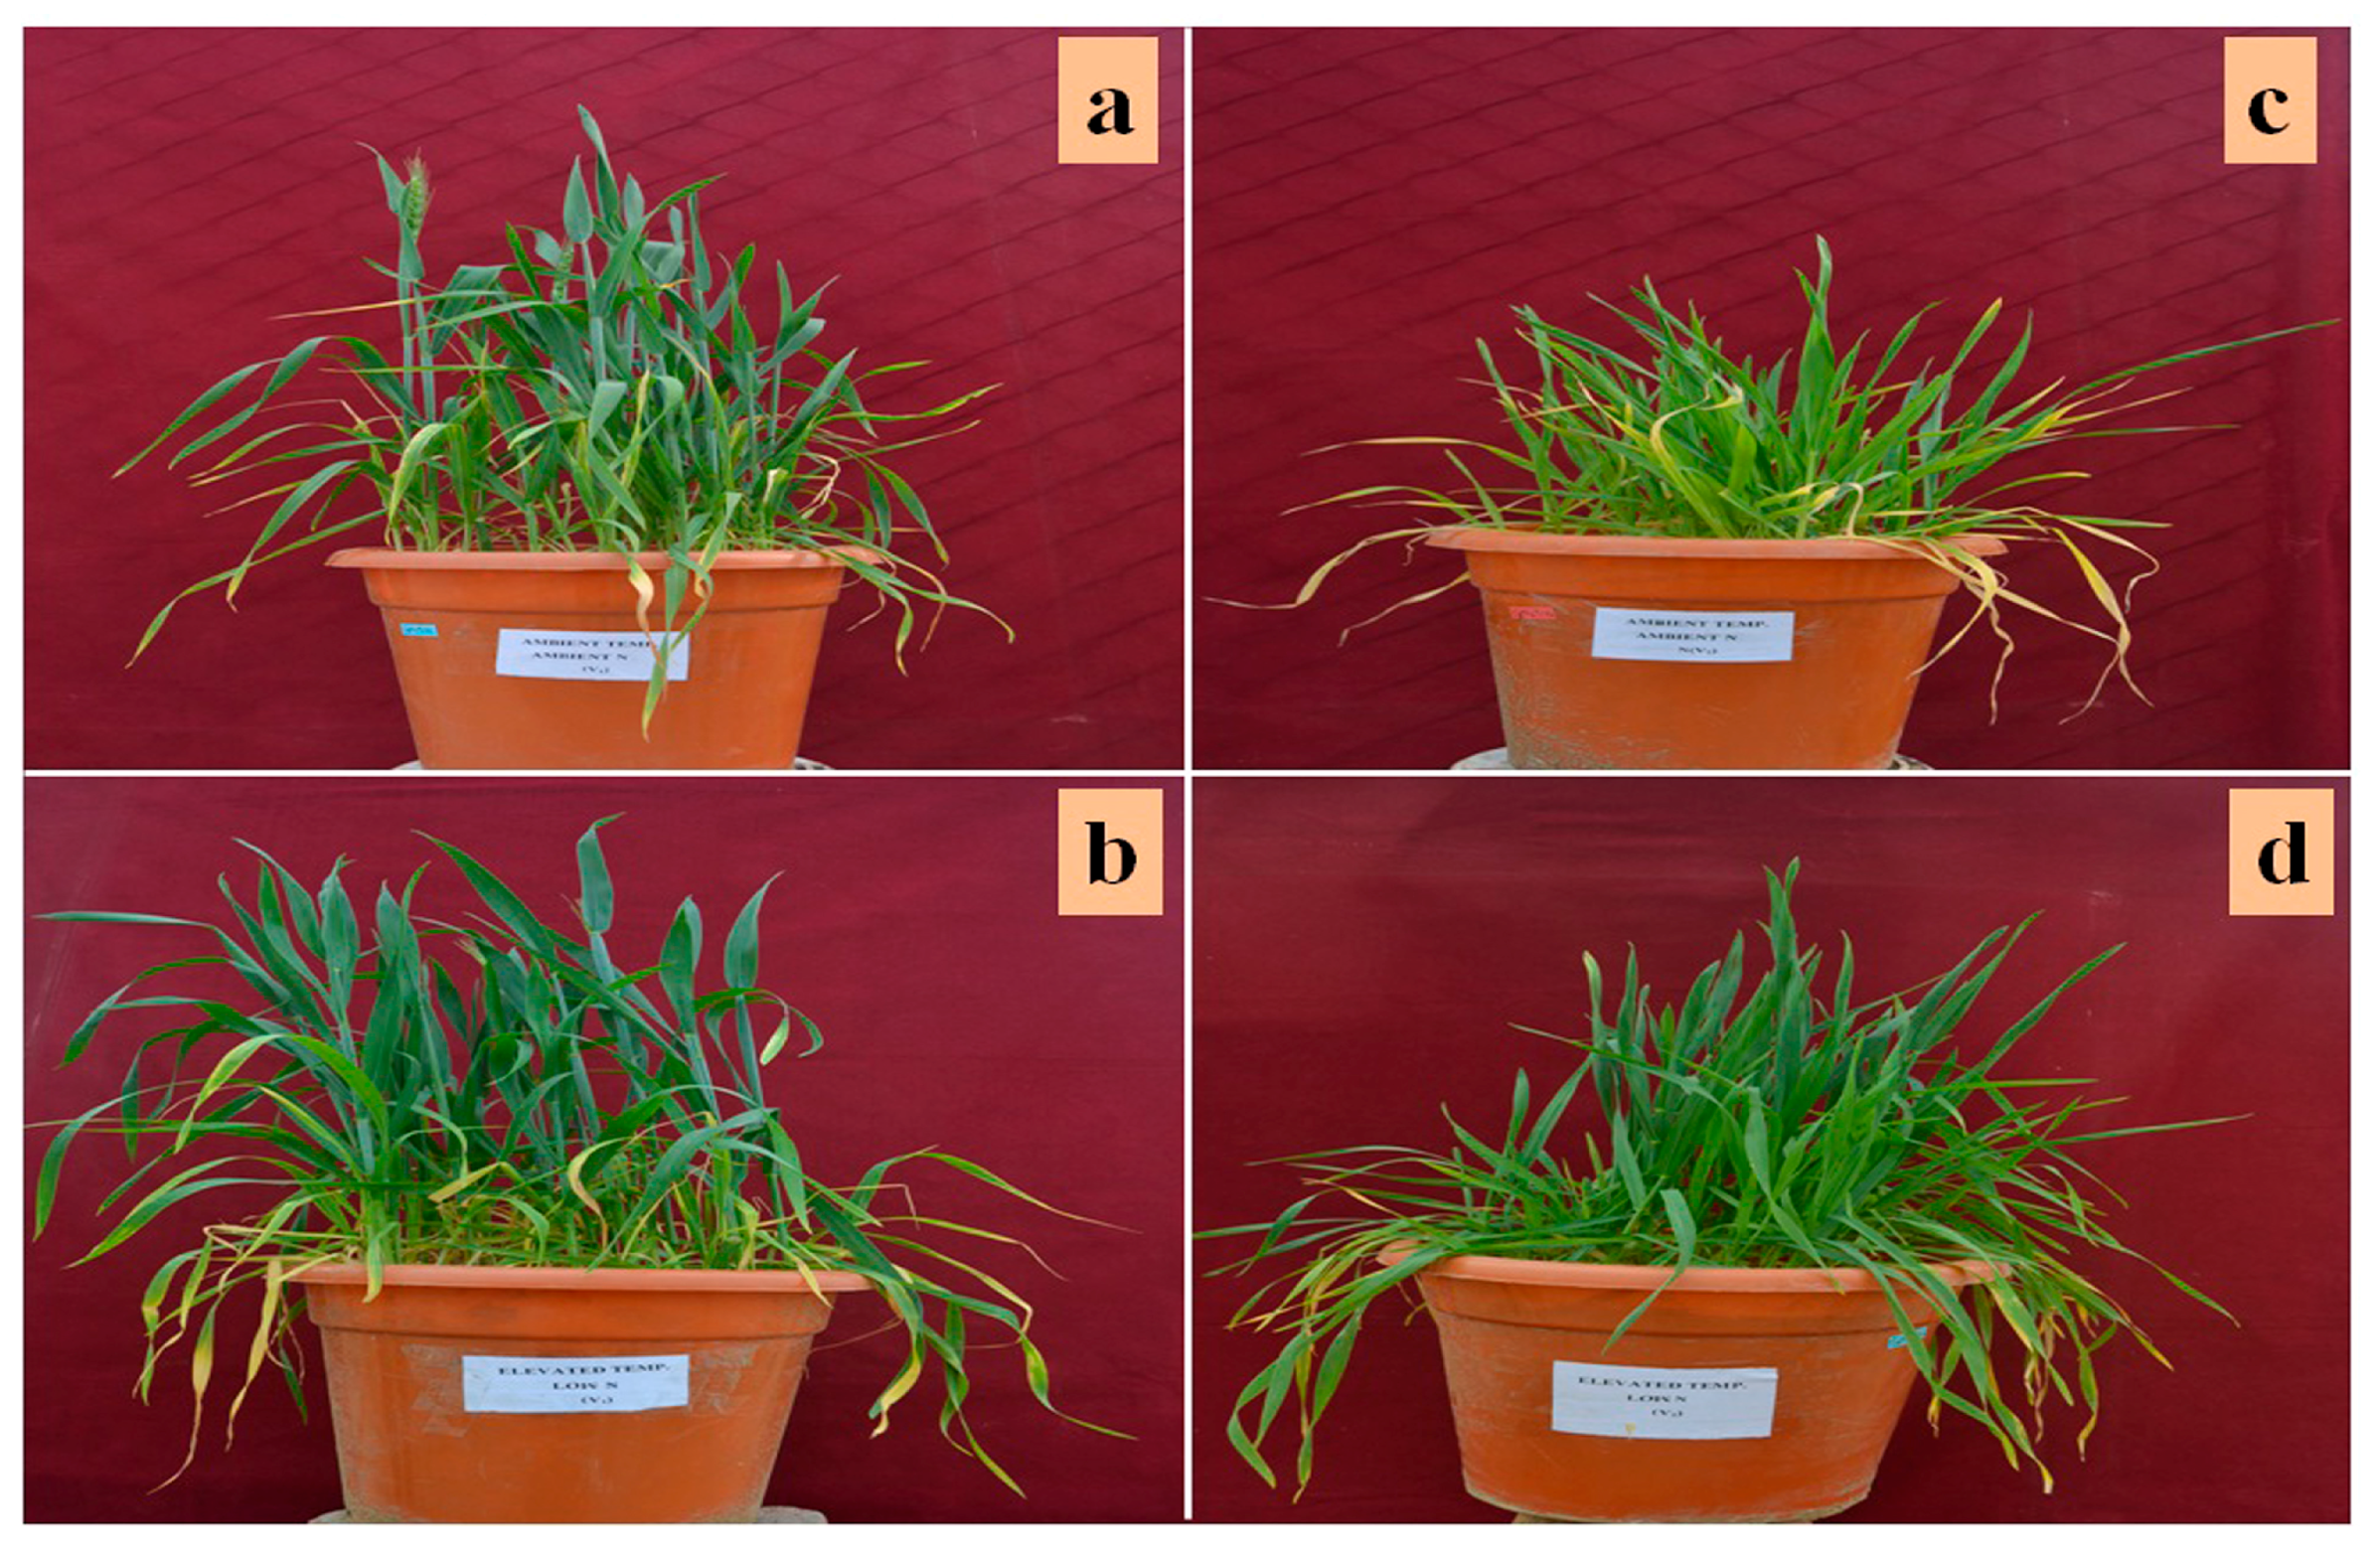
2.1. Plant Culture and Treatments

In an earlier experiment, N-efficient and N-inefficient genotypes of wheat were identified on the basis of physiological and biochemical analyses [31]. Healthy and authenticated seeds of the N-efficient (Triticum aestivum cv. VL616) and N-inefficient (T. aestivum cv. UP2382) wheat cultivars were procured from Vivekanand Parvatiya Krishi Anusandhan Sansthan (Almora, India) and Gobind Ballabh University of Agriculture and Technology (Pantnagar, India), respectively. These were surface-sterilized with 0.1% mercuric chloride for 1–3 min, rinsed thoroughly with distilled water, and germinated in plastic pots filled with soil up to 7 cm below their mouth. Plants were grown in pots in open top chambers at Indian Agricultural Research Institute, New Delhi, India. Nine pots were kept in each chamber with 10 plants in every pot. A control set of potted plants was provided with an optimum level of N (10 mM) and ambient temperature (26 °C), while the treatment set was grown under conditions of low N levels (4 mM) and high temperature (32 °C). The temperature was regulated by infrared heating tubes. Sampling of leaf with three biological and thee technical replicates was done in morning hours at 45-day growth stage (Figure 1). The sampled leaves were immediately dipped in liquid nitrogen and stored at −80 °C until proteomic analysis.

2.2. Protein Extraction

Proteins were extracted from leaf samples by the phenol method of Isaacson et al. [32]. Two grams of leaf material was ground to fine powder in liquid nitrogen and suspended in 10 mL of extraction buffer containing 50 mM HEPES [4-(2-hydroxyethyl)-1-piperazineethanesulfonic acid], 2% β-mercaptoethanol, 700 mM sucrose, 1 mM PMSF (Phenylmethanesulfonyl fluoride), 50 mM EDTA (Ethylenediaminetetraacetic acid) and 100 mM KCl, with pH adjusted to 7.5. Fifteen millilitres of phenol was added, and the solution mixed in a cold room rocker for 30 min. The solution was then subjected to centrifugation at 3000× g for 10 min at 4 °C. The top phenolic phase was carefully recovered in a separate tube, and incubated at −20 °C overnight for precipitation after adding 15 mL of ice-cold 0.1 M ammonium acetate solution. Proteins were pelleted by centrifuging at 6000× g for 15 min at 4 °C, and the pellet washed first by methanol, then two times with acetone. The resultant pellet was centrifuged at 3000× g after each washing step, then dried and solubilised in buffer containing 2 M thiourea, 7 M urea, 4% CHAPS (3-[(3-Cholamidopropyl)dimethylammonio]-1-propanesulfonate hydrate), and 50 mM DTT (Dithiothreitol). Proteins in the samples were quantified by the Bradford method, using bovine serum albumin (Sigma-Aldrich, USA) as standard.

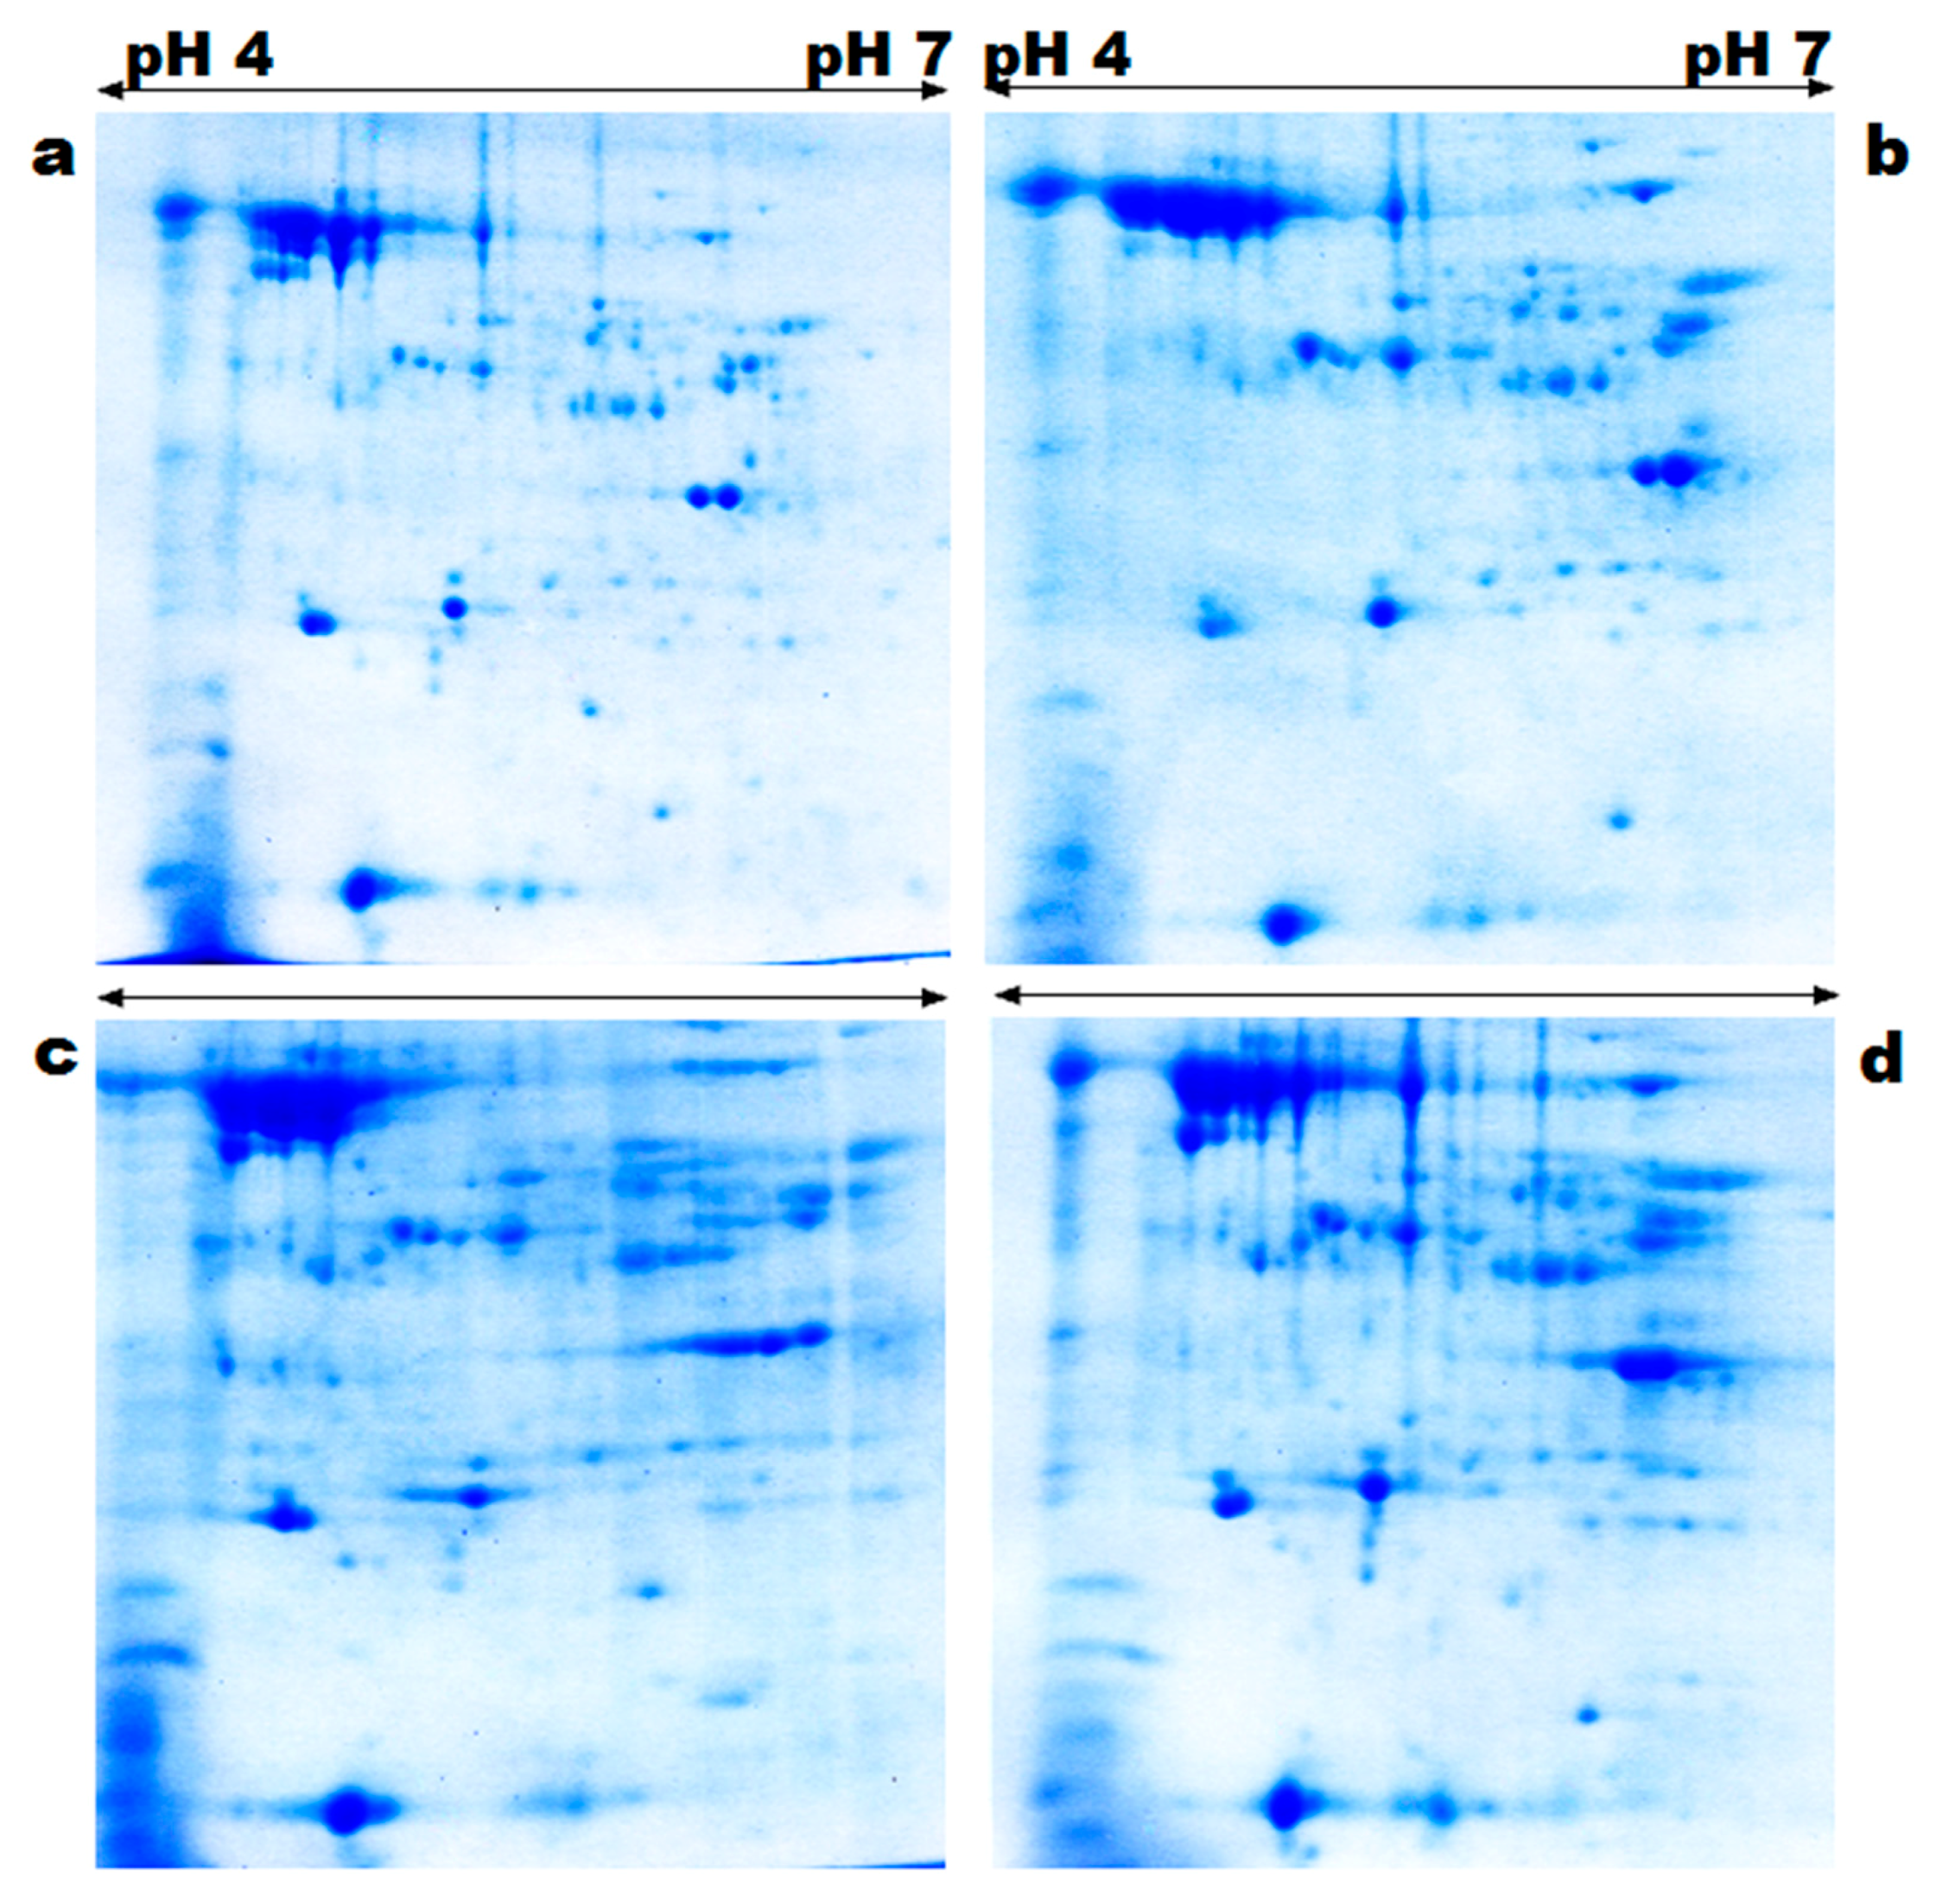
2.3. Two-Dimensional Gel Electrophoresis

Two-dimensional electrophoresis was carried out following the method of O’Farrel [33]. An immobiline dry strip gel (11 cm, pH 4–7; Bio-Rad Laboratories, Inc., Hercules, CA, USA) was rehydrated at 20 °C for 14 h in 200 µL of sample containing 400 µg protein. Isoelectric focusing was carried out in a isoelectric focusing apparatus (PROTEAN® IEF system, Bio-Rad Laboratories, Inc., Hercules, CA, USA). The voltages applied were 250 V for 1 h, 500 V for 1 h, 1000 V for 2 h, 2000 V for 2 h, linear increase of 8000 V for 18 h and 500 V for 1 h. After the completion of isoelectric focusing, the strips were subjected to reduction by the reduction buffer containing 50 mM Tris (pH 8.8), 8 M urea, 20% glycerol, 2% SDS (Sodium Dodecyl Sulfate) and 130 mM DTT and then alkylated for 15 min by alkylation buffer containing Tris (pH 8.8), 8 M urea, 20% glycerol, 2% SDS and 135 mM iodoacetamide. The SDS-PAGE (Sodium Dodecyl Sulfate Polyacrylamide Gel Electrophoresis) was carried out in vertical large format electrophoresis cell (PROTEAN® Plus Dodeca Cell, Bio-Rad Laboratories, Inc., Hercules, CA, USA) for separation of proteins and focusing, using 12% SDS at constant voltage of 250 V. Gels were stained with Coomassie Brilliant Blue dye, and then destained by washing several times with MilliQ water (Milli-Q® Reference, Merck Millipore, Billerica, MA, USA).

2.4. Gel Analysis

Images of the gel were digitised using gel documentation system (GS-900™ Calibrated Densitometer, Bio-Rad Laboratories, Inc., Hercules, CA, USA) for further analysis based on spot density, relative abundance, and location (for pH and mass). The image analysis was performed with image master PDQuest software (version 8.0, Bio-Rad Laboratories, Inc., Hercules, CA, USA). The optimized parameters were as follows: saliency 2.0, partial threshold 4 and minimum area 50. Normalization of each spot value was done in terms of percentage of the total volume of all the gel spots for rectification of unevenness, due to quantitative disparity in spot intensities. Spots were quantified on the basis of their relative volume, which was determined by the ratio of the volume of a single spot to the whole set of spots. Spots with more than 2-fold change in volume during the treatment or with significant variation between the control and other treatments, as determined by the paired Student’s t-test (p ≤ 0.05), were regarded as the treatment-responsive proteins.

2.5. In-Gel Digestion and Protein Identification

Protein spots with more than two-fold change in their intensity were excised from gels and dehydrated with 50 µL of solution, containing acetonitrile and 50 mM ammonium bicarbonate in 2:1 ratio, for 5 min. The dehydrated protein spots were reduced with 15 mM DTT at 60 °C for 1 h and subjected to alkylation by 100 mM isoamyl alcohol in dark for 15 min, rehydrated with 50 mM ammonium bicarbonate and then dried in a speed vac. Dried gel slices were subjected to rehydration with 15 µL of working trypsin (Sequencing grade, Promega, Madison, WI, USA) at 37 °C overnight. Supernatant was taken, and 20% acetonitrile + 1% formic acid were added to the remaining gel slice for further extraction. Final supernatant was dried in a speed vac, until the volume was reduced to 25–50 µL. The final volume was analysed with mass spectrometer (4800 MALDI TOF/TOF™, Applied Biosystems/MDS SCIEX, Foster City, CA, USA), with the peptide tolerance of 150 ppm and peptide charge of 1+. Significant hits, as defined by MASCOT server probability analysis (p < 0.05), were accepted. Peptides were searched with NCBInr database, taxonomy of green plants, trypsin of the digestion enzyme, one missed cleavage site, partial modification of cysteine carboamidomethylated and methionine oxidized. NCBI [34] and UniProt [35] databases were used to assemble the functional information of identified proteins. On the other hand, pTARGET and UniProt databases were used to recognize the sub-cellular location of identified proteins [36]. Identified proteins were categorized on the basis of their biological functions.

2.6. Statistical Analyses

All experiments in the present study were performed from pool of three biological and three experimental replicates. A two-tailed Student’s t-test with significance of 95% was performed on normalised value of protein spots, with the help of SPSS software (SPSS for Windows, Version 16.0. SPSS Inc., Chicago, IL, USA).

3. Results

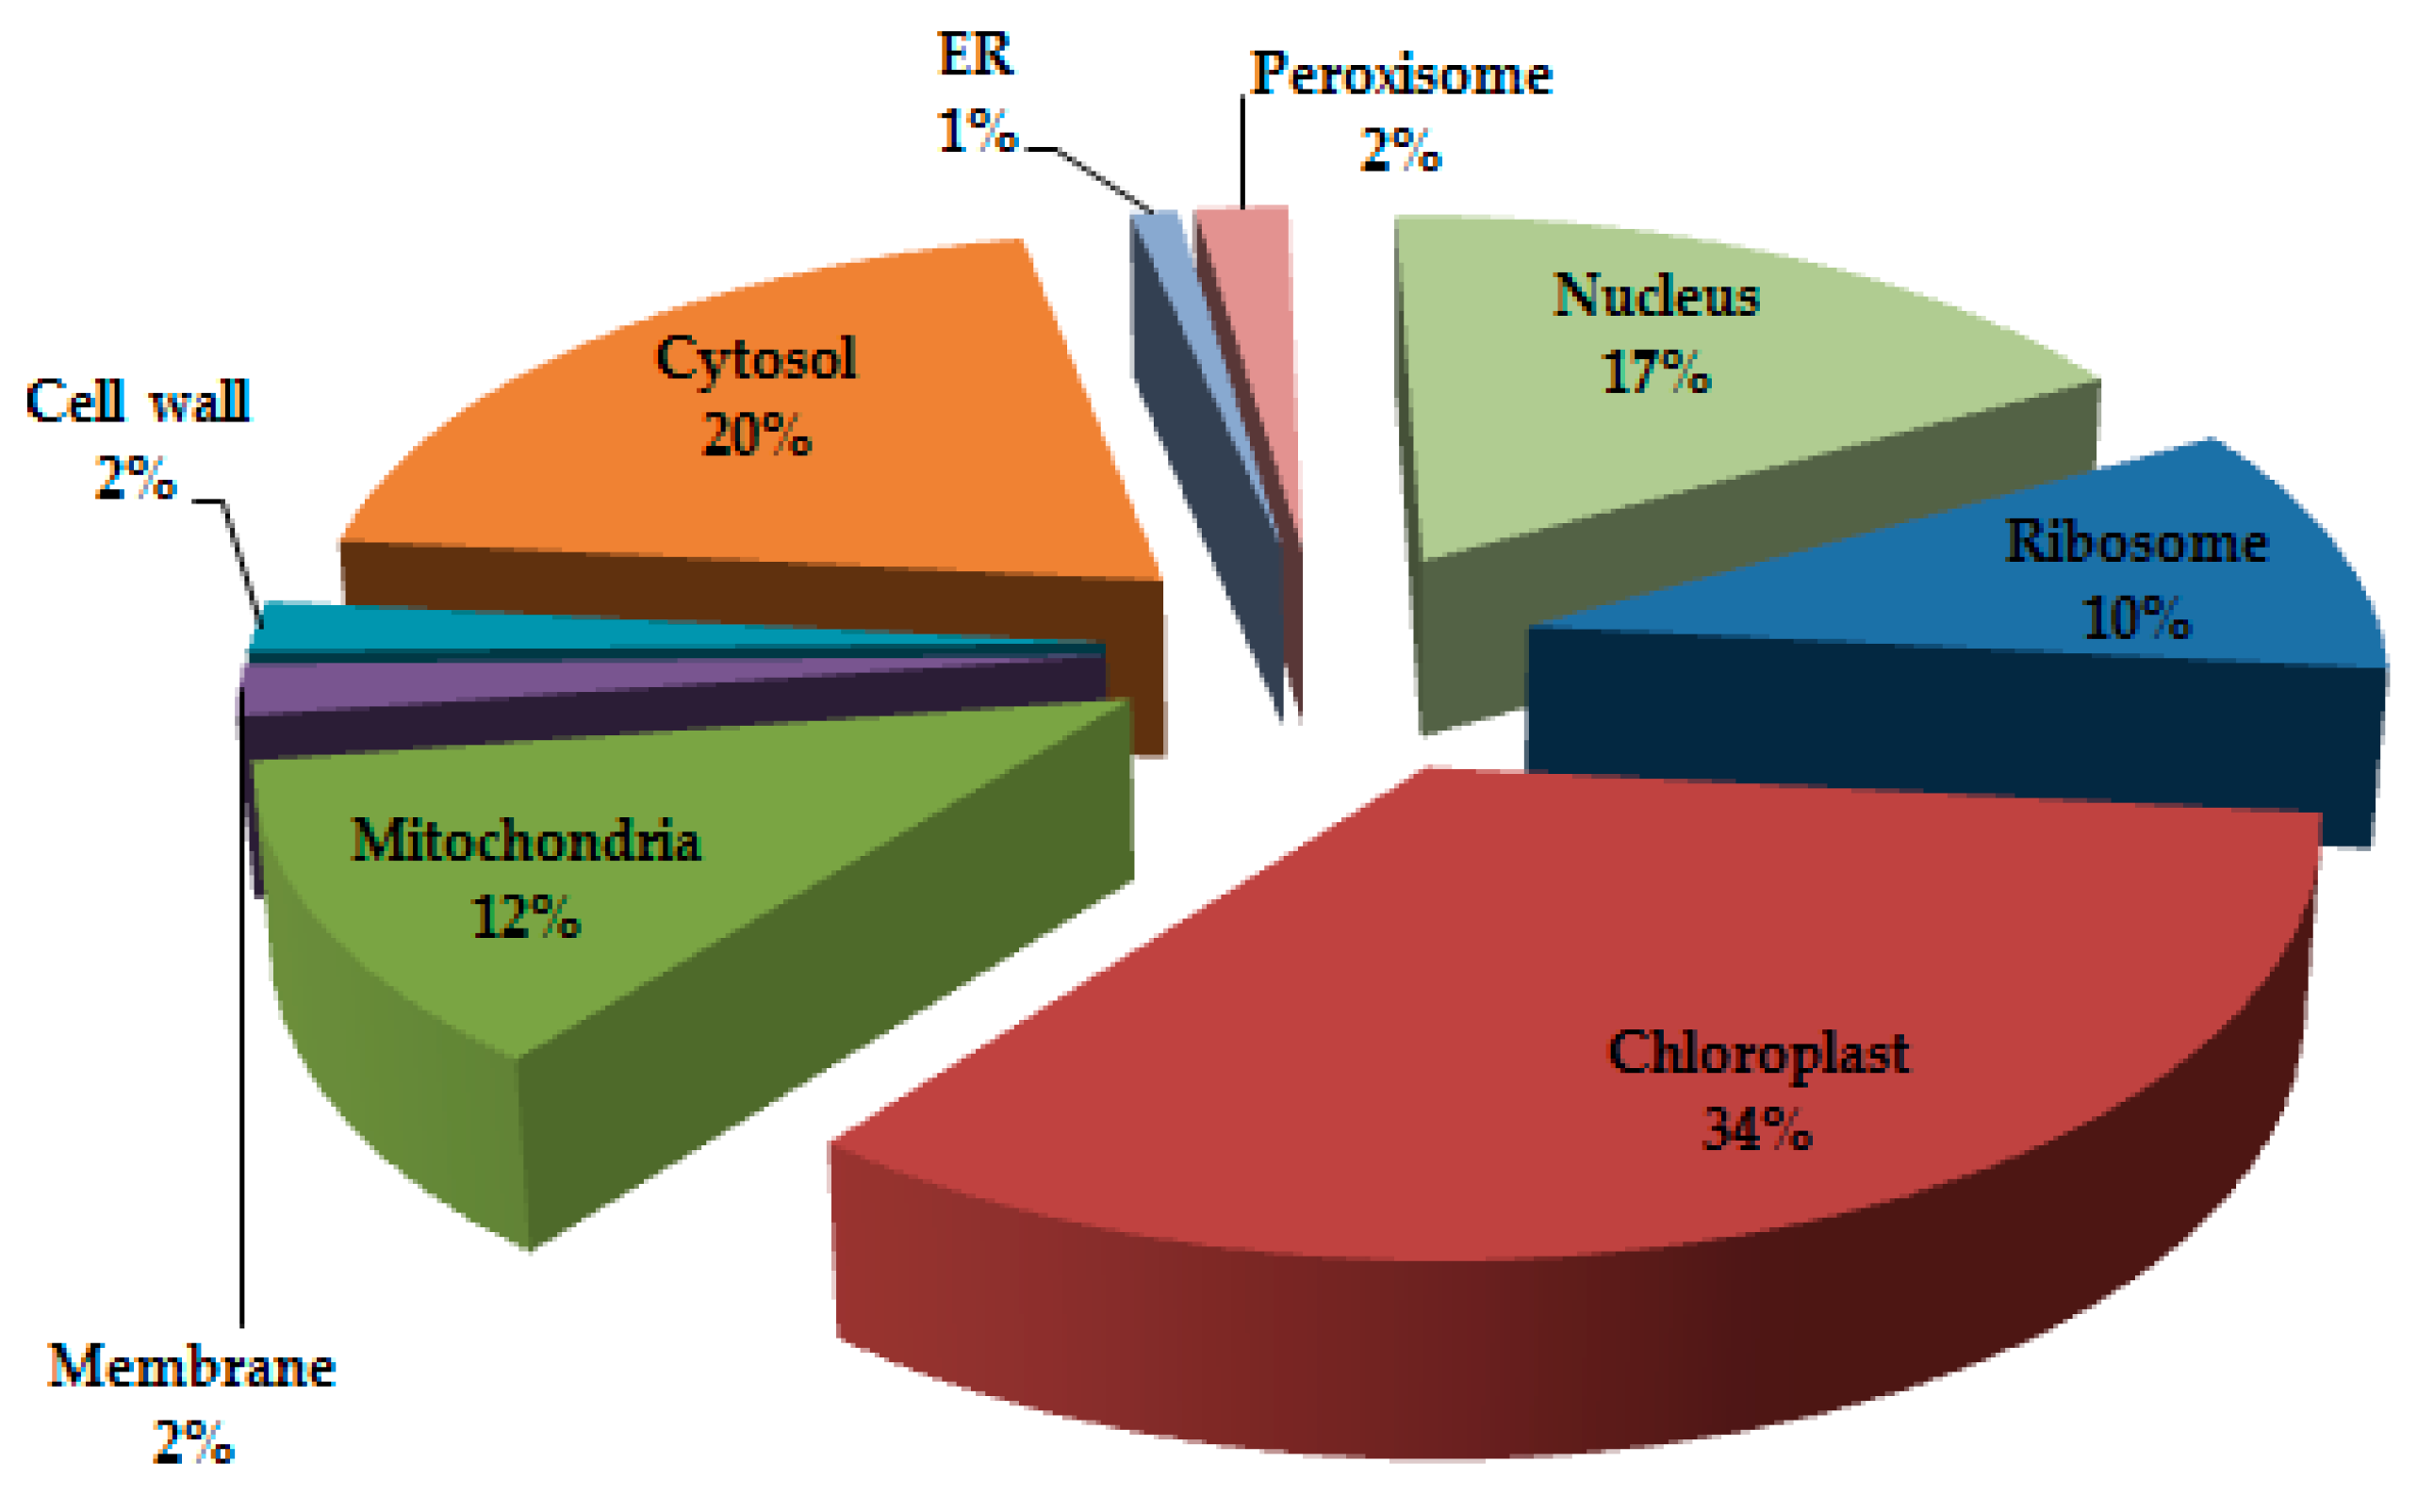
3.1. Protein Profiling and Spatial Categorization of Differential Protein Expression

During two-dimensional gel electrophoresis (2-DE), leaf proteins of the two wheat varieties were distributed throughout the gel. The staining of gels detected 484 protein spots. Of these, 61 (12%) proteins were differentially expressed with more than two-fold change from the control; 42 (69%) of them were upregulated and 19 (31%) downregulated. These differentially expressed proteins, along with their position in 2-DE profiles, are illustrated in Figure 2. They belonged to different subcellular sites (Figure 3); most of them to chloroplast (34%), then to cytosol (20%), nucleus (17%), mitochondrion (12%), and ribosome (10%). A few of them also belonged to peroxisome (2%), membrane (2%), cell wall (2%), and endoplasmic reticulum (ER) (1%).

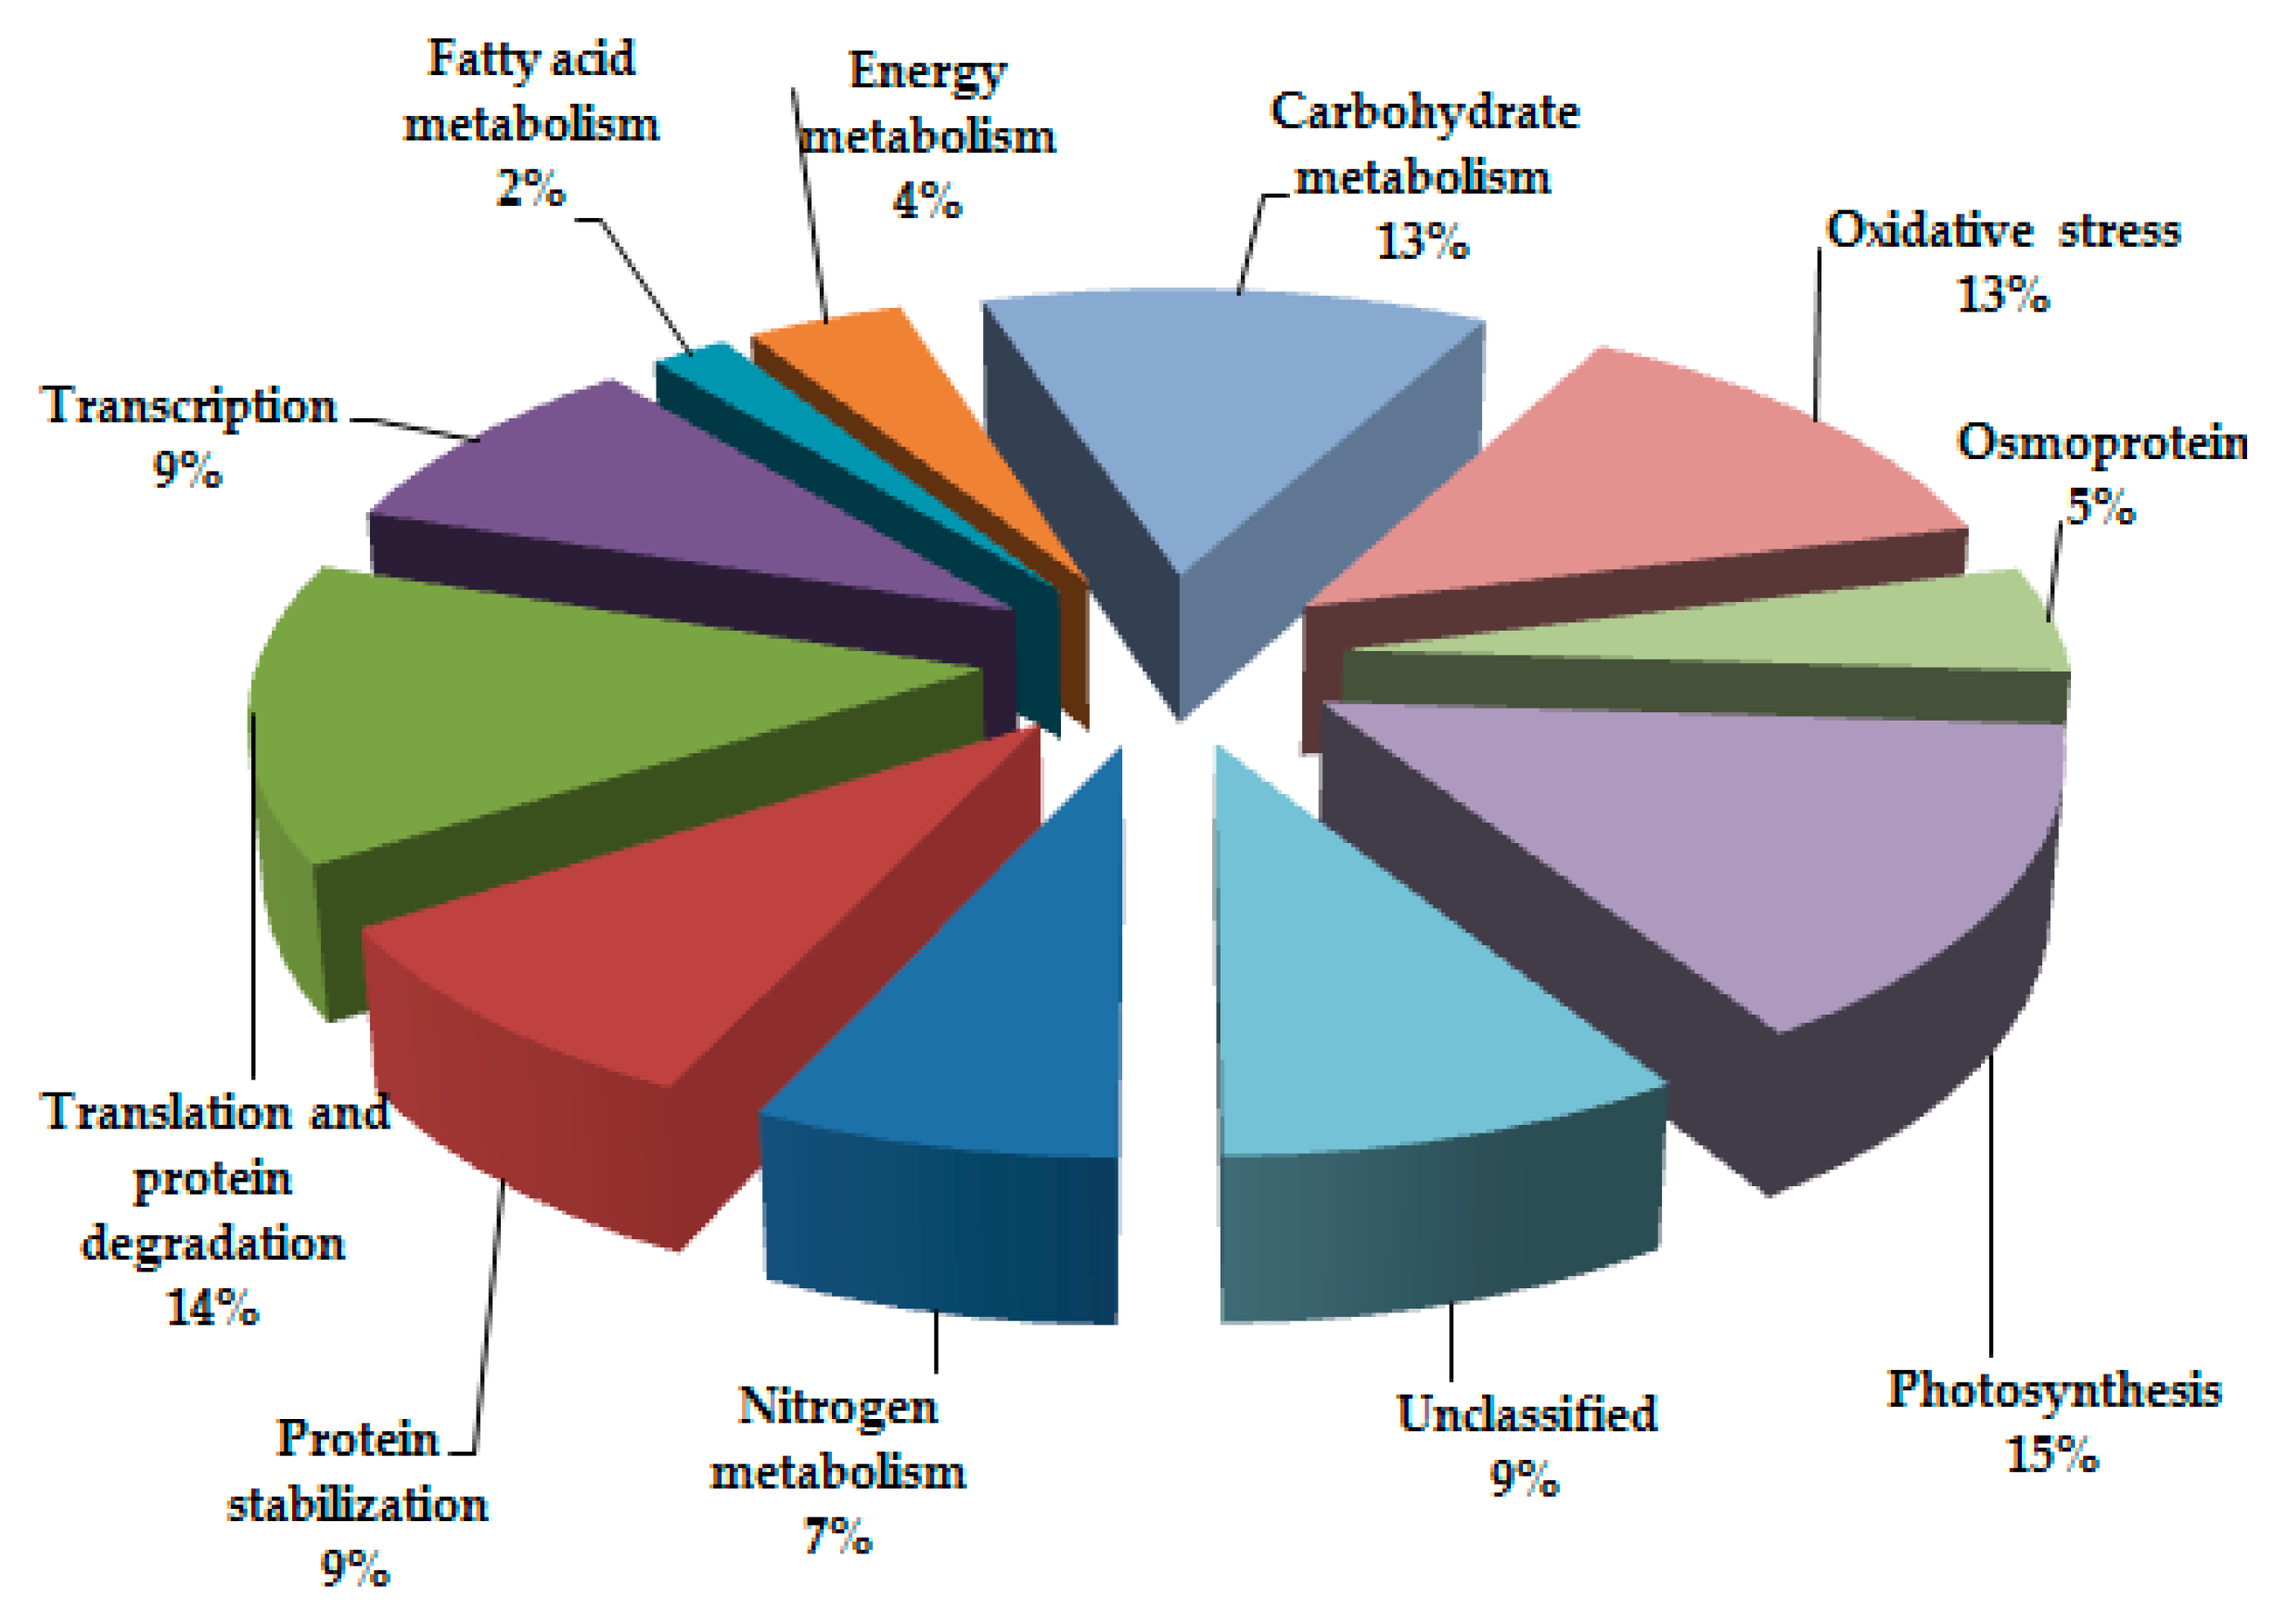
3.2. Functional Cataloguing and Expression-Profile Analysis

Among the 61 identified proteins, 55 (76%) exhibited homology with proteins of known functions, while the rest 6 (24%) were unknown. Based on their association with physiological processes, these proteins were categorized into eleven major groups (Figure 4), viz., nitrogen metabolism (7%), translation and protein degradation (14%), transcription (9%), fatty acid metabolism (2%), energy metabolism (4%), carbohydrate metabolism (13%), oxidative stress (13%), osmoprotection (5%), photosynthesis (15%), protein stabilization (9%), and unclassified function (9%). Details of these proteins, including the relative spot intensities, are shown in Table 1.

4. Discussion

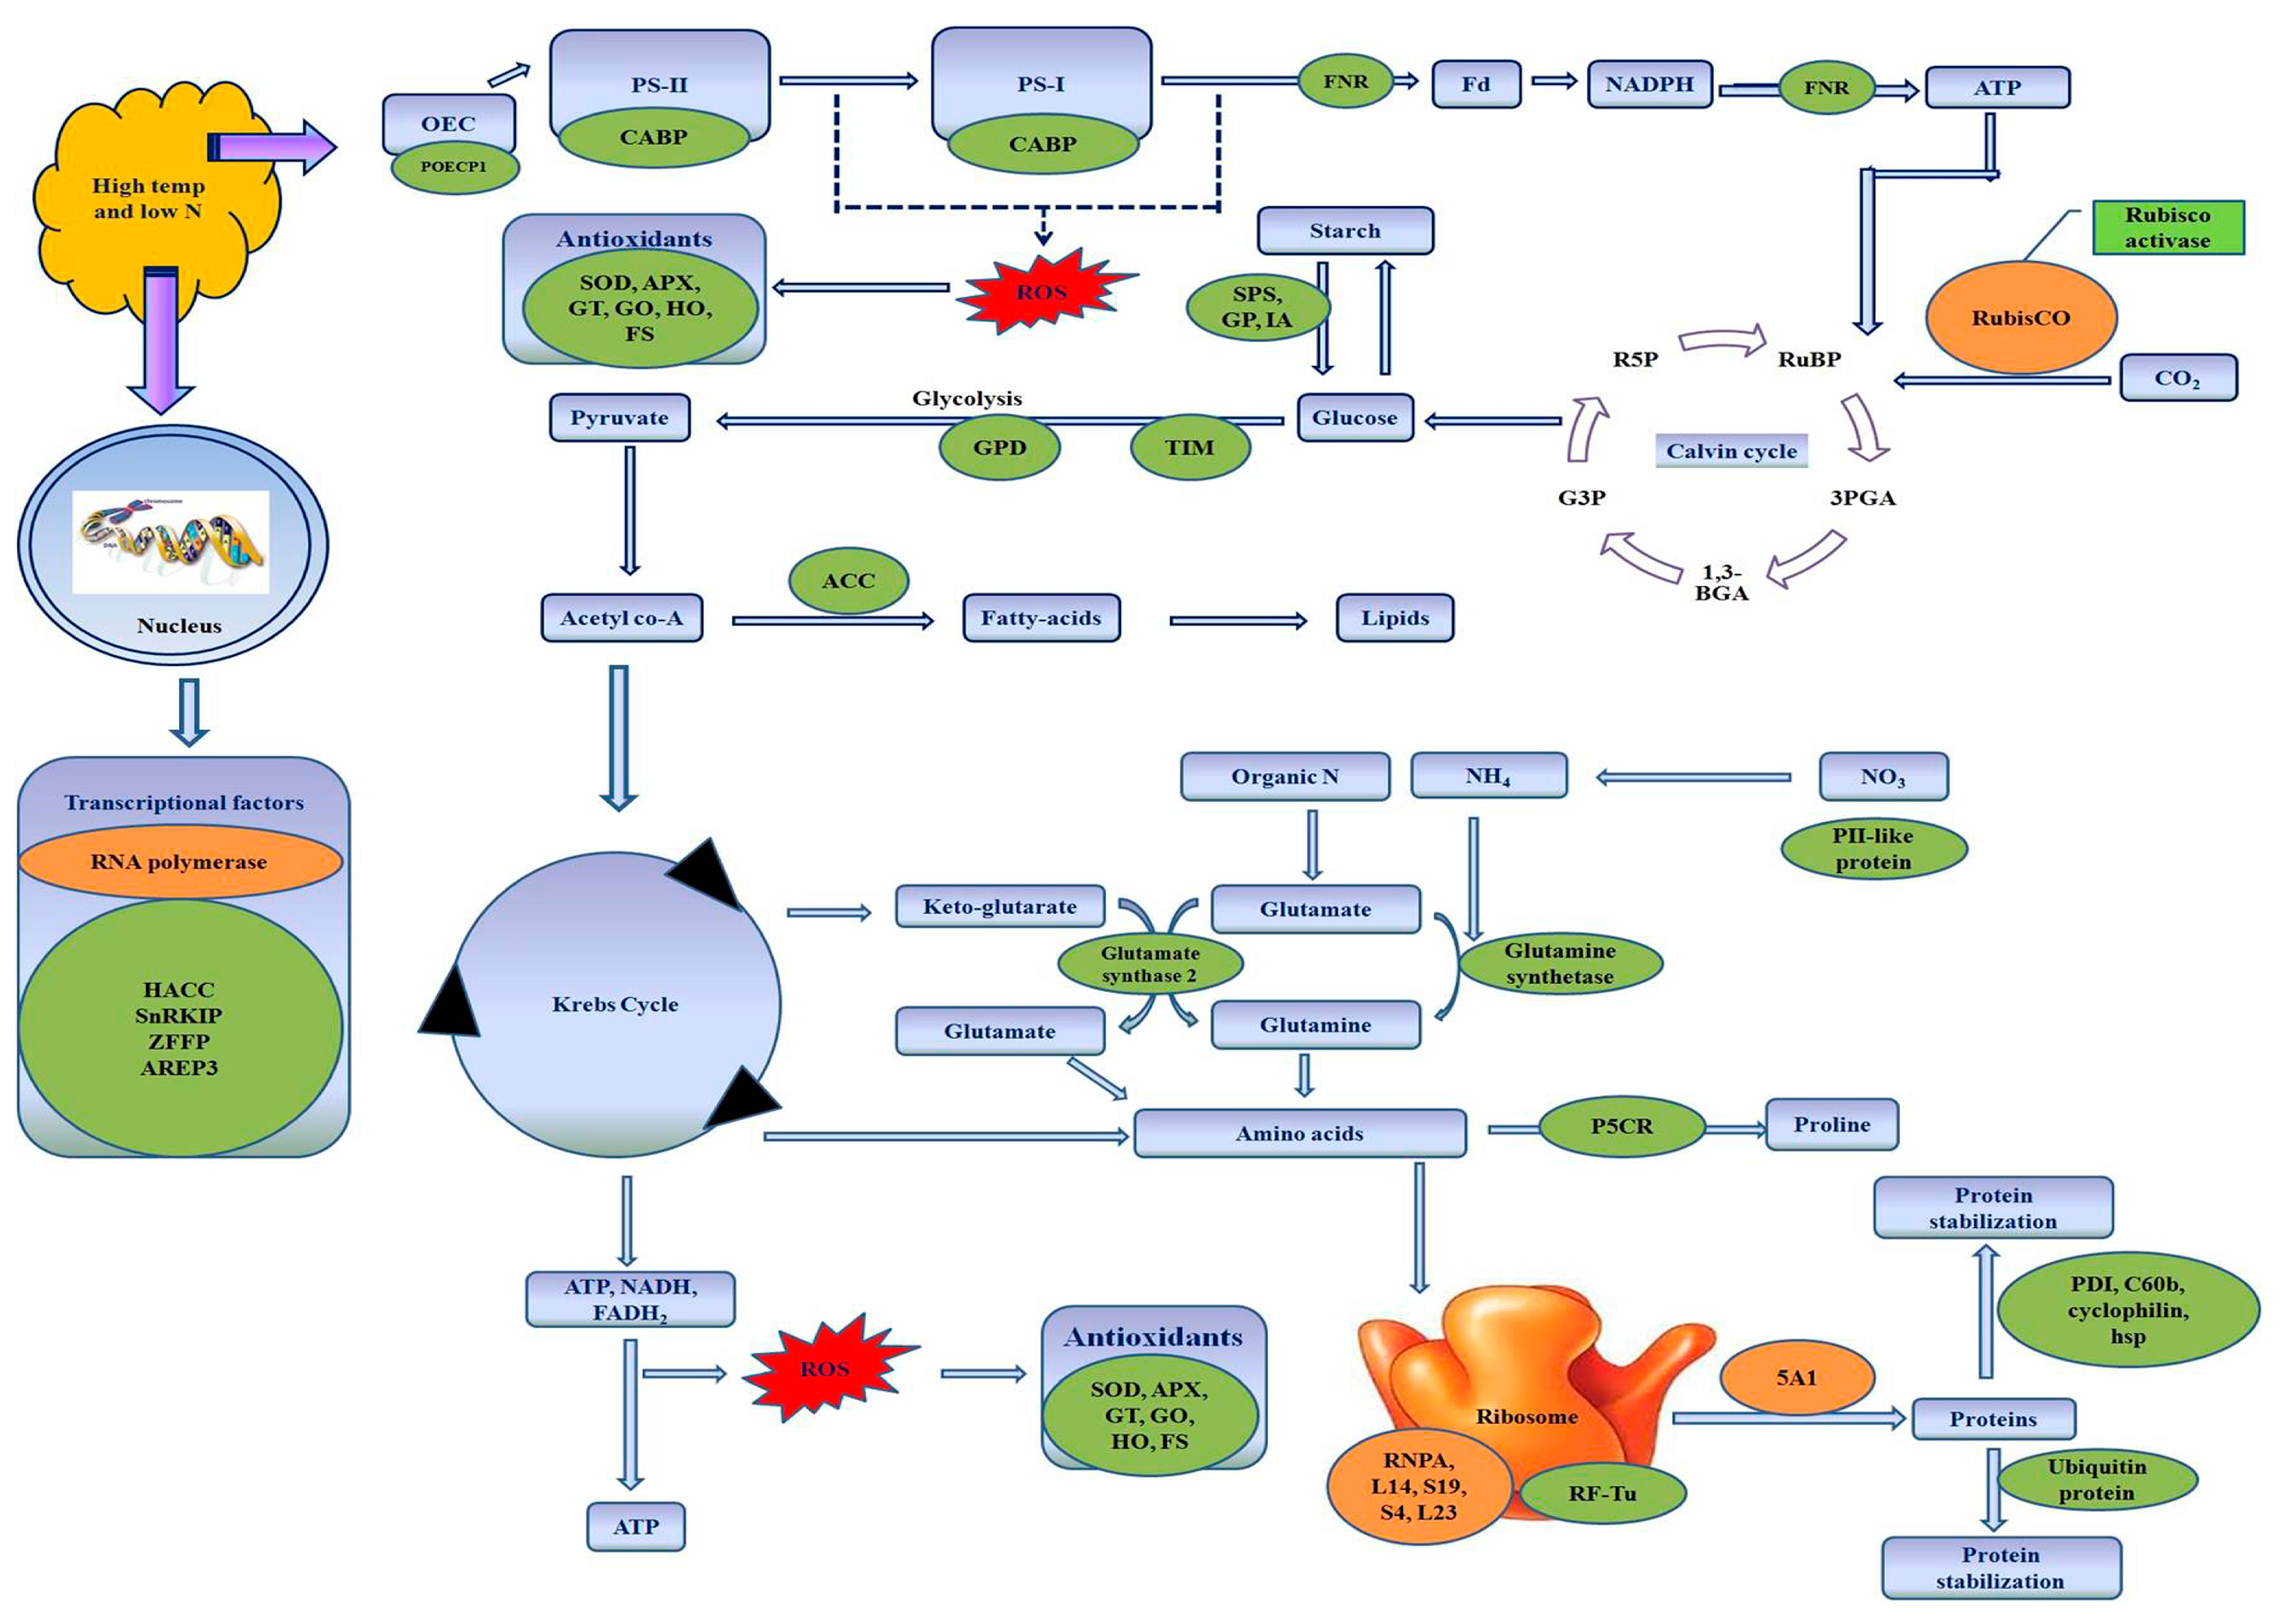
4.1. Proteins Related to Nitrogen Metabolism

Nitrogen metabolism often correlates with the nutritional status of field crops, and plants with higher nitrogen-use efficiency (NUE) normally have higher yields and protein contents [37]. Nitrogen limitation, as well as high temperature, affects all components related to NUE, including morphology of root systems, soil mineral uptake, and symbiotic nitrogen fixation [38]. Plants thus need to maintain nitrogen homeostasis within the body under such stressful conditions. In our study, proteins involved in nitrogen sensing and assimilation exhibited diverse expression patterns during treatments. One of the differentially-expressed proteins was identified as PII-like protein, an important signal transduction protein that senses and regulates N and C assimilation [39]. This (spot 6) increased in intensity with maximal upregulation in the N-efficient cultivar, possibly to regulate N levels under low N conditions for maintaining an optimal plant growth. In addition, two N-assimilating proteins, glutamine synthetase (spot 1) and ferredoxin-dependent glutamate synthase 2 (spot 11), exhibited a change in abundance. These enzymes catalyse two primary steps of the ammonia-assimilation pathway; the former accelerates the condensation of ammonia and glutamate to form glutamine, while the latter catalyses the synthesis of glutamate from glutamine and 2-oxoglutarate through transamidation reaction. Both of them were upregulated, probably to maintain N levels in leaves and achieve osmotic homeostasis via glutamate-based synthesis of proline. Our results are consistent with earlier works that showed increased level of these enzymes under low N [40,41,42] and drought [43] conditions. The overexpression of genes encoding these N-assimilating proteins has been associated with tolerance of plants under salinity [44] and drought stress [45]. Another N-regulatory protein, glucosamine-fructose-6-phosphate amino-transferase, which plays a key role in glutamine metabolic process and in the cell wall-chitin biosynthesis process, was upregulated (spot 28) in the stressed wheat plants.

4.2. Proteins Related to Photosynthesis

Photosynthesis is the key process that determines growth and development of plants, and encompasses reactions catalysed and regulated by proteins in the chloroplast. Four proteins related to photosynthesis varied in expression during the combined stress. One of them was identified as chlorophyll a/b binding protein, which confers stability to light-harvesting complexes (LHC) of photosystems. This protein (spot 34) increased in abundance under stress conditions, substantiating some earlier findings with reference to abiotic stresses [46,47]. The stress also affected the oxygen-evolving complex (OEC) involved in photo-oxidation rate of water. Photosystem II oxygen-evolving complex protein 1 (spot 5) increased, possibly to maintain stability of the complex. Parallel results were reported earlier in food crops, including rice [48], barley [49,50], wheat [50,51], and tomato [52] exposed to different abiotic stresses. Further, electron transport in chloroplast was also affected; spot intensity of FNR (spot 32), an enzyme that catalyses transfer of electrons from photosystem I (PSI) to ferredoxin, besides contributing to antioxidant defence, N fixation, and isoprenoid biosynthesis [53], was also increased.
Combined stress of high temperature and low nitrogen affected both the abundance and mode of regulation of Rubisco, which catalyses CO2 fixation and is one of the primary determinants of photosynthetic rate. The decrease in its spot intensity (spots 40, 46, 52) could be due to its degradation. Our results are in line with some previous findings in wheat grown under high temperature [54] and drought conditions [55]. Environmental stress, particularly high temperature, not only degrades Rubisco, but also accelerates its inactivation by addition of inhibitory sugars to its active site. Moreover, Rubisco has a relatively low turnover number, compared with the other Calvin cycle enzymes. Activity of Rubisco is mainly regulated by a catalytic chaperone (Rubisco activase), which catalyses removal of inhibitory sugars from its active site, switching the enzyme to active mode [56]. In the present study, Rubisco activase increased significantly in abundance under stressful conditions signifying its potential to regulate Rubisco activity (spot 38). These results substantiate the earlier ones dealing with the effect of high temperature on rice [57] and Carissa spinarum [58], and of N deficiency on wheat [59].

4.3. Proteins Associated with Osmoregulation

One of the primary effects of high temperature is alteration of turgor within cells, often reducing plant growth and productivity. Plants synthesise compatible solutes that help in maintaining cell turgor, regulating redox homeostasis and stabilising proteins and other cell contents [60]. Proline functions in plants as an osmoprotectant, besides assisting in protein stabilization and buffering of redox potential [61]. It is synthesized mainly from glutamate by enzyme pyrroline-5-carboxylate synthetase, which catalyses conversion of glutamate to glutamic-γ-semialdehyde, which is reduced by pyrroline-5-carboxylate reductase to proline [62]. Pyroline-5-carboxylate synthetase enzyme was found to increase, implying accumulation of proline to decipher stress tolerance (spot 4). Histidine kinase (CRE1), a cytokinin receptor involved in cytokinin signalling and regarded as an osmosensor [63], was also upregulated (spot 8), possibly to confer osmotic balance during water-deficient conditions. Another protein with a role in osmoprotection [64] was identified as abscisic acid-inducible protein kinase (spot 16).

4.4. Proteins Related to Antioxidant Defense System

Overproduction of reactive oxygen species (ROS) due to abiotic stress can oxidize life-supporting biomolecules, such as lipids, proteins, carbohydrates, and nucleic acids. To regulate the oxidative homeostasis, plants possess a well-organised antioxidant defence system that helps in scavenging of ROS. Six differentially-expressed proteins, namely, superoxide dismutase (spot 35), ascorbate peroxidase (spot 15), glutathione transferase (spot 2), glyoxalase (spot 14), heme oxygenase (spot 10), and flavonol synthase (spot 20), were involved in antioxidant defence. Superoxide dismutase forms the first line of defence against oxidative stress by catalysing dismutation of superoxide ions to hydrogen peroxide. Ascorbate peroxidase scavenges H2O2 molecules formed by the action of SOD, and glutathione transferase catalyses conjugation of glutathione with toxic electrophiles generated as by-products of oxidative damage caused by hydroxyl radicals. Glutathione transferase helps in generating ascorbate from dehydroascorbate, besides safeguarding proteins from ROS-induced damage, by reducing hydroperoxides to less damaging alcohols [65]. Glyoxalase regulates glutathione homeostasis during abiotic stress [66], and is implicated in detoxification of methylglyoxal, a highly reactive dicarbonyl aldehyde compound, which accumulates in plants under stress as a glycolytic intermediate [67]. The fifth differentially expressed protein involved in oxidative defence was recognised as heme oxygenase, which also regulates various cellular processes, including iron acquisition and mobilization, stomatal opening and closure, and phytochrome chromophore synthesis [68]. In addition, flavonol synthase protein with a key role in biosynthesis of antioxidant flavonols [69] showed differential expression (spot 20). All these antioxidant proteins showed increase in spot intensity in the stressed material, compared to the control.

4.5. Proteins Related to Carbohydrate Metabolism

Starch degradation in plants serves as an effective means to tolerate stress by meeting energy demands and strengthening antioxidant defence system through production of NADPH, and by diverting substrates to oxidative pentose phosphate pathway [70]. In this study, three starch-degrading proteins, viz. sucrose phosphate synthase (spot 3), alpha-1,4-glucan phosphorylase (spot 7) and isoamylase (spot 42), increased in abundance due to stress.
Moreover, combined stress affected the primary carbohydrate metabolic pathways, glycolysis, and tricarboxylic acid (TCA) cycle. Expression of two glycolytic enzymes; triosephosphate isomerase (spot 22) and glyceraldehyde 3-phosphate dehydrogenase (spot 31) decreased significantly. The former catalyses interconversion of dihydroxyacetone phosphate (DHAP) and d-glyceraldehyde 3-phosphate (GAP), while the latter facilitates conversion of glyceraldehyde 3-phosphate into 1,3-bisphosphoglycerate. Besides, two Krebs cycle enzymes, sedoheptulose-1,7-bisphosphatase (spot 27) and malate dehydrogenase (spot 61) were downregulated, possibly due to decreased CO2 uptake or as a strategy to save energy under stressful conditions [71].

4.6. Proteins Related to Energy Metabolism and Fatty Acid Metabolism

The combined stress induced overexpression of two proteins related to energy metabolism, viz. ATPase F1 α subunit (spot 12) and ATPase (spot 39). ATPase catalyses dissociation of ATP into ADP, and its upregulation in the stressed wheat plants possibly conferred energy expenditure required to cope with the stress.
Acetyl-CoA carboxylase catalyses carboxylation of acetyl-CoA to form malonyl-CoA during fatty acid synthesis. This cytosolic enzyme has a role in membrane stability and biosynthesis of flavonoids, which act as ROS scavengers [72]. The enzyme showed a significant increase (spot 37) in spot intensity, with expression levels relatively higher in N-efficient cultivar than in N-inefficient one. Our results go in line with earlier findings in peanut, where abundance of protein increased significantly under water-deficit conditions [73].

4.7. Proteins Related to Transcription and Protein Synthesis

Plant response to abiotic stress includes biosynthesis of tolerance-conferring proteins, and degradation or inactivation of unwanted or interfering ones. Transcription and protein synthesis are fine-tuned under stress. A marked decrease in transcription rate was evident from downregulation of RNA polymerase (spot 36). Other transcription-related proteins were histone acetyltransferase complex component (spot 44), SnRK1-interacting protein 1 (spot 47), zinc finger family protein (spot 51), and ABA (abscisic acid)-responsive element-binding protein 3 (spot 49), which help (i) in making DNA more accessible to transcription factors by reducing its interaction with histone proteins, (ii) in sensing low cellular glucose levels and enhancing metabolic signalling and carbon partitioning, (iii) in regulating transcription, protein–protein interaction and RNA binding, and (iv) in regulating ABA-dependent signalling systems that mediate stress adaptation. Spot intensity of all these transcription-related proteins markedly increased in stressed plants.
Abiotic stress inhibits translation in plants [74,75]. Intensity of five structural ribosomal proteins, viz. ribonucleoprotein A (spot 17), ribosomal protein L14 (spot 19), ribosomal protein S19 (spots 23 and 54), ribosomal protein S4 (spot 56), and ribosomal protein L23 (spot 60), including a translational factor 5A1 (spot 48), significantly declined in stressed plants, compared to the control. However, elongation factor-Tu (EF-Tu), the main protein synthesis elongation factor of plant organelles, which is also involved in chaperone activity, facilitation of protein renaturation, protein disulfide isomerase activity and degradation of N-terminally blocked proteins via the action of proteasome [76], was upregulated (spot 24). It has been shown that accumulation of EF-Tu in plants confers tolerance against environmental stress [76,77,78].

4.8. Changes in Proteins Involved in Protein Stabilization and Degradation

Most of the proteins are thermo-labile, and likely to get denatured under high temperature. Maintaining proteins in stable and functional conformations and preventing their aggregation are essential for survival of cells under high temperature. Various molecular chaperones are the basic components of innate immunity of plants. Five proteins; viz. disulfide isomerase (spot 9), chaperonin 60b (spot 13), cyclophilin (spot 18), heat-shock protein (spot 29), and heat shock-responsive transcription factor (spot 30), related to protein stabilization, were differentially expressed. Protein disulfide isomerase (PDI) is a chaperone engrossed in protein folding in endoplasmic reticulum via disulfide bond formation and isomerisation. Upregulation of PDI has been reported in bent grass and sorghum in response to drought stress [79,80]. Chaperonin 60b is another folding protein involved in protecting rubisco activase from denaturation and acclimating photosynthesis under heat stress [81]. Cyclophilins are ubiquitous proteins with an intrinsic peptidyl-prolyl cis-trans isomerase activity, and assist in protein folding and stability [82]. In the chloroplast, cyclophilins assist proteins such as oxygen-evolving complex proteins, to sequester and protect unassembled and degradation-prone lumenal proteins [83]. Two more proteins involved in protein stabilization were identified as small heat shock protein and heat shock-responsive transcription factor, which are involved mainly in heat tolerance. All these stabilising proteins were overexpressed, implying efficient protein repair systems and general protein stability that possibly facilitated plant survival under stressful conditions.
One of the efficient responses by plants to environmental stress is ubiquitination that involves alterations of proteome, including “switch on” of regulatory proteins, removal of malformed proteins and regulation of signalling proteins [84]. In this study, ubiquitin protein (spot 43) was upregulated in stressed plants, compared to the control.

4.9. Unclassified Proteins

During the period of stress, some proteins, the functions of which were neither clear nor directly related to stress conditions, were also expressed differentially. Osmotin-like protein (spot 21) is possibly involved in cell wall modifications. The functions of transposon protein, CACTA, En/Spm subclass (spot 45), and PR (Pathogenesis-related) -10 protein (spot 50) are still obscure. Inorganic pyrophosphatase family protein (spot 57) plays a key role in pyrophosphate metabolism, and regulates phosphorus levels within the cells. Methionine synthase (spot 59) regulates the synthesis of methionine, an amino-acid, which involves in the initiation of mRNA translation and regulation of molecular processes in the form of S-adenosylmethionine (SAM).

5. Conclusions

In conclusion, the combined stress of low N and high temperature alters different growth processes in wheat, the response of the plant being cultivar-dependent. Most of the proteins associated with defence mechanisms against heat, water deficit, N deficit, and oxidative stresses were upregulated; the degree of defence was higher in N-inefficient cultivar UP2382 than in N-efficient VL616. The majority of proteins involved in photosynthesis (RuBiSCo) and carbohydrate metabolism were downregulated with a more prominent setback in UP2382 than in VL616. On the basis of relevant biological function and increasing trend of expression, we could identify stress-responsive proteins (schematically represented in Figure 5 and Figure 6), which may be used as suitable candidates for increasing the tolerance of wheat under stress, and hence contributing to food security during harsh environmental conditions.

Acknowledgments

Authors (E.F.A., A.A.A., A.H.) would like to extend their sincere appreciation to the Deanship of Scientific Research at King Saud University for its support to the Research Group number (RG-1435-014).

Author Contributions

P.Y.Y., M.N. and A.A. conceived and designed the experiments; P.A.A. and M.N. performed the experiments; P.A.A., E.F.A. and A.H. analysed the data; A.A. contributed reagents/materials/analysis tools; P.A.A., Am.As., E.F.A., A.A.A. and A.A. prepared and wrote the paper.

Conflicts of Interest

The authors declare no conflict of interest.

References

  1. Fischer, R.; Edmeades, G.O. Breeding and cereal yield progress. Crop Sci. 2010, 50, 85–98. [Google Scholar] [CrossRef]
  2. Zou, J.; Liu, C.; Chen, X. Proteomics of rice in response to heat stress and advances in genetic engineering for heat tolerance in rice. Plant Cell Rep. 2011, 30, 2155–2165. [Google Scholar] [CrossRef] [PubMed]
  3. Madan, P.; Jagadish, S.V.; Craufurd, P.Q.; Fitzgerald, M.; Lafarge, T.; Wheeler, T.R. Effect of elevated CO2 and high temperature on seed-set and grain quality of rice. J. Exp. Bot. 2012, 63, 3843–3852. [Google Scholar] [CrossRef] [PubMed]
  4. Sánchez, B.; Rasmussen, A.; Porter, J.R. Temperatures and the growth and development of maize and rice, a review. Glob. Chang. Biol. 2014, 20, 408–417. [Google Scholar] [CrossRef] [PubMed]
  5. Intergovernmental Panel on Climate Change. Climate Change 2007: The Physical Science Basis; Contribution of Working Group I to the Fourth Assessment Report of the Intergovernmental Panel on Climate Change; Cambridge University Press: Cambridge, UK; New York, NY, USA, 2007; p. 996. [Google Scholar]
  6. Intergovernmental Panel on Climate Change. Climate Change 2014: Impacts, Adaptation, and Vulnerability. Part A, Global and Sectoral Aspects; Contribution of Working Group II to the Fifth Assessment Report of the Intergovernmental Panel on Climate Change; Cambridge University Press: Cambridge, UK; New York, NY, USA, 2014; p. 1132. [Google Scholar]
  7. Bita, C.E.; Gerats, T. Plant tolerance to high temperature in a changing environment, scientific fundamentals and production of heat stress-tolerant crops. Front. Plant Sci. 2013, 4, 273. [Google Scholar] [CrossRef] [PubMed] [Green Version]
  8. Glass, A.D.M. Nitrogen use efficiency of crop plants, physiological constraints upon nitrogen absorption. Crit. Rev. Plant Sci. 2003, 22, 453–470. [Google Scholar] [CrossRef]
  9. Good, A.G.; Shrawat, A.K.; Muench, D.G. Can less yield more? Is reducing nutrient input into the environment compatible with maintaining crop production? Trends Plant Sci. 2004, 9, 597–605. [Google Scholar] [CrossRef] [PubMed]
  10. Reynolds, M.; Bonnett, D.; Chapman, S.C.; Furbank, R.T.; Manes, Y.; Mather, D.E.; Parry, M.A.J. Raising yield potential of wheat. I. Overview of a consortium approach and breeding strategies. J. Exp. Bot. 2011, 62, 439–452. [Google Scholar] [CrossRef] [PubMed]
  11. Parry, M.A.J.; Hawkesford, M.J. An integrated approach to crop genetic improvement. J. Integr. Plant Biol. 2012, 54, 250–259. [Google Scholar] [CrossRef] [PubMed]
  12. Hirayama, T.; Shinozaki, K. Research on plant abiotic stress responses in the post-genome era, past, present and future. Plant J. 2010, 61, 1041–1052. [Google Scholar] [CrossRef] [PubMed]
  13. Chew, Y.H.; Halliday, K.J. A stress-free walk from Arabidopsis to crops. Curr. Opin. Biotechnol. 2011, 22, 281–286. [Google Scholar] [CrossRef] [PubMed]
  14. Ahuja, I.; de Vos, R.C.H.; Bones, A.M.; Hall, R.D. Plant molecular stress responses face climate change. Trends Plant Sci. 2010, 15, 664–674. [Google Scholar] [CrossRef] [PubMed]
  15. Mitler, R.; Finka, A.; Goloubinoff, P. How do plants feel the heat? Trends Biochem. Sci. 2012, 37, 118–125. [Google Scholar] [CrossRef] [PubMed]
  16. Yousuf, P.Y.; Ahmad, A.; Hemant Ganie, A.H.; Iqbal, M. Potassium and calcium application ameliorates growth and oxidative homeostasis in salt-stressed Indian mustard plants. Pak. J. Bot. 2015, 47, 1629–1639. [Google Scholar]
  17. Yousuf, P.Y.; Ahmad, A.; Aref, I.M.; Ozturk, M.; Hemant Ganie, A.H.; Iqbal, M. Salt-stress-responsive chloroplast proteins in Brassica juncea genotypes with contrasting salt tolerance and their quantitative PCR analysis. Protoplasma 2016, 253, 1565–1575. [Google Scholar] [CrossRef] [PubMed]
  18. Larkindale, J.; Vierling, E. Core genome responses involved in acclimation to high temperature. Plant Physiol. 2008, 146, 748–761. [Google Scholar] [CrossRef] [PubMed]
  19. Jamil, A.; Riaz, S.; Ashraf, M.; Foolad, M.R. Gene expression profiling of plants under salt stress. Crit. Rev. Plant Sci. 2011, 30, 435–458. [Google Scholar] [CrossRef]
  20. Li, H.; Payne, W.A.; Michels, G.J.; Charles, M.R. Reducing plant abiotic and biotic stress, drought and attacks of greenbugs, corn leaf aphids and virus disease in dryland sorghum. Environ. Exp. Bot. 2008, 63, 305–316. [Google Scholar] [CrossRef]
  21. Yousuf, P.Y.; Ahmad, A.; Ganie, A.H.; Iqbal, M. Salt stress-induced modulations in the shoot proteome of Brassica juncea genotypes. Environ. Sci. Pollut. Res. 2016, 23, 2391–2401. [Google Scholar] [CrossRef] [PubMed]
  22. Leff, B.; Ramankutty, N.; Foley, J.A. Geographic distribution of major crops across the world. Glob. Biogeochem. Cycles 2004, 18, GB1009. [Google Scholar] [CrossRef]
  23. Food and Agriculture Organization. FAOSTAT, Food Balance Sheets. 2012. Available online: faostat.fao.org (accessed on 15 April 2013).
  24. Gourdji, S.M.; Sibley, A.M.; Lobell, D.B. Global crop exposure to critical high temperatures in the reproductive period, historical trends and future projections. Environ. Res. Lett. 2013, 8, 24–41. [Google Scholar] [CrossRef]
  25. Koehler, A.K.; Challinor, A.J.; Hawkins, E.; Asseng, S. Influences of increasing temperature on Indian wheat, quantifying limits to predictability. Environ. Res. Lett. 2013, 8, 034016. [Google Scholar] [CrossRef]
  26. Teixeira, E.I.; Fischer, G.; van Velthuizen, H.; Walter, C.; Ewert, F. Global hot-spots of heat stress on agricultural crops due to climate change. Agric. For. Meteorol. 2013, 170, 206–215. [Google Scholar] [CrossRef]
  27. Kharel, T.P.; Clay, D.E.; Clay, S.A.; Beck, D.; Reese, C.; Carlson, G.; Park, H. Nitrogen and water stress affect winter wheat yield and dough quality. Agron. J. 2011, 103, 1389–1396. [Google Scholar] [CrossRef]
  28. Asseng, S.; Ewert, F.; Martre, P.; Rötter, R.P.; Lobell, D.B.; Cammarano, D.; Kimball, B.A.; Ottman, M.J.; Wall, G.W.; White, J.W.; et al. Rising temperatures reduce global wheat production. Nat. Clim. Chang. 2015, 5, 143–147. [Google Scholar] [CrossRef]
  29. Tjoelker, M.G.; Reich, P.B.; Oleksyn, J. Changes in leaf nitrogen and carbohydrates underlie temperature and CO2 acclimation of dark respiration in five boreal tree species. Plant Cell Environ. 1999, 22, 767–778. [Google Scholar] [CrossRef]
  30. Semenov, M.A.; Jamieson, P.D.; Martre, P. Deconvoluting nitrogen use efficiency in wheat: A simulation study. Eur. J. Agron. 2007, 26, 283–294. [Google Scholar] [CrossRef]
  31. Chandna, R.; Kaur, G.; Iqbal, M.; Khan, I.; Ahmad, A. Differential response of wheat genotypes to applied nitrogen, biochemical and molecular analysis. Arch. Agron. Soil Sci. 2012, 58, 915–929. [Google Scholar] [CrossRef]
  32. Isaacson, T.; Damasceno, C.M.; Saravanan, R.S.; He, Y.; Catala, C.; Saladie, M.; Rose, J.K. Sample extraction techniques for enhanced proteomic analysis of plant tissues. Nat. Protoc. 2006, 1, 769–774. [Google Scholar] [CrossRef] [PubMed]
  33. O’Farrel, P.H. High resolution two-dimensional electrophoresis of proteins. J. Biol. Chem. 1975, 250, 4007–4021. [Google Scholar]
  34. National Center for Biotechnology Information (NCBI). Available online: https://www.ncbi.nlm.nih.gov (accessed on 14 November 2016).
  35. The UniProt Consortium. UniProt: The universal protein knowledgebase. Nucleic Acids Res. 2017, 45, D158–D169. [Google Scholar]
  36. Guda, C. pTARGET: A web server for predicting protein subcellular localization. Nucleic Acids Res. 2006, 34, W210–W213. [Google Scholar] [CrossRef] [PubMed]
  37. Yue, S.; Meng, Q.; Zhao, R.; Li, F.; Chen, X.; Zhang, F.; Cui, Z. Critical nitrogen dilution curve for optimizing nitrogen management of winter wheat production in the north China plain. Agron. J. 2012, 104, 523–529. [Google Scholar] [CrossRef]
  38. Christophe, S.; Jean-Christophe, A.; Annabelle, L.; Alain, O.; Marion, P.; Anne-Sophie, V. Plant N fluxes and modulation by nitrogen, heat and water stresses: A review based on comparison of legumes and non-legume plants. In Abiotic Stress in Plants—Mechanisms and Adaptations; Shanker, A., Venkateswarlu, B., Eds.; InTech: Rijeka, Croatia, 2011. [Google Scholar]
  39. Huergo, L.F.; Chandra, G.; Merrick, M. PII signal transduction proteins, nitrogen regulation and beyond. FEMS Microbiol. Rev. 2013, 37, 251–283. [Google Scholar] [CrossRef] [PubMed]
  40. Kichey, T.; Le Gouis, J.; Sangwan, B.; Hirel, B.; Dubois, F. Changes in the cellular and subcellular localization of glutamine synthetase and glutamate dehydrogenase during flag leaf senescence in wheat (Triticum aestivum L.). Plant Cell Physiol. 2005, 46, 964–974. [Google Scholar] [CrossRef] [PubMed]
  41. Lemaitre, T.; Gaufichon, L.; Boutet-Mercey, S.; Christ, A.; Masclaux-Daubresse, C. Enzymatic and metabolic diagnostic of nitrogen deficiency in Arabidopsis thaliana Wassileskija accession. Plant Cell Physiol. 2008, 49, 1056–1065. [Google Scholar] [CrossRef] [PubMed]
  42. Kant, S.; Bi, Y.; Rothstein, S.J. Understanding plant response to nitrogen limitation for the improvement of crop nitrogen use efficiency. J. Exp. Bot. 2011, 62, 1499–1509. [Google Scholar] [CrossRef] [PubMed]
  43. Aranjuelo, I.; Molero, G.; Erice, G.; Avice, J.C.; Nogues, S. Plant physiology and proteomics reveals the leaf response to drought in alfalfa (Medicago sativa L.). J. Exp. Bot. 2011, 62, 111–123. [Google Scholar] [CrossRef] [PubMed]
  44. Hoshida, H.; Tanaka, Y.; Hibino, T.; Hayashi, Y.; Tanaka, A.; Takabe, T.; Takabe, T. Enhanced tolerance to salt stress in transgenic rice that overexpresses chloroplast glutamine synthetase. Plant Mol. Biol. 2000, 43, 103–111. [Google Scholar] [CrossRef] [PubMed]
  45. Pascual, M.B.; Jing, Z.P.; Kirby, E.G.; Canovas, F.M.; Gallardo, F. Response of transgenic poplar overexpressing cytosolic glutamine synthetase to phosphinothricin. Phytochemistry 2008, 69, 382–389. [Google Scholar] [CrossRef] [PubMed]
  46. Xu, Y.H.; Liu, R.; Yan, L.; Liu, Z.Q.; Jiang, S.C.; Shen, Y.Y.; Wang, X.F.; Zhang, D.P. Light-harvesting chlorophyll a/b-binding proteins are required for stomatal response to abscisic acid in Arabidopsis. J. Exp. Bot. 2012, 63, 1095–1106. [Google Scholar] [CrossRef] [PubMed]
  47. Yousuf, P.Y.; Ahmad, A.; Ganie, A.H.; Sareer, O.; Krishnapriya, V.; Aref, I.M.; Iqbal, M. Antioxidant response and proteomic modulations in Indian mustard grown under salt stress. Plant Growth Regul. 2016, 81, 31–50. [Google Scholar] [CrossRef]
  48. Yan, S.; Tang, Z.; Su, W.; Sun, W. Proteomic analysis of salt stress-responsive proteins in rice root. Proteomics 2005, 5, 235–244. [Google Scholar] [CrossRef] [PubMed]
  49. Rollins, J.A.; Habte, E.; Templer, S.E.; Colby, T.; Schmidt, J.; von Korff, M. Leaf proteome alterations in the context of physiological and morphological responses to drought and heat stress in barley (Hordeum vulgare L.). J. Exp. Bot. 2013, 64, 3201–3212. [Google Scholar] [CrossRef] [PubMed]
  50. Kosova, K.; Vitamvas, P.; Prasil, I.T. Proteomics of stress responses in wheat and barley—search for potential protein markers of stress tolerance. Front. Plant Sci. 2014, 5, 711. [Google Scholar] [CrossRef] [PubMed]
  51. Wang, M.C.; Peng, Z.Y.; Li, C.L.; Li, F.; Liu, C.; Xia, G.M. Proteomic analysis on a high salt tolerance introgression strain of Triticum aestivum/Thinopyrum ponticum. Proteomics 2008, 8, 1470–1489. [Google Scholar] [CrossRef] [PubMed]
  52. Zhou, S.P.; Sauve, R.J.; Liu, Z.; Reddy, S.; Bhatti, S.; Hucko, S.D.; Fish, T.; Thannhauser, T.W. Identification of salt-induced changes in leaf and root proteomes of the wild tomato, Solanum chilense. J. Am. Soc. Hortic. Sci. 2011, 136, 288–302. [Google Scholar]
  53. Hanke, G.T.; Okutani, S.; Satomi, Y.; Takao, T.; Suzuki, A.; Hase, T. Multiple iso-proteins of FNR in Arabidopsis, evidence for different contributions to chloroplast function and nitrogen assimilation. Plant Cell Environ. 2005, 28, 1146–1157. [Google Scholar] [CrossRef]
  54. Chauhan, H.; Khurana, N.; Tyagi, A.K.; Khurana, J.P.; Khurana, P. Identification and characterization of high temperature stress responsive genes in bread wheat (Triticum aestivum L.) and their regulation at various stages of development. Plant Mol. Biol. 2011, 75, 35–51. [Google Scholar] [CrossRef] [PubMed]
  55. Singh, B.; Usha, K. Salicylic acid induced physiological and biochemical changes in wheat seedlings under water stress. Plant Growth Regul. 2003, 39, 137–141. [Google Scholar] [CrossRef]
  56. Portis, A.R. Rubisco activase—Rubisco’s catalytic chaperone. Photosynth. Res. 2003, 75, 11–27. [Google Scholar] [CrossRef] [PubMed]
  57. Lee, D.G.; Ahsan, N.; Lee, S.H.; Kang, K.Y.; Bahk, J.D.; Lee, I.J.; Lee, B.H. A proteomic approach in analyzing heat-responsive proteins in rice leaves. Proteomics 2007, 7, 3369–3383. [Google Scholar] [CrossRef] [PubMed]
  58. Zhang, M.; Li, G.; Huang, W.; Bi, T.; Chen, G.; Tang, Z.; Su, W.; Sun, W. Proteomic study of Carissa spinarum in response to combined heat and drought stress. Proteomics 2010, 10, 3117–3129. [Google Scholar] [CrossRef] [PubMed]
  59. Bahrman, N.; Le Gouis, J.; Negroni, L.; Amilhat, L.; Leroy, P.; Laine, A.L.; Jaminon, O. Differential protein expression assessed by two-dimensional gel electrophoresis for two wheat varieties grown at four nitrogen levels. Proteomics 2004, 4, 709–719. [Google Scholar] [CrossRef] [PubMed]
  60. Rivero, R.M.; Mestre, T.C.; Mittler, R.; Rubio, F.; Garcia-Sanchez, F.; Martinez, V. The combined effect of salinity and heat reveals a specific physiological, biochemical and molecular response in tomato plants. Plant Cell Environ. 2014, 37, 1059–1073. [Google Scholar] [CrossRef] [PubMed]
  61. Suzuki, N.; Koussevitzky, S.; Mittler, R.; Miller, G. ROS and redox signalling in the response of plants to abiotic stress. Plant Cell Environ. 2012, 35, 259–270. [Google Scholar] [CrossRef] [PubMed]
  62. Murahama, M.; Yoshida, T.; Hayashi, F.; Ichino, T.; Sanada, Y.; Wada, K. Purification and characterization of δ1-pyrroline-5-carboxylate reductase isoenzymes, indicating differential distribution in spinach (Spinacia oleracea L.) leaves. Plant Cell Physiol. 2001, 42, 742–750. [Google Scholar] [CrossRef] [PubMed]
  63. Inoue, T.; Higuchi, M.; Hashimoto, Y.; Seki, M.; Kobayashi, M.; Kato, T.; Tabata, S.; Shinozaki, K.; Kakimoto, T. Identification of CRE1 as a cytokinin receptor from Arabidopsis. Nature 2001, 409, 1060–1063. [Google Scholar] [CrossRef] [PubMed]
  64. Anderberg, R.J.; Walker-Simmons, M.K. Isolation of a wheat cDNA clone for an abscisic acid-inducible transcript with homology to protein kinases. Proc. Natl. Acad. Sci. USA 1992, 89, 10183–10187. [Google Scholar] [CrossRef] [PubMed]
  65. Dixon, D.P.; Edwards, R. Glutathione Transferases. Arabidopsis Book 2010, 8, e0131. [Google Scholar] [CrossRef] [PubMed]
  66. Hossain, M.A.; Hasanuzzaman, M.; Fujita, M. Coordinate induction of antioxidant defense and glyoxalase system by exogenous proline and glycine betaine is correlated with salt tolerance in mung bean. Front. Agric. China 2011, 5, 1–14. [Google Scholar] [CrossRef]
  67. Yadav, S.K.; Singla-Pareek, S.L.; Ray, M.; Reddy, M.K.; Sopory, S.K. Methylglyoxal levels in plants under salinity stress are dependent on glyoxalase I and glutathione. Biochem. Biophys. Res. Commun. 2005, 337, 61–67. [Google Scholar] [CrossRef] [PubMed]
  68. Shekhawat, G.S.; Verma, K. Heme oxygenase (HO), an overlooked enzyme of plant metabolism and defence. J. Exp. Bot. 2010, 61, 2255–2270. [Google Scholar] [CrossRef] [PubMed]
  69. Fini, A.; Brunetti, C.; Di Ferdinando, M.; Ferrini, F.; Tattini, M. Stress-induced flavonoid biosynthesis and the antioxidant machinery of plants. Plant Signal Behav. 2011, 6, 709–711. [Google Scholar] [CrossRef] [PubMed]
  70. Lloyd, J.R.; Kossmann, J.; Ritte, G. Leaf starch degradation comes out of the shadows. Trends Plant Sci. 2005, 10, 130–137. [Google Scholar] [CrossRef] [PubMed]
  71. Sobhanian, H.; Aghaei, K.; Komatsu, S. Changes in the plant proteome resulting from salt stress, toward the creation of salt-tolerant crops? J. Proteom. 2011, 74, 1323–1337. [Google Scholar] [CrossRef] [PubMed]
  72. Figueroa-Balderas, R.E.; Garcia-Ponce, B.; Rocha-Sosa, M. Hormonal and stress induction of the gene encoding common bean acetyl-coenzyme A carboxylase. Plant Physiol. 2006, 142, 609–619. [Google Scholar] [CrossRef] [PubMed]
  73. Kottapalli, K.R.; Rakwal, R.; Shibato, J.; Burow, G.; Tissues, D.; Burke, J.; Puppala, N.; Burow, M.; Payton, P. Physiology and proteomics of the water-deficit stress response in three contrasting peanut genotypes. Plant Cell Environ. 2009, 32, 380–407. [Google Scholar] [CrossRef] [PubMed]
  74. Matsuura, H.; Kiyotaka, U.; Ishibashi, Y.; Yamaguchi, M.; Hirata, K.; Demura, T.; Kato, K. A short period of mannitol stress but not LiCl stress led to global translational repression in plants. Biosci. Biotechnol. Biochem. 2010, 74, 2110–2112. [Google Scholar] [CrossRef] [PubMed]
  75. Sormani, R.; Delannoy, E.; Lageix, S.; Bitton, F.; Lanet, E.; Saez-Vasquez, J.; Deragon, J.M.; Renou, J.P.; Robaglia, C. Sublethal cadmium intoxication in Arabidopsis thaliana impacts translation at multiple levels. Plant Cell Physiol. 2011, 52, 436–447. [Google Scholar] [CrossRef] [PubMed] [Green Version]
  76. Fu, J.; Momcilovic, I.; Prasad, P.V. Roles of protein synthesis elongation factor EF-Tu in heat tolerance in plants. J. Bot. 2012, 2012, 835836. [Google Scholar] [CrossRef]
  77. Bhadula, S.K.; Elthon, T.E.; Habben, J.E.; Helentjaris, T.G.; Jiao, S.; Ristic, Z. Heat-stress induced synthesis of chloroplast protein synthesis elongation factor (EF-Tu) in a heat-tolerant maize line. Planta 2001, 212, 359–366. [Google Scholar] [CrossRef] [PubMed]
  78. Bukovnik, U.; Fu, J.; Bennett, M.; Prasad, P.V.V.; Ristic, Z. Heat tolerance and expression of protein synthesis elongation factors, EF-Tu and EF-1α, in spring wheat. Funct. Plant Biol. 2009, 36, 234–241. [Google Scholar] [CrossRef]
  79. Merewitz, E.B.; Gianfagna, T.; Huang, B. Protein accumulation in leaves and roots associated with improved drought tolerance in creeping bentgrass expressing an ipt gene for cytokinin synthesis. J. Exp. Bot. 2011, 2, 5311–5333. [Google Scholar] [CrossRef] [PubMed]
  80. Jedmowski, C.; Ashoub, A.; Beckhaus, T.; Berberich, T.; Karas, M.; Brüggemann, W. Comparative analysis of Sorghum bicolor proteome in response to drought stress and following recovery. Int. J. Proteom. 2014, 2014, 395905. [Google Scholar] [CrossRef] [PubMed]
  81. Salvucci, M.E. Association of Rubisco activase with chaperonin-60β, a possible mechanism for protecting photosynthesis during heat stress. J. Exp. Bot. 2008, 59, 1923–1933. [Google Scholar] [CrossRef] [PubMed]
  82. Trivedi, D.K.; Ansari, M.W.; Tuteja, N. Multiple abiotic stress responsive rice cyclophilin (OsCYP-25) mediates a wide range of cellular responses. Commun. Integr. Biol. 2013, 6, e25260. [Google Scholar] [CrossRef] [PubMed]
  83. Romano, P.; Horton, P.; Gray, J.E. The Arabidopsis thaliana cyclophilin gene family. Plant Physiol. 2004, 134, 1268–1282. [Google Scholar] [CrossRef] [PubMed]
  84. Stone, S.L. The role of ubiquitin and the 26S proteasome in plant abiotic stress signaling. Front. Plant Sci. 2014, 5, 135. [Google Scholar] [CrossRef] [PubMed]
Figure 1. Plants of wheat cultivar VL616 grown under (a) control, and (b) treatment conditions, and cultivar UP2382 grown under (c) control, and (d) treatment conditions at the time of sampling.
Genes 08 00356 g001
Figure 2. 2-DE gel images representing the differentially-expressed leaf proteins of UP2382 (a, control; b, stress conditions) and VL616 (c, control; d, stress conditions) cultivars of wheat.
Genes 08 00356 g002
Figure 3. Pie diagram depicting the spatial distribution of differentially-expressed proteins at subcellular level. ER: endoplasmic reticulum.
Genes 08 00356 g003
Figure 4. Pie diagram showing the functional cataloguing of differentially-expressed proteins.
Genes 08 00356 g004
Figure 5. Schematic representation of differentially-expressed leaf proteins in wheat under combined stress of high temperature and low nitrogen. Proteins in green boxes were upregulated, whereas those in orange boxes were downregulated. OEC, oxygen evolving complex; POECP1, photosystem II oxygen-evolving complex protein 1; CABP, chlorophyll a/b binding protein; FNR, ferredoxin NADP reductase; Fd, ferredoxin; RuBP, ribulose-1,5-bisphosphate; 3PGA, 3-phosphoglycerate; 1,3-BGA, 1,3-bisphosphoglycerate; G3P, glyceraldehyde 3-phosphate; R5P, ribulose-5-phosphate; SPS, sucrose phosphate synthase ; GP, alpha-1,4-glucan phosphorylase; IA, isoamylase; TiM, triosephosphate isomerase; GPD, glyceraldehyde 3-phosphate dehydrogenase; SOD, superoxide dismutase; APX, ascorbate peroxidase; GT, glutathione transferase; GO, glyoxalase; HO, heme oxygenase; FS, flavonol synthase; ACC, acetyl-CoA carboxylase; P5CR, pyroline-5-caboxylate synthetase; PDI, protein disulfide isomerase; C60b, chaperonin 60b; hsp, heat shock protein; 5A1, translational factor 5A1; RNPA, ribonucleoprotein A; HACC, histone-acetyltransferase complex component; SnRKIP, SnRK1-interacting protein 1; ZFFP, zinc finger family protein; AREP3, ABA-responsive element-binding protein 3.
Genes 08 00356 g005
Figure 6. Representation and the associated processes of differentially-expressed leaf proteins in wheat under combined stress of high temperature and low nitrogen.
Genes 08 00356 g006
Table 1. Identification, sub-cellular localization and quantitative analysis of differentially-expressed leaf proteins of nitrogen-efficient (VL616) and nitrogen-inefficient (UP2382) cultivars of wheat under the combined effect of high temperature (32 °C) and low nitrogen (4 mM).
S.N.Accession No.Name of ProteinMr (Da)PiM. SCONo. of Matched PeptidesLocationProcessMode of RegulationRelative Spot Intensity
UP2382VL616
1Q45NB2Glutamine synthetase46,8525.961209Chloroplast
Mitochondria
Nitrogen metabolismUpregulatedGenes 08 00356 i001
2P30110Glutathione transferase25,0986.35767CytosolOxidative stressUpregulatedGenes 08 00356 i002
3Q6EZE7Sucrose phosphate synthase12,8746.818411CytosolCarbohydrate metabolismUpregulatedGenes 08 00356 i003
4M1NZ56Pyrroline-5-carboxylate synthetase30,8835.741226CytosolOsmo-regulationUpregulatedGenes 08 00356 i004
5P27665Photosystem II oxygen-evolving complex protein 136,6238.5316014ChloroplastPhotosynthesisUpregulatedGenes 08 00356 i005
6Q6AUR2PII-like protein26,4299.841473ChloroplastNitrogen metabolismUpregulatedGenes 08 00356 i006
7D8L9G7α-1,4-Glucan phosphorylase89,5207.201347ChloroplastOsmo-regulationUpregulatedGenes 08 00356 i007
8Q66NG6Plant histidine kinase (Cre 1)120,7296.221028CytosolOsmo-regulationUpregulatedGenes 08 00356 i008
9P52589Protein disulfide isomerase56,9215.011493ERProtein stabilizationUpregulatedGenes 08 00356 i009
10G9BRR4Heme oxygenase 432,4155.81626ChloroplastOxidative stressUpregulatedGenes 08 00356 i010
11M8CY84Ferredoxin-dependent glutamate synthase 227,1426.301029ChloroplastNitrogen metabolismUpregulatedGenes 08 00356 i011
12P12112ATPase F1 α subunit48,2336.271346MitochondriaEnergy metabolismUpregulatedGenes 08 00356 i012
13P08823Chaperonin 60 β precursor54,3214.611585MitochondriaProtein stabilizationUpregulatedGenes 08 00356 i013
14Q8LD97Glyoxylase I 732,5645.82742PeroxisomesOxidative stressUpregulatedGenes 08 00356 i014
15M8B2C5l-Ascorbate peroxidase 534,8526.84944ChloroplastOxidative stressUpregulatedGenes 08 00356 i015
16M8A9B6Abscisic acid-inducible protein kinase37,0235.51546CytosolOsmotic adjustmentUpregulatedGenes 08 00356 i016
17Q4334929 kDa ribonucleoprotein A, chloroplast precursor28,3264.751655NucleusProtein synthesisDownregulatedGenes 08 00356 i017
18P34791Chloroplast-localised cyclophilin26,5278.481466ChloroplastProtein stabilityUpregulatedGenes 08 00356 i018
19Q95H51Ribosomal protein L1413,7169.11548RibosomeProtein synthesisDownregulatedGenes 08 00356 i019
20X5CQE2Flavonol synthase36,4015.33948Cytoplasm, NucleusOxidative stressUpregulatedGenes 08 00356 i020
21M8BQR6Osmotin like protein27,1487.871356Cell wallCell wall synthesisUpregulatedGenes 08 00356 i021
22M7Z1M4Triosephosphate isomerase31,9556.0014814Chloroplast, CytosolGlycolysisDownregulatedGenes 08 00356 i022
23P60577Ribosomal protein S1910,58911.05015Ribosome, Chloroplast, MitochondriaProtein synthesisDownregulatedGenes 08 00356 i023
24A0A1D5ZWW7Translation elongation factor-Tu52,2755.09999Plastid, Mitochondria, CytosolProtein synthesisUpregulatedGenes 08 00356 i024
25--Unknown9,3716.25583--UpregulatedGenes 08 00356 i025
26--Predicted protein6,6494.62422--DownregulatedGenes 08 00356 i026
27P46285Sedoheptulose-1,7-bisphosphatase42,0686.2615315ChloroplastCalvin cycleDownregulatedGenes 08 00356 i027
28M7ZTK2Glucosamine-fructose-6-phosphate aminotransferase73,8346.98476CytosolNitrogen metabolismUpregulatedGenes 08 00356 i028
29Q9ZSR6Small heat shock protein25,6229.20617NucleusProtein stabilizationUpregulatedGenes 08 00356 i029
30C1K2Q2Heat shock responsive transcription factor38,3625.21545NucleusProtein stabilizationUpregulatedGenes 08 00356 i030
31A5YVV3Glyceraldehyde 3-phosphate dehydrogenase42,7667.621414Plastid, MitochondriaGlycolysisDownregulatedGenes 08 00356 i031
32Q9FKW6RecName: Full=Ferredoxin--NADP reductase, chloroplastic41,3228.541397Chloroplast PhotosynthesisUpregulatedGenes 08 00356 i032
33P11383Ribulose-1,5-bisphosphate carboxylase/oxygenase large subunit53,9016.2235118ChloroplastPhotosynthesisDownregulatedGenes 08 00356 i033
34W5G9W6Chlorophyll a-b binding protein 124,8365.111126ChloroplastPhotosynthesisUpregulatedGenes 08 00356 i034
35A0A1D5TQL0Cu/Zn superoxide dismutase20,3525.351304CytosolOxidative stressUpregulatedGenes 08 00356 i035
36Q9XPS8RNA polymerase β chain79,9089.002178NucleusTranscriptionDownregulatedGenes 08 00356 i036
37P56765Acetyl-CoA carboxylase β subunit40,2079.02535Cytoplasm, plastidFatty acid metabolismUpregulatedGenes 08 00356 i037
38P10896Rubisco activase chloroplast precursor51,7865.431384ChloroplastPhotosynthesisUpregulatedGenes 08 00356 i038
39P83970ATPase110,8686.501699Plasma membrane, tonoplastEnergy metabolismUpregulatedGenes 08 00356 i039
40P11383Ribulose-1,5-bisphosphate carboxylase/oxygenase small subunit52,2356.41458ChloroplastPhotosynthesisDownregulatedGenes 08 00356 i040
41A5BMQ9Hypothetical protein VITISV_04185950,6706.25385--DownregulatedGenes 08 00356 i041
42D0TZF0Isoamylase precursor75,0526.40522CytosolCarbohydrate metabolismUpregulatedGenes 08 00356 i042
43P69326Ubiquitin4,6938.90726CytosolProtein degradationUpregulatedGenes 08 00356 i043
44W5B4J0Histone acetyl-transferase complex component16,3925.41484NucleusTranscriptionUpregulatedGenes 08 00356 i044
45Q2QWY8Transposon protein, putative, CACTA, En/Spm sub-class55,8508.34417Nucleus-UpregulatedGenes 08 00356 i045
46Q9SAX6Ribulose-1,5-bisphosphate carboxylase/oxygenase small subunit, partial13,2156.608710ChloroplastPhotosynthesisDownregulatedGenes 08 00356 i046
47B6TJX4SnRK1-interacting protein 114,8007.23826NucleusTranscriptionUpregulatedGenes 08 00356 i047
48M7ZIN5Translation factor 5A117,5325.701145RibosomeProtein synthesisDownregulatedGenes 08 00356 i048
49D7LVK3ABA-responsive element binding protein 332,6746.53439NucleusTranscriptionUpregulatedGenes 08 00356 i049
50B5B3P8PR-10 protein16,4647.04228Nucleus-DownregulatedGenes 08 00356 i050
51A0A1D5WC57Zinc finger family protein38,6478.01479NucleusTranscriptionUpregulatedGenes 08 00356 i051
52W5ZRX4Ribulose-1,5-bisphosphate carboxylase/oxygenase large subunit52,5636.052125ChloroplastPhotosynthesisDownregulatedGenes 08 00356 i052
53--Predicted protein11,60710.461257--UpregulatedGenes 08 00356 i053
54S4Z9E7Ribosomal protein S196,7959.121106RibosomeProtein synthesisDownregulatedGenes 08 00356 i054
55--Unnamed protein product4,4147.90248--DownregulatedGenes 08 00356 i055
56Q95H61Ribosomal protein S423,54010.80476RibosomeProtein synthesisDownregulatedGenes 08 00356 i056
57Q9LXC9Inorganic pyrophosphatase family protein32,5675.7211210ChloroplastPhosphorus metabolismUpregulatedGenes 08 00356 i057
58A2ZLN9Hypothetical protein OsI_3873415,3364.254111-ChloroplastUpregulatedGenes 08 00356 i058
59A0A1D5ZI60Methionine synthase54,7945.791018MitochondriaAmino-acid metabolismUpregulatedGenes 08 00356 i059
60P69667Ribosomal protein L239,56310.02716RibosomeProtein synthesisDownregulatedGenes 08 00356 i060
61A0A1D5ST37Malate dehydrogenase38,1045.61588MitochondriaCitric acid cycleDownregulatedGenes 08 00356 i061
S.N. = Spot Number, Mr = Molecular Weight; Pi = Isoelectric Point; M.SCO = Mascot Score. Dark bars indicate control condition (ambient temperature and optimum N level) and light bars indicate treatment condition (low N and high temperature). Spot volumes were analysed by PDQuest software. The fold change of up-regulated protein spot volumes was calculated by treatment/control, whereas the change fold of down-regulated protein spot volumes was calculated by control/treatment. Bars with different letters are significantly different from each other in a single cultivar across treatments (Duncan’s post-test). PR= Pathogenesis-related; ABA = abscisic acid.

