
A Meta-Analysis of the Association between Polymorphisms in MicroRNAs and Risk of Ischemic Stroke

Abstract
:1. Introduction
2. Experimental Section
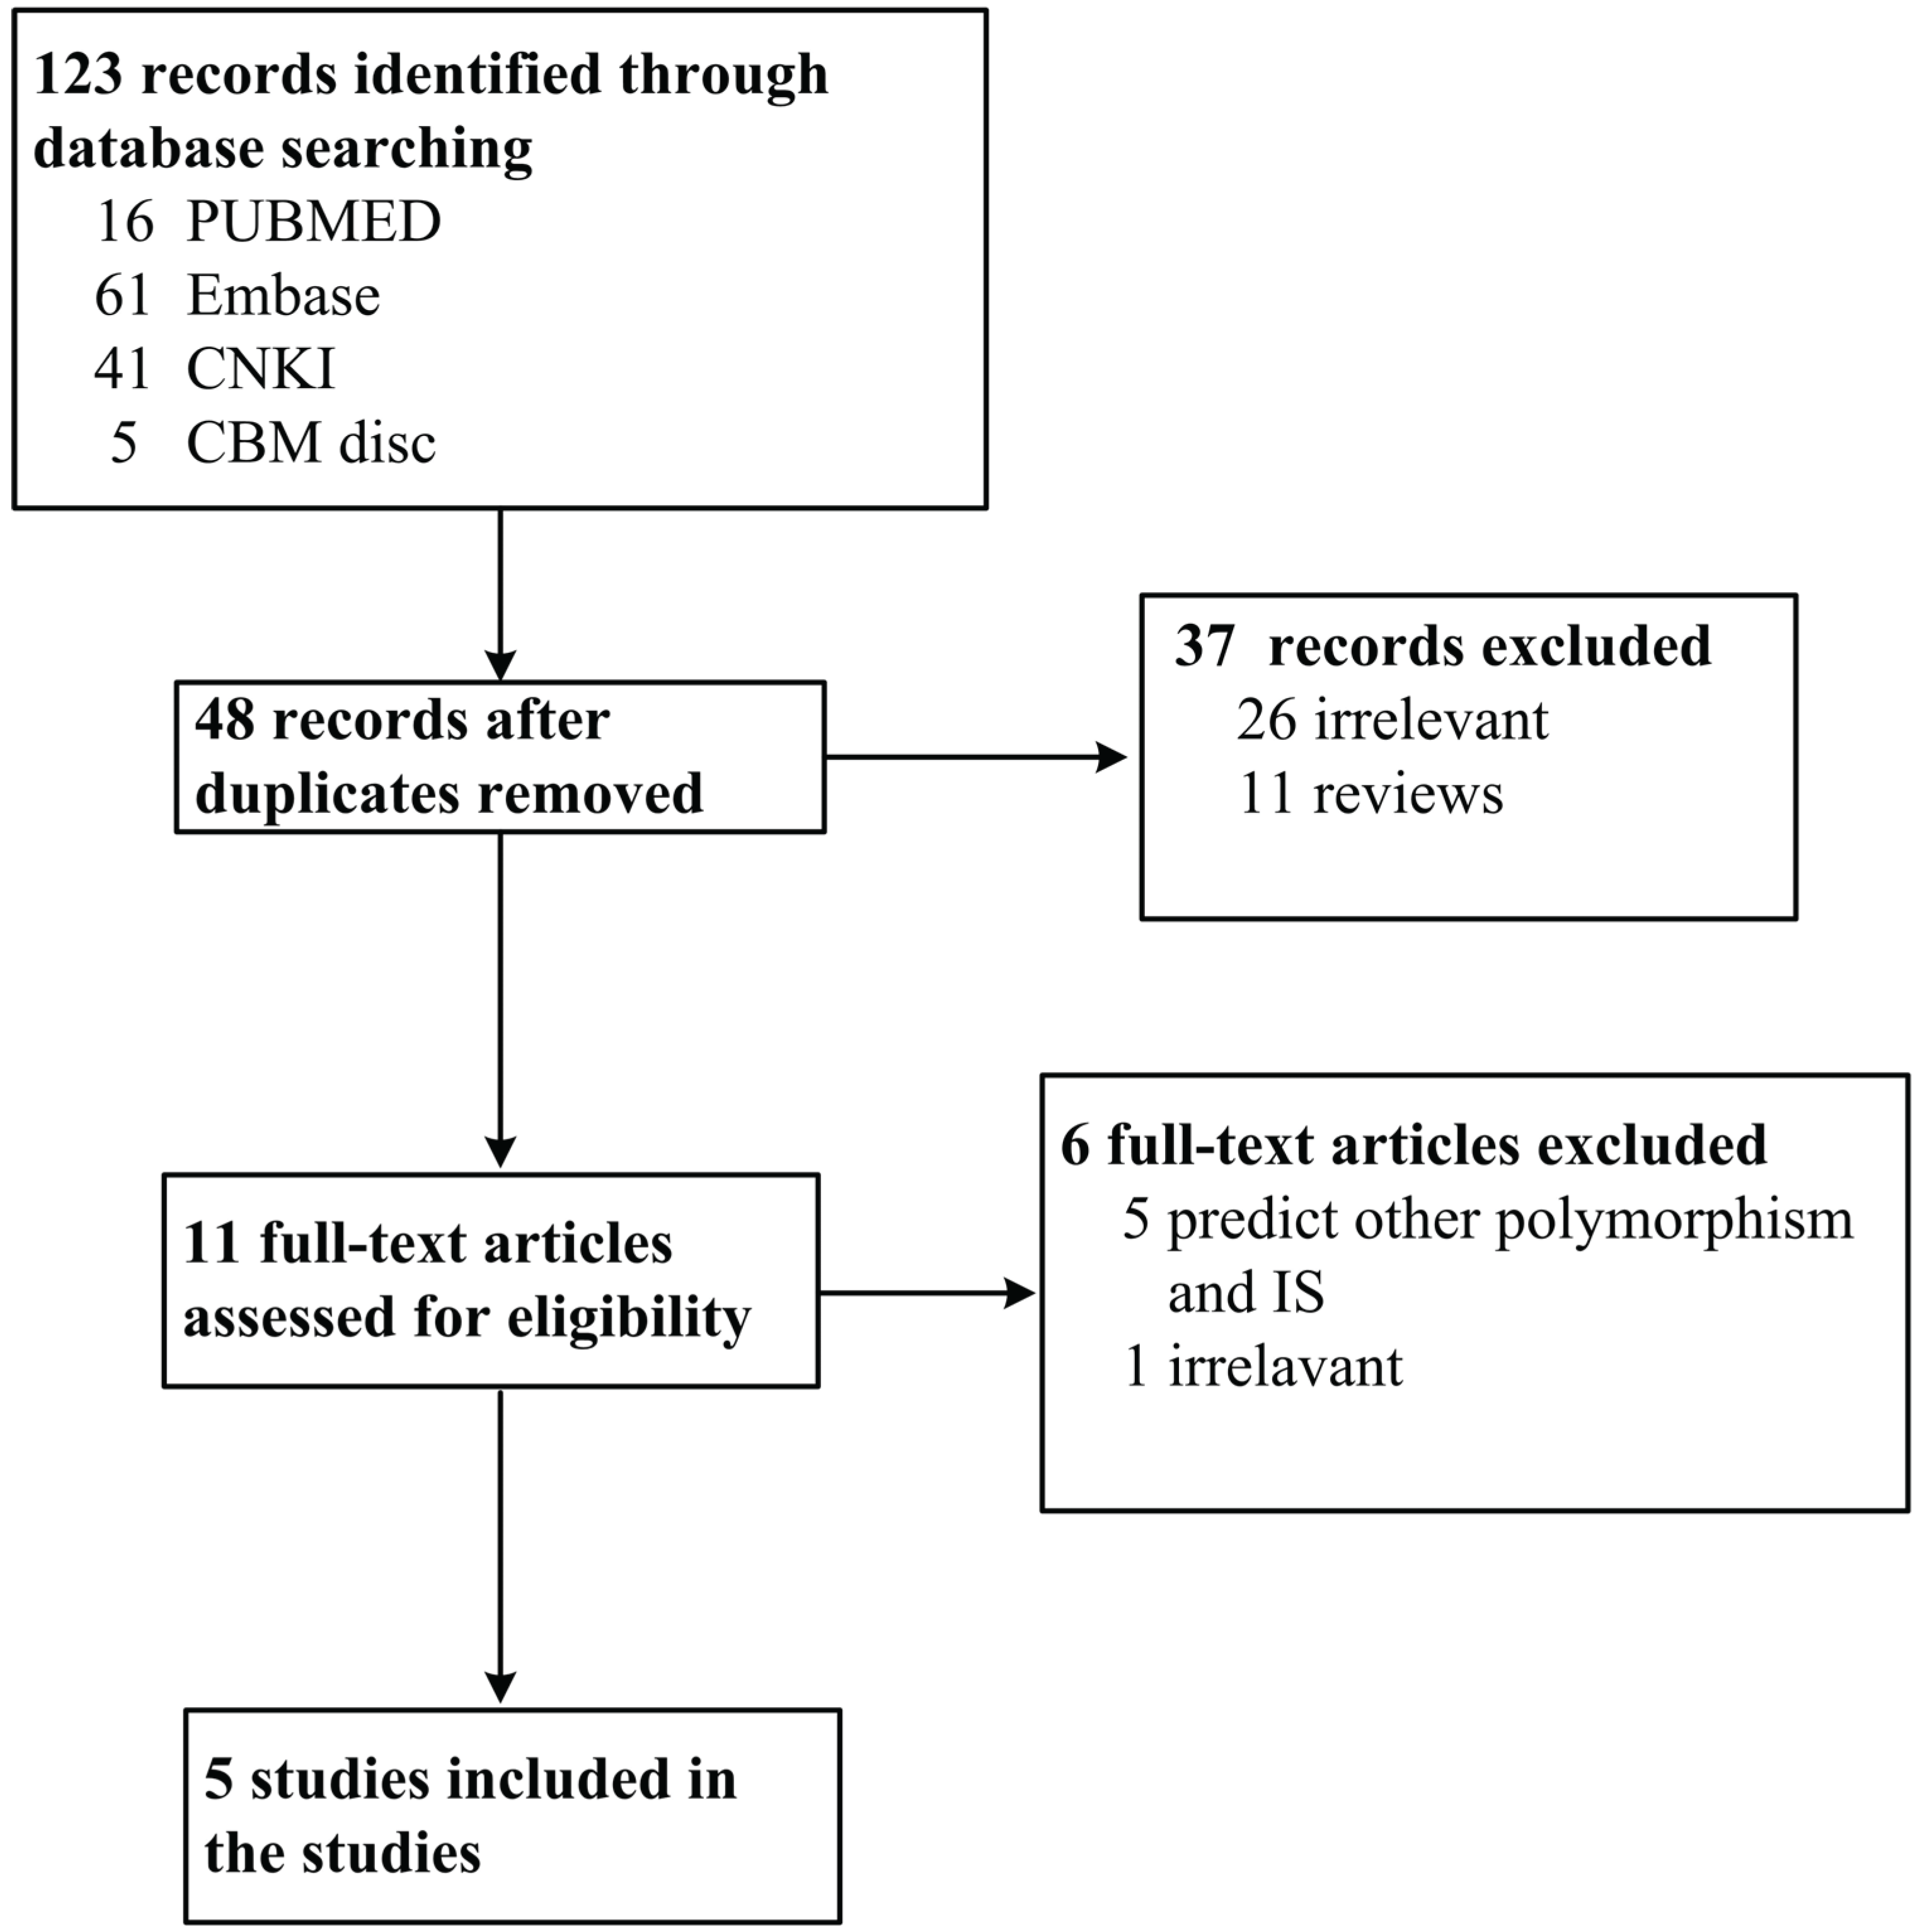
2.1. Publication Search Strategy and Inclusion Criteria
2.2. Data Extraction
2.3. Quality Assessment
2.4. Statistical Methods
3. Results and Discussion
3.1. Characteristics of Eligible Studies

| miR-146a rs2910164 | |||||||||||||
| Author | Year | Country | Ethnicity | Genotyping Methods | Sex Ratio (Male:Female) (Case/Control) | Age (Case/Control) | Quality Score | Sample Size (Case/Control) | GG | GC | CC | HWE of Control | Source of Control |
| (Case/Control) | (Case/Control) | (Case/Control) | |||||||||||
| Zhu [15] | 2014 | China | Chinese | PCR-LDR | 253:115/261:120 | 61.62 ± 0.986/62.05 ± 0.982 | 12 | 368/381 | 50/64 | 173/185 | 145/132 | 0.384 | volunteers |
| Liu [16] | 2014 | China | Chinese | PCR-RFLP | 180:116/127:193 | 67.52 ± 10.29/66.34 ± 11.07 | 12 | 296/391 | 52/77 | 159/198 | 85/116 | 0.650 | volunteers |
| Jeon [4] | 2013 | South Korea | Korean | Taqman | 336:342/244:309 | 64.16 ± 11.90/63.14 ± 10.19 | 12 | 678/553 | 128/76 | 327/266 | 223/211 | 0.589 | IS-free patients |
| Huang [17] | 2015 | China | Chinese | Taqman | 327:204/327:204 | 63 (54, 70)/61 (54, 68) | 13 | 531/531 | 81/55 | 261/257 | 189/219 | 0.106 | volunteers |
| miR-149rs2292832 | |||||||||||||
| Author | Year | Country | Ethnicity | Genotyping Methods | Sex Ratio (Male:Female) (Case/Control) | Age (Case/Control) | Quality Score | Sample Size (Case/Control) | TT | TC | CC | HWE of Control | Source of Control |
| (Case/Control) | (Case/Control) | (Case/Control) | |||||||||||
| Jeon [4] | 2013 | South Korea | Korean | Taqman | 336:342/244:309 | 64.16 ± 11.90/63.14 ± 10.19 | 12 | 678/553 | 299/262 | 303/238 | 76/53 | 0.589 | IS-free patients |
| He [18] | 2013 | China | Chinese | PCR-RFLP | 205:168/193:180 | 65.7 ± 11.5/66.3 ± 10.2 | 12 | 357/373 | 138/160 | 162/175 | 57/38 | 0.327 | volunteers |
| miR-196a2rs11614913 | |||||||||||||
| Author | Year | Country | Ethnicity | Genotyping Methods | Sex Ratio (Male:Female) (Case/Control) | Age (Case/Control) | Quality Score | Sample Size (Case/Control) | CC | CT | TT | HWE of Control | Source of Control |
| (Case/Control) | (Case/Control) | (Case/Control) | |||||||||||
| Zhu [15] | 2014 | China | Chinese | PCR-LDR | 253:115/261:120 | 61.62 ± 0.986/62.05 ± 0.982 | 12 | 368/381 | 71/78 | 189/198 | 108/105 | 0.384 | volunteers |
| Liu [16] | 2014 | China | Chinese | PCR-RFLP | 180:116/127:193 | 67.52 ± 10.29/66.34 ± 11.07 | 12 | 296/391 | 51/84 | 181/214 | 64/93 | 0.650 | volunteers |
| Jeon [4] | 2013 | South Korea | Korean | Taqman | 336:342/244:309 | 64.16 ± 11.90/63.14 ± 10.19 | 12 | 678/553 | 139/105 | 352/292 | 187/156 | 0.589 | IS-free patients |
| Huang [17] | 2015 | China | Chinese | Taqman | 327:204/327:204 | 63 (54, 70)/61 (54, 68) | 13 | 531/531 | 100/112 | 265/266 | 166/153 | 0.106 | volunteers |
| MiR-499 rs3746444 | |||||||||||||
| Author | Year | Country | Ethnicity | Genotyping Methods | Sex Ratio (Male:Female) (Case/Control) | Age (Case/Control) | Quality Score | Sample Size (Case/Control) | AA | AG | GG | HWE of Control | Source of Control |
| (Case/Control) | (Case/Control) | (Case/Control) | |||||||||||
| Liu [16] | 2014 | China | Chinese | PCR-RFLP | 180:116/127:193 | 67.52 ± 10.29/66.34 ± 11.07 | 12 | 296/391 | 181/278 | 96/99 | 19/14 | 0.650 | volunteers |
| Jeon [4] | 2013 | South Korea | Korean | Taqman | 336:342/244:309 | 64.16 ± 11.90/63.14 ± 10.19 | 12 | 678/553 | 460/365 | 195/170 | 23/18 | 0.589 | IS-free patients |
| Huang [18] | 2015 | China | Chinese | Taqman | 327:204/327:204 | 63 (54, 70)/61 (54, 68) | 13 | 531/531 | 398/403 | 133/128 | 0/0 | 0.106 | volunteers |
3.2. Results of Meta-Analysis
| Genetic Model | MiR-146a rs2910264 | Genetic Model | MiR-149 rs2292832 | ||||||||
| N | OR (95% CI) | p-Value | I2 (%) | N | OR (95% CI) | p-Value | I2 (%) | ||||
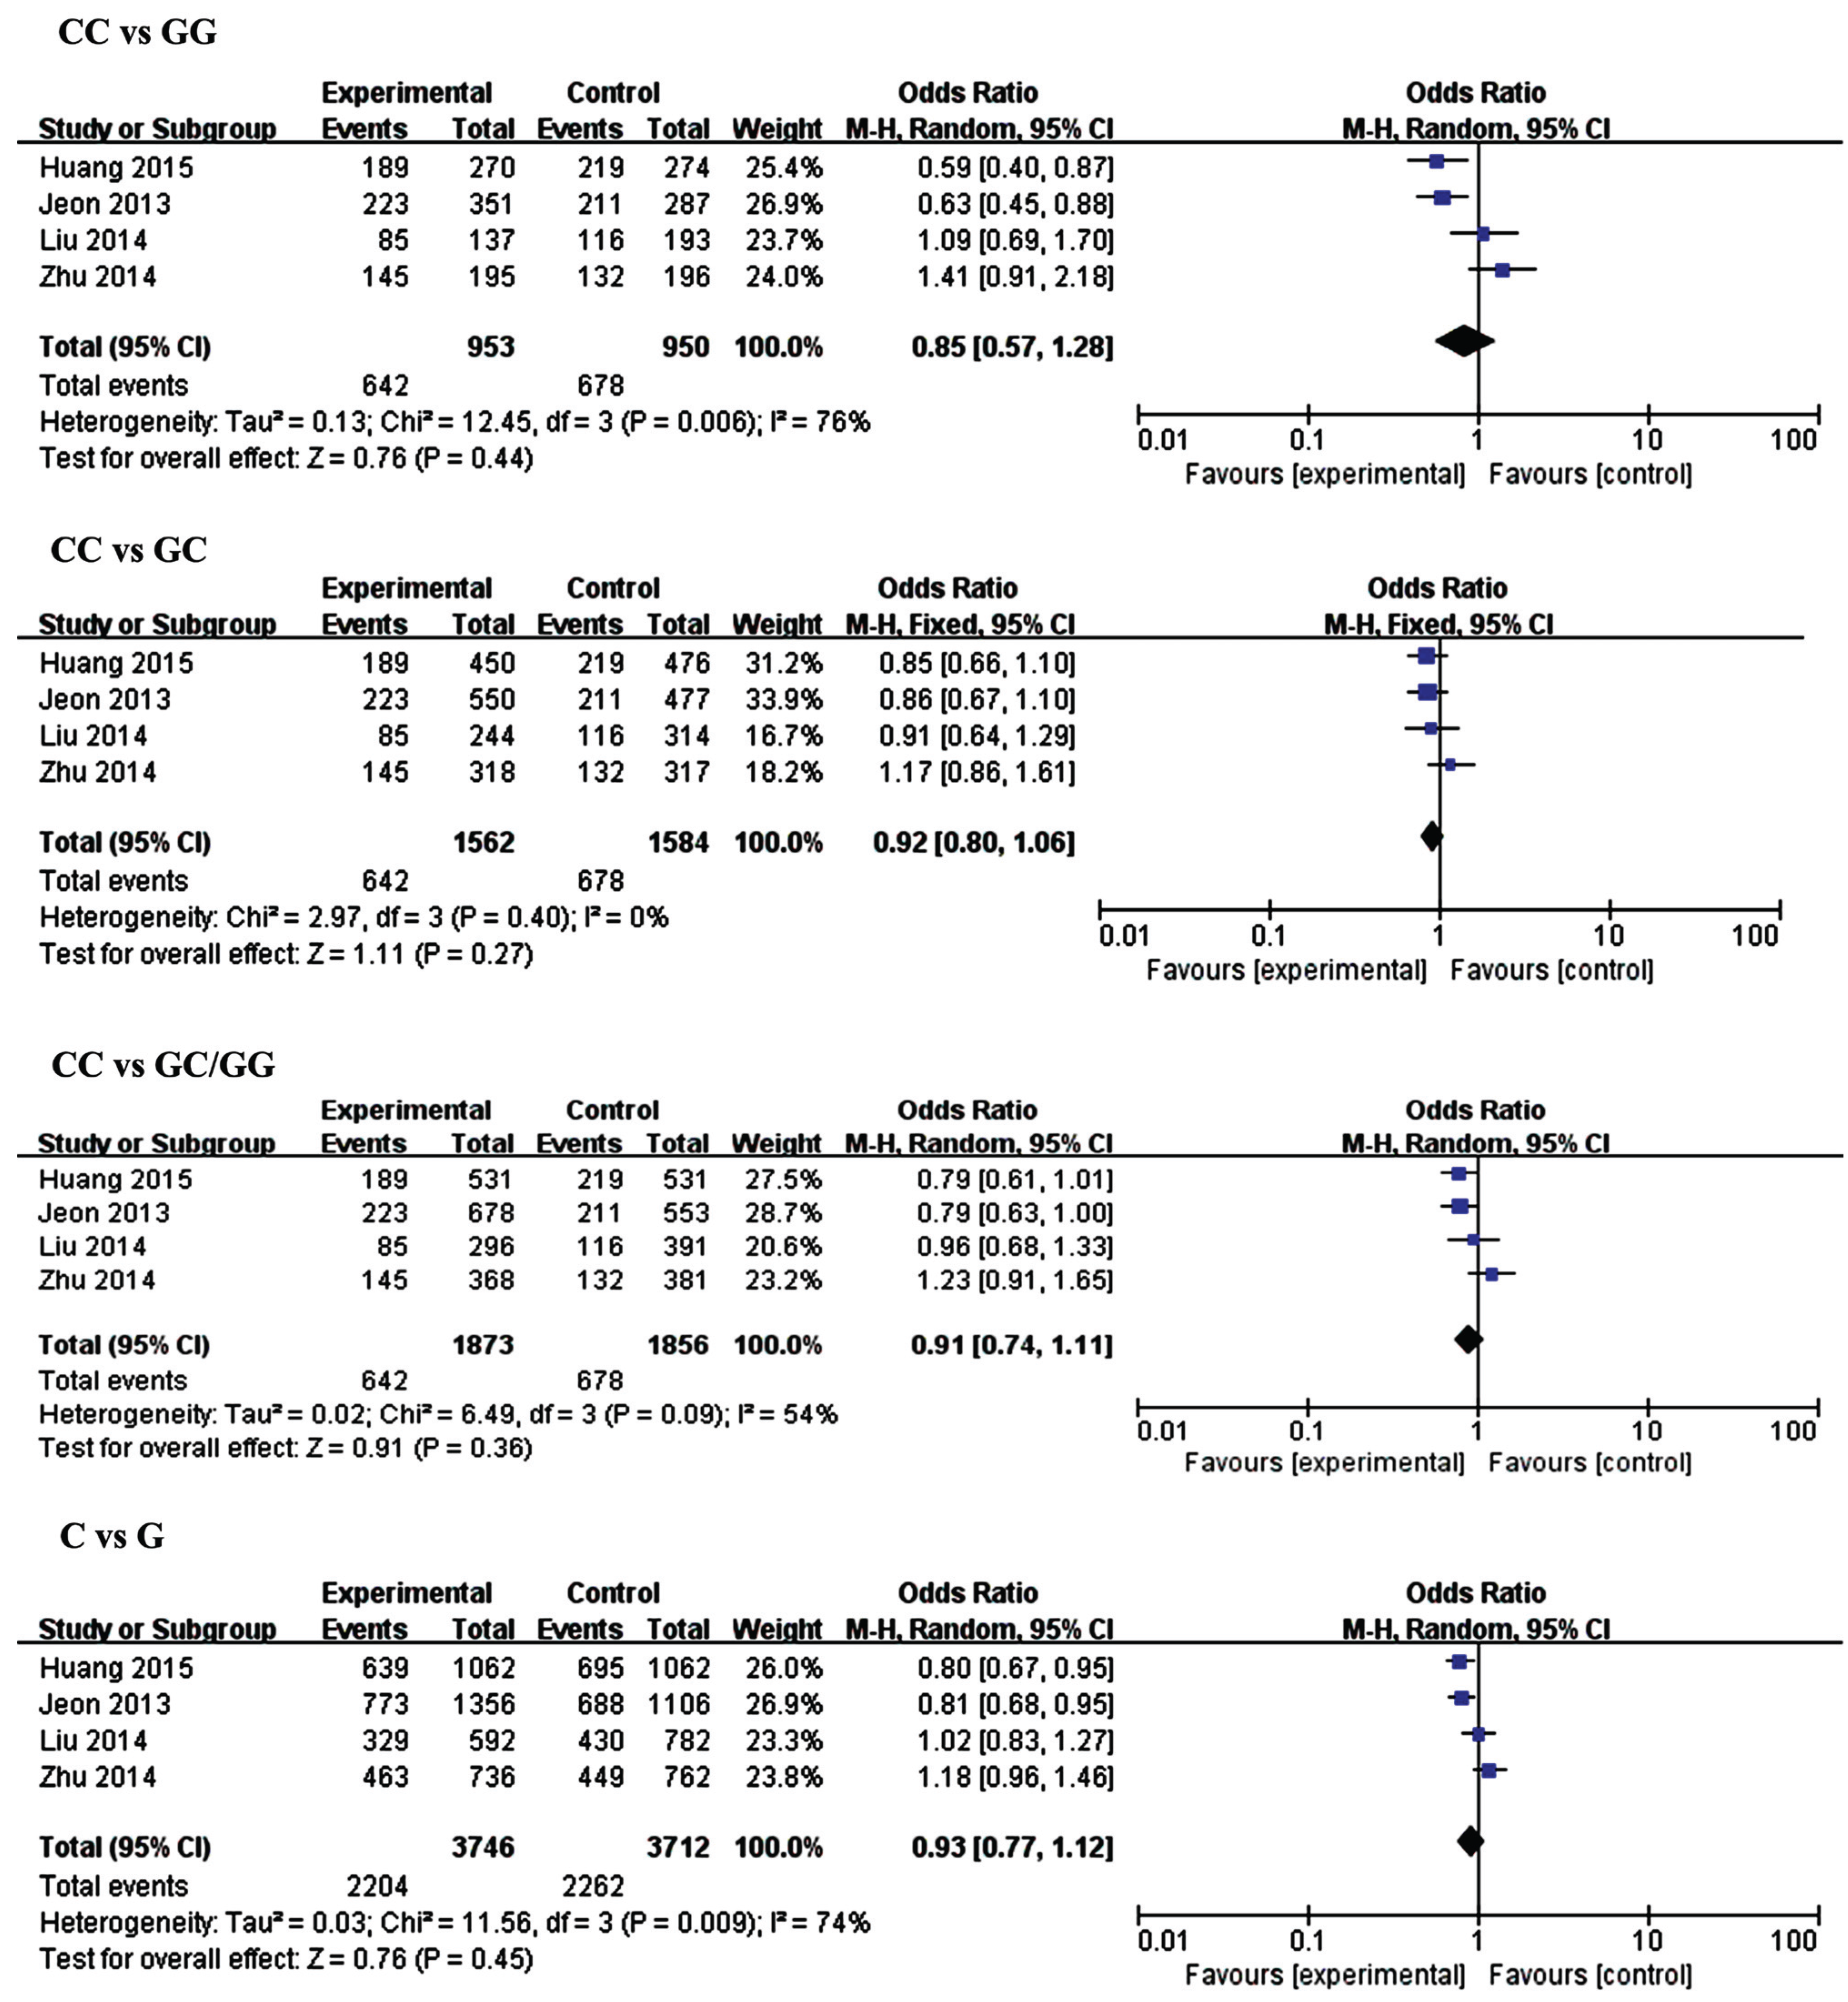
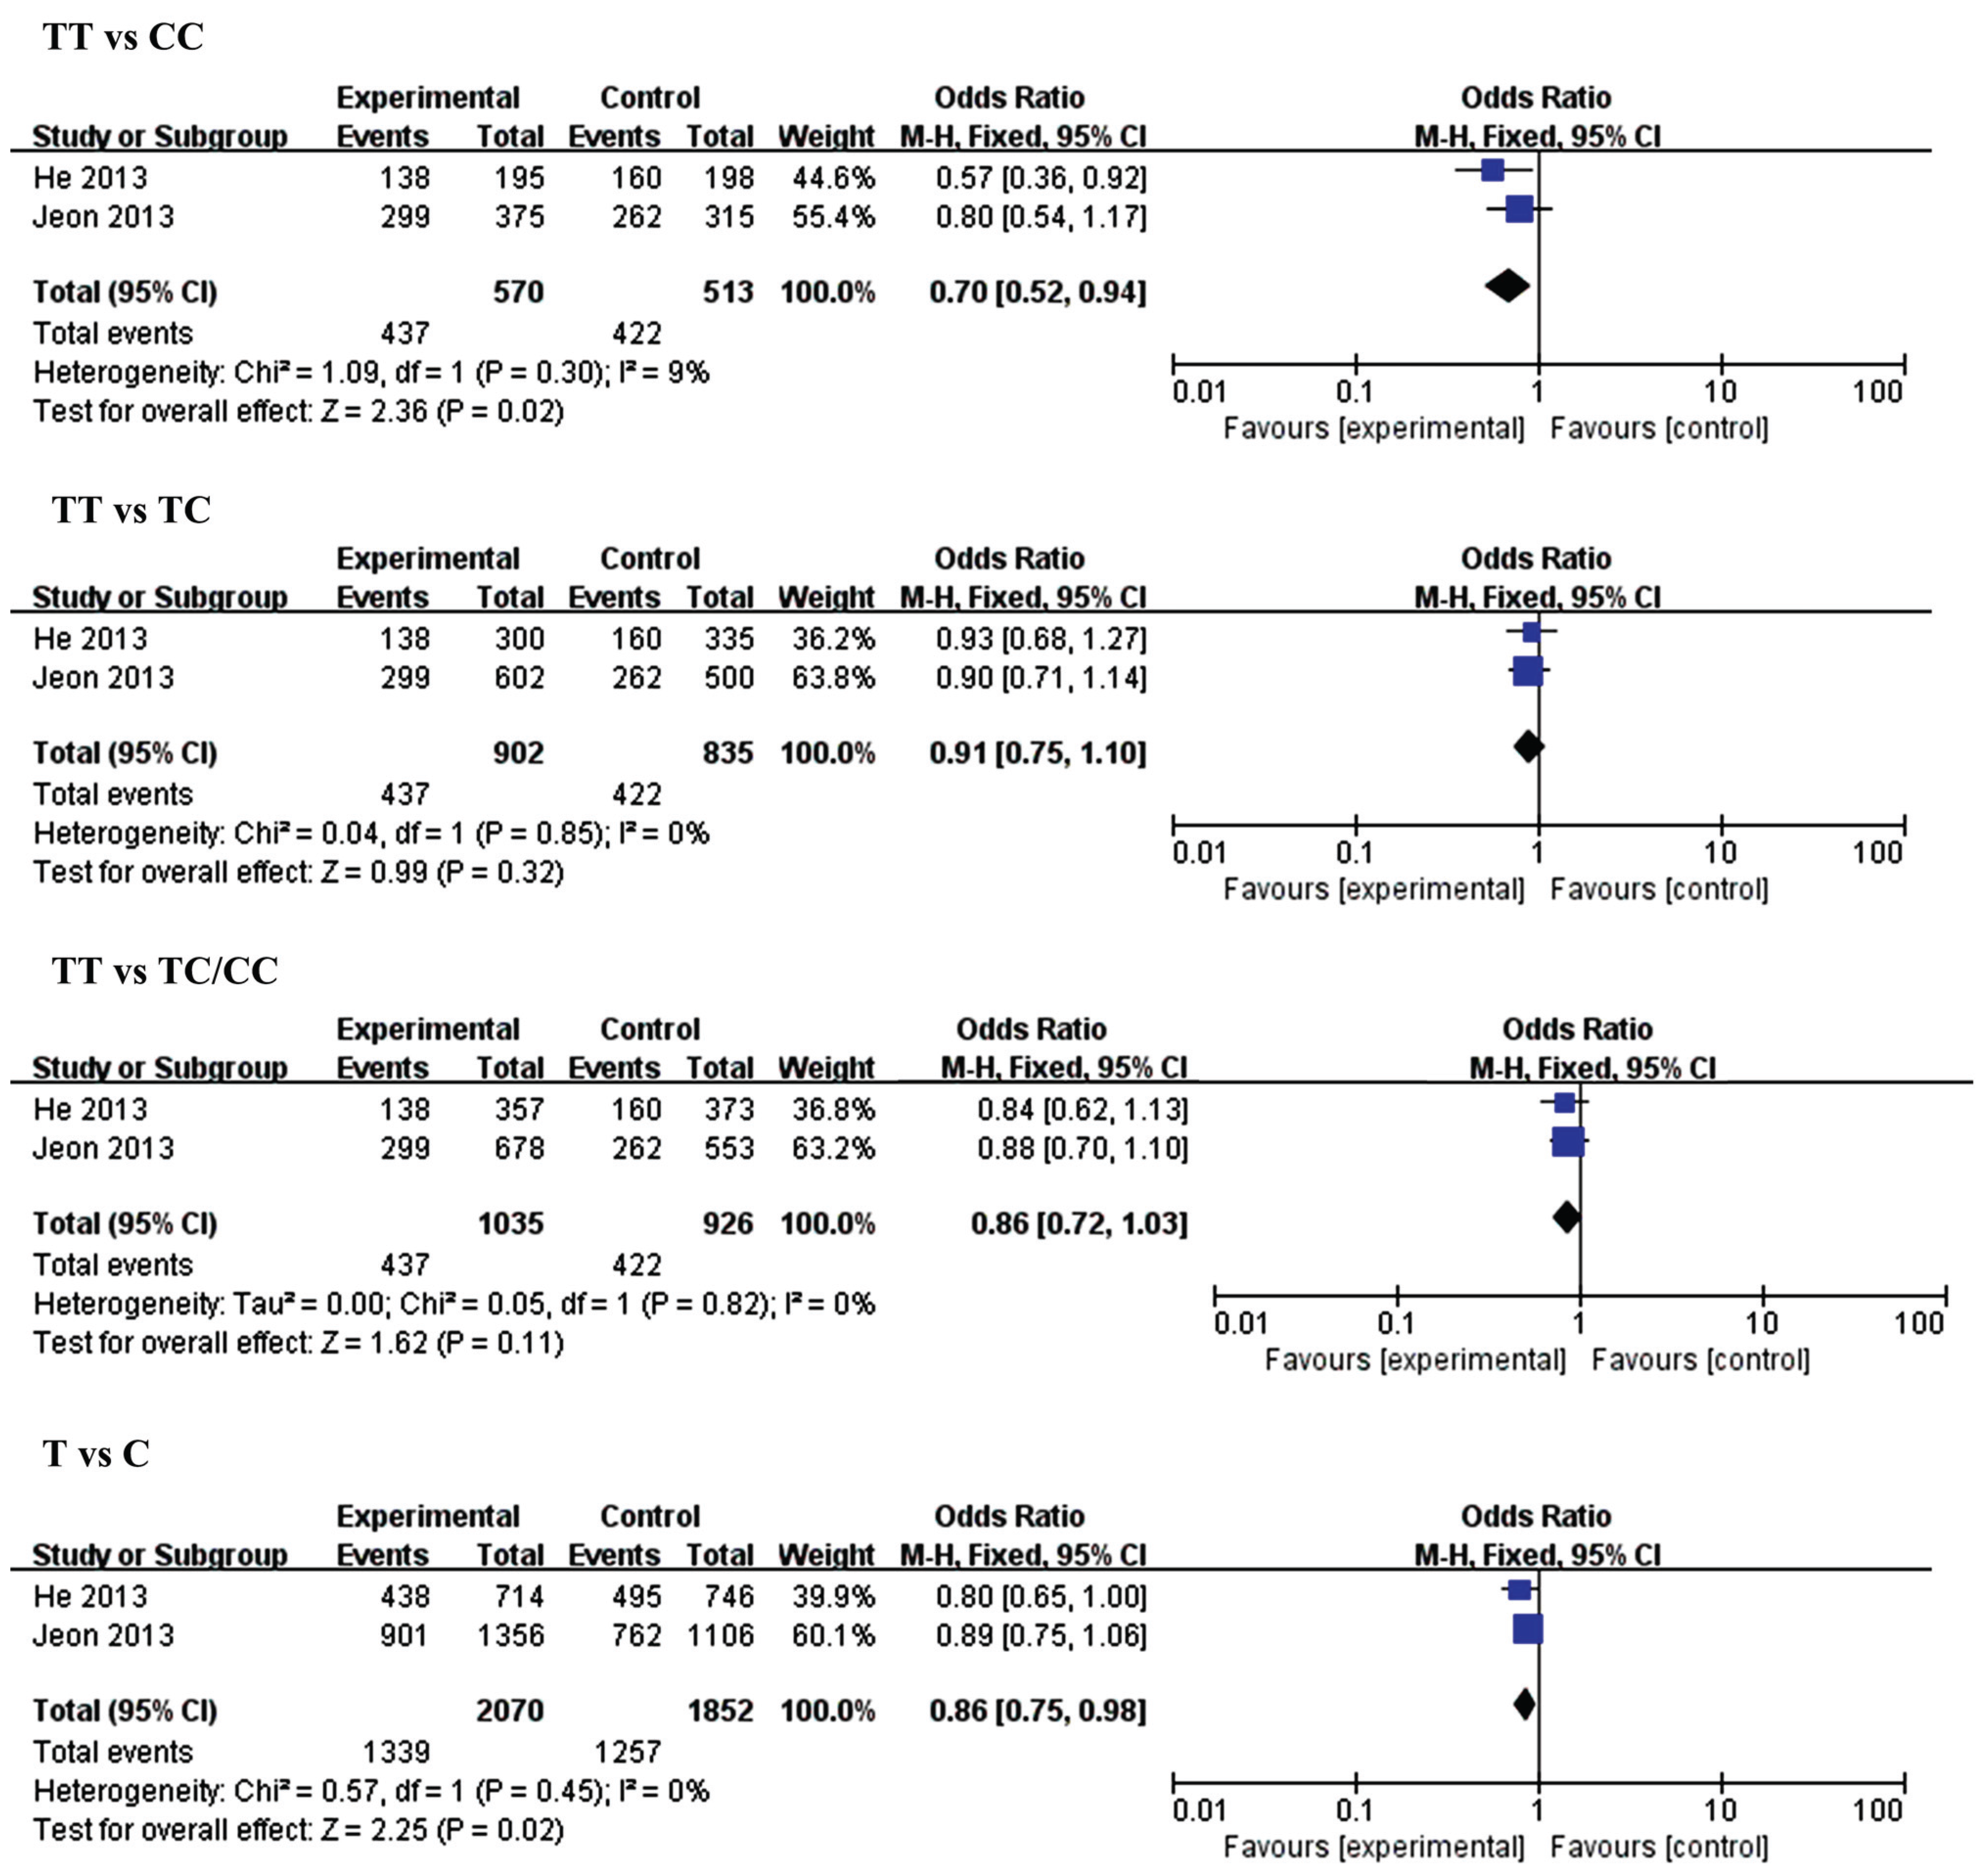
| CC vs. GG | Overall | 4 | 0.85 (0.57,1.28) | 0.44 | 76 | TT vs. CC | Overall | 2 | 0.70 (0.52, 0.94) | 0.02 | 9 |
| Small size | 2 | 1.24 (0.91, 1.70) | 0.18 | 0 | Small size | 1 | 0.57 (0.36, 0.92) | 0.02 | N.A | ||
| Large size | 2 | 0.61 (0.47, 0.79) | 0.0002 | 0 | Large size | 1 | 0.80 (0.54, 1.17) | 0.25 | N.A | ||
| CC vs. GC | Overall | 4 | 0.92 (0.80,1.06) | 0.27 | 0 | TT vs. TC | Overall | 2 | 0.91 (0.75, 1.10) | 0.32 | 0 |
| Small size | 2 | 1.05 (0.83, 1.32) | 0.69 | 10 | Small size | 1 | 0.93 (0.68, 1.27) | 0.66 | N.A | ||
| Large size | 2 | 0.85 (0.71, 1.02) | 0.09 | 0 | Large size | 1 | 0.90 (0.71, 1.14) | 0.37 | N.A | ||
| CC vs. GC/CC | Overall | 4 | 0.89 (0.78, 1.02) | 0.10 | 54 | TT vs. TC/CC | Overall | 2 | 0.86 (0.72, 1.03) | 0.11 | 0 |
| Small size | 2 | 1.10 (0.88, 1.37) | 0.41 | 17 | Small size | 1 | 0.84 (0.62, 1.13) | 0.24 | 81 | ||
| Large size | 2 | 0.79 (0.67, 0.94) | 0.007 | 0 | Large size | 1 | 0.88 (0.70, 1.10) | 0.25 | N.A | ||
| C vs. G | Overall | 4 | 0.93 (0.77, 1.12) | 0.45 | 74 | T vs. C | Overall | 2 | 0.86 (0.75, 0.98) | 0.02 | 0 |
| Small size | 2 | 1.10 (0.95, 1.28) | 0.20 | 0 | Small size | 1 | 0.80 (0.65, 1.00) | 0.05 | N.A | ||
| Large size | 2 | 0.80 [0.71, 0.90) | 0.0003 | 0 | Large size | 1 | 0.89 [0.75, 1.06) | 0.20 | N.A | ||
| Genetic Model | MiR-196a2 rs 11614913 | Genetic Model | MiR-499 rs3746444 | ||||||||
| N | OR (95% CI) | p-Value | I2 (%) | N | OR (95% CI) | p-Value | I2 (%) | ||||
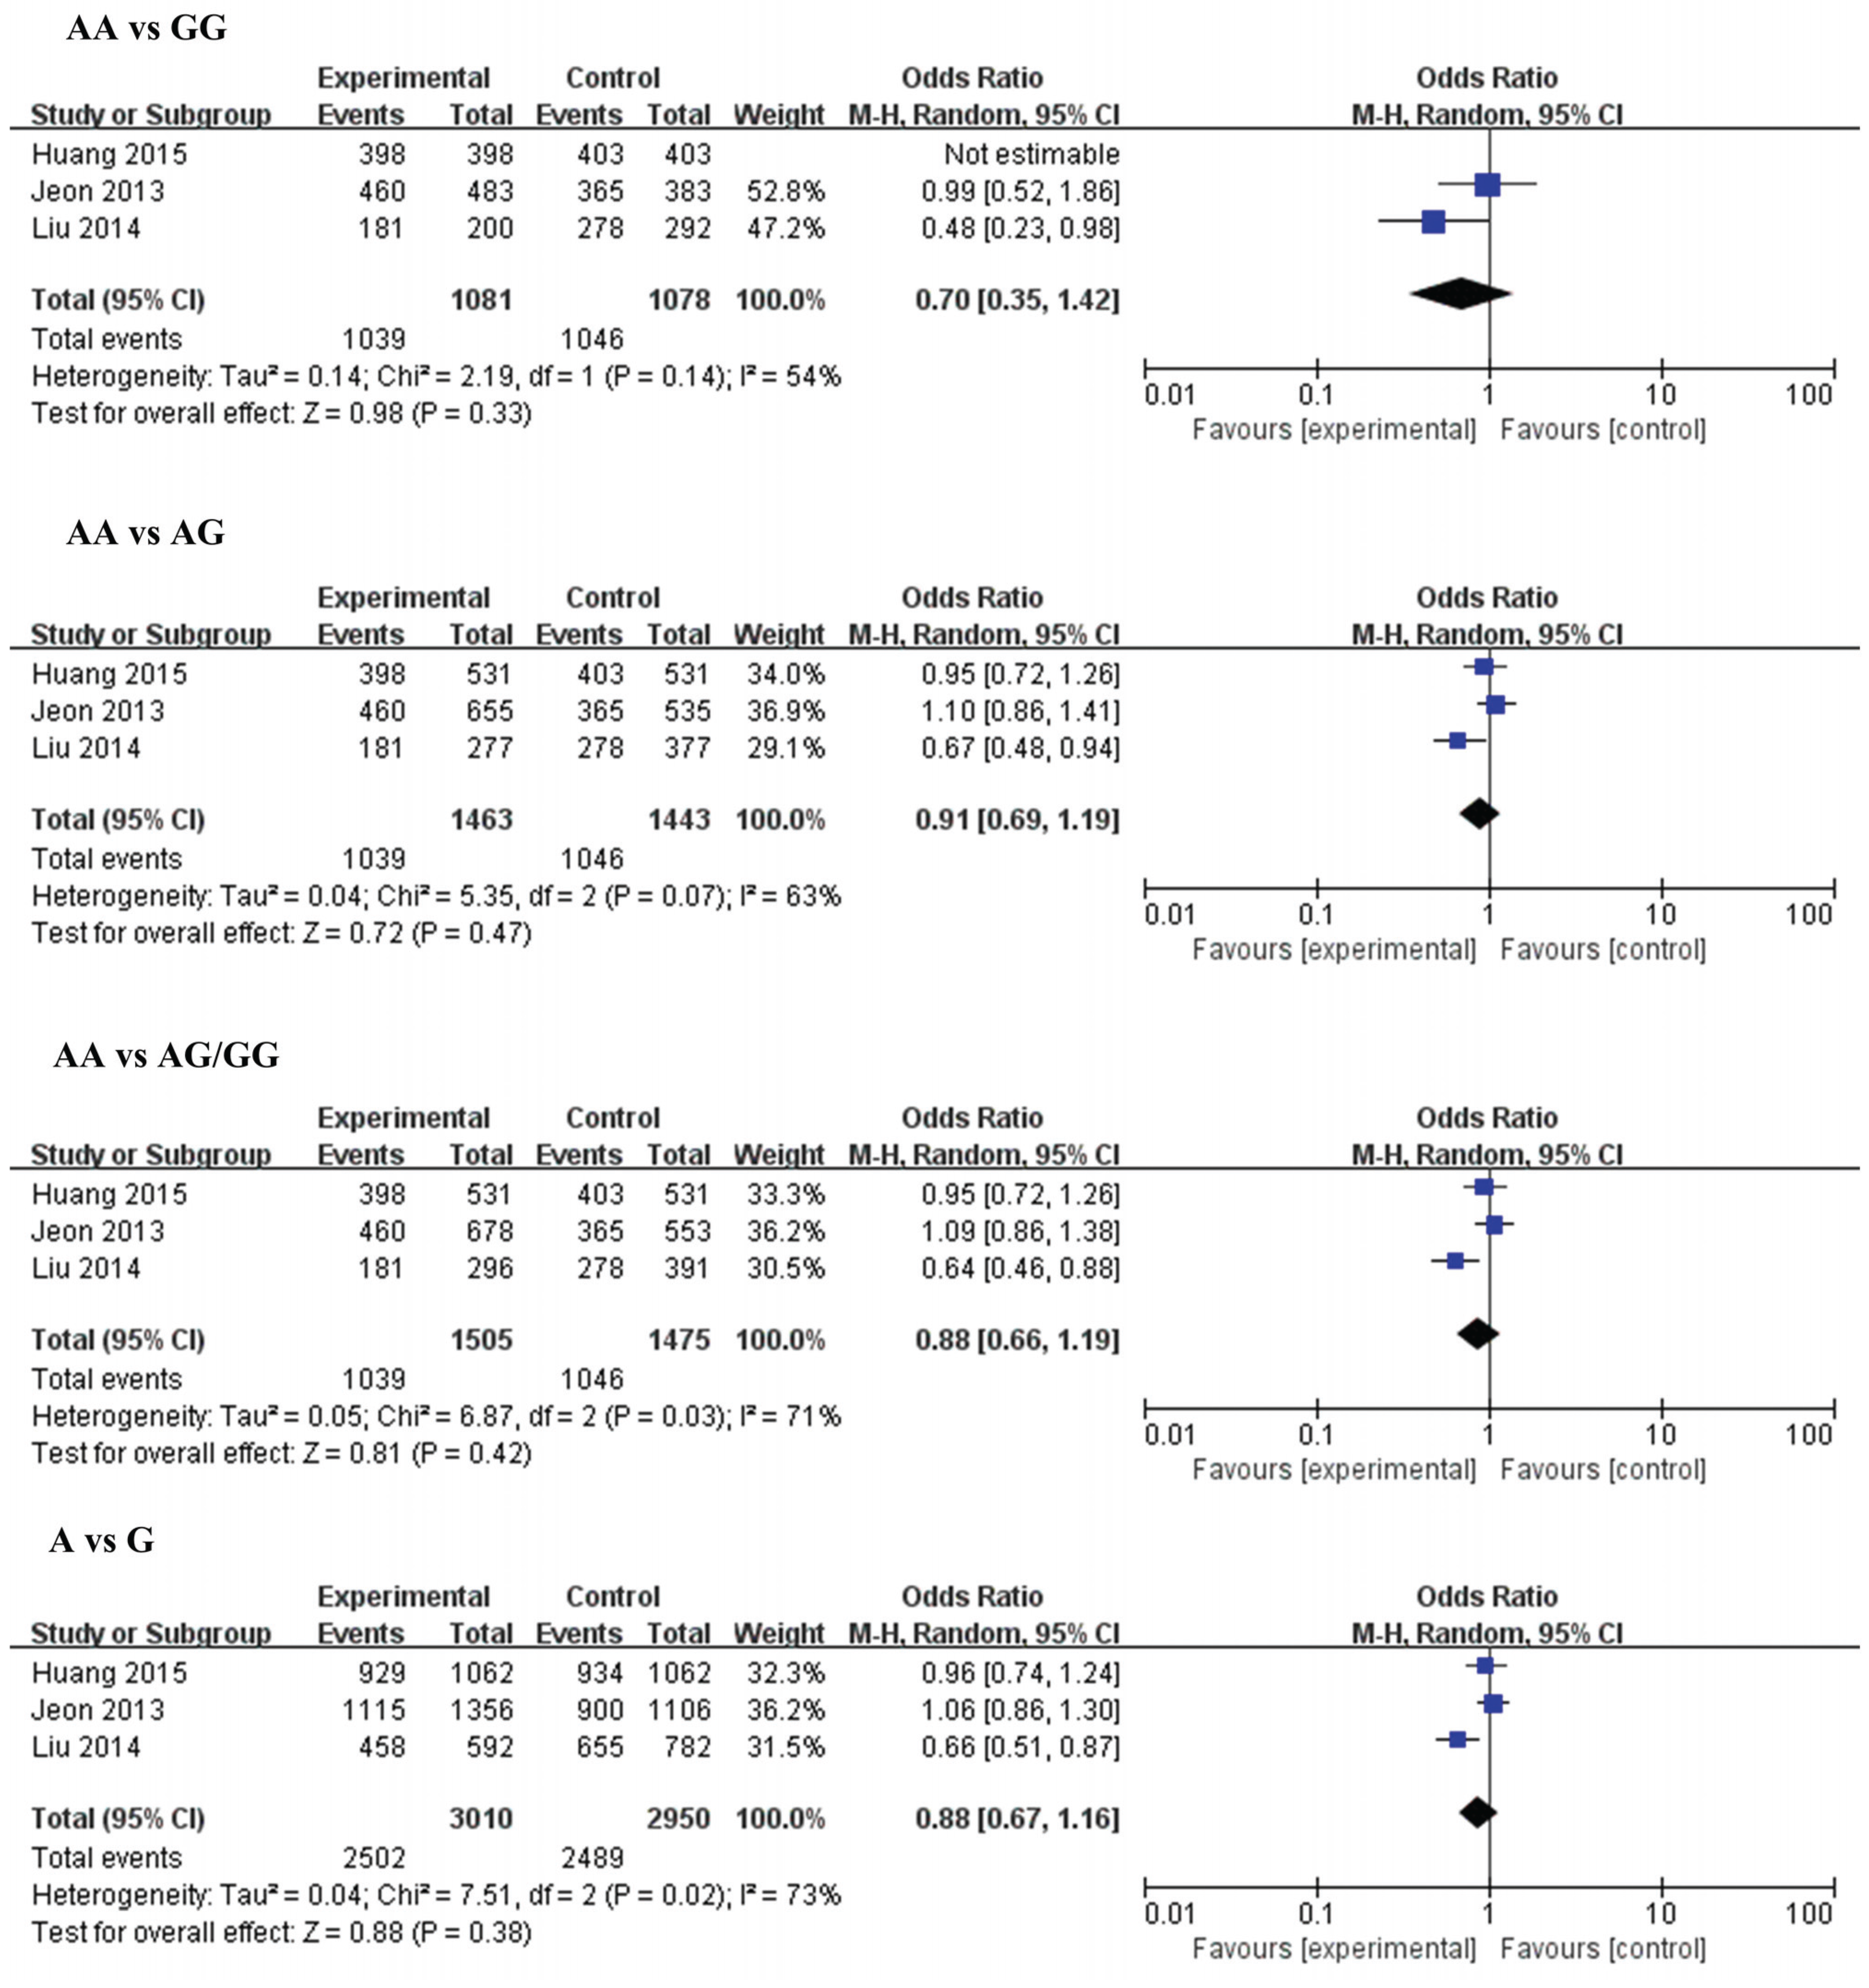
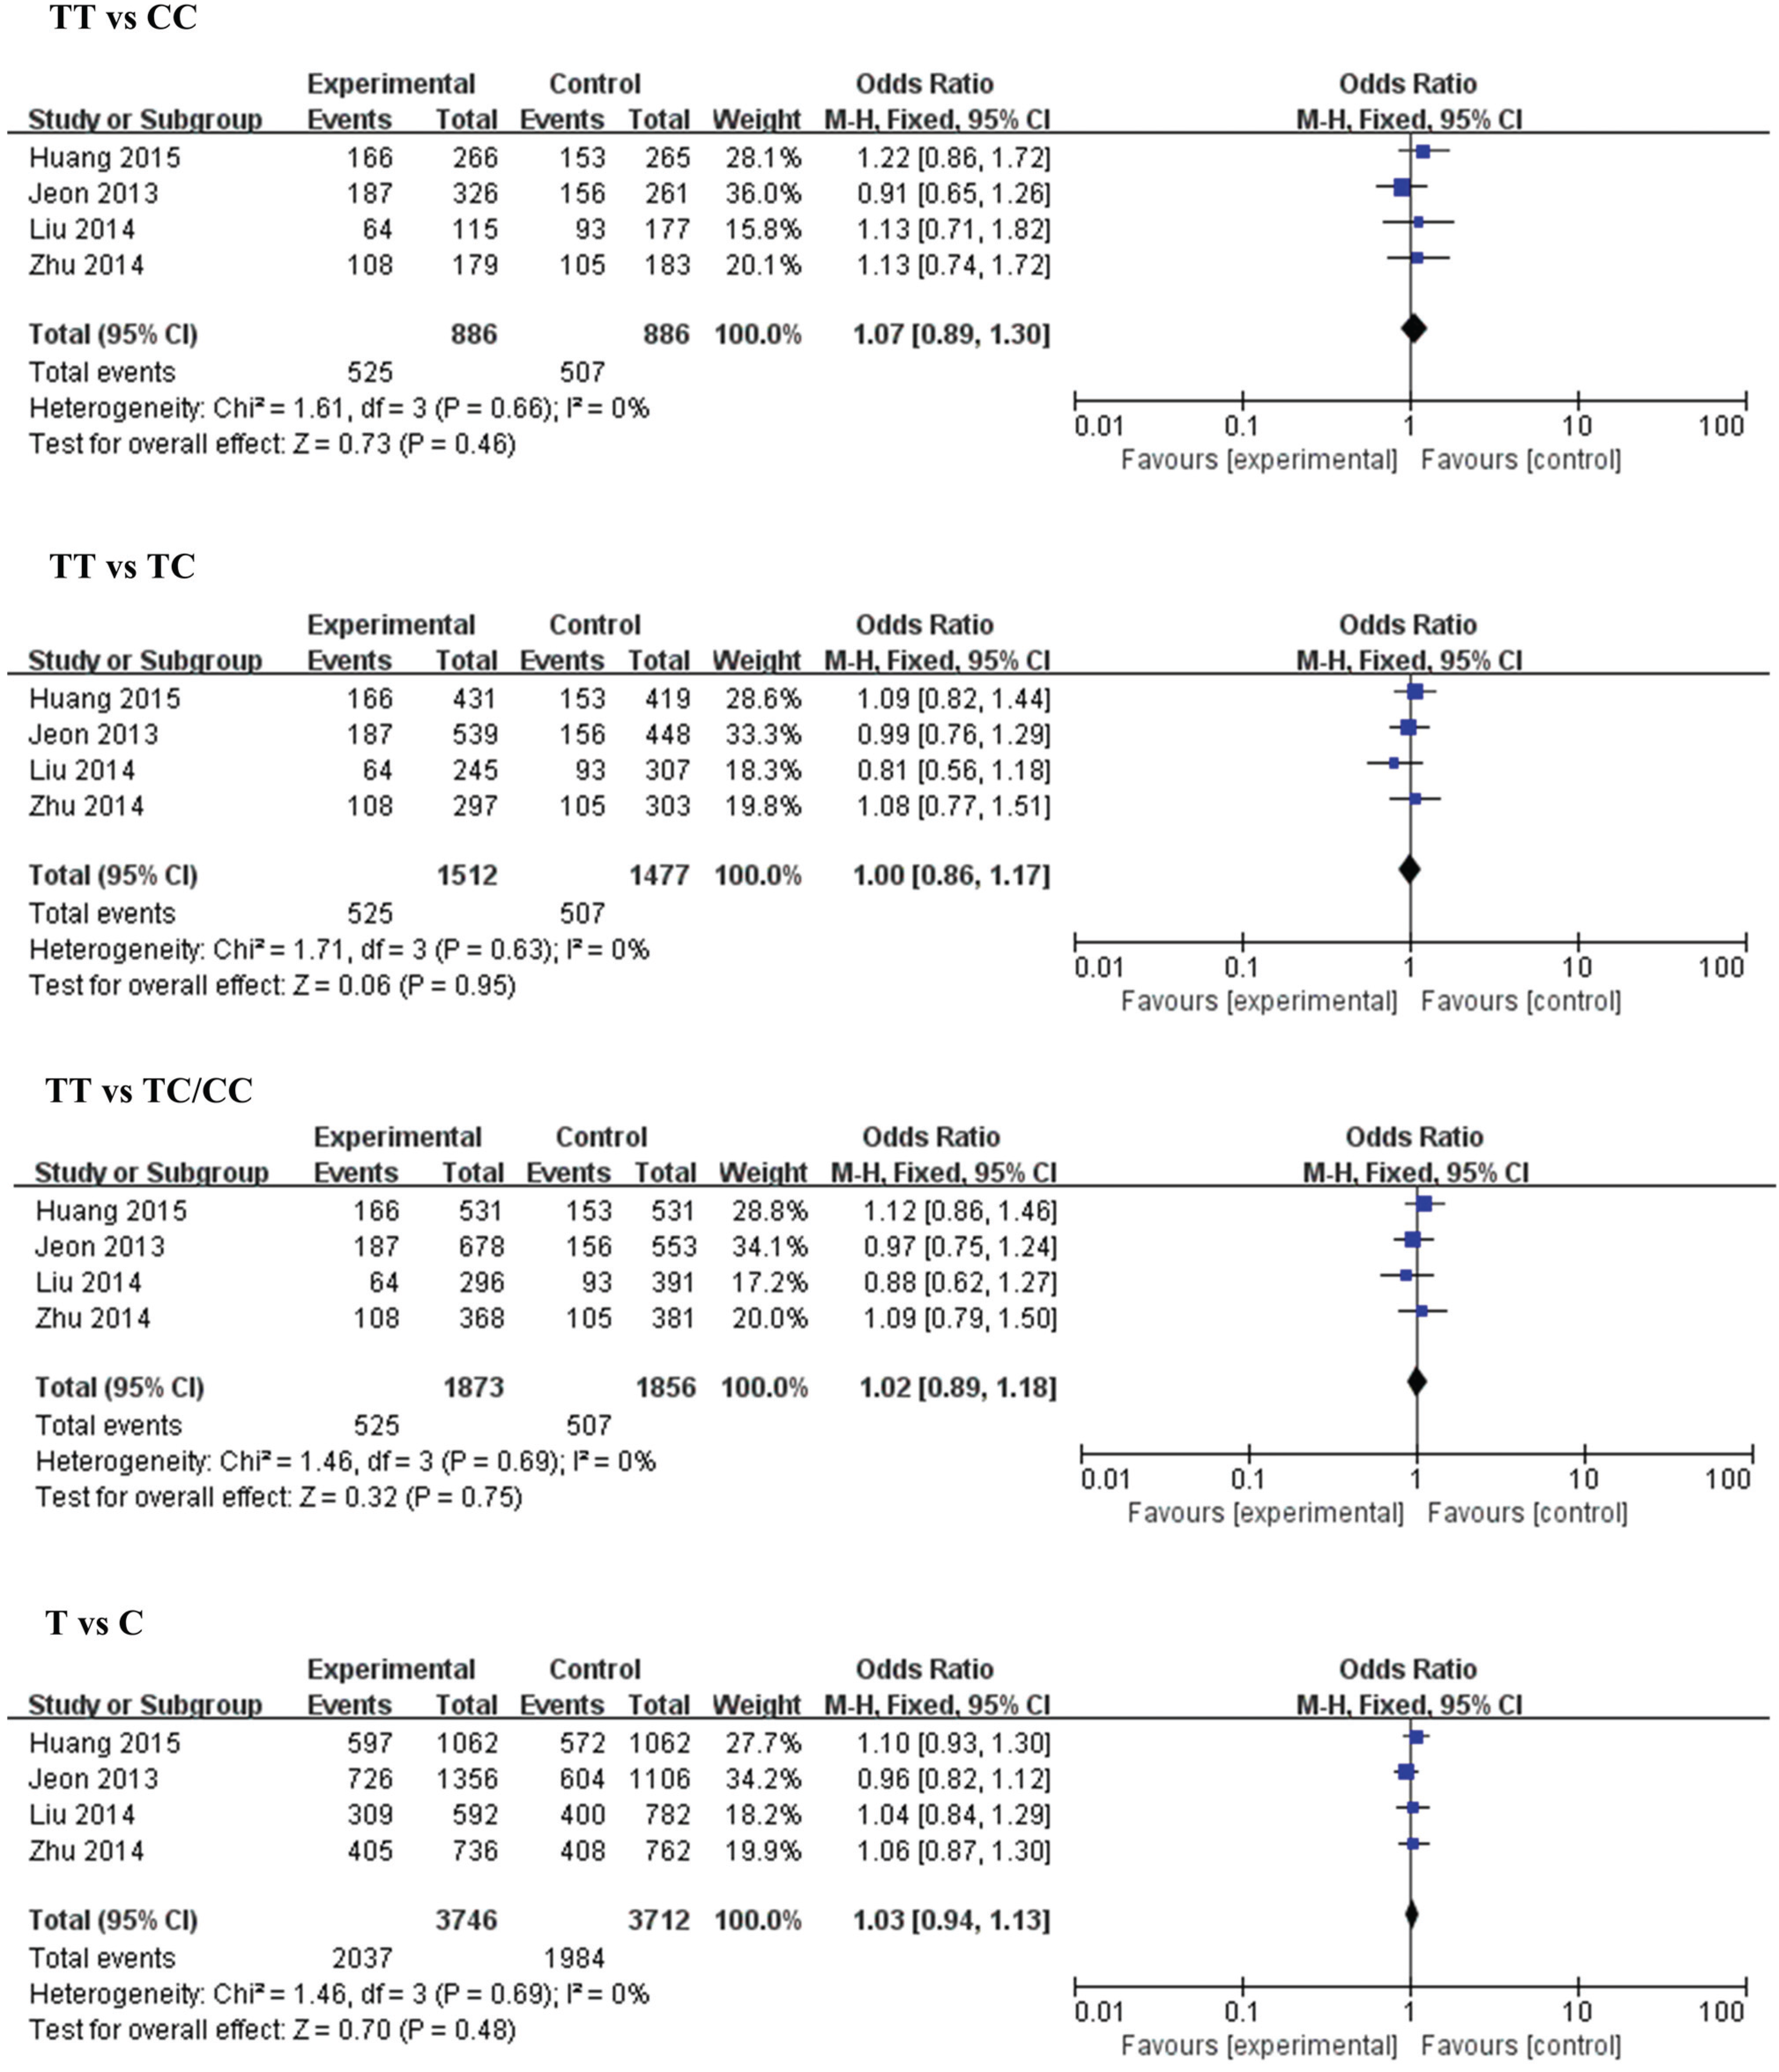
| TT vs. CC | Overall | 4 | 1.07 [0.89, 1.30) | 0.46 | 0 | AA vs. GG | Overall | 3 | 0.70 [0.35, 1.42) | 0.33 | 54 |
| Small size | 2 | 1.13 [0.83, 1.55) | 0.44 | 0 | Small size | 1 | 0.48 [0.23, 0.98) | 0.04 | N.A | ||
| Large size | 2 | 1.04 [0.78, 1.39) | 0.77 | 31 | Large size | 2 | 0.99 [0.52, 1.86) | 0.97 | N.A | ||
| TT vs. TC | Overall | 4 | 1.00 [0.86, 1.17) | 0.95 | 0 | AA vs. AG | Overall | 3 | 0.87 [0.54, 1.41) | 0.57 | 81 |
| Small size | 2 | 0.95 [0.74, 1.22) | 0.69 | 17 | Small size | 1 | 0.67 [0.48, 0.94) | 0.02 | N.A | ||
| Large size | 2 | 1.04 [0.86, 1.26) | 0.70 | 0 | Large size | 2 | 1.03 [0.86, 1.24) | 0.75 | 0 | ||
| TT vs. TC/CC | Overall | 4 | 1.02 (0.89, 1.18) | 0.75 | 0 | AA vs. AG/GG | Overall | 3 | 0.84 (0.50, 1.42) | 0.52 | 85 |
| Small size | 2 | 1.00 (0.78, 1.26) | 0.97 | 0 | Small size | 1 | 0.64 (0.46, 0.88) | 0.006 | N.A | ||
| Large size | 2 | 1.04 (0.87, 1.25) | 0.67 | 0 | Large size | 2 | 1.03 (0.86, 1.23) | 0.77 | 0 | ||
| T vs. C | Overall | 4 | 1.03 (0.94, 1.13) | 0.48 | 0 | A vs. G | Overall | 3 | 0.84 (0.53, 1.34) | 0.47 | 86 |
| Small size | 2 | 1.05 (0.91, 1.22) | 0.50 | 0 | Small size | 1 | 0.66 (0.51, 0.87) | 0.003 | N.A | ||
| Large size | 2 | 1.02 (0.89, 1.17) | 0.75 | 26 | Large size | 2 | 1.02 (0.87, 1.20) | 0.82 | 0 | ||


3.2.1. MiR-146a (rs2910164) and IS

3.2.2. MiR-149 (rs2292832) and IS
3.2.3. MiR-196a2 (rs11614913) and IS
3.2.4. MiR-499 (rs3746444) and IS
3.3. Sources of Heterogeneity
3.4. Sensitivity Analysis
3.5. Publication Bias
| Genetic Models | p Value | Genetic Models | p Value | ||
|---|---|---|---|---|---|
| MiR-146 | CC vs. GG | 0.191 | MiR-149 | TT vs. CC | 0.918 |
| CC vs. GC | 0.420 | TT vs. TC | 0.547 | ||
| CC vs. GC/CC | 0.276 | TT vs. TC/CC | 0.684 | ||
| C vs. G | 0.110 | T vs. C | 0.758 | ||
| MiR-196a2 | TT vs. CC | 0.569 | MiR-499 | AA vs. GG | Not estimated |
| TT vs. TC | 0.413 | AA vs. AG | 0.392 | ||
| TT vs. TC/CC | 0.630 | AA vs. AG/GG | 0.185 | ||
| T vs. C | 0.563 | A vs. G | 0.405 |
4. Discussion
5. Conclusions
Acknowledgments
Author Contributions
Conflicts of Interest
References
- Liu, L.; Wang, D.; Wong, K.S.; Wang, Y. Stroke and stroke care in China: Huge burden, significant workload, and a national priority. Stroke 2011, 42, 3651–3654. [Google Scholar] [CrossRef] [PubMed]
- Goldstein, L.B.; Adams, R.; Becker, K.; Furberg, C.D.; Gorelick, P.B.; Hademenos, G.; Hill, M.; Howard, G.; Howard, V.J.; Jacobs, B.; et al. Primary prevention of ischemic stroke: A statement for healthcare professionals from the Stroke Council of the American Heart Association. Circulation 2001, 103, 163–182. [Google Scholar] [CrossRef] [PubMed]
- Yamase, Y.; Horibe, H.; Ueyama, C.; Fujimaki, T.; Oguri, M.; Kato, K.; Arai, M.; Watanabe, S.; Yamada, Y. Association of and polymorphisms with ischemic stroke. Biomed. Rep. 2015, 3, 491–498. [Google Scholar] [PubMed]
- Jeon, Y.J.; Kim, O.J.; Kim, S.Y.; Oh, S.H.; Oh, D.; Kim, O.J.; Shin, B.S.; Kim, N.K. Association of the miR-146a, miR-149, miR-196a2, and miR-499 polymorphisms with ischemic stroke and silent brain infarction risk. Arterioscler. Thromb. Vasc. Biol. 2013, 33, 420–430. [Google Scholar] [CrossRef] [PubMed]
- Bartel, D.P. MicroRNAs: Genomics, biogenesis, mechanism, and function. Cell 2004, 116, 281–297. [Google Scholar] [CrossRef]
- Pushparaj, P.N.; Aarthi, J.J.; Kumar, S.D.; Manikandan, J. RNAi and RNAa—The yin and yang of RNAome. Bioinformatics 2008, 2, 235–237. [Google Scholar] [CrossRef]
- Min, K.T.; Kim, J.W.; Jeon, Y.J.; Jang, M.J.; Chong, S.Y.; Oh, D.; Kim, N.K. Association of the miR-146aC>G, 149C>T, 196a2C>T, and 499A>G polymorphisms with colorectal cancer in the Korean population. Mol. Carcinog. 2012, 51, E65–E73. [Google Scholar] [CrossRef] [PubMed]
- Park, Y.S.; Jeon, Y.J.; Lee, B.E.; Kim, T.G.; Choi, J.U.; Kim, D.S.; Kim, N.K. Association of the miR-146aC>G, miR-196a2C>T, and miR-499A>G polymorphisms with moyamoya disease in the Korean population. Neurosci. Lett. 2012, 521, 71–75. [Google Scholar] [CrossRef] [PubMed]
- Wigginton, J.E.; Cutler, D.J.; Abecasis, G.R. A note on exact tests of Hardy-Weinberg equilibrium. Am. J. Hum. Genet. 2005, 76, 887–893. [Google Scholar] [CrossRef] [PubMed]
- Jiang, D.K.; Wang, W.Z.; Ren, W.H.; Yao, L.; Peng, B.; Yu, L. TP53 Arg72Pro polymorphism and skin cancer risk: A meta-analysis. J. Investig. Dermatol. 2011, 131, 220–228. [Google Scholar] [CrossRef] [PubMed]
- Higgins, J.P.; Thompson, S.G.; Deeks, J.J.; Altman, D.G. Measuring inconsistency in meta-analyses. Br. Med. J. 2003, 327, 557–560. [Google Scholar] [CrossRef] [PubMed] [Green Version]
- DerSimonian, R.; Laird, N. Meta-analysis in clinical trials. Control. Clin. Trials 1986, 7, 177–188. [Google Scholar] [CrossRef]
- Mantel, N.; Haenszel, W. Statistical aspects of the analysis of data from retrospective studies of disease. J. Natl. Cancer Inst. 1959, 22, 719–748. [Google Scholar] [PubMed]
- Peters, J.L.; Sutton, A.J.; Jones, D.R.; Abrams, K.R.; Rushton, L. Comparison of two methods to detect publication bias in meta-analysis. J. Am. Med. Assoc. 2006, 295, 676–680. [Google Scholar] [CrossRef] [PubMed]
- Zhu, R.; Liu, X.; He, Z.; Li, Q. miR-146a and miR-196a2 polymorphisms in patients with ischemic stroke in the northern Chinese Han population. Neurochem. Res. Neurochem. Res. 2014, 39, 1709–1716. [Google Scholar] [CrossRef] [PubMed]
- Liu, Y.; Ma, Y.; Zhang, B.; Wang, S.X.; Wang, X.M.; Yu, J.M. Genetic polymorphisms in pre-microRNAs and risk of ischemic stroke in a Chinese population. J. Mol. Neurosci. 2014, 52, 473–480. [Google Scholar] [CrossRef] [PubMed]
- Huang, S.; Zhou, S.; Zhang, Y.; Lv, Z.; Li, S.; Xie, C.; Ke, Y.; Deng, P.; Geng, Y.; Zhang, Q.; et al. Association of the genetic polymorphisms in pre-MicroRNAs with risk of ischemic stroke in a Chinese population. PLoS ONE 2015, 10, e0117007. [Google Scholar] [CrossRef] [PubMed]
- He, S.J.; Han, Y.F. Association between miR-149 polymorphism and ischemic stroke of Han population in Hanzhong of Shaanxi. J. Mod. Lab. Med. 2013, 38, 32–34. [Google Scholar]
- Shen, J.; Ambrosone, C.B.; DiCioccio, R.A.; Odunsi, K.; Lele, S.B.; Zhao, H. A functional polymorphism in the miR-146a gene and age of familial breast/ovarian cancer diagnosis. Carcinogenesis 2008, 29, 1963–1966. [Google Scholar] [CrossRef] [PubMed]
- Hoffman, A.E.; Zheng, T.; Yi, C.; Leaderer, D.; Weidhaas, J.; Slack, F.; Zhang, Y.; Paranjape, T.; Zhu, Y. MicroRNA miR-196a-2 and breast cancer: A genetic and epigenetic association study and functional analysis. Cancer Res. 2009, 69, 5970–5977. [Google Scholar] [CrossRef] [PubMed]
- El Gazzar, G.M.; Church, A.; Liu, T.; McCall, C.E. MicroRNA-146a regulates both transcription silencing and translation disruption of TNF-α during TLR4-induced gene reprogramming. J. Leukoc. Biol. 2011, 90, 509–519. [Google Scholar] [CrossRef] [PubMed]
- Wu, C.; Gong, Y.; Sun, A.; Zhang, Y.; Zhang, C.; Zhang, W.; Zhao, G.; Zou, Y.; Ge, J. The human MTHFR rs4846049 polymorphism increases coronary heart disease risk through modifying miRNA binding. Nutr. Metab. Cardiovasc. Dis. 2013, 23, 693–698. [Google Scholar] [CrossRef] [PubMed]
- Luthra, R.; Singh, R.R.; Luthra, M.G.; Li, Y.X.; Hannah, C.; Romans, A.M.; Barkoh, B.A.; Chen, S.S.; Ensor, J.; Maru, D.M.; et al. MicroRNA-196a targets annexin A1: A microRNA-mediated mechanism of annexin A1 downregulation in cancers. Oncogene 2008, 27, 6667–6678. [Google Scholar] [CrossRef] [PubMed]
- Yang, B.; Chen, J.; Li, Y.; Zhang, J.; Li, D.; Huang, Z.; Cai, B.; Li, L.; Shi, Y.; Ying, B.; et al. Association of polymorphisms in pre-miRNA with inflammatory biomarkers in rheumatoid arthritis in the Chinese Han population. Hum. Immunol. 2012, 73, 101–106. [Google Scholar] [CrossRef] [PubMed]
- Cheng, H.S.; Sivachandran, N.; Lau, A.; Boudreau, E.; Zhao, J.L.; Baltimore, D.; Delgado-Olguin, P.; Cybulsky, M.I.; Fish, J.E. MicroRNA-146 represses endothelial activation by inhibiting pro-inflammatory pathways. EMBO Mol. Med. 2013, 5, 949–966. [Google Scholar] [CrossRef] [PubMed]
- Liu, J.P.; Cheng, J.Q.; Peng, J.; Wang, F.; Wang, C.J.; Nie, S.F. Meta analysis on relationship between MTHFR gene polymorphism and susceptibility of stroke in Chinese Han population. Chin. J. Dis. Control Prev. 2007, 11, 30–32. [Google Scholar]
- Bao, M.H.; Xiao, Y.; Zhang, Q.S.; Luo, H.Q.; Luo, J.; Zhao, J.; Li, G.Y.; Zeng, J.; Li, J.M. Meta-analysis of miR-146a polymorphisms association with coronary artery diseases and ischemic stroke. Int. J. Mol. Sci. 2015, 16, 14305–14317. [Google Scholar] [CrossRef] [PubMed]
- Ramkaran, P.; Khan, S.; Phulukdaree, A.; Moodley, D.; Chuturgoon, A.A. miR-146a polymorphism influences levels of miR-146a, IRAK-1, and TRAF-6 in young patients with coronary artery disease. Cell Biochem. Biophys. 2014, 68, 259–266. [Google Scholar] [CrossRef] [PubMed]
- Xu, J.; Hu, Z.; Xu, Z.; Gu, H.; Yi, L.; Cao, H.; Chen, J.; Tian, T.; Liang, J.; Lin, Y.; et al. Functional variant in microRNA-196a2 contributes to the susceptibility of congenital heart disease in a Chinese population. Hum. Mutat. 2009, 30, 1231–1236. [Google Scholar] [CrossRef] [PubMed]
- Xiong, X.D.; Cho, M.; Cai, X.P.; Cheng, J.; Jing, X.; Cen, J.M.; Liu, X.; Yang, X.L.; Suh, Y. A common variant in pre-miR-146 is associated with coronary artery disease risk and its mature miRNA expression. Mutat. Res. 2014, 761, 15–20. [Google Scholar] [CrossRef] [PubMed]
- Hu, Z.; Chen, J.; Tian, T.; Zhou, X.; Gu, H.; Xu, L.; Zeng, Y.; Miao, R.; Jin, G.; Ma, H.; et al. Genetic variants of miRNA sequences and non-small cell lung cancer survival. J. Clin. Invest. 2008, 118, 2600–2608. [Google Scholar] [CrossRef] [PubMed]
© 2015 by the authors; licensee MDPI, Basel, Switzerland. This article is an open access article distributed under the terms and conditions of the Creative Commons Attribution license (http://creativecommons.org/licenses/by/4.0/).
Share and Cite
Xiao, Y.; Bao, M.-H.; Luo, H.-Q.; Xiang, J.; Li, J.-M. A Meta-Analysis of the Association between Polymorphisms in MicroRNAs and Risk of Ischemic Stroke. Genes 2015, 6, 1283-1299. https://doi.org/10.3390/genes6041283
Xiao Y, Bao M-H, Luo H-Q, Xiang J, Li J-M. A Meta-Analysis of the Association between Polymorphisms in MicroRNAs and Risk of Ischemic Stroke. Genes. 2015; 6(4):1283-1299. https://doi.org/10.3390/genes6041283
Chicago/Turabian StyleXiao, Yan, Mei-Hua Bao, Huai-Qing Luo, Ju Xiang, and Jian-Ming Li. 2015. "A Meta-Analysis of the Association between Polymorphisms in MicroRNAs and Risk of Ischemic Stroke" Genes 6, no. 4: 1283-1299. https://doi.org/10.3390/genes6041283