
Transcriptome Analysis of Two Vicia sativa Subspecies: Mining Molecular Markers to Enhance Genomic Resources for Vetch Improvement

 ,
,
Abstract
:1. Introduction
2. Experimental Section
2.1. Plant Materials
2.2. Library Preparation
2.3. 454 Sequencing
2.4. Functional Category Annotation
2.5. Simple Sequence Repeat Mining and Validation
2.6. SNPs Discovery
3. Results
3.1. 454 Sequencing

| Sample | Large Contig (Length ≥100 bp) | Singletons after Sequence Cleanings (SeqClean, Lucy) | Total Valid Unigenes (Isotigs c + Singletons) | ||||
|---|---|---|---|---|---|---|---|
| Contigs | Bases | ACZ a | N50 Contig Size b | Largest Contig Size | |||
| sativa | 2698 | 1,983.375 | 735.13 | 782 | 3849 | 31,504 | 34,202 |
| nigra | 837 | 503,641 | 601.72 | 619 | 3345 | 17,971 | 18,808 |
| Sample (V. sativa spp.) | Total No. of Reads | Total No. of Bases | Assembled | Partial | Singleton | Repeat | Singletons after SeqClean | Singletons after Lucy |
|---|---|---|---|---|---|---|---|---|
| sativa | 86,532 | 28,429.544 | 42,405 | 5923 | 34,938 | 24 | 31,744 | 31,504 |
| nigra | 47,103 | 16,060.539 | 24,242 | 2309 | 19,646 | 9 | 18,091 | 17,971 |
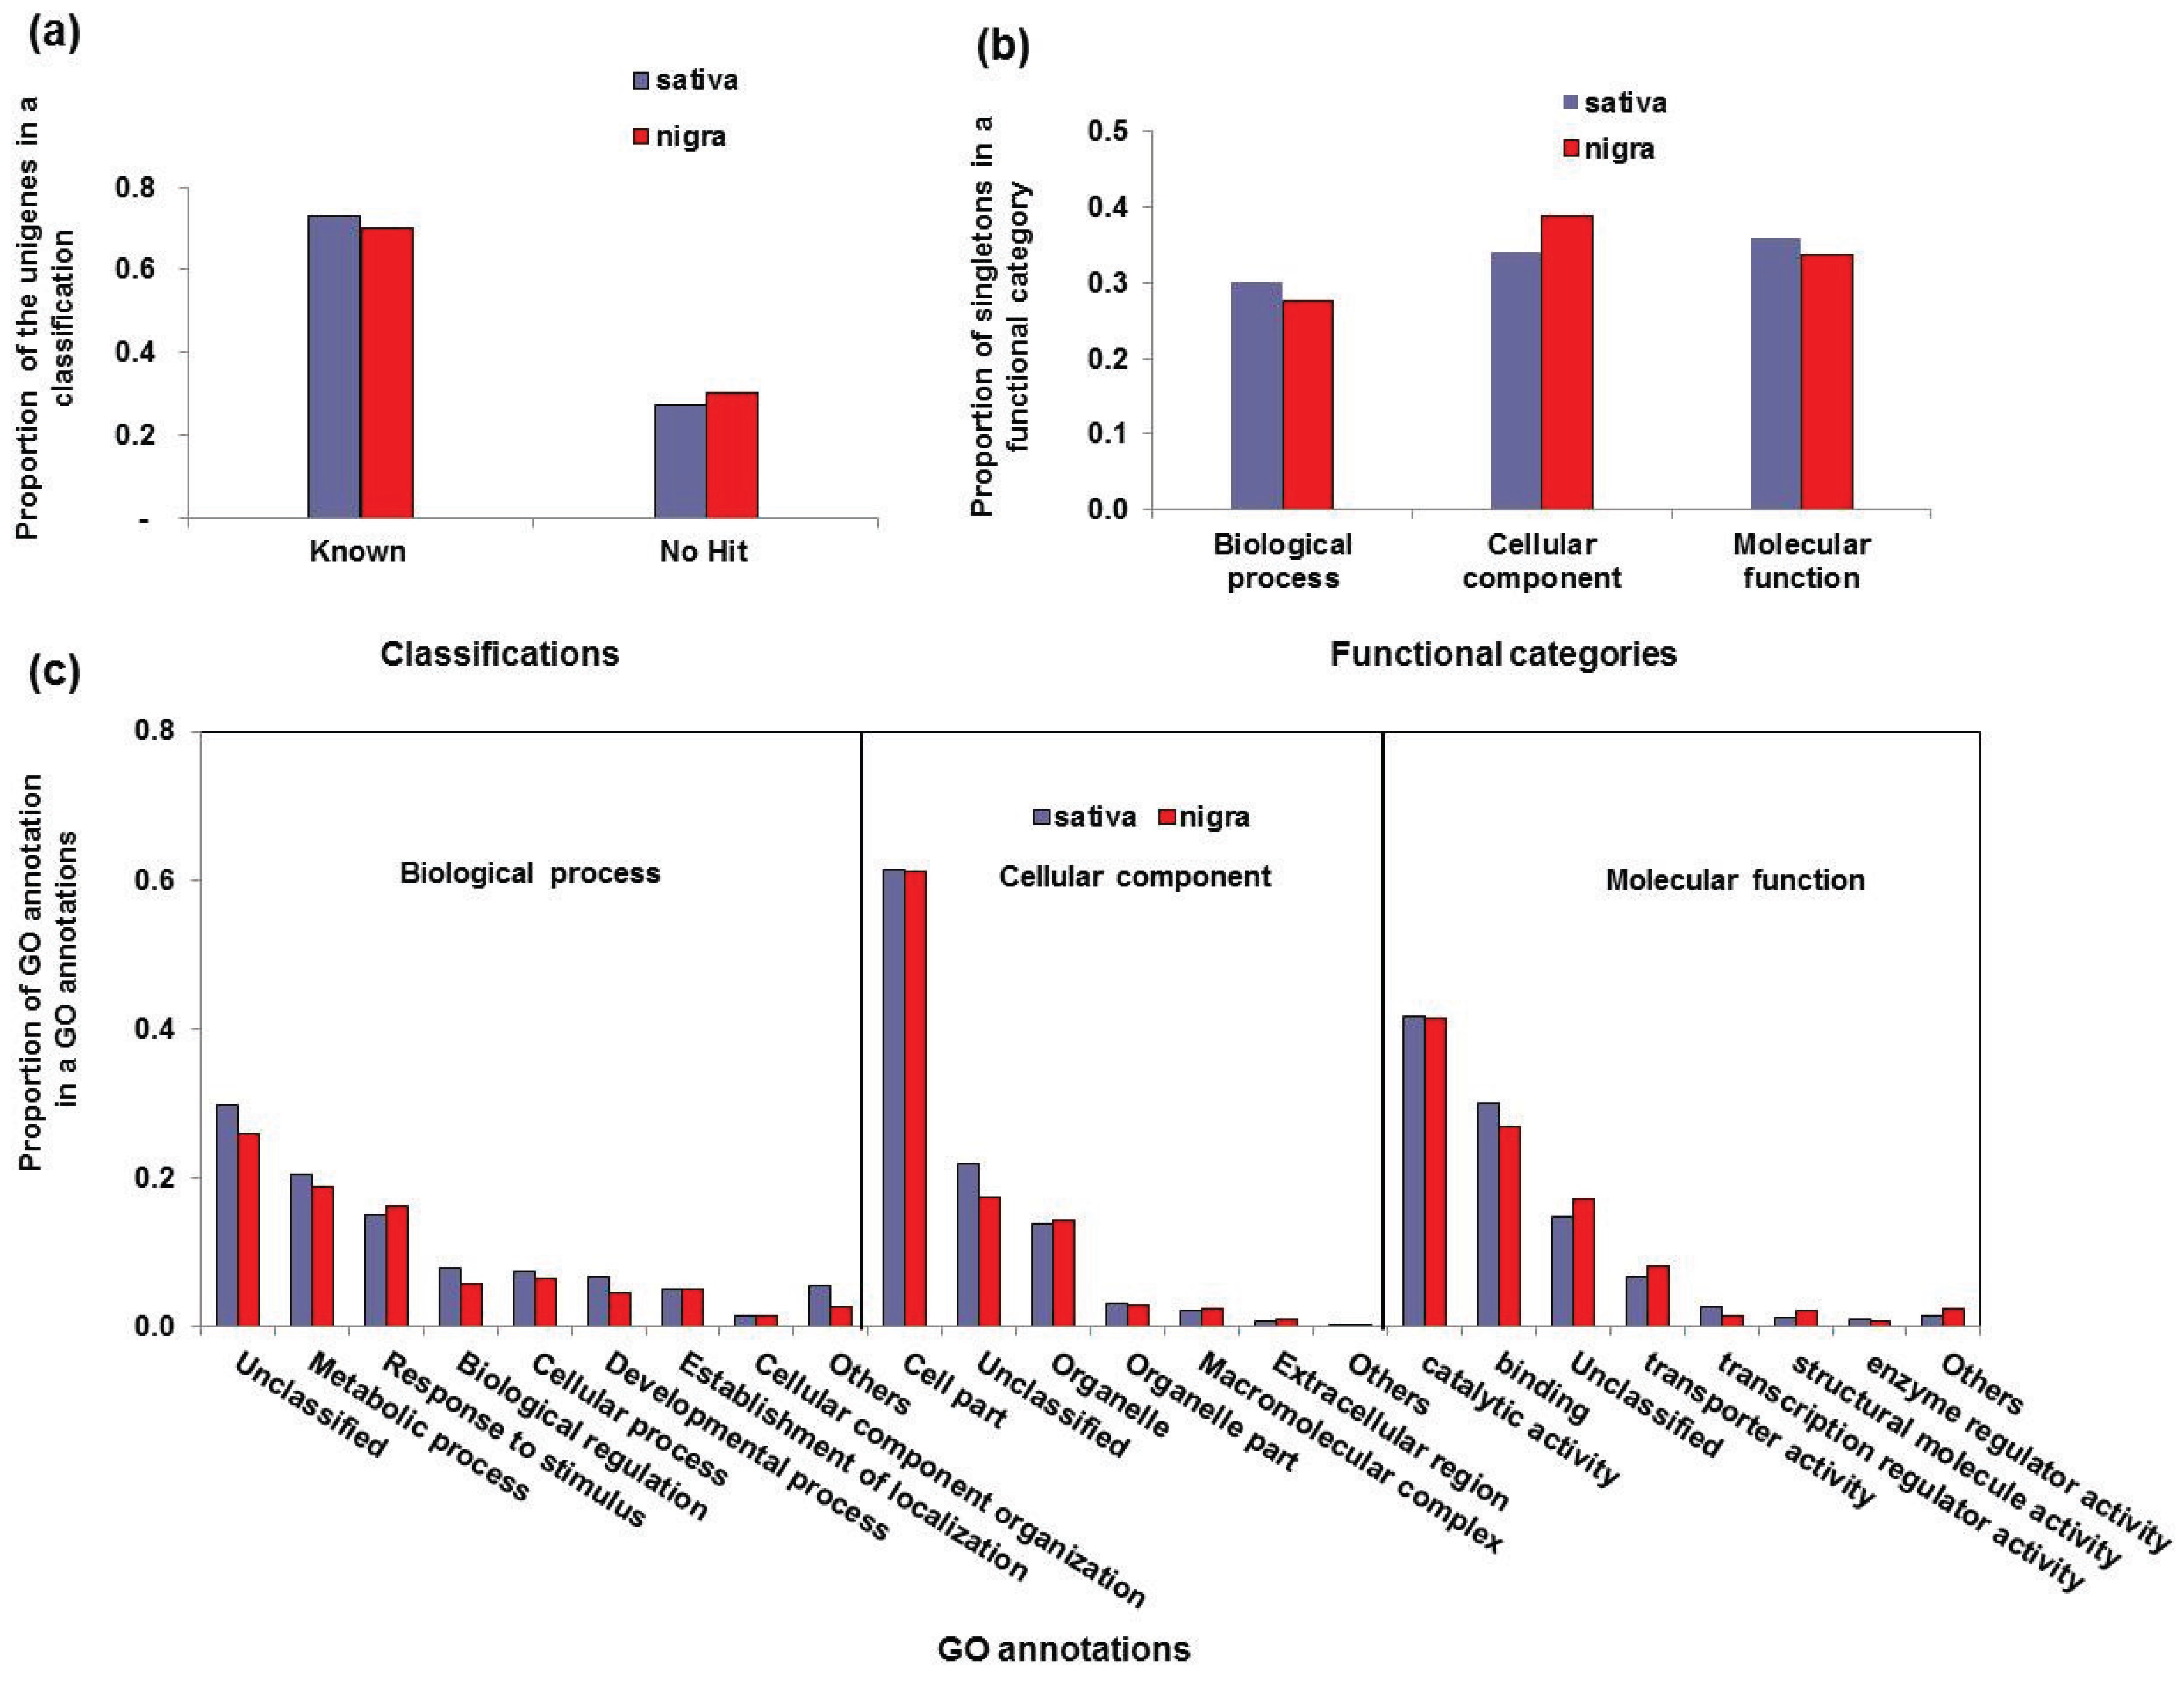
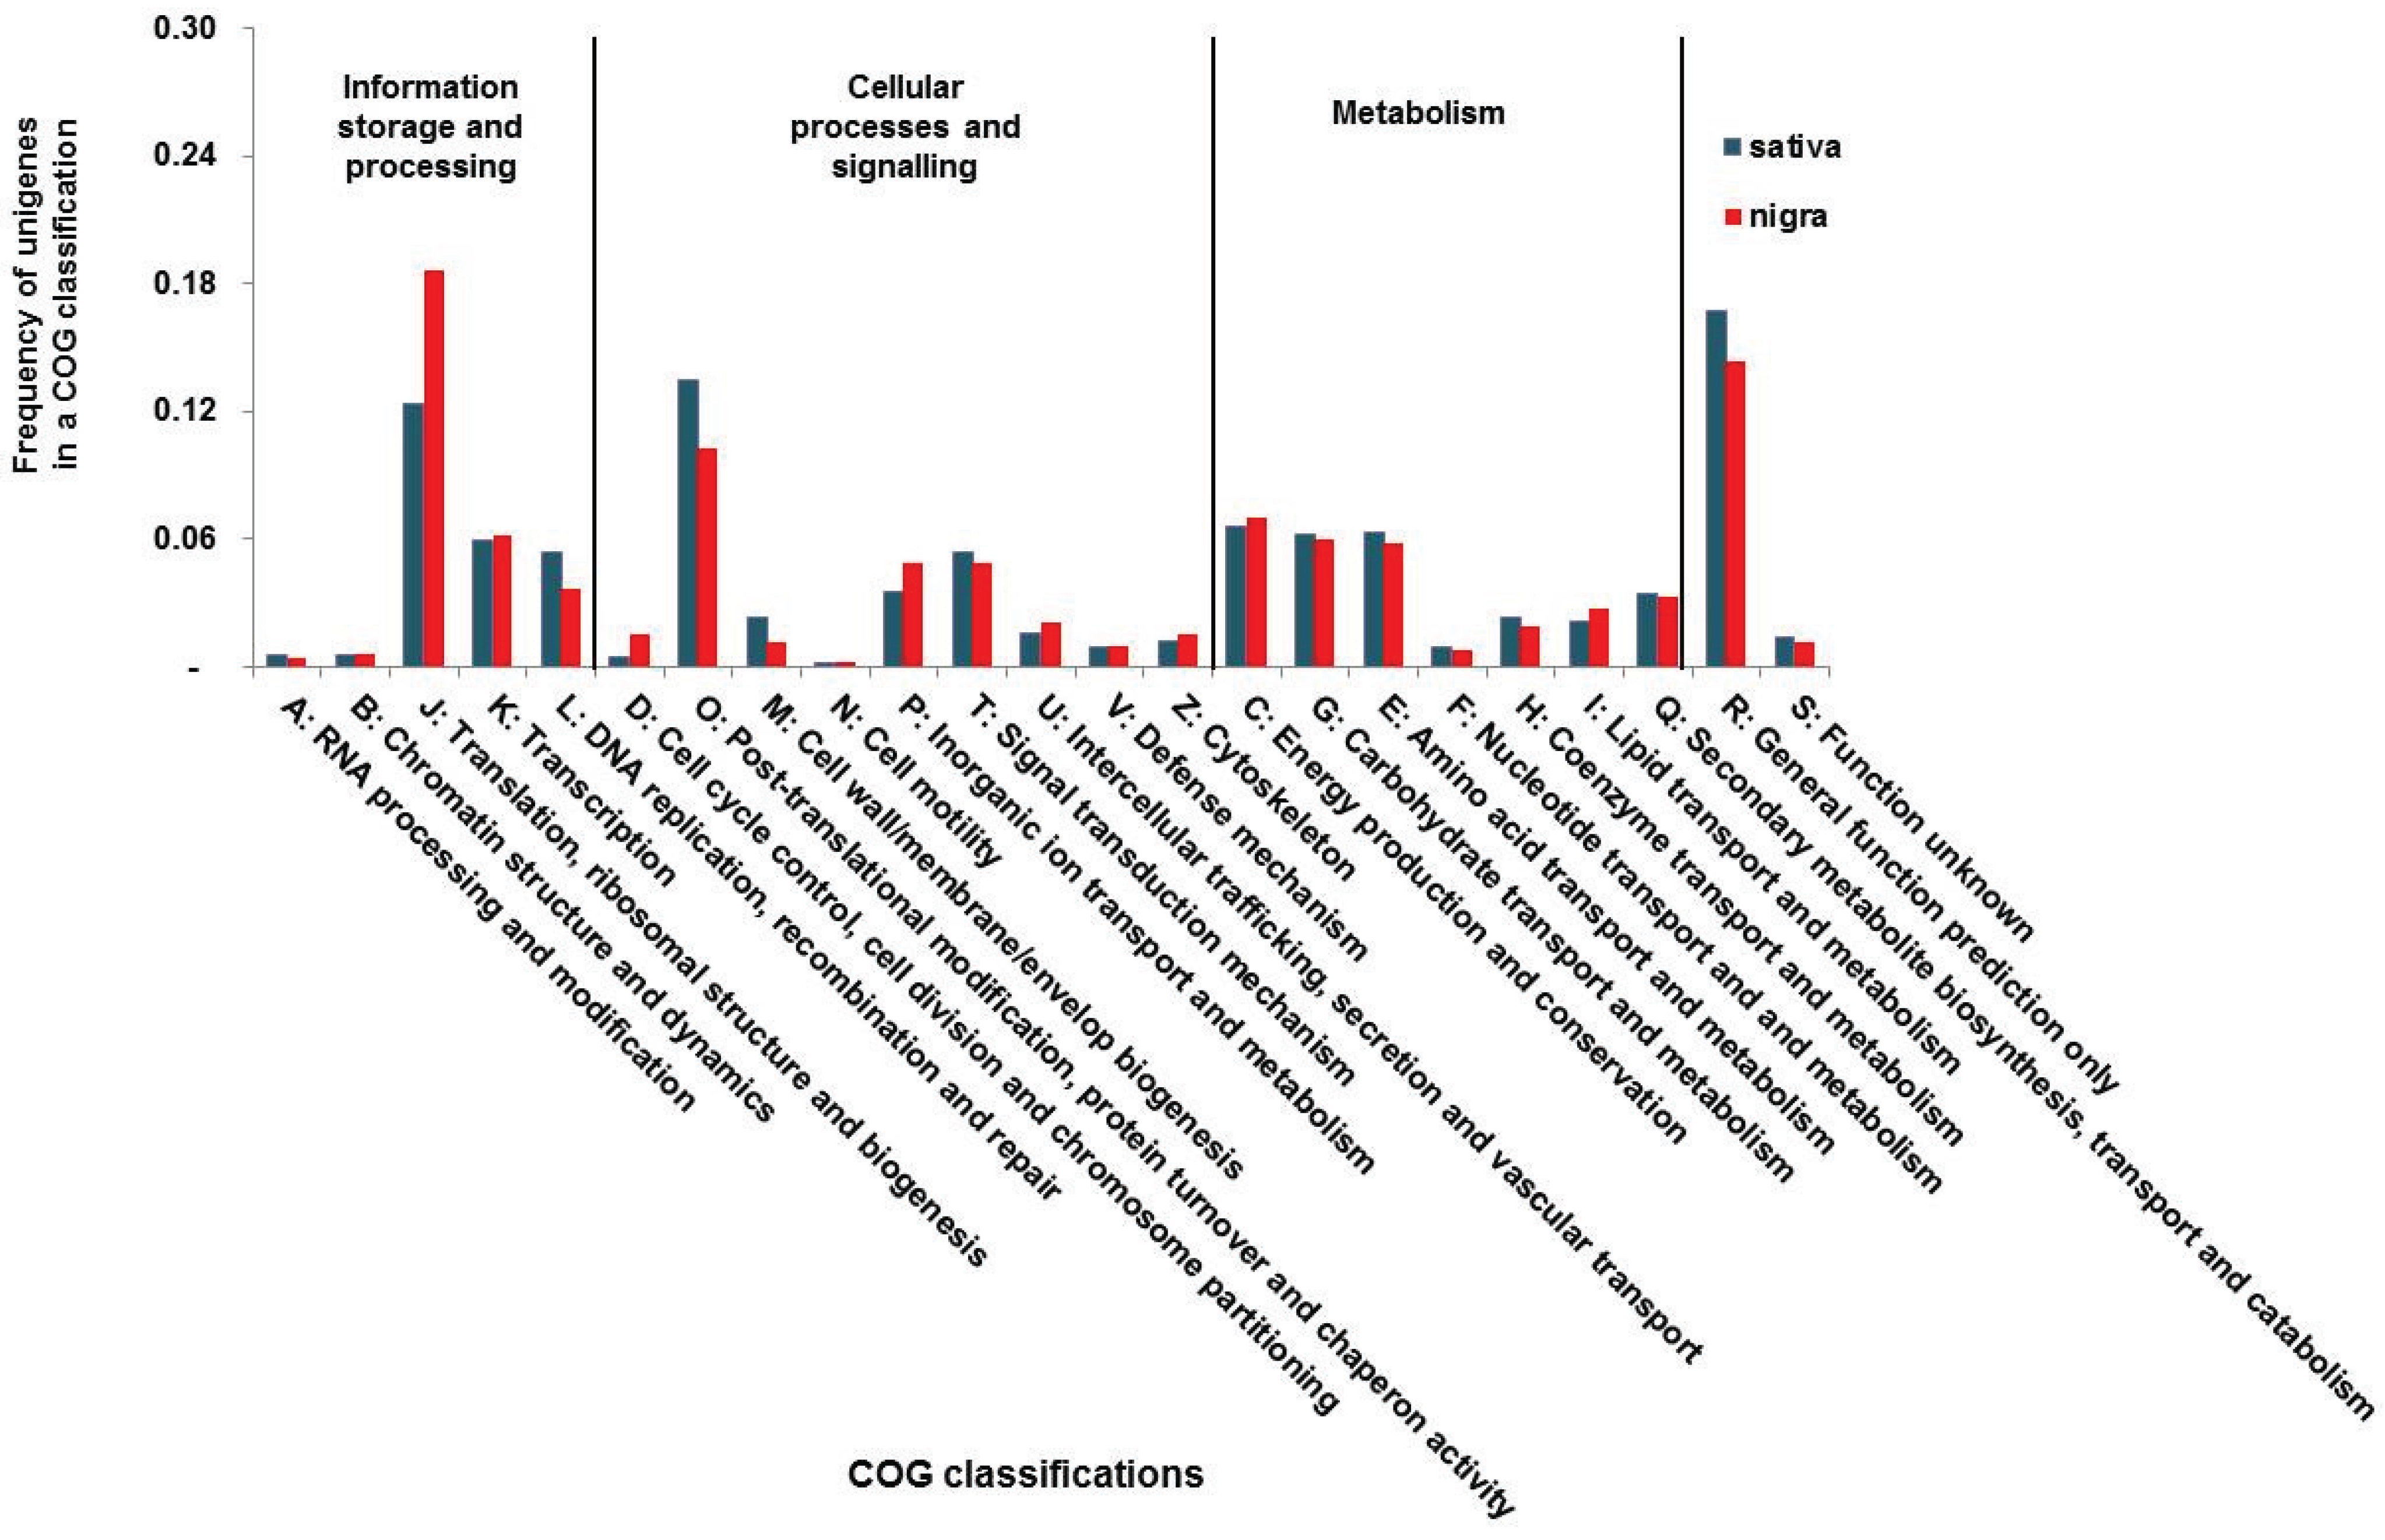
3.2. Functional Classification of the Vicia Transcriptomes
| Functional Category | GO Annotations | Sativa | Nigra | ||
|---|---|---|---|---|---|
| No. of Unigenes | Proportion a | No. of Unigenes | Proportion | ||
| Biological process | Unclassified | 2194 | 0.29 | 1050 | 0.29 |
| Metabolic process | 1433 | 0.19 | 749 | 0.19 | |
| Response to stimulus | 1055 | 0.14 | 703 | 0.18 | |
| Biological regulation | 597 | 0.08 | 235 | 0.06 | |
| Cellular process | 553 | 0.07 | 271 | 0.07 | |
| Developmental process | 503 | 0.07 | 188 | 0.05 | |
| Establishment of localization | 358 | 0.05 | 210 | 0.05 | |
| Cell component organization | 122 | 0.02 | 61 | 0.02 | |
| Others | 827 | 0.11 | 405 | 0.10 | |
| Cellular component | Cell part | 5357 | 0.60 | 3227 | 0.62 |
| Unclassified | 1797 | 0.20 | 902 | 0.17 | |
| Organelle | 1203 | 0.14 | 714 | 0.14 | |
| Organelle part | 278 | 0.03 | 161 | 0.03 | |
| Macromolecular complex | 189 | 0.02 | 128 | 0.02 | |
| Extracellular region | 73 | 0.01 | 61 | 0.01 | |
| Others | 10 | 0.00 | 46 | 0.01 | |
| Molecular function | Catalytic activity | 3775 | 0.42 | 1836 | 0.41 |
| Binding | 2757 | 0.30 | 1207 | 0.27 | |
| Unclassified | 1317 | 0.15 | 759 | 0.17 | |
| Transporter activity | 604 | 0.07 | 361 | 0.08 | |
| Transcription regulator activity | 239 | 0.03 | 70 | 0.02 | |
| Structural molecule activity | 146 | 0.02 | 111 | 0.02 | |
| Enzyme regulator activity | 98 | 0.01 | 34 | 0.01 | |
| Others | 148 | 0.02 | 114 | 0.03 | |

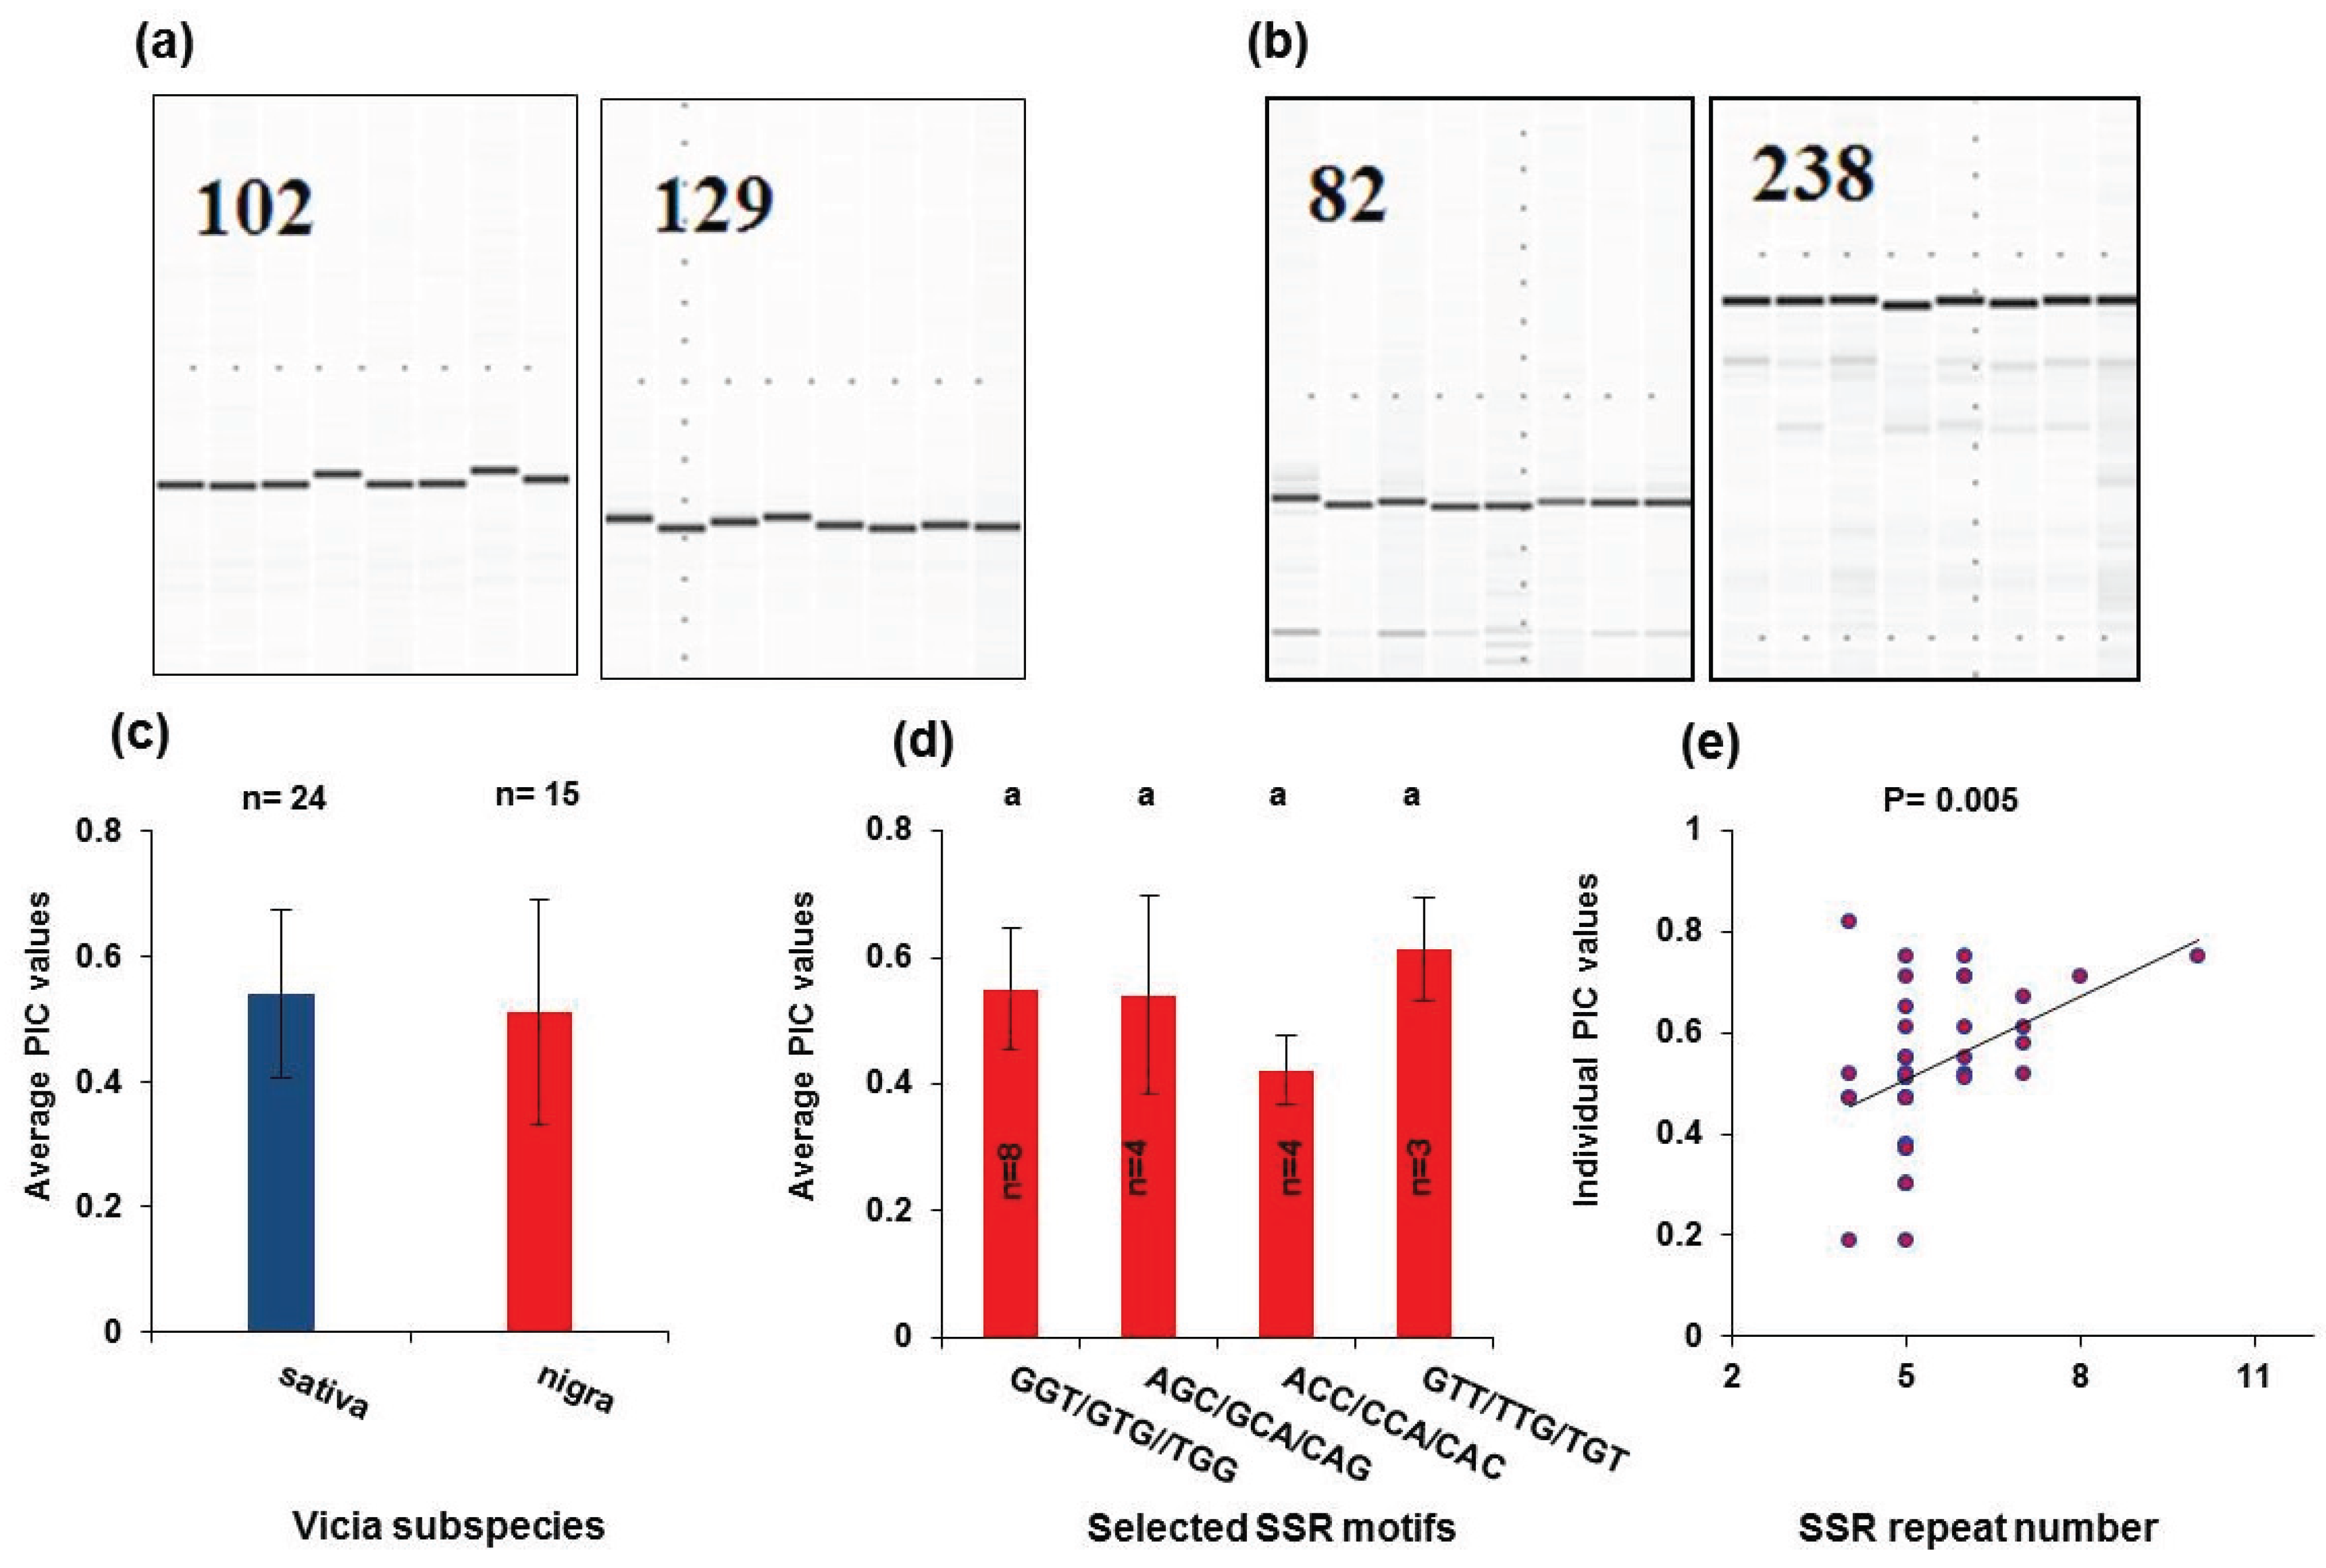
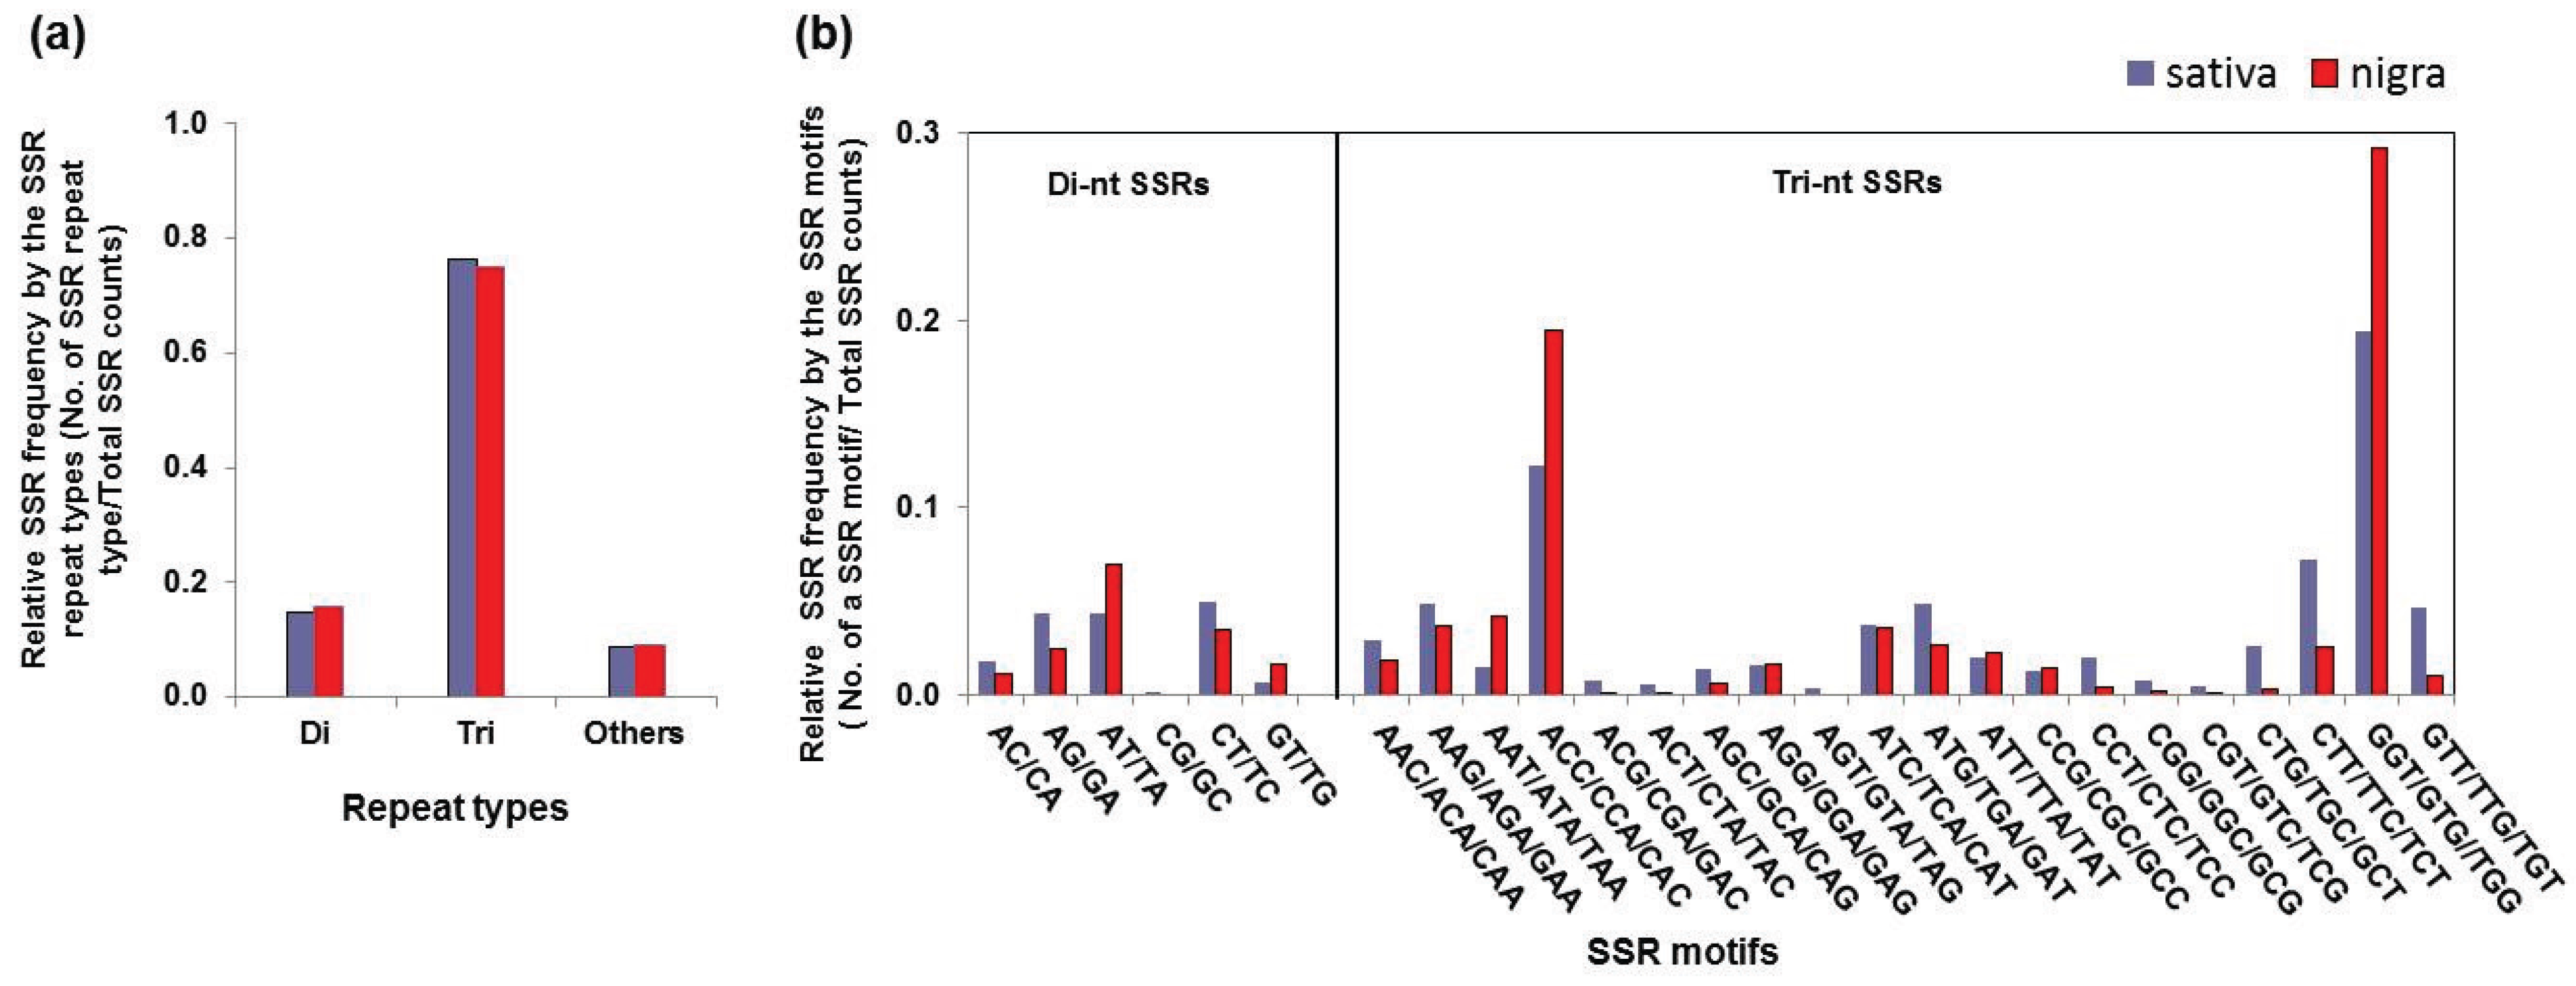
3.3. Simple Sequence Repeat Mining and Validation
| Repeat Type | SSR Motif | Sativa | Nigra | ||
|---|---|---|---|---|---|
| Count | Frequency a | Count | Frequency | ||
| Di-nucleotide | AC/CA | 85 | 1.8% | 27 | 1.1% |
| AG/GA | 205 | 4.4% | 58 | 2.4% | |
| AT/TA | 202 | 4.3% | 172 | 7.0% | |
| CG/GC | 4 | 0.1% | 0 | 0.0% | |
| CT/TC | 234 | 5.0% | 86 | 3.5% | |
| GT/TG | 31 | 0.7% | 39 | 1.7% | |
| Subtotal | 761 | 14.9% | 398 | 15.7% | |
| Tri-nucleotide | AAC/ACA/CAA | 137 | 2.9% | 46 | 1.8% |
| AAG/AGA/GAA | 228 | 4.9% | 92 | 3.6% | |
| AAT/ATA/TAA | 67 | 1.4% | 105 | 4.1% | |
| ACC/CCA/CAC | 573 | 12.2% | 492 | 19.4% | |
| ACG/CGA/GAC | 34 | 0.7% | 3 | 0.1% | |
| ACT/CTA/TAC | 26 | 0.6% | 2 | 0.1% | |
| AGC/GCA/CAG | 63 | 1.3% | 14 | 0.6% | |
| AGG/GGA/GAG | 76 | 1.6% | 40 | 1.6% | |
| AGT/GTA/TAG | 15 | 0.3% | 0 | 0.0% | |
| ATC/TCA/CAT | 173 | 3.7% | 91 | 3.6% | |
| ATG/TGA/GAT | 228 | 4.9% | 68 | 2.7% | |
| ATT/TTA/TAT | 94 | 2.0% | 57 | 2.3% | |
| CCG/CGC/GCC | 60 | 1.3% | 35 | 1.4% | |
| CCT/CTC/TCC | 95 | 2.0% | 9 | 0.4% | |
| CGG/GGC/GCG | 35 | 0.7% | 6 | 0.2% | |
| CGT/GTC/TCG | 22 | 0.5% | 1 | 0.0% | |
| CTG/TGC/GCT | 124 | 2.6% | 8 | 0.3% | |
| CTT/TTC/TCT | 338 | 7.2% | 64 | 2.5% | |
| GGT/GTG//TGG | 907 | 19.4% | 739 | 29.2% | |
| GTT/TTG/TGT | 220 | 4.7% | 26 | 1.0% | |
| Subtotal | 3515 | 76.3% | 1898 | 75.1% | |
| Other (Tetra/Penta/Hexa) | Subtotal | 405 | 8.7% | 235 | 9.3% |
| Total | 4681 | 2531 | |||

3.4. SNPs Discovery
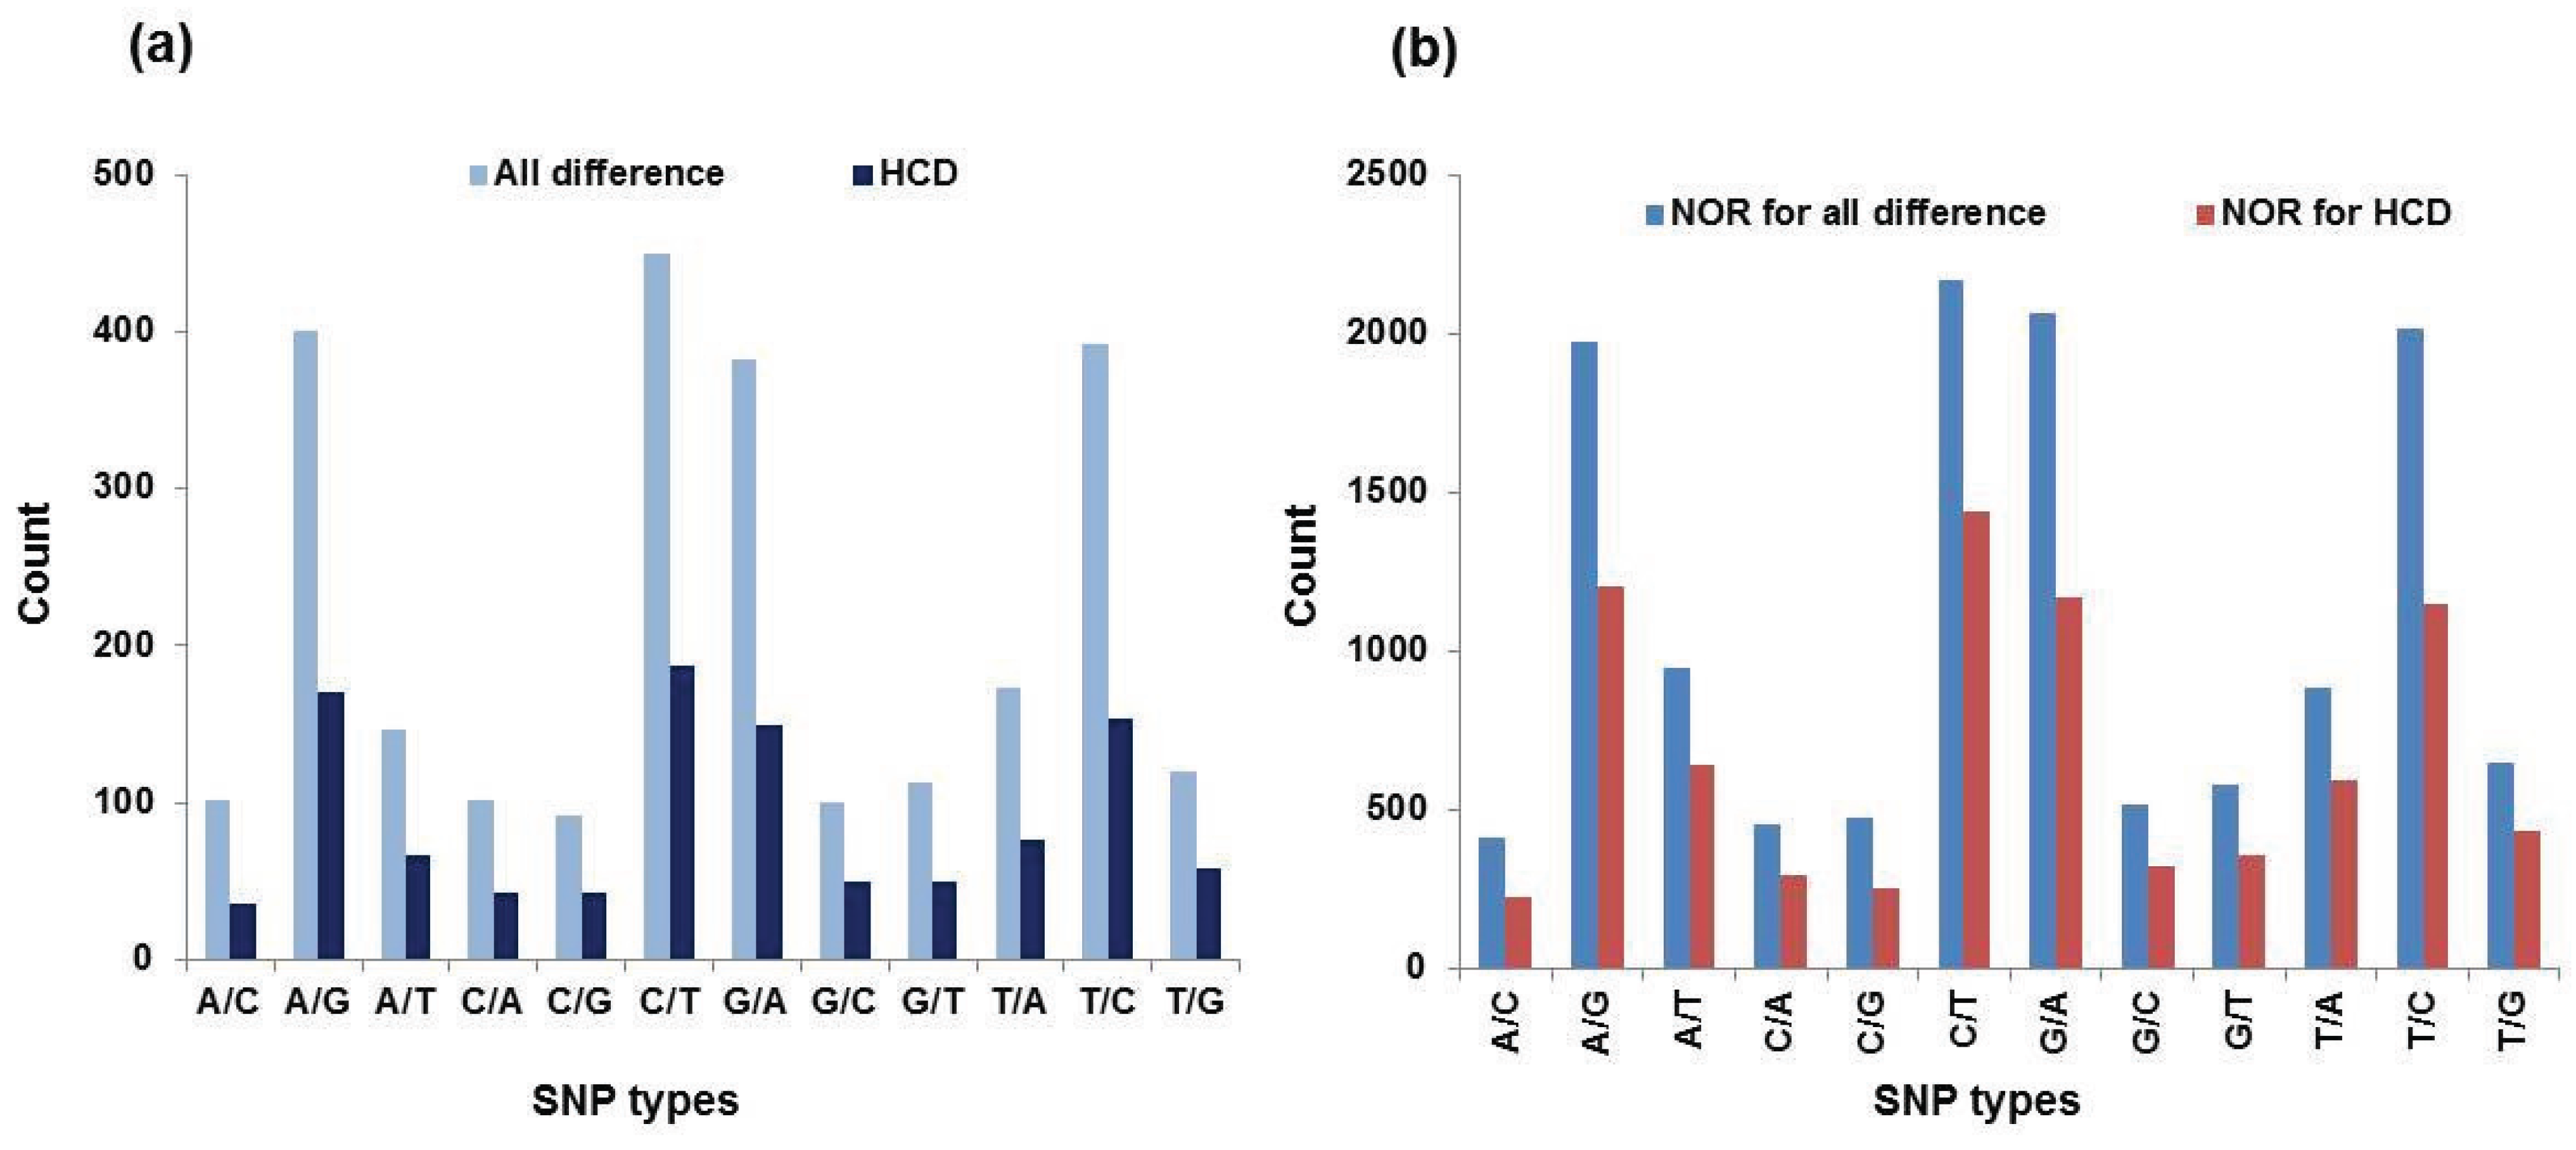
| SNP Types | All Differences | HCD a | NOR b for All Differences | NOR for HCD | ||||
|---|---|---|---|---|---|---|---|---|
| Number | Percentage c | Number | Percentage | Number | Percentage | Number | Percentage | |
| A/C | 102 | 0.04 | 35 | 0.03 | 413 | 0.03 | 224 | 0.03 |
| A/G | 400 | 0.16 | 170 | 0.16 | 1974 | 0.15 | 1206 | 0.15 |
| A/T | 147 | 0.06 | 66 | 0.06 | 949 | 0.07 | 645 | 0.08 |
| C/A | 101 | 0.04 | 43 | 0.04 | 456 | 0.03 | 298 | 0.04 |
| C/G | 92 | 0.04 | 42 | 0.04 | 477 | 0.04 | 258 | 0.03 |
| C/T | 449 | 0.17 | 187 | 0.17 | 2168 | 0.16 | 1441 | 0.18 |
| G/A | 382 | 0.15 | 149 | 0.14 | 2064 | 0.16 | 1170 | 0.14 |
| G/C | 100 | 0.04 | 50 | 0.05 | 518 | 0.04 | 327 | 0.04 |
| G/T | 113 | 0.04 | 50 | 0.05 | 577 | 0.04 | 359 | 0.04 |
| T/A | 173 | 0.07 | 76 | 0.07 | 887 | 0.07 | 592 | 0.07 |
| T/C | 392 | 0.15 | 154 | 0.14 | 2016 | 0.15 | 1146 | 0.14 |
| T/G | 120 | 0.05 | 58 | 0.05 | 648 | 0.05 | 438 | 0.05 |
| Total | 2571 | 1.01 | 1080 | 1.00 | 13,147 | 0.99 | 8104 | 0.99 |
4. Discussion
5. Conclusions
Supplementary Files
Supplementary File 1Acknowledgments
Author Contributions
Conflicts of Interest
References
- Young, N.D.; Bharti, A.K. Genome-enabled insights into legume biology. Annu. Rev. Plant Biol. 2012, 63, 283–305. [Google Scholar] [CrossRef] [PubMed]
- Graham, P.H.; Vance, C.P. Legumes: Importance and constraints to greater use. Plant Physiol. 2003, 131, 872–877. [Google Scholar] [CrossRef] [PubMed]
- Varshney, R.K.; Close, T.J.; Singh, N.K.; Hoisington, D.A.; Cook, D.R. Orphan legume crops enter the genomics era! Curr. Opin. Plant Biol. 2009, 12, 202–210. [Google Scholar] [CrossRef] [PubMed]
- Sullivan, P. Overview of Cover Crops and Green Manures. Available online: https://attra.ncat.org/attra-pub/summaries/summary.php?pub=288 (accessed on 23 December 2007).
- Giller, K.E.; Cadisch, G. Future benefits from biological nitrogen-fixation—An ecological approach to agriculture. Plant Soil 1995, 174, 255–277. [Google Scholar] [CrossRef]
- Heuze, V.; Tran, G.; Baumont, R. Common Vetch (Vicia sativa). Available online: http://www.Feedipedia.Org/node/239 (accessed on 20 September 2015).
- Tate, M.; Enneking, D. Common vetch (Vicia sativa ssp. Sativa): Feed or future food. Grain Legum. 2006, 47, 16–17. [Google Scholar]
- Ressler, C.; Tatake, J.G.; Kaizer, E.; Putnam, D.H. Neurotoxins in a vetch food: Stability to cooking and removal of γ-glutamyl-β-cyanoalanine and β-cyanoalanine and acute toxicity from common vetch (Vicia sativa L.) legumes. J. Agric. Food Chem. 1997, 45, 189–194. [Google Scholar] [CrossRef]
- Thavarajah, P.; Thavarajah, D.; Premakumara, G.A.S.; Vandenberg, A. Detection of common vetch (Vicia sativa L.) in lentil (Lens culinaris L.) using unique chemical fingerprint markers. Food Chem. 2012, 135, 2203–2206. [Google Scholar] [CrossRef] [PubMed]
- Uzun, A.; Gucer, S.; Acikgoz, E. Common vetch (Vicia sativa L.) germplasm: Correlations of crude protein and mineral content to seed traits. Plant Food Hum. Nutr. 2011, 66, 254–260. [Google Scholar] [CrossRef] [PubMed]
- Tate, M.; Rathjen, J.; Delaere, I.; Enneking, D. Covert trade in toxic vetch continues. Nature 1999. [Google Scholar] [CrossRef]
- Tate, M.E.; Enneking, D. A mess of red pottage. Nature 1992, 359, 357–358. [Google Scholar] [CrossRef] [PubMed]
- Firincioglu, H.K.; Erbektas, E.; Dogruyol, L.; Mutlu, Z.; Unal, S.; Karakurt, E. Phenotypic variation of autumn and spring-sown vetch (Vicia sativa ssp.) populations in central turkey. Span. J. Agric. Res. 2009, 7, 596–606. [Google Scholar] [CrossRef]
- Mutz, K.O.; Heilkenbrinker, A.; Lonne, M.; Walter, J.G.; Stahl, F. Transcriptome analysis using next-generation sequencing. Curr. Opin. Biotechnol. 2013, 24, 22–30. [Google Scholar] [CrossRef] [PubMed]
- Gohin, M.; Bobe, J.; Chesnel, F. Comparative transcriptomic analysis of follicle-enclosed oocyte maturational and developmental competence acquisition in two non-mammalian vertebrates. BMC Genet. 2010. [Google Scholar] [CrossRef] [PubMed] [Green Version]
- Mardis, E.R. Chip-seq: Welcome to the new frontier. Nat. Methods 2007, 4, 613–614. [Google Scholar] [CrossRef] [PubMed]
- Chung, J.W.; Kim, T.S.; Suresh, S.; Lee, S.Y.; Cho, G.T. Development of 65 novel polymorphic cDNA-SSR markers in common vetch (Vicia sativa subsp. Sativa) using next generation sequencing. Molecules 2013, 18, 8376–8392. [Google Scholar] [PubMed]
- Firincioglu, H.K.; Unal, S.; Erbektas, E.; Dogruyol, L. Relationships between seed yield and yield components in common vetch (Vicia sativa ssp. sativa) populations sown in spring and autumn in central turkey. Field Crop. Res. 2010, 116, 30–37. [Google Scholar]
- Margulies, M.; Egholm, M.; Altman, W.E.; Attiya, S.; Bader, J.S.; Bemben, L.A.; Berka, J.; Braverman, M.S.; Chen, Y.J.; Chen, Z.T.; et al. Genome sequencing in microfabricated high-density picolitre reactors. Nature 2005, 437, 376–380. [Google Scholar] [CrossRef] [PubMed]
- Ronaghi, M. Improved performance of pyrosequencing using single-stranded DNA-binding protein. Anal. Biochem. 2000, 286, 282–288. [Google Scholar] [CrossRef] [PubMed]
- Elahi, E.; Ronaghi, M. Pyrosequencing: A tool for DNA sequencing analysis. Methods Mol. Biol. 2004, 255, 211–219. [Google Scholar] [PubMed]
- Ronaghi, M. Pyrosequencing sheds light on DNA sequencing. Genome Res. 2001, 11, 3–11. [Google Scholar] [CrossRef] [PubMed]
- Berardini, T.Z.; Mundodi, S.; Reiser, L.; Huala, E.; Garcia-Hernandez, M.; Zhang, P.; Mueller, L.A.; Yoon, J.; Doyle, A.; Lander, G.; et al. Functional annotation of the arabidopsis genome using controlled vocabularies. Plant physiol. 2004, 135, 745–755. [Google Scholar] [CrossRef] [PubMed]
- The Arabidopsis Information Resource. Available online: http://www.arabidopsis.org (accessed on 3 October 2015).
- Cluster of Orthologous Groups for Phylogenetic Classification of Proteins Encoded in Complete Genomes. Available online: http://www.ncbi.nlm.nih.gov/COG/ (accessed on 3 October 2015).
- Kim, D. Developing One Step Program (SSR Manager) for Rapid Identification of Clones with SSRs and Primer Designing. M.Sc. Thesis, Seoul National University, Seoul, Korea, 2004. [Google Scholar]
- Kim, T.S.; Booth, J.G.; Gauch, H.G.; Sun, Q.; Park, J.; Lee, Y.H.; Lee, K. Simple sequence repeats in neurospora crassa: Distribution, polymorphism and evolutionary inference. BMC Genet. 2008. [Google Scholar] [CrossRef] [PubMed]
- Novaes, E.; Drost, D.R.; Farmerie, W.G.; Pappas, G.J.; Grattapaglia, D.; Sederoff, R.R.; Kirst, M. High-throughput gene and SNP discovery in eucalyptus grandis, an uncharacterized genome. BMC Genet. 2008. [Google Scholar] [CrossRef] [PubMed]
- Sequence Cleaner. Available online: http://sourceforge.net/projects/seqclean (accessed on 3 October 2015).
- Lucy DNA Sequence Quality and Vector Trimming Tool. Available online: http://lucy.sourceforge.net (accessed on 3 October 2015).
- Tanase, K.; Nishitani, C.; Hirakawa, H.; Isobe, S.; Tabata, S.; Ohmiya, A.; Onozaki, T. Transcriptome analysis of carnation (Dianthus caryophyllus L.) based on next-generation sequencing technology. BMC Genet. 2012. [Google Scholar] [CrossRef] [PubMed]
- Ellegren, H. Microsatellites: Simple sequences with complex evolution. Nat. Rev. Genet. 2004, 5, 435–445. [Google Scholar] [CrossRef] [PubMed]
- Selkoe, K.A.; Toonen, R.J. Microsatellites for ecologists: A practical guide to using and evaluating microsatellite markers. Ecology Lett. 2006, 9, 615–629. [Google Scholar] [CrossRef] [PubMed]
- Blanca, J.; Canizares, J.; Roig, C.; Ziarsolo, P.; Nuez, F.; Pico, B. Transcriptome characterization and high throughput SSRs and SNPs discovery in Cucurbita pepo (cucurbitaceae). BMC Genet. 2011. [Google Scholar] [CrossRef] [PubMed]
- Guo, S.G.; Zheng, Y.; Joung, J.G.; Liu, S.Q.; Zhang, Z.H.; Crasta, O.R.; Sobral, B.W.; Xu, Y.; Huang, S.W.; Fei, Z.J. Transcriptome sequencing and comparative analysis of cucumber flowers with different sex types. BMC Genet. 2010. [Google Scholar] [CrossRef] [PubMed]
- Luo, H.M.; Li, Y.; Sun, C.; Wu, Q.O.; Song, J.Y.; Sun, Y.Z.; Steinmetz, A.; Chen, S.L. Comparison of 454-ests from huperzia serrata and phlegmariurus carinatus reveals putative genes involved in lycopodium alkaloid biosynthesis and developmental regulation. BMC Plant Biol. 2010. [Google Scholar] [CrossRef] [PubMed]
- Newcomb, R.D.; Crowhurst, R.N.; Gleave, A.P.; Rikkerink, E.H.A.; Allan, A.C.; Beuning, L.L.; Bowen, J.H.; Gera, E.; Jamieson, K.R.; Janssen, B.J.; et al. Analyses of expressed sequence tags from apple. Plant Physiol. 2006, 141, 147–166. [Google Scholar] [CrossRef] [PubMed]
- Parchman, T.L.; Geist, K.S.; Grahnen, J.A.; Benkman, C.W.; Buerkle, C.A. Transcriptome sequencing in an ecologically important tree species: Assembly, annotation, and marker discovery. BMC Genet. 2010. [Google Scholar] [CrossRef] [PubMed]
- Kaur, S.; Cogan, N.O.I.; Pembleton, L.W.; Shinozuka, M.; Savin, K.W.; Materne, M.; Forster, J.W. Transcriptome sequencing of lentil based on second-generation technology permits large-scale unigene assembly and SSR marker discovery. BMC Genet. 2011. [Google Scholar] [CrossRef] [PubMed]
- Hiremath, P.J.; Farmer, A.; Cannon, S.B.; Woodward, J.; Kudapa, H.; Tuteja, R.; Kumar, A.; Bhanuprakash, A.; Mulaosmanovic, B.; Gujaria, N.; et al. Large-scale transcriptome analysis in chickpea (Cicer arietinum L.), an orphan legume crop of the semi-arid tropics of Asia and Africa. Plant biotechnol. J. 2011, 9, 922–931. [Google Scholar] [CrossRef] [PubMed] [Green Version]
- Zeng, S.; Xiao, G.; Guo, J.; Fei, Z.; Xu, Y.; Roe, B.A.; Wang, Y. Development of a EST dataset and characterization of EST-SSRs in a traditional chinese medicinal plant, epimedium sagittatum (Sieb. Et Zucc.) maxim. BMC Genet. 2010. [Google Scholar] [CrossRef] [PubMed]
- Lu, F.H.; Yoon, M.Y.; Cho, Y.I.; Chung, J.W.; Kim, K.T.; Cho, M.C.; Cheong, S.R.; Park, Y.J. Transcriptome analysis and SNP/SSR marker information of red pepper variety YCM334 and Taean. Sci. Hortic. Amst. 2011, 129, 38–45. [Google Scholar] [CrossRef]
- Gomes, D.F.; Batista, J.S.D.; Schiavon, A.L.; Andrade, D.S.; Hungria, M. Proteomic profiling of rhizobium tropici PRF 81: Identification of conserved and specific responses to heat stress. BMC Microbiol. 2012. [Google Scholar] [CrossRef] [PubMed]
- Metzgar, D.; Bytof, J.; Wills, C. Selection against frameshift mutations limits microsatellite expansion in coding DNA. Genome Res. 2000, 10, 72–80. [Google Scholar] [PubMed]
- Morgante, M.; Hanafey, M.; Powell, W. Microsatellites are preferentially associated with nonrepetitive DNA in plant genomes. Nat. Genet. 2002, 30, 194–200. [Google Scholar] [CrossRef] [PubMed]
- Liu, Z.; Liu, P.; Luo, D.; Liu, W.; Wang, Y. Exploiting illumina sequencing for the development of 95 novel polymorphic EST-SSR markers in common vetch (Vicia sativa subsp. Sativa). Molecules 2014, 19, 5777–5789. [Google Scholar] [CrossRef] [PubMed]
- Liu, M.Y.; Qiao, G.R.; Jiang, J.; Yang, H.Q.; Xie, L.H.; Xie, J.Z.; Zhuo, R.Y. Transcriptome sequencing and de novo analysis for MA bamboo (Dendrocalamus latiflorus munro) using the illumina platform. PLoS ONE 2012, 7, e46766. [Google Scholar] [CrossRef] [PubMed]
- Liu, Z.P.; Chen, T.L.; Ma, L.C.; Zhao, Z.G.; Zhao, P.X.; Nan, Z.B.; Wang, Y.R. Global transcriptome sequencing using the illumina platform and the development of EST-SSR markers in autotetraploid alfalfa. PLoS ONE 2013, 8, e83549. [Google Scholar] [CrossRef] [PubMed]
- Gaur, R.; Azam, S.; Jeena, G.; Khan, A.W.; Choudhary, S.; Jain, M.; Yadav, G.; Tyagi, A.K.; Chattopadhyay, D.; Bhatia, S. High-throughput snp discovery and genotyping for constructing a saturated linkage map of chickpea (Cicer arietinum L.). DNA Res. 2012, 19, 357–373. [Google Scholar] [CrossRef] [PubMed]
- Picoult-Newberg, L.; Ideker, T.E.; Pohl, M.G.; Taylor, S.L.; Donaldson, M.A.; Nickerson, D.A.; Boyce-Jacino, M. Mining SNPs from EST databases. Genome Res. 1999, 9, 167–174. [Google Scholar] [PubMed]
- McNally, K.L.; Childs, K.L.; Bohnert, R.; Davidson, R.M.; Zhao, K.; Ulat, V.J.; Zeller, G.; Clark, R.M.; Hoen, D.R.; Bureau, T.E.; et al. Genomewide SNP variation reveals relationships among landraces and modern varieties of rice. Proc. Natl. Acad. Sci. USA 2009, 106, 12273–12278. [Google Scholar] [CrossRef] [PubMed]
- Nelson, J.C.; Wang, S.; Wu, Y.; Li, X.; Antony, G.; White, F.F.; Yu, J. Single-nucleotide polymorphism discovery by high-throughput sequencing in sorghum. BMC Genet. 2011. [Google Scholar] [CrossRef] [PubMed]
- Barbazuk, W.B.; Emrich, S.J.; Chen, H.D.; Li, L.; Schnable, P.S. SNP discovery via 454 transcriptome sequencing. Plant J. 2007, 51, 910–918. [Google Scholar] [CrossRef] [PubMed]
- Vera, J.C.; Wheat, C.W.; Fescemyer, H.W.; Frilander, M.J.; Crawford, D.L.; Hanski, I.; Marden, J.H. Rapid transcriptome characterization for a nonmodel organism using 454 pyrosequencing. Mol. Ecol. 2008, 17, 1636–1647. [Google Scholar] [CrossRef] [PubMed]
- Meyer, E.; Aglyamova, G.V.; Wang, S.; Buchanan-Carter, J.; Abrego, D.; Colbourne, J.K.; Willis, B.L.; Matz, M.V. Sequencing and de novo analysis of a coral larval transcriptome using 454 GSFLx. BMC Genet. 2009. [Google Scholar] [CrossRef] [PubMed]
- Castric, P.A.; Farnden, K.J.; Conn, E.E. Cyanide metabolism in higher plants: V. The formation of asparagine from β-cyanoalanine. Arch. Biochem. Biophys. 1972, 152, 62–69. [Google Scholar] [CrossRef]
- Dunnill, P.M.; Fowden, L. Enzymatic formation of beta-cyanoalanine from cyanide by escherichia coli extracts. Nature 1965, 208, 1206–1207. [Google Scholar] [CrossRef] [PubMed]
- Ressler, C.; Giza, Y.H.; Nigam, S.N. Beta-cyanoalanine, product of cyanide fixation and intermediate in asparagine biosynthesis in certain species of lathyrus and vicia. J. Am. Chem. Soc. 1969, 91, 2766–2775. [Google Scholar] [CrossRef] [PubMed]
- Ressler, C.; Nigam, S.N.; Giza, Y.H. Toxic principle in vetch. Isolation and identification of γ-l-glutamyl-l-β-cyanoalanine from common vetch seeds. Distribution in some legumes. J. Am. Chem. Soc. 1969, 91, 2758–2765. [Google Scholar] [CrossRef] [PubMed]
© 2015 by the authors; licensee MDPI, Basel, Switzerland. This article is an open access article distributed under the terms and conditions of the Creative Commons Attribution license (http://creativecommons.org/licenses/by/4.0/).
Share and Cite
Kim, T.-S.; Raveendar, S.; Suresh, S.; Lee, G.-A.; Lee, J.-R.; Cho, J.-H.; Lee, S.-Y.; Ma, K.-H.; Cho, G.-T.; Chung, J.-W. Transcriptome Analysis of Two Vicia sativa Subspecies: Mining Molecular Markers to Enhance Genomic Resources for Vetch Improvement. Genes 2015, 6, 1164-1182. https://doi.org/10.3390/genes6041164
Kim T-S, Raveendar S, Suresh S, Lee G-A, Lee J-R, Cho J-H, Lee S-Y, Ma K-H, Cho G-T, Chung J-W. Transcriptome Analysis of Two Vicia sativa Subspecies: Mining Molecular Markers to Enhance Genomic Resources for Vetch Improvement. Genes. 2015; 6(4):1164-1182. https://doi.org/10.3390/genes6041164
Chicago/Turabian StyleKim, Tae-Sung, Sebastin Raveendar, Sundan Suresh, Gi-An Lee, Jung-Ro Lee, Joon-Hyeong Cho, Sok-Young Lee, Kyung-Ho Ma, Gyu-Taek Cho, and Jong-Wook Chung. 2015. "Transcriptome Analysis of Two Vicia sativa Subspecies: Mining Molecular Markers to Enhance Genomic Resources for Vetch Improvement" Genes 6, no. 4: 1164-1182. https://doi.org/10.3390/genes6041164