Article

Polyaspartic Acid Improves Maize (Zea mays L.) Seedling Nitrogen Assimilation Mainly by Enhancing Nitrate Reductase Activity

Key Laboratory of Crop Ecophysiology and Cultivation, Center for Crop Management & Farming System, Institute of Crop Sciences, Chinese Academy of Agricultural Sciences, Beijing 100081, China
*
Author to whom correspondence should be addressed.
Agronomy 2018, 8(9), 188; https://doi.org/10.3390/agronomy8090188
Submission received: 7 August 2018 / Revised: 6 September 2018 / Accepted: 11 September 2018 / Published: 13 September 2018
(This article belongs to the Special Issue Environmental and Management Factor Contributions to Maize Yield)

Abstract

:
Improvement of nitrogen use efficiency is of great importance in maize (Zea mays L.) production. In the present study, an eco-friendly growth substance, polyaspartic acid (PASP), was applied to maize seedlings grown with different nitrate (NO3) doses by foliar spraying, aimed at evaluating its effects on maize nitrogen assimilation at both the physiological and molecular level. The results showed that PASP promoted biomass and nitrogen accumulation in maize seedlings, especially under low NO3 doses. Among different NO3 conditions, the most noticeable increase in plant biomass by PASP addition was observed in seedlings grown with 1 mmol L−1 NO3, which was a little less than the optimum concentration (2 mmol L−1) for plant growth. Furthermore, the total nitrogen accumulation increased greatly with additions of PASP to plants grown under suboptimal NO3 conditions. The promotion of nitrogen assimilation was mostly due to the increase of nitrate reductase (NR) activities. The NR activities in seedlings grown under low NO3 doses (0.5 and 1.0 mmol L−1) were extremely increased by PASP, while the activities of glutamine synthetase (GS), aspartate aminotransferase (AspAT), and alanine aminotransferase (AlaAT) were slightly changed. Moreover, the regulation of PASP on NR activity was most probably due to the promotion of the protein accumulation rather than gene expression. Accumulation of NR protein was similarly affected as NR activity, which was markedly increased by PASP treatment. In conclusion, the present study provides insights into the promotion by PASP of nitrogen assimilation and identifies candidate regulatory enzymatic mechanisms, which warrant further investigation with the use of PASP in promoting nitrogen utilization in crops.

1. Introduction

Nitrogen is one of the most important nutrients that strikingly affects plant growth, development, and production. China is one of the world’s largest nitrogen fertilizer producers and consumers, accounting for about 61% of the worldwide increase in nitrogen fertilizer production and 52% of the increase in nitrogen fertilizer consumption that occurred between 1990 and 2009 [1,2,3]. The excessive use of nitrogen fertilizer has contributed to serious damage to the environment, including soil acidification [4] as well as water and air pollution [5,6]. Therefore, there is an urgent need to find strategies to improve the nitrogen use efficiency of field crops, especially crops that are widely cultivated, such as maize (Zea mays L.), to simultaneously ensure food security and environmental quality.
Despite the importance of improving nitrogen use efficiency in maize, a number of previous studies had focused on various agronomic strategies to optimize nitrogen application and its biological mechanisms, such as the tillage type, rate and timing of nitrogen fertilizer application, and better sources of nitrogen fertilizer [7,8]. For maize, on the one hand, cultivars with high nitrogen use efficiency have been proven to be a great option for increasing grain yield under low nitrogen conditions while also maintaining the health of the environment [9]; on the other hand, the development of highly efficient nitrogen fertilizers is another effective way to resolve these problems [10]. Controlled-release urea has been demonstrated to significantly improve not only grain yields but also the nitrogen use efficiency of maize [11]. Recently, an eco-friendly polymer, polyaspartic acid (PASP), has been studied as a superabsorbent material and a promoter of fertilizer absorption [12,13,14] due to its free carboxylic and amide groups [15]. Polyaspartic acid is a hydrophilic, nontoxic, and biodegradable polymer of aspartic acid, with good dispersibility, chelating ability, and adsorption capacity [16]. Polyaspartic acid is found naturally in snails and mollusks, but for industrial production, it is commonly obtained through mild alkaline hydrolysis of polysuccinimide with high yield and low cost [17]. Considerable attention has been received for PASP in the medicine, cosmetic, and food industries [18]. In agriculture, PASP is usually used as a fertilizer absorption promoter and has been studied in nitrogen and potassium utilization [19]. Fertilizers containing PASP, especially PASP urea, have been gradually developed and applied in crop production. However, in previous studies, PASP was usually supplied together with a fertilizer or nutrient solution. Therefore, its promotion of fertilizer absorption was most probably due to its strong absorbency for ions, which reduces nutrient loss and improves the nutrient level of the soil [10,11,12]. However, information about the direct effects of PASP on plant growth and nitrogen assimilation, especially its physiological and molecular mechanism, remains limited. Thus, PASP was applied by foliar spraying to avoid the interaction of PASP and soil-based nutrients and to investigate the direct influence of PASP on maize growth and nitrogen assimilation, especially at enzymatic levels, and the genetic basis of the key enzyme involved.
Nitrate (NO3) is the predominant form of nitrogen nutrition in most agricultural systems [20]. The pathway for nitrate assimilation in crops has been well documented [21]. Briefly, after uptake by roots, NO3 is first reduced by nitrate reductase (NR) to NO2 [22] and further reduced by nitrite reductase (NiR) to NH4+ [23]. Then, the NH4+ is assimilated into glutamine and glutamate by glutamine synthetase (GS) and glutamate synthase (GOGAT) [24,25,26,27]. The amino group of glutamate can be further transferred into other amino acids by various amino transferases, such as alanine aminotransferase (AlaAT) and aspartate aminotransferase (AspAT) [28,29,30,31]. Among these enzymes, NR is a primary rate-limiting enzyme for nitrogen assimilation [32,33]. Glutamine synthetase (GS, EC 6.3.1.2) is a key enzyme in nitrogen assimilation and remobilization [34]. AspAT and AlaAT can serve as markers of nitrogen use efficiency [35].
In this study, a commercial variety of maize, Zhengdan 958, was used, which is widely cultivated in China. The seedlings were cultivated under different doses of NO3 and were treated with PASP by foliar spraying. The objectives of the present study were to: (1) determine the effect of PASP on seedling biomass production and nitrogen assimilation in maize; (2) analyze the enzymatic mechanism of PASP regulation on maize nitrogen assimilation; and (3) investigate the genetic basis of the key enzyme involved in the regulation of PASP on nitrogen assimilation. Our study may provide information on the theoretical and practical bases for optimizing the use of PASP in promoting nitrogen utilization and plant growth in maize.

2. Materials and Methods

2.1. Plant Material and Growth Conditions

A commercial variety of maize (Zea mays L., cv. Zhengdan 958) was used in the experiments. The seeds were sterilized with 10% (v/v) H2O2 for 15 min, washed with distilled water, and germinated for 2 days in the dark on a moist filter paper at 30 °C. Then, the germinated seeds were transferred to silica sand to grow. Uniform seedlings with two visible leaves were selected and transferred to vessels containing 1/2 modified Hoagland solution with the following nutrients: 2 mmol L−1 of KNO3, 1 mmol L−1 of CaCl2, 0.5 mmol L−1 of MgSO4, 0.1 mmol L−1 of KH2PO4, 0.1 mmol L−1 of EDTA-FeNa, 0.03 mmol L−1 of H3BO3, 0.0008 mmol L−1 of CuSO4·5H2O, 0.005 mmol L−1 of MnSO4·H2O, 0.00003 mmol L−1 of (NH4)6Mo7O24·4H2O, and 0.0025 mmol L−1 of ZnSO4·7H2O. The pH of the solution was adjusted to 6.0. The nutrient solution was continuously aerated using an electric pump and renewed every 4 days. Each pot (7 L) contained 30 plants. When the second leaves were fully expanded, the seedlings were transferred to vessels (7 L) containing full-strength modified Hoagland solution with different concentrations of NO3 (0, 0.5, 1.0, 2.0, and 4.0 mmol L−1, referred to as N0, N0.5, N1, N2, and N4, respectively). The concentrations of NO3, K+, and Ca2+ were balanced by varying the supply of KNO3, Ca(NO3)2, KCl, and CaCl2. The vessels were placed in a growth chamber controlled at 28 °C with a 16-h/8-h light/dark cycle. A photosynthetic photon flux density of 400 µmol m−2 s−1 was provided during the 16-h light period. The relative humidity was approximately 65%.
Two days after treatment with different concentrations of NO3, PASP was applied to the plant of each treatment (PASP treatment to seedlings grown under N0, N0.5, N1, N2, and N4 conditions referred to as N0P, N0.5P, N1P, N2P, and N4P, respectively) by foliar spraying, and an equal amount of water was applied to the control treatment. Polyaspartic acid was prepared from polysuccinimide (AR, obtained from Desai Chemical Engineering Company, Shijiazhuang, China) with a molecular mass of 3000–5000 Da. Polysuccinimide (53.19 g) was dissolved in 100 mL of H2O with 40.96 g of KOH to make the PASP solution [36]. Citric acid was added to adjust the solution pH to 8.0. Then, 0.2 mL of the above PASP solution was added to 1 L of water containing 0.1% (v/v) Tween-20 as a surfactant to make the final PASP concentration (approximately 73.55 mg of polysuccinimide L−1). A compression sprayer (capacity, 1 L) was used for this purpose to ensure the even distribution of PASP on all leaves. Spraying was performed in the morning (between 9:00 and 10:00 a.m.). The PASP solution was sprayed on the shoot until complete leaf wetting (approximately 3 mL of solution per plant). The experiment was performed four times.

2.2. Measurement of Biomass and Nitrogen Accumulation

Seven days after PASP treatment, 15 plants per treatment were separated into two parts (aboveground and underground) and oven-dried at 80 °C until a constant weight was reached to measure the respective dry weights. Then, the dry samples were ground and used for total nitrogen accumulation determination using the Kjeldahl method.

2.3. Measurement of Nitrate Reductase (NR, EC 1.6.6.1) Activity

The method was adapted from the in vivo NR assay of Majláth et al. [37]. Briefly, approximately 200 mg fresh weight of samples (the latest fully expanded leaf and roots, respectively) were cut into small sections and incubated in 1 mL of 100 mmol L−1 of Na-phosphate buffer (pH 7.5) containing 200 mmol L−1 of KNO3 at 37 °C in the dark for 1 h. Next, 0.4 mL of 30% (m/v) trichloroacetic acid was added to stop the conversion of NO3 to NO2. Then, nitrite production was detected calorimetrically by adding 2 mL of 0.2% 1-naphthylamine and 2 mL of 1% sulphanilamide (dissolved in 30% acetic acid) to the reaction mixture. After 30 min, the optical density of solutions was measured at 540 nm. The incubation buffer was used as a blank. NR activity was calculated in µmol nitrite produced per gram of fresh tissue using a standard curve, based on known nitrite dilutions. The experiment was conducted at 9:00 a.m. on the 1st, 3rd, and 7th day after PASP treatment.

2.4. Measurement of Glutamine Synthetase (GS, EC 6.3.1.2) Activity

Approximately 200 mg fresh weight of samples (the latest fully expanded leaf and roots, respectively) were homogenized at 4 °C with 2 mL of extraction buffer (0.5 mol L−1 of Tris-HCl, 2 mmol L−1 of MgCl2, 2 mmol L−1 of DTT, and 0.4 mol L−1 of sucrose; pH 8.0). Then, the homogenates were centrifuged at 12,000× g at 4 °C for 15 min, and the supernatant was recovered. GS activity was determined in the supernatant by transferase assay [38].

2.5. Measurement of Alanine Aminotransferase (AlaAT EC 2.6.1.2) and Aspartate Aminotransferase (AspAT EC 2.6.1.1) Activity

AlaAT and AspAT activity were assayed in conditions adapted from the study conducted by Gibon et al. [39]. Approximately 200 mg fresh weight of samples (the latest fully expanded leaf and roots, respectively) were homogenized at 4 °C with 2 mL of extraction buffer (0.05 mol L−1 of Tris-HCl) and centrifuged at 12,000 × g, 4 °C for 15 min. Then, the supernatant was recovered for enzyme activity assays. AlaAT activity was assayed using a solution containing 0.1 mol L−1 of Na-phosphate buffer (pH 7.2), 0.2 mol L−1 of l-alanine, and 2 mmol L−1 of α-ketoglutarate. Plant sample protein extract (75 µL) was added to the 125-µL assay solution and incubated at 37 °C for 30 min. The reaction was stopped by adding 125 µL of 2,4-dinitrophenylhydrazine. Pyruvic acid production was detected calorimetrically by adding 1.25 mL of 0.4 mol L−1 of NaOH to the reaction mixture at 5 min after the addition of 2,4-dinitrophenylhydrazine. After 30 min, the optical density of solutions was measured at 500 nm. The incubation buffer was used as a blank. Pyruvic acid standards (0–0.4 µmol in extraction buffer) were run in parallel. The activities were expressed as µmol pyruvic acid produced per gram of fresh tissue.
AspAT activity was determined using an assay solution containing 0.1 mol L−1 of Na-phosphate buffer (pH 7.2), 0.2 mol L−1 of aspartic acid, and 2 mmol L−1 of α-ketoglutarate. Otherwise, the enzyme activity assays and activity calculations were the same as that for AlaAT.

2.6. Real-Time Quantitative PCR (qPCR)

Fresh samples of 15 seedlings from individual treatments were collected in liquid nitrogen for the isolation of RNA. Total RNA was extracted using a total Plant RNA kit (Gene Mark, Taiwan). Reverse transcription was performed with 1–2 μg of purified total RNA using TaqMan® Reverse Transcription Reagents (Invitrogen™, Carlsbad, CA, USA) according to the manufacturer’s protocol. The qPCR was performed by a 7500 Real-Time PCR system (Applied Biosystems, Foster City, CA, USA) using a PowerUp™ SYBR® Green Master Mix (Applied Biosystems™, Foster City, CA, USA). The following protocol was applied in the qRT-PCR reaction: denaturation at 95 °C for 10 min, followed by 41 cycles of denaturation at 95 °C for 15 s, and annealing extension at 60 °C for 1 min. The relative gene expression levels were calculated using the 2−ΔΔCt method [40], with actin as an internal control, and three repetitions were performed for each sample. The sequences of the gene primers are shown in Table 1.

2.7. Nitrate Reductease Protein Extraction and Quantification by Enzyme-Linked Immunosorbent Assay (ELISA)

Fresh samples of 15 seedlings from individual treatments were collected in liquid nitrogen for the isolation of NR protein. The samples were collected at 9:00 a.m. on the 1st, 3rd, and 7th day after PASP treatment. NR protein extraction and quantification was performed using a Plant Nitrate reductase (NR) ELISA Kit and was carried out by Beijing Fangcheng Jiahong Science and Technology Co. (Beijing, China).

2.8. Statistical Analysis of Data

Data were analyzed by one-way ANOVA using SPSS 17.0 software (SPSS Inc., Chicago, IL, USA, 2002). The treatment means were separated using Duncan’s Multiple Range Test or Student’s test. Statistical comparisons were considered significant at p < 0.05.

3. Results

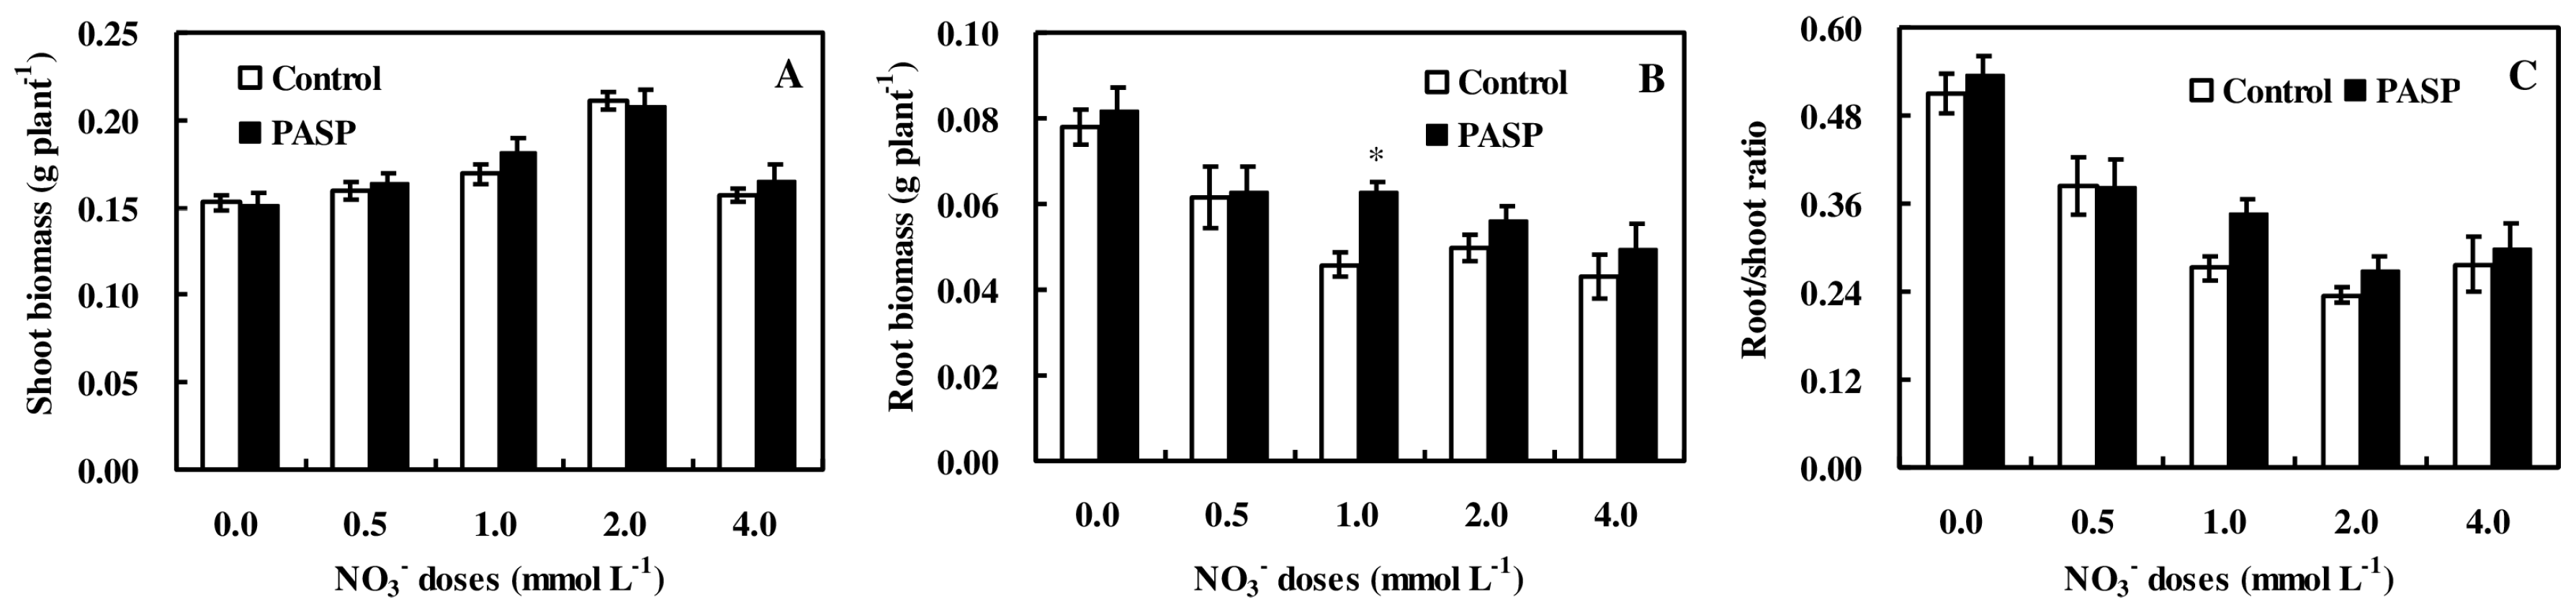
3.1. Changes in Plant Biomass Accumulation in Maize Seedlings

Biomass accumulation in maize seedlings differed due to different NO3 doses. As shown in Figure 1A, the shoot biomass had a bell-shaped curve pattern, which peaked at 2 mmol L−1 of NO3, while the root biomass was significantly (p < 0.05) reduced with the increase in NO3 doses (Figure 1B). Consequently, the root/shoot ratio shrunk along with the increase in NO3 dose (Figure 1C). Furthermore, the response of the total biomass accumulation per plant to NO3 dose was the same with the shoot biomass accumulation, which indicated 2 mmol L−1 of NO3 as the optimum concentration for plant biomass production.
The PASP treatment mainly improved biomass accumulation, especially in seedlings supplied with 1 mmol L−1 of NO3 (Figure 1A). The root biomass in N1P was significantly (p < 0.05) increased by 37.8% from applications of PASP to plants receiving the N1 treatment, while no significant (p < 0.05) differences were observed from PASP applications with the rest of the nitrogen levels (0, 0.5, 2.0, and 4.0 mmol L−1). The increase of the shoot biomass from PASP applications was slight, and no significant (p < 0.05) difference was observed (Figure 1A). However, the total biomass per plant grown in N1P was significantly (p < 0.05) higher than those grown in N1 by 13.9%, which was consistent with the response of the root biomass (Figure 1B). The root/shoot ratio was mildly boosted by PASP, especially in the N1P treatment, which was 28.5% greater than plants grown in N1 (Figure 1C). These results suggest that the effect of PASP in seedlings supplied with 1 mmol L−1 of NO3 was most significant among different nitrogen doses, and the improvement by PASP on root biomass was greater than that on shoots.

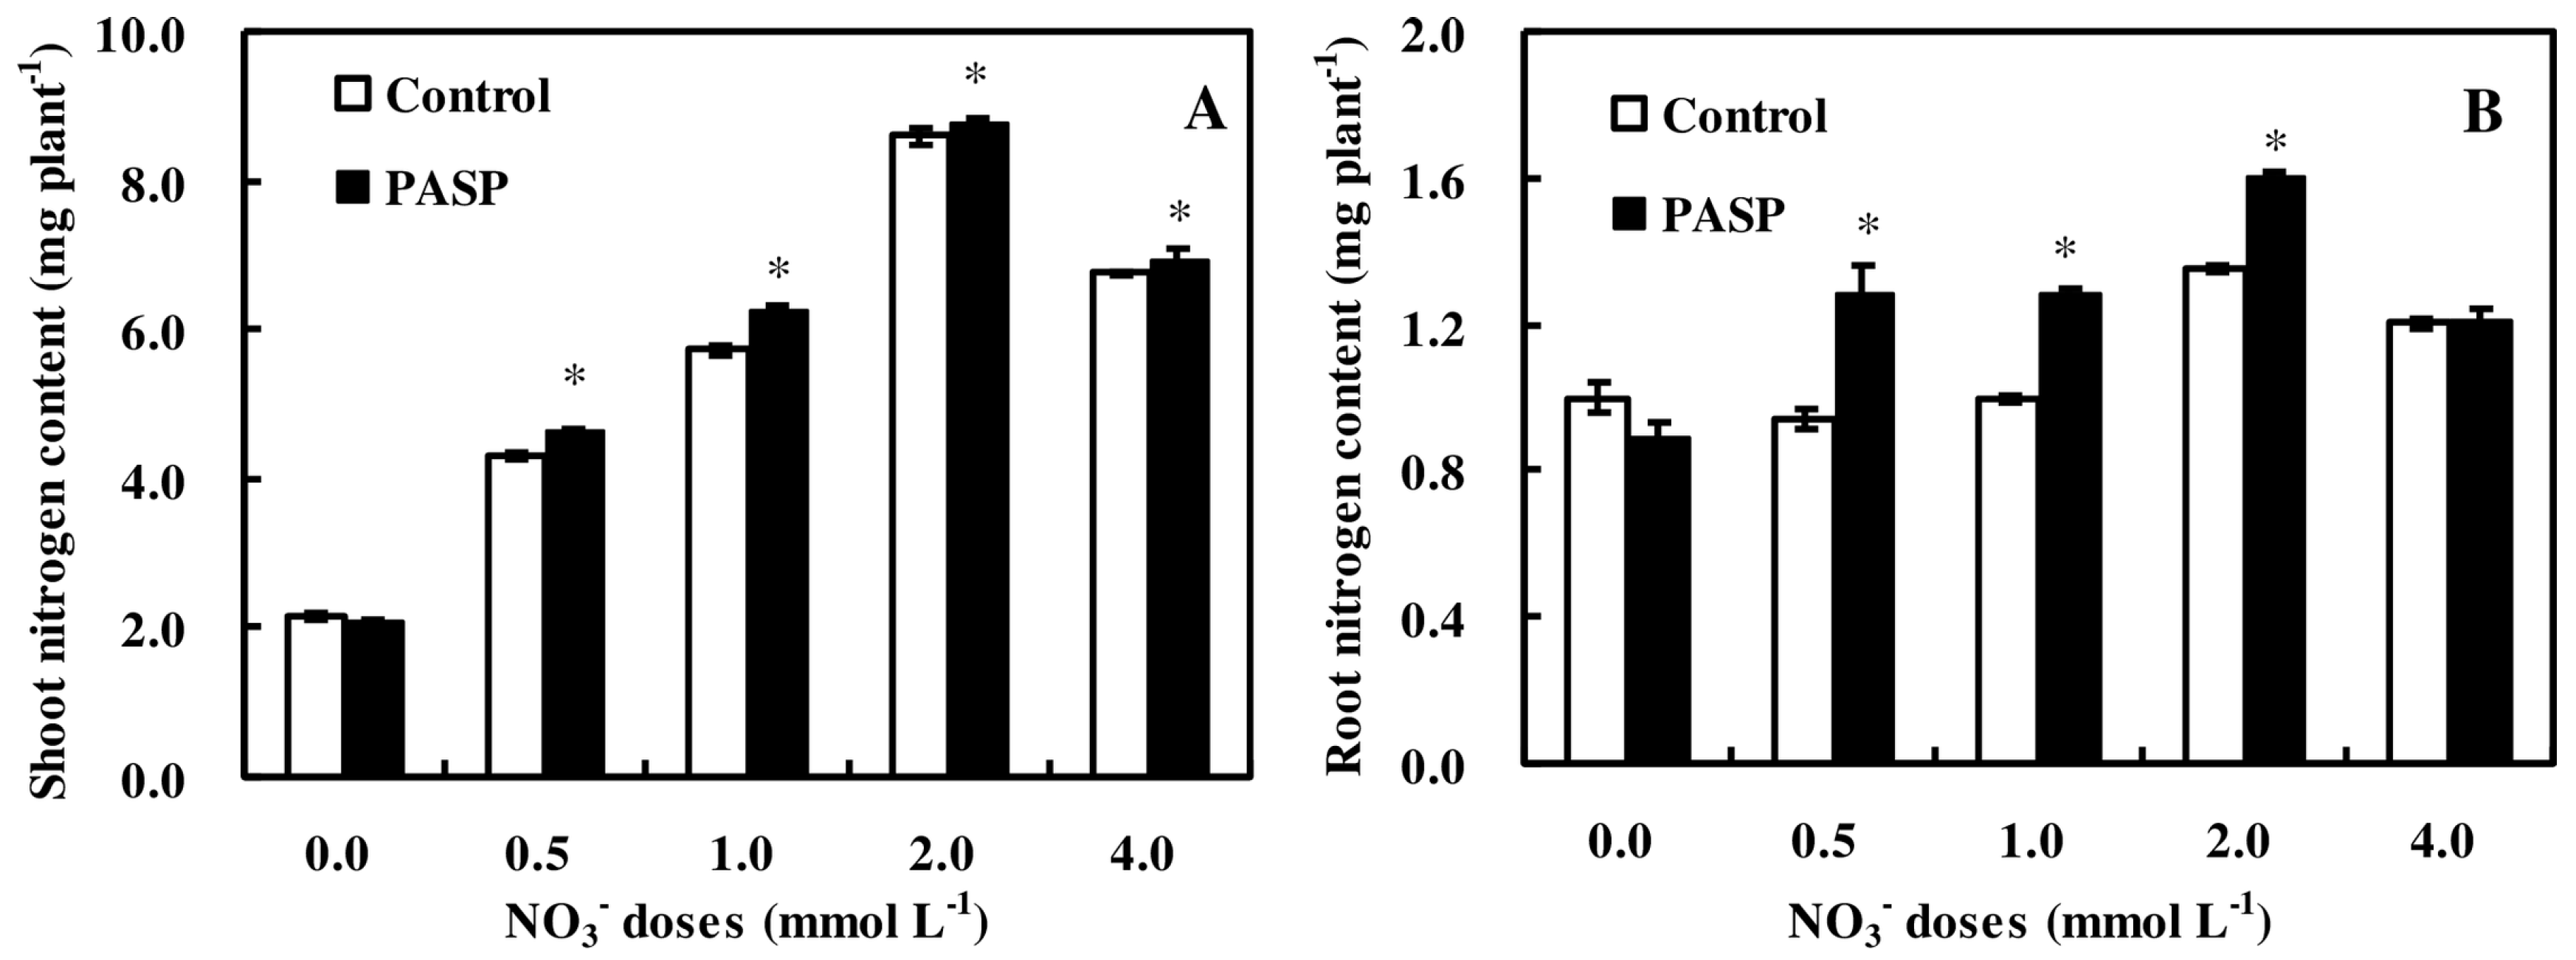
3.2. Changes in Nitrogen Accumulation in Maize Seedlings

Nitrogen and PASP treatments markedly affected the total nitrogen accumulation in seedlings (Figure 2). Similar to shoot biomass accumulation, nitrogen content in both the roots and shoots had a bell-shaped curve pattern, which peaked with 2 mmol L−1 of NO3 supply. Additions of PASP mostly improved the nitrogen content in both the shoots (Figure 2A) and roots (Figure 2B). Among the different NO3 doses, the increase of plant nitrogen content by PASP in conjunction with the N0.5P and N1P treatments were the most remarkable. N0.5P and N1P had 13.2% and 12.6% greater total nitrogen content in the whole plant when compared to N0.5 and N1, respectively. This increase was followed by the N2P treatment, in which the total nitrogen accumulation per plant increased by 4.8% when compared to N2. For seedlings with a high NO3 dose (4 mmol L−1), only the shoot nitrogen content was increased by PASP application (Figure 2A). Overall, these findings indicate that PASP positively affects nitrogen assimilation in maize, especially in seedlings grown under low nitrogen levels.

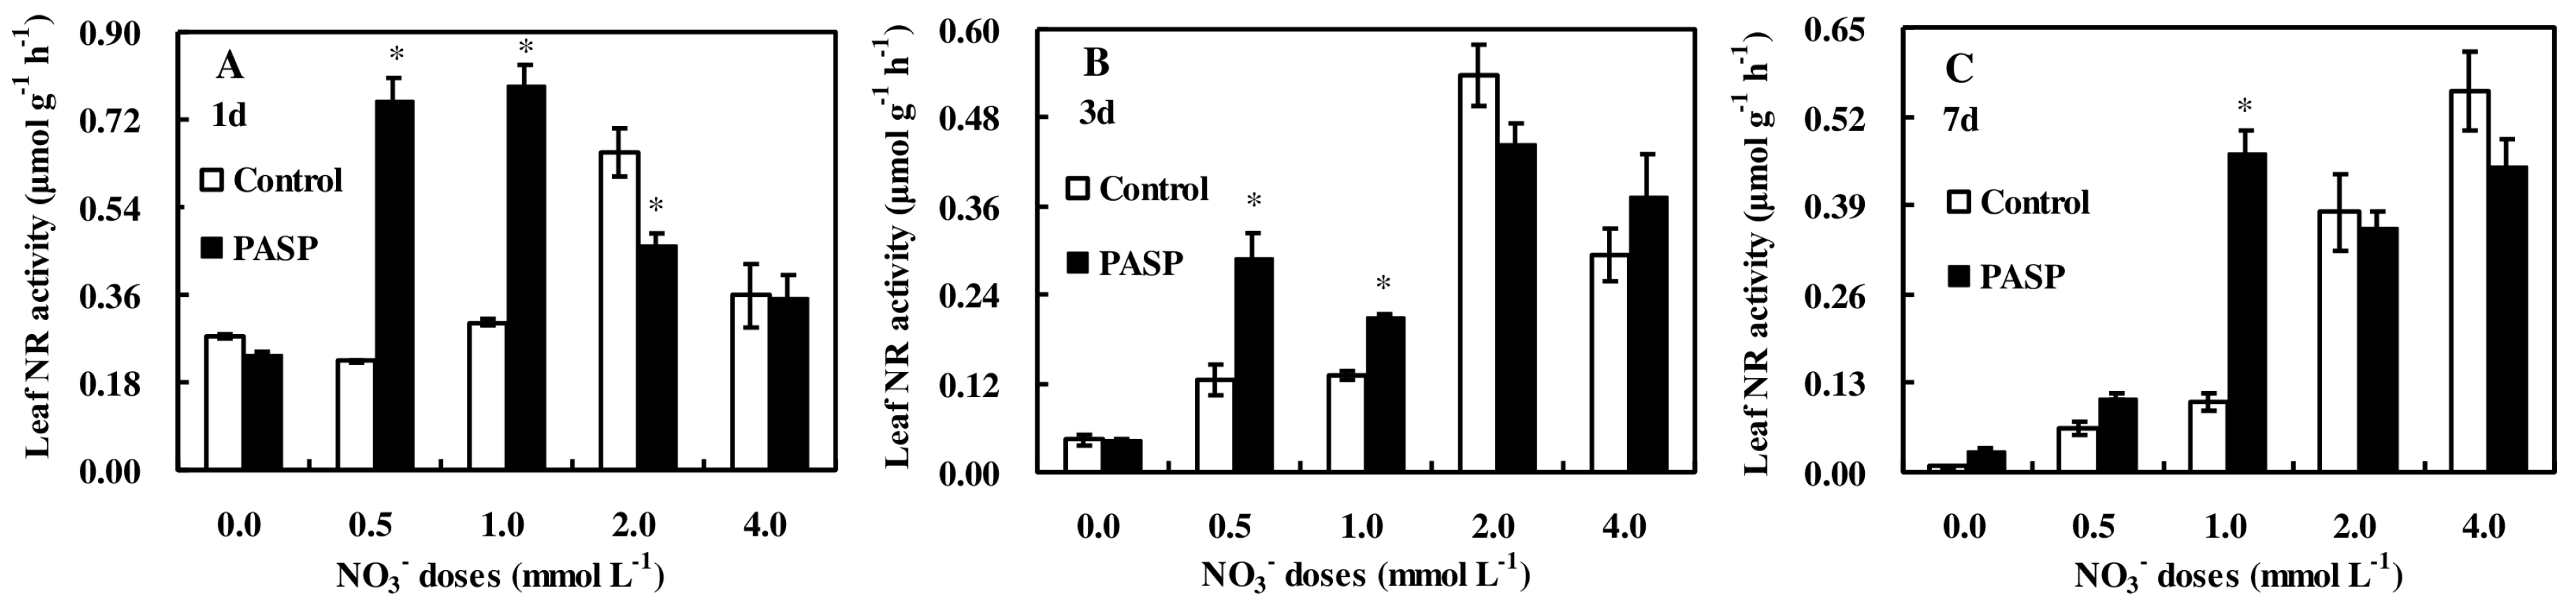
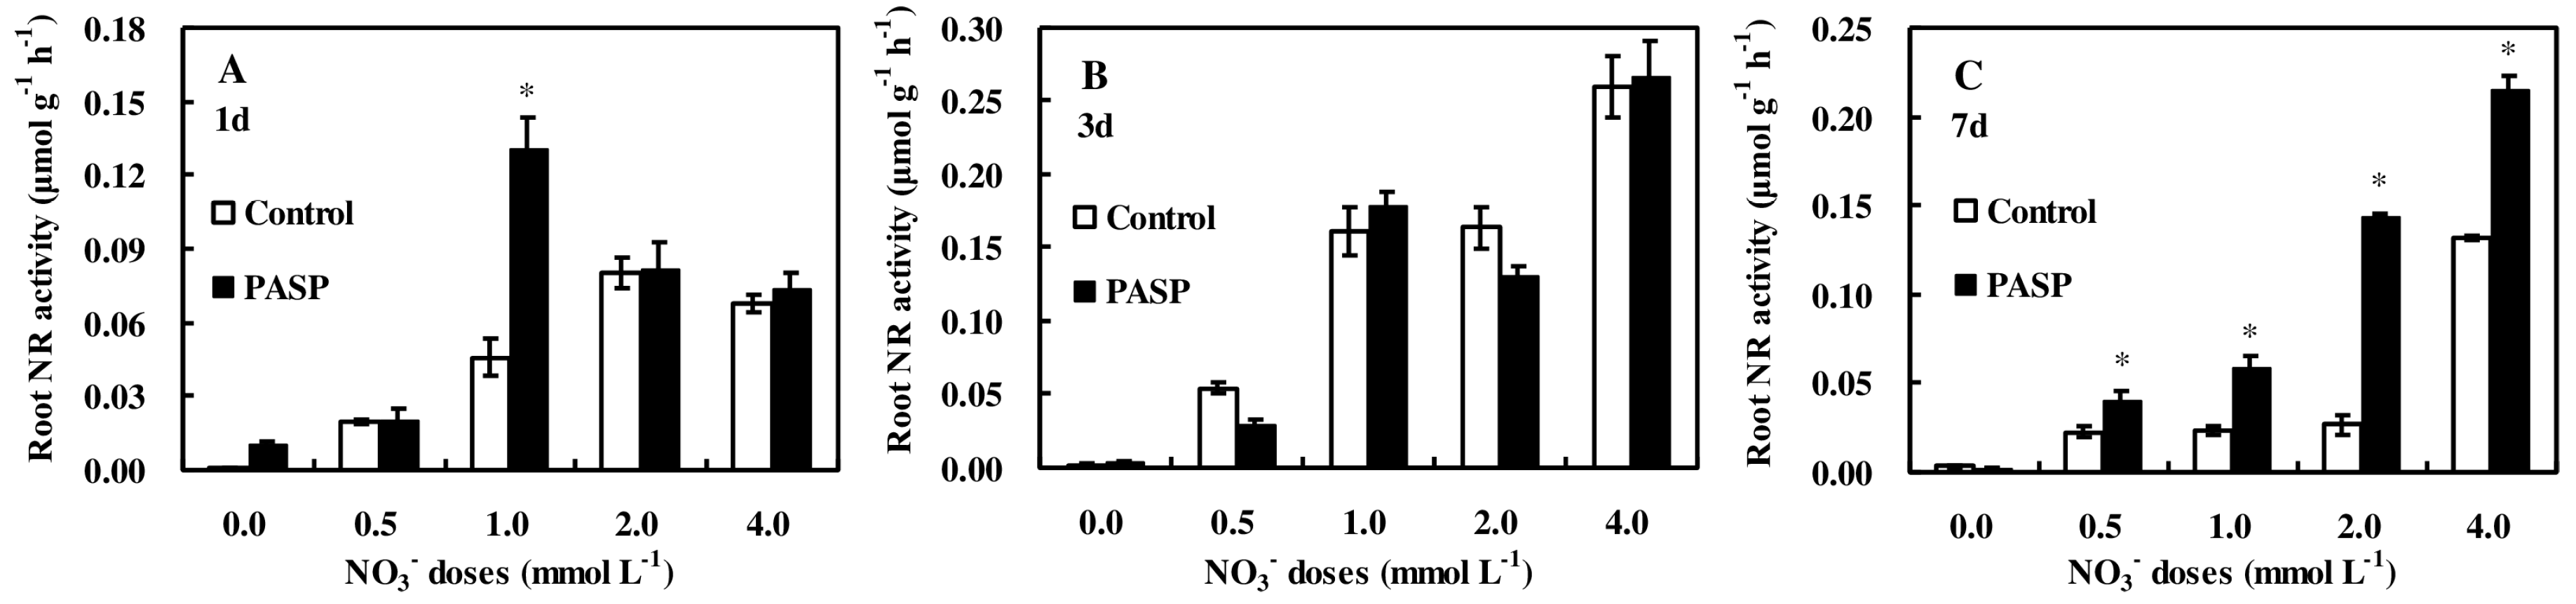
3.3. Changes in Enzyme Activities Correlated to Nitrogen Metabolism in Leaves and Roots of Maize Seedlings

In order to further investigate the physiological mechanism in which PASP affects nitrogen assimilation, enzyme activities involved with nitrogen metabolism, such as NR, GS, AspAT, and AlaAT, were estimated. Multiple analyses showed that the activity of NR was most affected by PASP (Table 2).
NO3 doses significantly (p < 0.05) affected most of the four enzyme activities measured during the experimental period in both the leaves and roots, except the root AspAT activity on the 1st day, the leaf AspAT activity on the 3rd day, and both of the leaf and root AlaAT activities on the 3rd day (Table 2). Supplementing plants with PASP, however, almost had no significant (p < 0.05) effects on all of the GS, AspAT, and AlaAT enzyme activities, with only changes of the leaf AspAT activity (p < 0.01) and root AlaAT activity (p < 0.05) on the 1st day as well as the root GS (p < 0.01) and AlaAT (p < 0.05) activities on the 7th day being significant (p < 0.05) (Table 2).
The effect of PASP on NR activity, however, was definitely remarkable. The NR activities in both the roots and leaves on all 3 days were significantly (p < 0.001) affected by PASP additions (Table 2). Moreover, the interaction of PASP and nitrogen treatment on NR activity was significant (p < 0.001) too (Table 2). In leaves, PASP treatment strikingly stimulated the NR activities at low NO3 doses, i.e., 0.5 and 1.0 mmol L−1 (Figure 3A–C). On the 1st day after PASP treatment, leaf NR activities increased 3.4-fold and 2.6-fold over the levels found in N0.5 and N1, respectively (Figure 3A). On the 3rd day, a similar increase in leaf NR activities of 2.4-fold and 1.6-fold was observed in N0.5P and N1P in comparison to N0.5 and N1, respectively (Figure 3B). On the 7th day, PASP supplementation significantly (p < 0.05) upregulated the NR activities in leaves by 1.7-fold and 4.6-fold when compared to N0.5 and N1, respectively (Figure 3C). However, in seedlings grown under high NO3 doses, the changes in NR activities caused by PASP additions were quite small or even negative (Figure 3A–C). In roots, NR activity responded to foliarly applied PASP after a short period of time. On the 1st day after treatment, PASP only induced a significant (p < 0.05) increase (by 2.9-fold) in NR activity in seedlings supplied with 1 mmol L−1 of NO3 when compared to control (Figure 4A). Furthermore, no significant (p < 0.05) effect was observed on the 3rd day between these treatments (Figure 4B). However, on the 7th day, root NR activities in all N0.5P, N1P, N2P, and N4P treatments were significantly (p < 0.05) upregulated by 1.8-fold, 2.6-fold, 5.4-fold, and 1.6-fold, respectively, when compared to N0.5, N1, N2, and N4, respectively (Figure 4C).
Overall, these results show that NR reacted more positively to PASP level than GS, AspAT, and AlaAT, especially in seedlings cultured under low nitrogen conditions. Thus, NR is probably the key enzyme involved in the promotion of nitrogen assimilation by PASP.

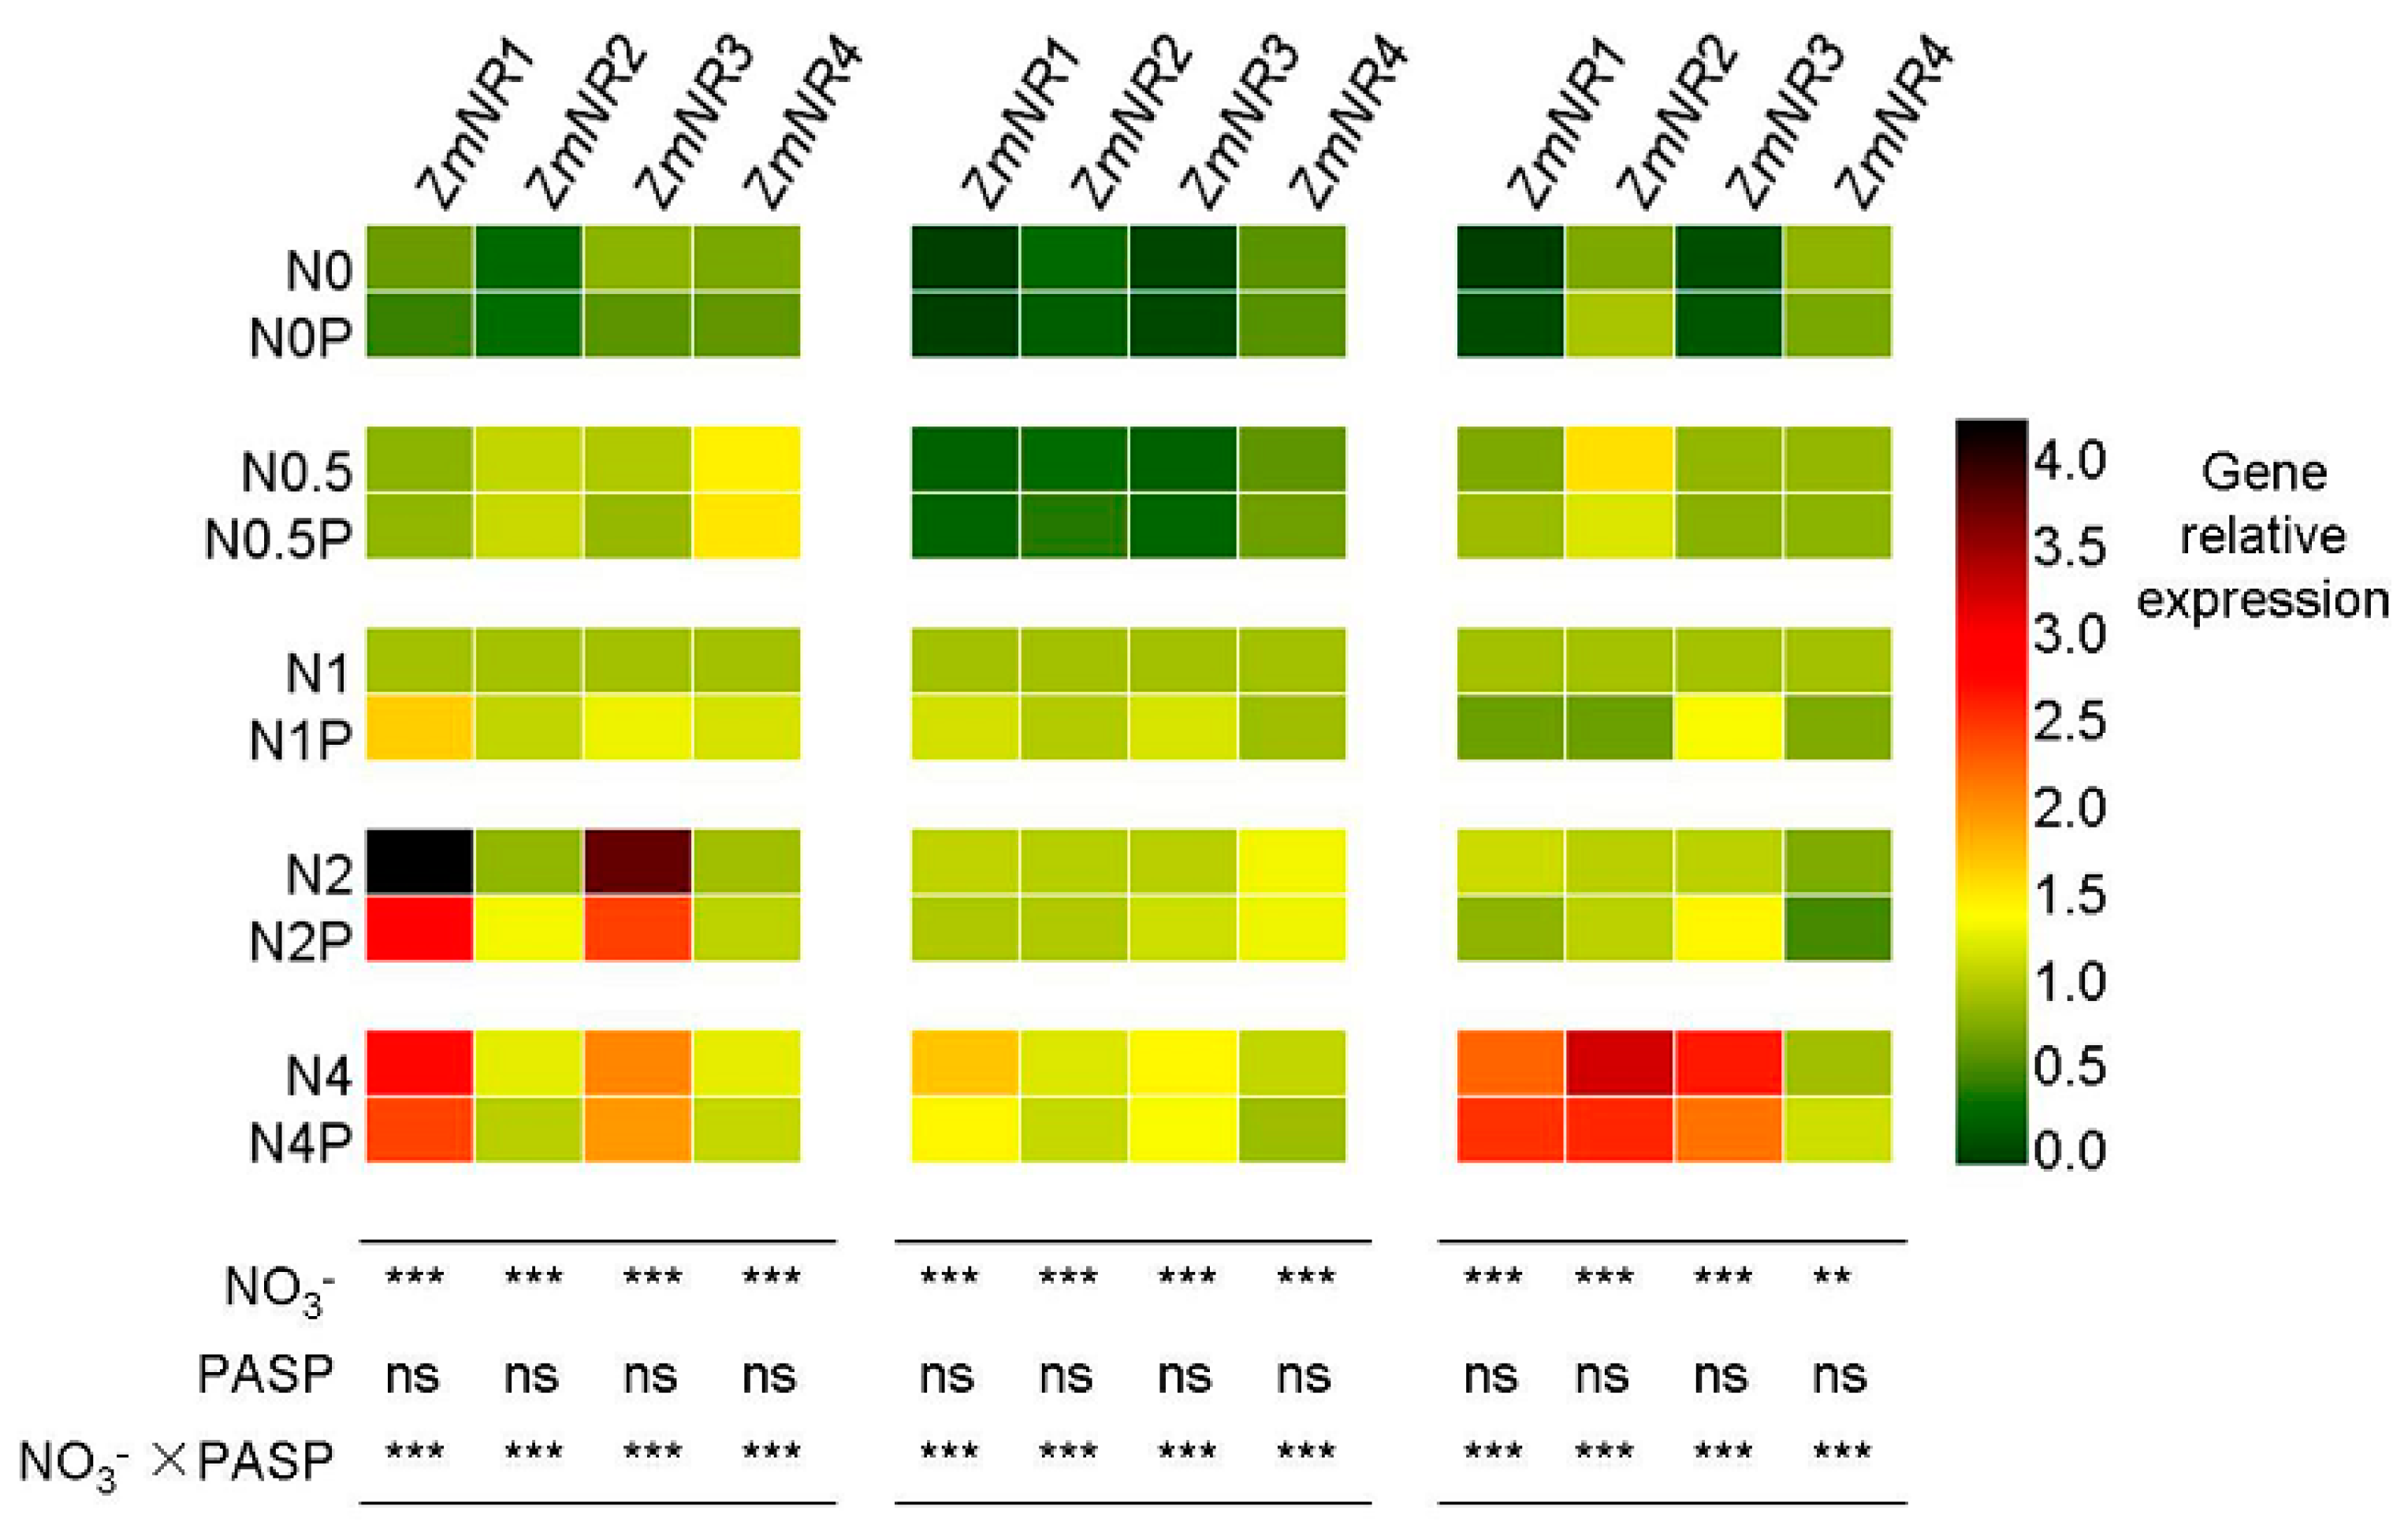
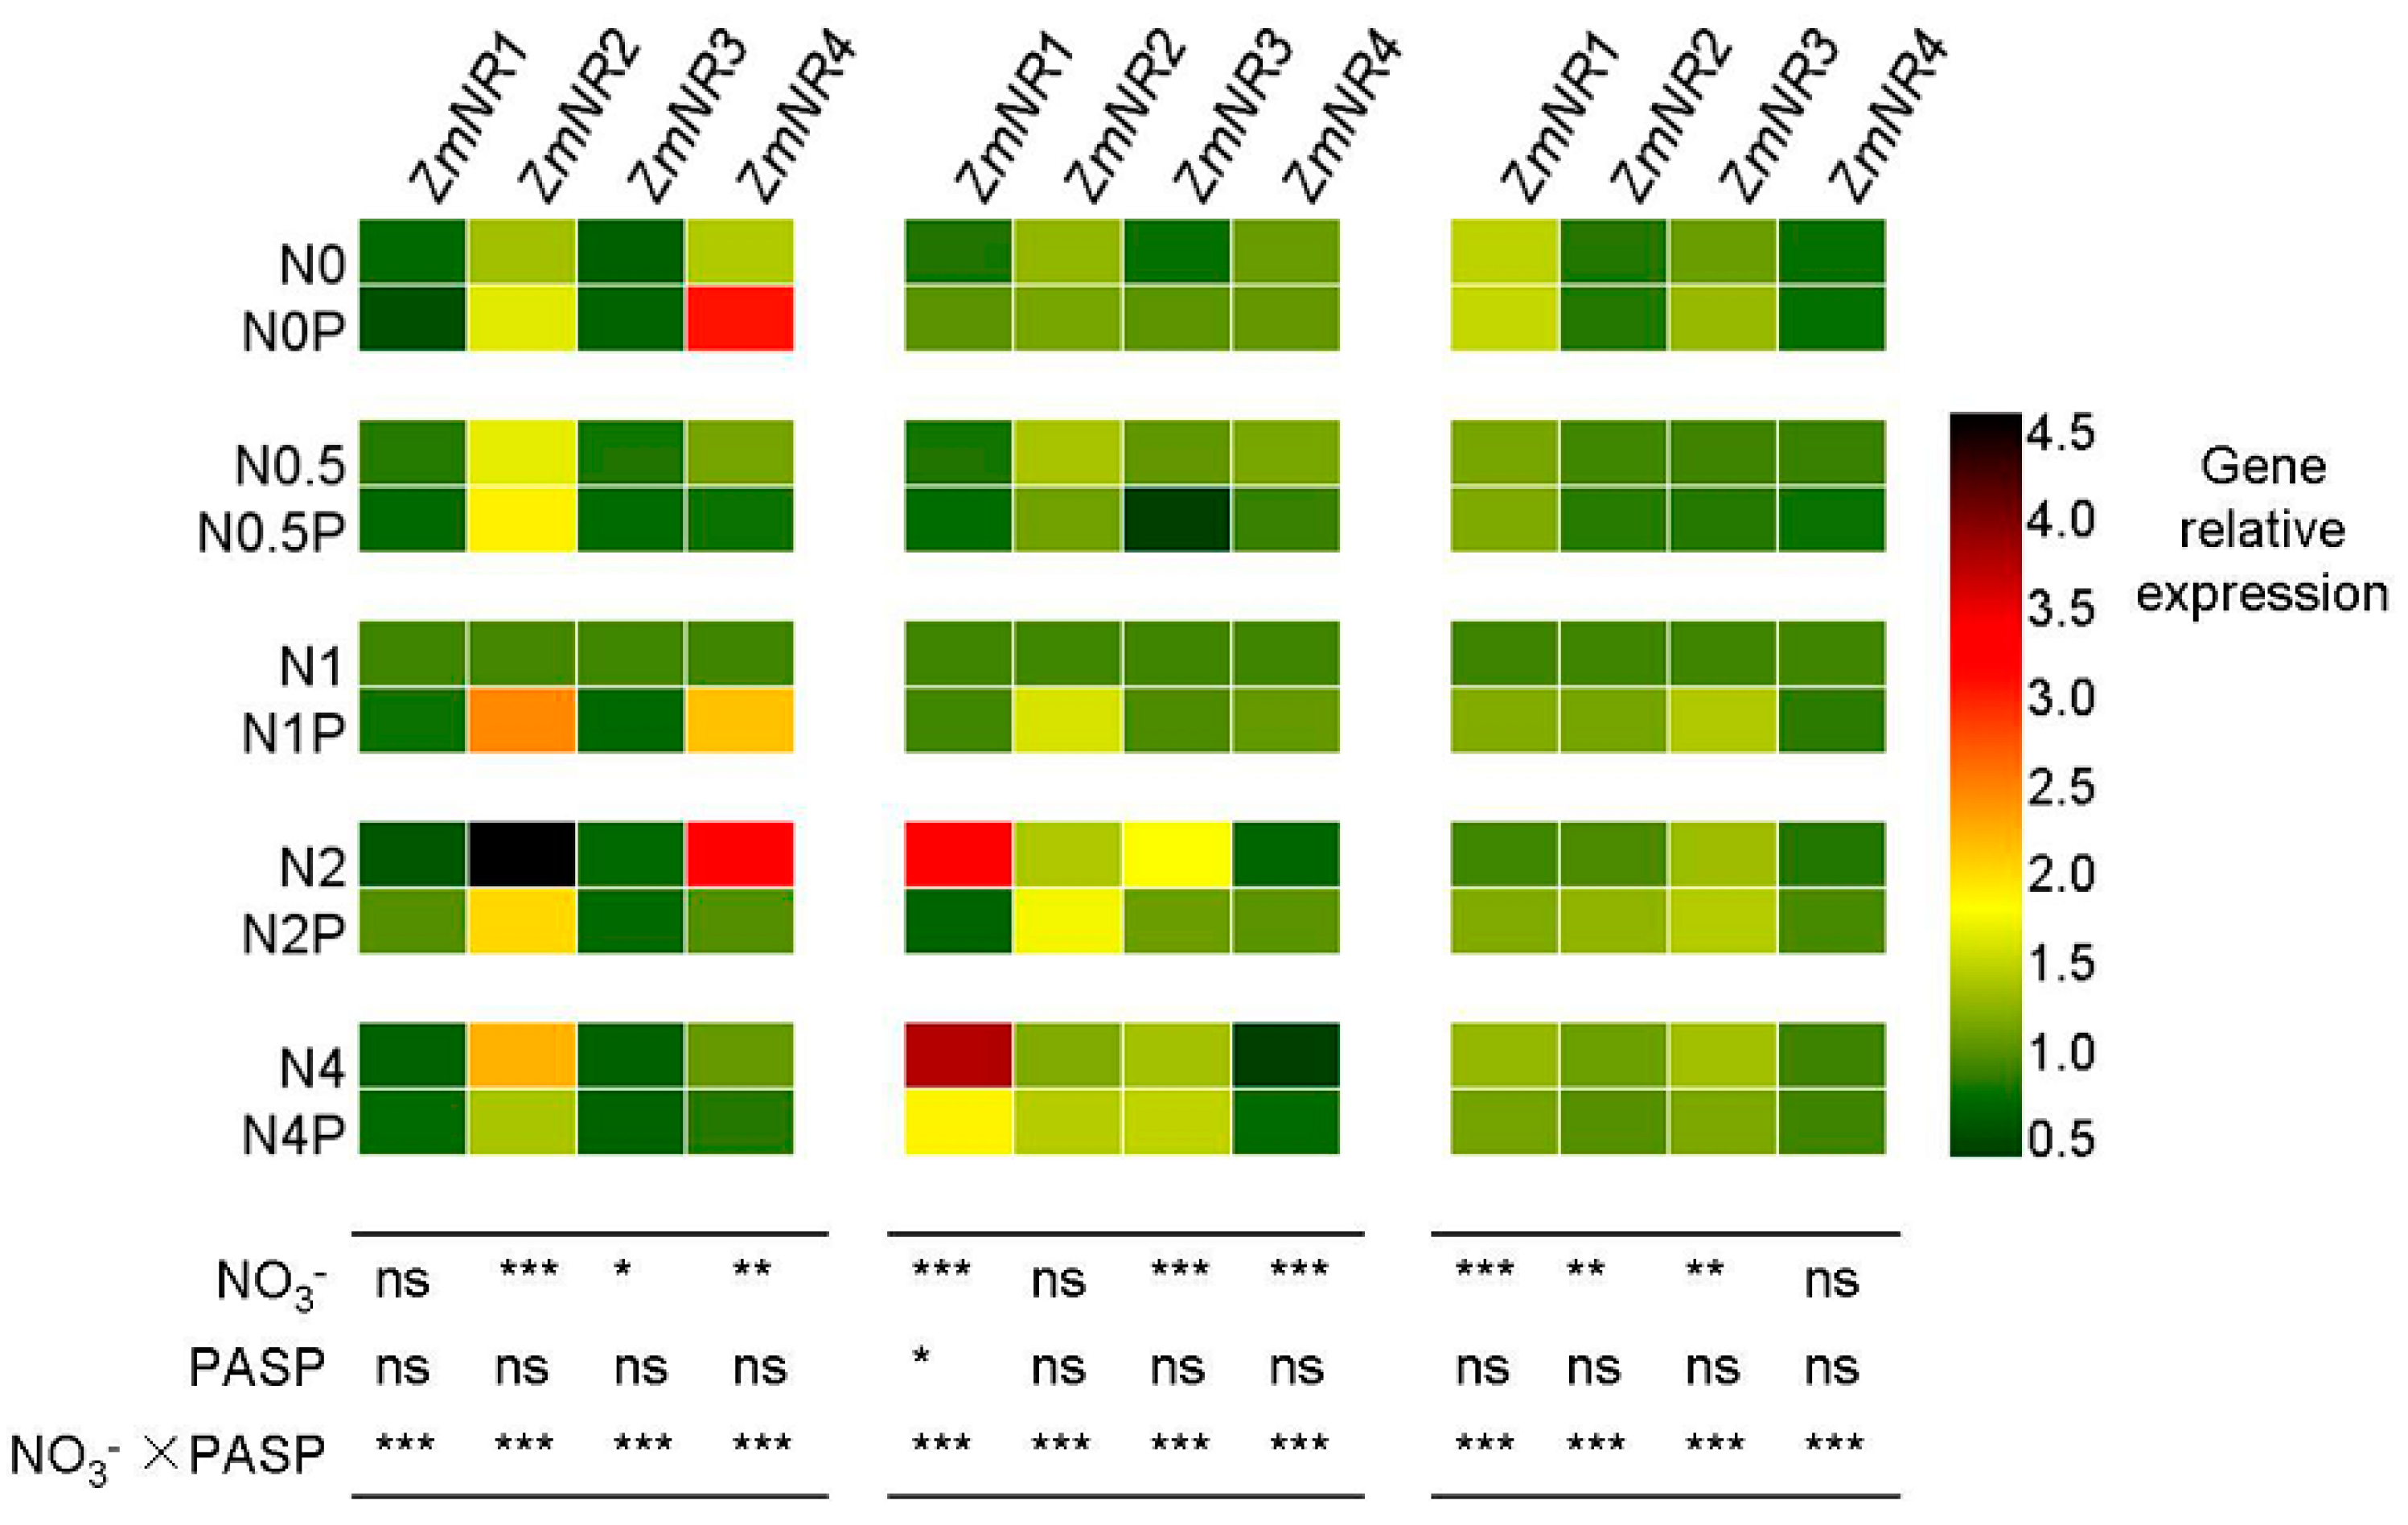
3.4. Changes in NR Gene Expression Levels in Maize Seedlings

To further investigate the mechanism of PASP regulation on NR activities, qPCR analysis was performed to examine the NR gene expression levels in leaves and roots after nitrogen and PASP treatment. Nitrate dose level significantly (p < 0.001) affected the expression levels of all four NR genes in both the leaves (Figure 5) and the roots (Figure 6). The PASP treatment, however, induced almost no significant (p < 0.05) changes on the expression of ZmNR1 to 4, especially in the leaves (Figure 5). In roots, only the ZmNR1 expression on the 3rd day after PASP treatment was significantly (p < 0.05) affected by PASP (Figure 6). However, the interaction of PASP addition and NO3 doses were significant (p < 0.001) (Figure 5 and Figure 6). In the leaves of seedlings grown under 1–4 mmol L−1 NO3 doses, the expression patterns of ZmNR1 and ZmNR3 reacted in a similar way to NR activity (Figure 3) to PASP addition, which were generally upregulated by PASP under low NO3 levels but downregulated under high NO3 levels (Figure 5). This indicated that ZmNR1 and ZmNR3 might be the candidate genes in response to PASP addition. However, the changes of the gene expression levels were much smaller than that of the NR activities (Figure 3). On the 1st day, PASP application significantly (p < 0.05) upregulated the expression of ZmNR1 and ZmNR3 by 1.8-fold and 1.4-fold when compared to N1 (Figure 5). On the 3rd day, a similar increase in leaf ZmNR1 and ZmNR3 expression of 1.2-fold and 1.3-fold was observed in N1P in comparison to N1, respectively (Figure 5). Moreover, the expression pattern of ZmNR1 and ZmNR3 in seedlings grown with 0.5 mmol L−1 NO3, which was scarcely affected by PASP addition (Figure 5), was not consistent with the NR activity in response to PASP addition (Figure 3). In roots, few changes of the ZmNR1 and ZmNR3 expression were induced by PASP. Noticeable decreases were only observed in ZmNR1 expression in N2P and N4P in comparison to N2 and N4, respectively, and in ZmNR3 expression in N2P compared to N2 on the 3rd day (Figure 6). On the 1st day, the expression of ZmNR2 and ZmNR4 in roots was markedly regulated by PASP addition, but the general expression pattern of these two genes on the 3 days were not consistent with NR activities in roots in response to PASP addition. Thus, ZmNR1 and ZmNR3 seem to be candidate genes in leaves in response to PASP addition, but generally, the gene expression does not appear to be the main approach where PASP upregulates the NR activity in maize under low nitrogen conditions.

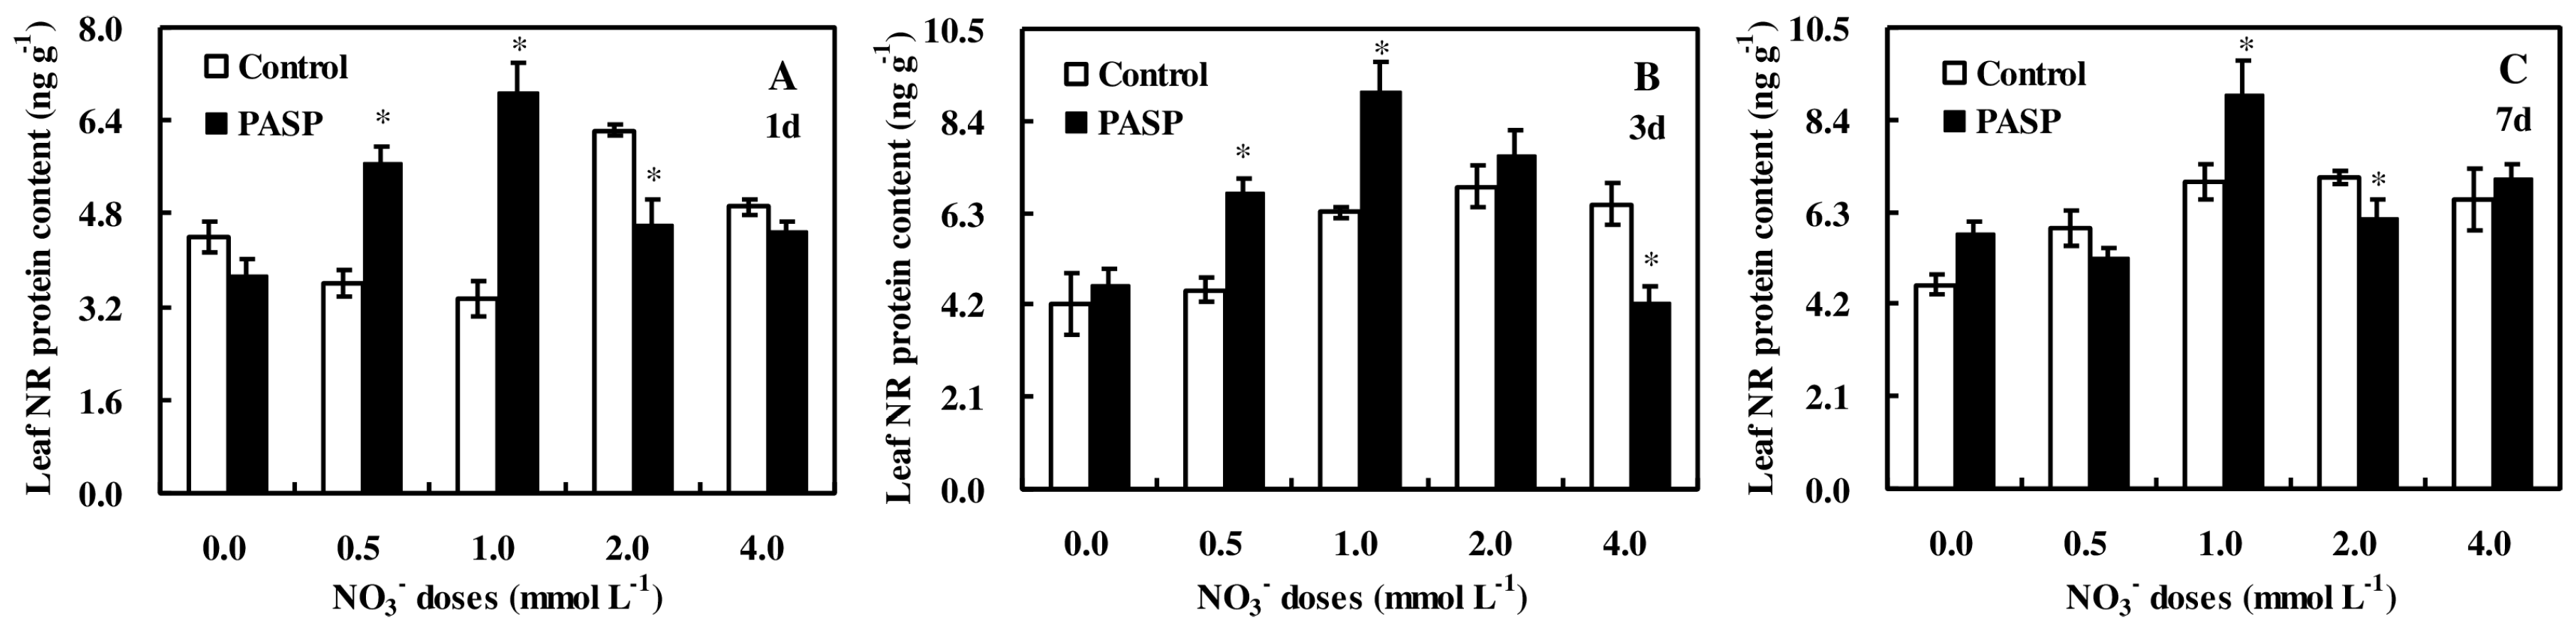
3.5. Changes in Nitrate Reductase Protein Accumulation in Maize Seedlings

In addition to the gene expression, NR protein accumulation was analyzed by ELISA to better appreciate the regulation of PASP on NR activity in maize. Nitrate reductase protein accumulation in seedlings grown in combination with low NO3 doses was generally increased by PASP (Figure 7 and Figure 8), which was similar to the NR activity (Figure 3 and Figure 4) changes in response to PASP supplementation. On the 1st day after PASP treatment, NR protein accumulations in leaves in the N0.5P and N1P treatments were much greater, by 1.6-fold and 2.1-fold, compared to the levels found from the N0.5 and N1 treatments, respectively (Figure 7A). On the 3rd day after PASP application, similar increases of 1.5-fold and 1.4-fold in leaf NR protein content were observed when compared to N0.5 and N1, respectively (Figure 7B). On the 7th day, PASP increased the leaf NR protein content of N1-treated plants by 1.3-fold (Figure 7C). However, by the 7th day, there was no significant (p < 0.05) difference due to PASP treatment in leaf NR protein levels in plants grown with 0.5 mmol L−1 NO3. Conversely, in seedlings grown under high NO3 doses (2 and 4 mmol L−1), the NR protein content in leaves was generally deceased by PASP treatment (Figure 7A–C), which was similar to the response of NR activity to PASP treatment (Figure 3A–C).
In roots, the response of NR protein accumulation to PASP (Figure 8) was in accordance with that of the NR enzymatic activity (Figure 4). On the 1st day, PASP markedly increased the root NR protein content in both N0.5P and N1P by 1.7-fold when compared to N0.5 and N1, respectively (Figure 8A). On the 3rd day, no significant (p < 0.05) difference was observed in root NR protein content from PASP treatment under all the experiment NO3 doses (Figure 8B). On the 7th day, root NR protein accumulation was generally increased by 1.3–1.6 fold by PASP when NO3 was present (Figure 8C).

4. Discussion

4.1. PASP Promoted Seedling Growth and Nitrogen Accumulation in Maize under Low Nitrogen Conditions

Plant growth reaction to a nitrogen source supply has been widely considered to be positive, increasing leaf area, plant height, and biomass production as the nitrogen supply rises [44,45]. In the present study, shoot biomass accumulation gradually increased along with the increase in NO3 dose from 0 to 2 mmol L−1 (Figure 1A). By contrast, root biomass production was strikingly inhibited through increasing NO3 doses (Figure 1B). This was in accordance with a previous study conducted by Tian et al. [46]. In fact, many recent studies have pointed out that the influence of nitrogen supply to plant growth may be less than expected or even detrimental to plant development in some conditions and areas [47,48]. Similarly, biomass accumulation in both the shoots (Figure 1A) and roots (Figure 1B) remarkably decreased in seedlings that were grown under the high nitrogen condition (N4) when compared to N2. The total biomass accumulation per plant in N2 was markedly higher than that in other treatments without PASP treatment, which suggests that the 2 mmol L−1 of NO3 dose was the optimum concentration for plant growth.
Polyaspartic acid, which has a large number of carboxylic and amide groups [15], has been studied for promoting plant growth and nutrient use efficiency in crops [10,12,13,19]. In the present study, PASP generally increased the biomass production of maize seedlings (Figure 1A,B). This result is consistent with the findings reported by Du et al. [13], in which PASP was shown to promote seedling and root growth in rice. The most noticeable increase in plant biomass production after PASP treatment was observed in N1P (Figure 1B), which was under NO3 doses that were slightly less than the optimum concentration for plant growth. Larger changes in biomass accumulation were observed in the root than in the shoot from the PASP treatment. Therefore, the root/shoot ratio (Figure 1C) exhibited a slight increase after PASP treatment.
In terms of the significant relationship among experimental conditions, nitrogen content in the roots was observed to significantly (p < 0.05) increase along with the increase in NO3 doses (Figure 2). These results are in accordance with the reports of previous studies, which indicated the dependence of nitrogen accumulation and redistribution of crops on nitrogen rate [49]. However, nitrogen accumulation in the shoots (Figure 2A) had a bell-shaped curve pattern, which peaked from the N2 treatment. A decrease in shoot nitrogen accumulation was observed by supplementing with more nitrogen in N4 when compared to N2, which was consistent with the shoot biomass production (Figure 1A). Similar to the plant biomass, nitrogen accumulation was generally increased by PASP additions in both the roots and shoots (Figure 2). In particular, the changes between N0.5P and N0.5, as well as N1P and N1, were pronouncedly great. However, nitrogen content per gram of dry matter did not significantly (p < 0.05) differ as a result of these treatments, as calculated in Figure 1 and Figure 2. These results suggest that the promotion of nitrogen assimilation by PASP is probably simultaneous with other types of metabolism, such as carbon assimilation [19], which consequently results in the extreme expansion in total nitrogen accumulation per plant, with a small influence in nitrogen concentration per gram of dry matter.
Overall, these results showed that the N2 treatment was the optimum NO3 dose for seedling growth in these experiment conditions. Moreover, PASP treatment most probably enhanced nitrogen assimilation as well as seedling growth under low nitrogen levels (0.5 and 1.0 mmol L−1 of NO3).

4.2. The Improvement of PASP on Nitrogen Accumulation in Maize Was Primarily Attributed to Changes in NR Activities

A few comprehensive reviews [31,34] have discussed the progress of nitrogen assimilation. In these reviews, various enzymes have been reported to participate in nitrate assimilation, such as NR, GS, AspAT, and AlaAT. In the current study, the most noticeable change after PASP treatment was the large increase in NR activity in seedlings when grown under low NO3 doses, especially 0.5 and 1.0 mmol L−1 (Figure 3 and Figure 4). This finding was in accordance with the increase of nitrogen accumulation after PASP treatment, which suggests the key role of NR in maize nitrate assimilation in response to PASP. However, in seedlings grown under high NO3 doses (2 and 4 mmol L−1), NR activity rarely or even negatively responded to PASP on the 1st and 3rd day after treatment (Figure 3 and Figure 4). This response may be due to the abundance of NO3 available. Regarding the response of NR to the increasing NO3 dose, both control and PASP treatment exhibited a bell-shape curve. The response of NR activity to PASP under high NO3 conditions was similar to that response to high NO3 doses when a decrease in NR activity (Figure 3 and Figure 4) and nitrogen (Figure 2) and biomass (Figure 1) accumulation was observed in N4 when compared to N2. Furthermore, previous studies have demonstrated that the activity of NR is positively induced by exogenous nitrate only at low nitrogen conditions [50]. Moreover, the cellular compartmentation of nitrate, rather than the exogenous nitrate, was considered to be the main factor that regulates NR activity [50,51]. The PASP treatment may minimize the threshold concentration of the supplied nitrate, which induces NR activity by enhancing nitrate uptake under low nitrogen conditions and elevates the internal nitrate concentration in the metabolic pool. Furthermore, the enhanced NR activity was simultaneously followed by a high production of nitrite [52], which may inhibit NR activity through a feedback inhibition mechanism. Different from that on the 1st (Figure 4A) and 3rd (Figure 4B) days after supplementation, root NR activity on the 7th day was remarkably increased by PASP (Figure 4C). These differences may be due to the variation of nitrogen demand in different growth processes [53,54]. Thus, it was hypothesized that in seedlings with nitrogen availability less than the growth demand, NR activity was upregulated by PASP, while in seedlings supplied with sufficient nitrogen, this activity was reduced.
In addition to NR, GS is another critical enzyme of nitrate assimilation which catalyzes the assimilation of ammonium into glutamine [55]. AlaAT and AspAT are two important aminotransferases in plants which catalyze the reversible transfer of the amino group from glutamate to oxalocaetate and pyruvate, respectively [28,29,30]. GS and AlaAT were positively coregulated with NR [56,57]. However, in the present study, the activities of all GS, AlaAT, and AspAT enzymes were barely affected by PASP treatment (Table 2) and appeared not to be the dominant processes that allowed PASP to promote nitrate assimilation.
Overall, these results revealed that NR predominantly contributed to the promotion of PASP in nitrogen accumulation in maize by PASP, especially under low nitrogen conditions.

4.3. The Regulation of PASP on NR Activity Was Mainly Due to the Increasing Accumulation of Protein Rather than Gene Transcription

As the primary rate-limiting enzyme of nitrogen nutrition [32,33], NR has been widely studied. These studies revealed that NR activity in higher plants was regulated at both the transcriptional and post-translational levels [42,58,59]. In order to further investigate the genetic basis of PASP regulation on NR, the gene expression and protein accumulation of NR was measured in the present study.
The present results revealed that there were limited correlations between the gene transcript level and enzymatic activity of NR in response to PASP supplementation. In particular, on the 7th day after PASP treatment, none of the four NR genes was consistently transcribed with that of the NR activity (Figure 5 and Figure 6) in response to PASP treatment. On the 1st and 3rd days after treatment, PASP affected the transcript of ZmNR1 and ZmNR3 (Figure 5) in leaves in a similar way to that of NR activity (Figure 3A), but the changes in the gene transcription were much less than that of NR activity. In roots, the expression of ZmNR1 and ZmNR3 (Figure 6) was only significantly regulated by PASP on the 3rd day in plants grown with high NO3 dose, which was not consistent with NR activity in response to PASP addition. The transcription levels of ZmNR2 and ZmNR4 (Figure 6) in roots on the 1st day were markedly affected by PASP addition, but on the 3rd and 7th days, the expression patterns of these two genes were not consistent with the NR activity (Figure 4) in response to PASP addition. These results indicate that ZmNR1 and ZmNR3 may be candidate genes in response to PASP addition in leaves, while ZmNR2 and ZmNR4 may take a role in the response of roots to PASP application, but all the transcriptions of these genes are not the main approach where PASP upregulates the NR activity in maize under low nitrogen conditions. This was not unexpected. In fact, numerous studies have found similar results, in which transcript levels and their relevant enzyme activities were not tightly correlated [39,60,61]. Moreover, on the 1st day after treatment, the transcription levels of ZmNR2 and ZmNR4 (Figure 6) in the roots of seedlings grown without NO3 application were markedly upregulated by PASP addition, while no significant differences were observed in the NR protein content (Figure 8), NR activity (Figure 4), nitrogen accumulation (Figure 2), or plant dry weight (Figure 1). This indicates that there needs to be nitrogen available in the first place to observe physiological changes.
Different from gene transcription, the protein accumulation of NR (Figure 7 and Figure 8) was affected similar to the NR activity (Figure 3 and Figure 4) by PASP treatment, especially in the leaves. The response of the NR protein content to PASP could be interpreted in two ways. First, PASP might increase the translation of NR mRNA to protein, but this still needs evidence. Second, a decrease in degradation in NR protein may be induced by PASP. NR has a short half-life of several hours. In previous reviews, NR phosphorylation and 14-3-3-binding, as well as sugar signals, were considered to be involved in NR degradations [62,63]. It appears that the activated NR protein was more stable. In fact, the changes in protein accumulation were less than that of NR activity after PASP treatment in the present study (indicated byFigure 3, Figure 4, Figure 7 and Figure 8). On the 7th day after treatment, especially in the roots, the NR protein content (Figure 8C) and NR activity (Figure 4C) did not exhibit a completely consistent response to PASP treatment. Thus, it appears that PASP most probably regulates NR activity according to protein accumulation as well as post-translational control.
Overall, the transcription and protein accumulation results imply that the regulation of PASP on NR activity is predominantly attributed to protein accumulation and may be a post-translational regulation rather than gene transcription.
These results imply that the application of PASP by foliar spraying generally promotes plant growth and nitrogen assimilation, especially the NR activity. In previous studies, PASP was usually supplied together with a fertilizer or nutrient solution, and its promotion of fertilizer absorption was usually considered to be due to its strong absorbency for ions [10,12,13]. In this study, PASP was supplied by foliar spraying, which avoided the interaction of PASP and fertilizer. Thus, we infer that PASP may be absorbed in the leaves and acts in a similar way to a plant growth regulator. In fact, Xu et al. [64] has studied PASP as a plant growth regulator together with Kinetin and 1-Naphthaleneacetic acid. However, the absorption of PASP in leaves and the mechanism by which it works still need further investigation.

5. Conclusions

Application of PASP mainly promoted seedling growth, the increase of the root/shoot ratio, and the accumulation of total nitrogen in maize plants, especially under low nitrogen conditions. The promotion by PASP of maize nitrogen accumulation was primarily due to the increase in NR activity. The transcription of ZmNR1 to 4 was significantly (p < 0.05) affected by NO3, but few changes were induced by PASP treatment. However, the accumulation of NR protein was strikingly increased by PASP treatment, which was consistent with the changes in NR activities. Thus, it appears that the regulation by PASP of NR activity was most probably due to the promotion of accumulating protein rather than gene expression. The present study provides useful insight into the action of PASP on maize nitrogen assimilation. Therefore, PASP could be used for enhancing nitrogen utilization in maize.

Author Contributions

Q.W. and Z.D. conceived and designed the experiments; Q.W., H.D., X.D., and Y.X. performed the experiments; Q.W. and H.T. analyzed the data; G.L. and H.D. contributed reagents/materials/analysis tools; Q.W. wrote the paper.

Funding

This research was funded by the National Key R&D Program of China (Grant No. 2018YFD0200608) and the National Natural Science Foundation of China (Grant No. 31470087).

Acknowledgments

We thank the reviewers and editors for their exceptionally helpful comments about the manuscript.

Conflicts of Interest

The authors declare no conflict of interest.

References

  1. Cao, Q.; Miao, Y.X.; Feng, G.H.; Gao, X.W.; Liu, B.; Liu, Y.Q.; Li, F.; Khosla, R.; Mulla, D.J.; Zhang, F.S. Improving nitrogen use efficiency with minimal environmental risks using an active canopy sensor in a wheat-maize cropping system. Field Crops Res. 2017, 214, 365–372. [Google Scholar] [CrossRef]
  2. Norse, D.; Ju, X. Environmental costs of China’s food security. Agric. Ecosyst. Environ. 2015, 209, 5–14. [Google Scholar] [CrossRef]
  3. Zhang, W.F.; Dou, Z.X.; He, P.; Ju, X.T.; Powlson, D.; Chadwick, D.; Norse, D.; Lu, Y.L.; Zhang, Y.; Wu, L.; et al. New technologies reduce greenhouse gas emissions from nitrogenous fertilizer in China. Proc. Nat. Acad. Sci. USA 2013, 110, 8375–8380. [Google Scholar] [CrossRef] [PubMed] [Green Version]
  4. Guo, J.H.; Liu, X.J.; Zhang, Y.; Shen, J.L.; Han, W.X.; Zhang, W.F.; Christie, P.; Goulding, K.W.T.; Vitousek, P.M.; Zhang, F.S. Significant acidification in major Chinese croplands. Science 2010, 327, 1008–1010. [Google Scholar] [CrossRef] [PubMed] [Green Version]
  5. Galloway, J.N.; Townsend, A.R.; Erisman, J.W.; Bekunda, M.; Cai, Z.; Freney, J.R.; Martinelli, L.A.; Seitzinger, S.P.; Sutton, M.A. Transformation of the nitrogen cycle: Recent trends, questions, and potential solutions. Science 2008, 320, 889–892. [Google Scholar] [CrossRef] [PubMed]
  6. Liu, X.J.; Zhang, Y.; Han, W.X.; Tang, A.H.; Shen, J.L.; Cui, Z.L.; Vitousek, P.; Erisman, J.W.; Goulding, K.; Christie, P.; et al. Enhanced nitrogen deposition over China. Nature 2013, 494, 459–462. [Google Scholar] [CrossRef] [PubMed]
  7. Berenguer, P.; Santiveri, F.; Boixadera, J.; Lloveras, J. Nitrogen fertilization of irrigated maize under Mediterranean conditions. Eur. J. Agron. 2009, 30, 163–171. [Google Scholar] [CrossRef]
  8. Good, A.G.; Beatty, P.H. Fertilizing Nature: A Tragedy of Excess in the Commons. PLoS Biol. 2011, 9, e1001124. [Google Scholar] [CrossRef] [PubMed]
  9. Hirel, B.; Gallais, A. Nitrogen use efficiency—Physiological, molecular and genetic investigations towards crop improvement. In Advances in Maize; Prioul, J.L., Thévenot, C., Molnar, T., Eds.; Society for Experimental Biology: London, UK, 2011; Volume 3, pp. 285–310. [Google Scholar]
  10. Deng, F.; Wang, L.; Ren, W.J.; Mei, X.F.; Li, S.X. Optimized nitrogen managements and polyaspartic acid urea improved dry matter production and yield of indica hybrid rice. Soil Tillage Res. 2015, 145, 1–9. [Google Scholar] [CrossRef]
  11. Hu, H.Y.; Ning, T.Y.; Li, Z.J.; Han, H.F.; Zhang, Z.Z.; Qin, S.J.; Zheng, Y.H. Coupling effects of urea types and subsoiling on nitrogen—Water use and yield of different varieties of maize in northern China. Field Crops Res. 2013, 142, 85–94. [Google Scholar] [CrossRef]
  12. Deng, F.; Wang, L.; Ren, W.J.; Mei, X.F.; Li, S.X. Enhancing nitrogen utilization and soil nitrogen balance in paddy fields by optimizing nitrogen management and using polyaspartic acid urea. Field Crops Res. 2014, 169, 30–38. [Google Scholar] [CrossRef]
  13. Du, Z.J.; Yang, H.; Wang, Y.Z.; Luo, H.Y.; Xu, L.; Wang, K.L.; Wang, B. Effects on yield and phosphorus nutrition absorbing for rice using homologous polypeptides of polyaspartic acids. Mod. Agric. Sci. Technol. 2012, 18, 12–13, 15, (In Chinese with English abstract). [Google Scholar]
  14. Xu, Y.; Zhao, L.L.; Wang, L.N.; Xu, S.Y.; Cui, Y.C. Synthesis of polyaspartic acid–melamine grafted copolymer and evaluation of its scale inhibition performance and dispersion capacity for ferric oxide. Desalination 2012, 286, 285–289. [Google Scholar] [CrossRef]
  15. Tomida, M.; Nakato, T.; Matsunami, S.; Kakuchi, T. Convenient synthesis of high molecular weight poly (succinimide) by acid-catalysed polycondensation of L-aspartic acid. Polymer 1997, 38, 4733–4736. [Google Scholar] [CrossRef]
  16. Vega-Chacón, J.; Amaya Arbeláez, M.I.; Jorge, J.H.; Marques, R.F.C.; Jafelicci, M., Jr. pH-responsive poly(aspartic acid) hydrogel-coated magnetite nanoparticles for biomedical applications. Mater. Sci. Eng. C 2017, 77, 366–373. [Google Scholar] [CrossRef] [PubMed]
  17. Kumar, A. Polyaspartic Acid—A Versatile Green Chemical. Chem. Sci. Rev. Lett. 2012, 1, 162–167. [Google Scholar]
  18. Chiriac, A.P.; Nita, L.E.; Neamtu, I. Poly(ethylene glycol) functionalized by polycondensing procedure with poly(succinimide). Polymer 2010, 55, 641–645. [Google Scholar]
  19. Jiang, W.; Zhou, D.B.; Zhang, H.S.; Zhang, Y.S. The effect of polyaspartic acid on maize growth at seedling stage under different fertilizer applied condition. J. Maize Sci. 2007, 15, 121–124, (In Chinese with English Abstract). [Google Scholar]
  20. Miller, A.J.; Fan, X.; Orsel, M.; Smith, S.J.; Wells, D.M. Nitrate transport and signalling. J. Exp. Bot. 2007, 58, 2297–2306. [Google Scholar] [CrossRef] [PubMed] [Green Version]
  21. Plett, D.; Baumann, U.; Schreiber, A.W.; Holtham, L.; Kalashyan, E.; Toubia, J.; Nau, J.; Beatty, M.; Rafalski, A.; Dhugga, K.S.; et al. Maize maintains growth in response to decreased nitrate supply through a highly dynamic and developmental stage-speciic transcriptional response. Plant Biotechnol. J. 2016, 14, 342–353. [Google Scholar] [CrossRef] [PubMed]
  22. Lea, U.S.; Leydecker, M.T.; Quillere, I.; Meyer, C.; Lillo, C. Post-translational regulation of nitrate reductase strongly affects the levels of free amino acids and nitrate, whereas transcriptional regulation has only minor inluence. Plant Physiol. 2006, 140, 1085–1094. [Google Scholar] [CrossRef] [PubMed]
  23. Takahashi, M.; Sasaki, Y.; Ida, S.; Morikawa, H. Nitrite reductase gene enrichment improves assimilation of NO2 in Arabidopsis. Plant Physiol. 2001, 126, 731–741. [Google Scholar] [CrossRef] [PubMed]
  24. Bernard, S.; Moller, A.L.B.; Dionisio, G.; Kichey, T.; Jahn, T.P.; Dubois, F.; Baudo, M.; Lopes, M.S.; Terce-Laforgue, T.; Foyer, C.H.; et al. Gene expression, cellular localisation and function of glutamine synthetase isozymes in wheat (Triticum aestivum L.). Plant Mol. Biol. 2008, 67, 89–105. [Google Scholar] [CrossRef] [PubMed]
  25. Martin, A.; Lee, J.; Kichey, T.; Gerentes, D.; Zivy, M.; Tatout, C.; Dubois, F.; Balliau, T.; Valot, B.; Davanture, M.; et al. Two cytosolic glutamine synthetase isoforms of maize are specifically involved in the control of grain production. Plant Cell 2006, 18, 3252–3274. [Google Scholar] [CrossRef] [PubMed]
  26. Swarbreck, S.M.; Defoin-Platel, M.; Hindle, M.; Saqi, M.; Habash, D.Z. New perspectives on glutamine synthetase in grasses. J. Exp. Bot. 2011, 62, 1511–1522. [Google Scholar] [CrossRef] [PubMed]
  27. Yamaya, T.; Kusano, M. Evidence supporting distinct functions of three cytosolic glutamine synthetases and two NADH-glutamate synthases in rice. J. Exp. Bot. 2014, 65, 5519–5525. [Google Scholar] [CrossRef] [PubMed] [Green Version]
  28. De la Torre, F.; Cañas, R.A.; Pascual, M.B.; Avila, C.; Cánovas, F.M. Plastidic aspartate aminotransferases and the biosynthesis of essential amino acids in plants. J. Exp. Bot. 2014, 65, 5527–5534. [Google Scholar] [CrossRef] [PubMed] [Green Version]
  29. De la Torre, F.; El-Azaz, J.; Ávila, C.; Cánovas, F.M. Deciphering the role of aspartate and prephenate aminotransferase activities in plastid nitrogen metabolism. Plant Physiol. 2014, 164, 92–104. [Google Scholar] [CrossRef] [PubMed]
  30. Beatty, P.H.; Shrawat, A.K.; Carroll, R.T.; Zhu, T.; Good, A.G. Transcriptome analysis of nitrogen-efficient rice over-expressing alanine aminotransferase. Plant Biotechnol. J. 2009, 7, 562–576. [Google Scholar] [CrossRef] [PubMed]
  31. McAllister, C.H.; Beatty, P.H.; Good, A.G. Engineering nitrogen use efficient crop plants: The current status. Plant Biotechnol. J. 2012, 10, 1011–1025. [Google Scholar] [CrossRef] [PubMed]
  32. Campbell, W.H. Nitrate reductase structure, function and regulation: Bridging the gap between biochemistry and physiology. Annu. Rev. Plant Physiol. Plant Mol. Biol. 1999, 50, 277–303. [Google Scholar] [CrossRef] [PubMed]
  33. Xia, B.X.; Sun, Z.G.; Wang, L.H.; Zhou, Q.; Huang, X.H. Analysis of the combined effects of lanthanum and acid rain, and their mechanisms, on nitrate reductase transcription in plants. Ecotoxicol. Environ. Saf. 2017, 138, 170–178. [Google Scholar] [CrossRef] [PubMed]
  34. Li, H.; Hu, B.; Chu, C.C. Nitrogen use efficiency in crops: Lessons from Arabidopsis and rice. J. Exp. Bot. 2017, 4, 2–12. [Google Scholar] [CrossRef] [PubMed]
  35. Cañas, R.A.; Quilleré, I.; Lea, P.J.; Hirel, B. Analysis of amino acid metabolism in the ear of maize mutants deficient in two cytosolic glutamine synthetase isoenzymes highlights the importance of asparagine for nitrogen translocation within sink organs. Plant Biotechnol. J. 2010, 8, 966–978. [Google Scholar] [CrossRef] [PubMed] [Green Version]
  36. Mei, Q.H. Study on the Application of Environmental Friendly Polymer PASP in Agriculture. Master’s Thesis, East China University of Science and Technology, Shanghai, China, 2005. [Google Scholar]
  37. Majláth, I.; Darko, E.; Palla, B.; Nagy, Z.; Janda, T.; Szalai, G. Reduced light and moderate water deficiency sustain nitrogen assimilation and sucrose degradation at low temperature in durum wheat. J Plant Physiol. 2016, 191, 149–158. [Google Scholar] [CrossRef] [PubMed] [Green Version]
  38. Teixeira, J.; Pereira, S.; Canovas, F.; Salema, R. Glutamine synthetase of potato (Solanum tuberosum L. cv. Desiree) plants: Cell- and organ-specific expression and differential developmental regulation reveal specific roles in nitrogen assimilation and mobilization. J. Exp. Bot. 2015, 56, 663–671. [Google Scholar] [CrossRef] [PubMed]
  39. Gibon, Y.; Blaesing, O.E.; Hannemann, J.; Carillo, P.; Hohne, M.; Hendriks, J.H.M.; Palacios, N.; Cross, J.; Selbig, J.; Mark, S.M. A Robot-based platform to measure multiple enzyme activities in arabidopsis using a set of cycling assays: Comparison of changes of enzyme activities and transcript levels during diurnal cycles and in prolonged darkness. Plant Cell 2004, 16, 3304–3325. [Google Scholar] [CrossRef] [PubMed]
  40. Livak, K.J.; Schmittgen, T.D. Analysis of relative gene expression data using real-time quantitative PCR and the 2△△Ct method. Methods 2001, 25, 402–408. [Google Scholar] [CrossRef] [PubMed]
  41. Yu, J.J.; Han, J.N.; Wang, R.F.; Li, X.X. Down-regulation of nitrogen/carbon metabolism coupled with coordinative hormone modulation contributes to developmental inhibition of the maize ear under nitrogen limitation. Planta 2016, 244, 111–124. [Google Scholar] [CrossRef] [PubMed]
  42. Liseron-Monfils, C.; Bi, Y.M.; Downs, G.; Wu, W.Q.; Signorelli, T.; Lu, G.W.; Chen, X.; Bondo, E.; Zhu, T.; Lukens, L.N.; et al. Nitrogen transporter and assimilation genes exhibit developmental stage-selective expression in maize (Zea mays L.) associated with distinct cis-acting promoter motifs. Plant Signal. Behav. 2013, 8, e26056. [Google Scholar] [CrossRef] [PubMed]
  43. Li, Y.J.; Wang, M.L.; Zhang, F.X.; Xu, Y.D.; Chen, X.H.; Qin, X.L.; Wen, X.X. Effect of post-silking drought on nitrogen partitioning and gene expression patterns of glutamine synthetase and asparagine synthetase in two maize (Zea mays L.) varieties. Plant Physiol. Biochem. 2016, 102, 62–69. [Google Scholar] [CrossRef] [PubMed]
  44. Pandey, R.K.; Maranville, J.W.; Chetima, M.M. Deficit irrigation and nitrogen effects on maize in a Sahelian environment II. Shoot growth, nitrogen uptake and water extraction. Agric. Water Manag. 2000, 46, 15–27. [Google Scholar] [CrossRef]
  45. Weligama, C.; Tang, C.; Sale, P.W.G.; Conyers, M.K.; Liu, D.L. Application of nitrogen in NO3- form increases rhizosphere alkalisation in the subsurface soil layers in an acid soil. Plant Soil 2010, 333, 403–416. [Google Scholar] [CrossRef]
  46. Tian, Q.; Chen, F.; Liu, J.; Zhang, F.; Mi, G. Inhibition of maize root growth by high nitrate supply is correlated with reduced IAA levels in roots. J Plant Physiol. 2008, 165, 942–951. [Google Scholar] [CrossRef] [PubMed]
  47. Danalatos, N.G.; Archontoulis, S.V. Growth and biomass productivity of kenaf (Hibiscus cannabinus L.) under different agricultural inputs and management practices incentral Greece. Ind. Crops Prod. 2010, 32, 231–240. [Google Scholar] [CrossRef]
  48. Valentinuz, O.R.; Tollenaar, M. Effect of genotype, nitrogen, plant density, and row spacing on the area-per-leaf profile in maize. Agron. J. 2006, 98, 94–99. [Google Scholar] [CrossRef]
  49. Qiao, J.; Yang, L.Z.; Yan, T.M.; Xue, F.; Zhao, D. Rice dry matter and nitrogen accumulation, soil mineral Naround root and N leaching, with increasing application rates of fertilizer. Eur. J. Agron. 2013, 49, 93–103. [Google Scholar] [CrossRef]
  50. Chen, B.M.; Wang, Z.H.; Li, S.X.; Wan, G.X.; Song, H.X.; Wang, X.N. Effects of nitrate supply on plant growth, nitrate accumulation, metabolic nitrate concentration and nitrate reductase activity in three leafy vegetables. Plant Sci. 2004, 167, 635–643. [Google Scholar] [CrossRef]
  51. Ferrari, T.E.; Yoder, O.C.; Filner, D. Anaerobic nitrite production by plant cells and tissues: Evidence for two nitrate pools. Plant Physiol. 1973, 51, 423–431. [Google Scholar] [CrossRef] [PubMed]
  52. Saiz-Fernández, I.; De Diego, N.; Brzobohatý, B.; Muñoz-Ruedad, A.; Lacuesta, M. The imbalance between C and N metabolism during high nitrate supply inhibits photosynthesis and overall growth in maize (Zea mays L.). Plant Physiol. Biochem. 2017, 120, 213–222. [Google Scholar] [CrossRef] [PubMed]
  53. Garnett, T.; Conn, V.; Plett, D.; Conn, S.; Zanghellini, J.; Mackenzie, N.; Enju, A.; Francis, K.; Holtham, L.; Roessner, U.; et al. The response of the maize nitrate transport system to nitrogen demand and supply across the lifecycle. New Phytol. 2013, 198, 82–94. [Google Scholar] [CrossRef] [PubMed] [Green Version]
  54. Sabermanesh, K.; Holtham, L.R.; George, J.; Roessner, U.; Boughton, B.A.; Heuer, S.; Tester, M.; Plett, D.C.; Garnett, T.P. Transition from a maternal to external nitrogen source in maize seedlings. J. Integr. Plant Biol. 2017, 59, 261–274. [Google Scholar] [CrossRef] [PubMed]
  55. Cren, M.; Hirel, B. Glutamine synthetase in higher plants: Regulation of gene and protein expression from the organ to the cell. Plant Cell Physiol. 1999, 40, 1187–1193. [Google Scholar] [CrossRef]
  56. Silva, I.T.; Abbaraju, H.K.R.; Fallis, L.P.; Liu, H.J.; Lee, M.; Dhugga, K.S. Biochemical and genetic analyses of N metabolism in maize testcross seedlings: 1. Leaves. Theor. Appl. Genet. 2017, 130, 1453–1466. [Google Scholar] [CrossRef] [PubMed]
  57. Zhang, N.Y.; Gibon, Y.; Gur, A.; Chen, C.; Lepak, N.; Hohne, M.; Zhang, Z.W.; Kroon, D.; Tschoep, H.; Stitt, M.; et al. Fine quantitative trait loci mapping of carbon and nitrogen metabolism enzyme activities and seedling biomass in the maize IBM mapping population. Plant Physiol. 2010, 154, 1753–1765. [Google Scholar] [CrossRef] [PubMed]
  58. Yanagisawa, S. Transcription factors involved in controlling the expression of nitrate reductase genes in higher plants. Plant Sci. 2014, 229, 167–171. [Google Scholar] [CrossRef] [PubMed]
  59. Lillo, C.; Meyer, C.; Lea, U.S.; Provan, F.; Oltedal, S. Mechanism and importance of post-translational regulation of nitrate reductase. J. Exp. Bot. 2004, 55, 1275–1282. [Google Scholar] [CrossRef] [PubMed] [Green Version]
  60. Amiour, N.; Imbaud, S.; Clement, G.; Agier, N.; Zivy, M.; Valot, B.; Balliau, T.; Armengaud, P.; Quillere, I.; Canas, R.; et al. The use of metabolomics integrated with transcriptomic and proteomic studies for identifying key steps involved in the control of nitrogen metabolism in crops such as maize. J. Exp. Bot. 2012, 63, 5017–5033. [Google Scholar] [CrossRef] [PubMed] [Green Version]
  61. Fernie, A.R.; Stitt, M. On the discordance of metabolomics with proteomics and transcriptomics: Coping with increasing complexity in logic, chemistry, and network interactions. Plant Physiol. 2012, 158, 1139–1145. [Google Scholar] [CrossRef] [PubMed]
  62. Kaiser, W.M.; Weiner, H.; Kandlbinder, A.; Tsai, C.B.; Rockel, P.; Sonoda, M.; Planchet, E. Modulation of nitrate reductase: Some new insights, an unusual case and a potentially important side reaction. J. Exp. Bot. 2002, 53, 875–882. [Google Scholar] [CrossRef] [PubMed]
  63. Kaiser, W.M.; Huber, S.C. Post-translational regulation of nitrate reductase: Mechanism, physiological relevance and environmental triggers. J. Exp. Bot. 2001, 52, 1981–1989. [Google Scholar] [CrossRef] [PubMed]
  64. Xu, T.J.; Dong, Z.Q.; Lan, H.L.; Pei, Z.C.; Gao, J.; Xie, Z.X. Effects of PASP-KT-NAA on photosynthesis and antioxidantenzyme activities of maize seedlings under low temperature stress. Acta Agron. Sin. 2012, 38, 352–359, (In Chinese with English Abstract). [Google Scholar] [CrossRef]
Figure 1. The biomass accumulation in the shoots (A) and roots (B), as well as the root/shoot ratio (C), of maize differed on the 7th day after nitrogen and polyaspartic acid (PASP) treatment. The PASP and control indicate seedlings with and without PASP addition, respectively. Data was presented as the mean ± standard error of 15 plants in each treatment. *, statistically significant differences between PASP treatment and control within each nitrogen level, according to Student’s test at p < 0.05.
Agronomy 08 00188 g001
Figure 2. Total nitrogen accumulations in the shoots (A) and roots (B) of maize on the 7th day after nitrogen and PASP treatment. The PASP and control indicate seedlings with and without PASP addition, respectively. Data rewash presented as the mean ± standard error of 15 plants in each treatment. *, Statistically significant differences between PASP treatment and control within each nitrogen level, according to Student’s test at p < 0.05.
Agronomy 08 00188 g002
Figure 3. Changes in leaf nitrate reductase activities on the 1st (A), 3rd (B), and 7th (C) day after PASP treatment. The PASP and control indicate seedlings with and without PASP addition, respectively. Data were presented as the mean ± standard error of 15 plants in each treatment. *, Statistically significant differences between PASP treatment and control within each nitrogen level, according to Student’s test at p < 0.05.
Agronomy 08 00188 g003
Figure 4. Changes in root nitrate reductase activities on the 1st (A), 3rd (B), and 7th (C) day after PASP treatment. The PASP and control indicate seedlings with and without PASP addition, respectively. Data were presented as the mean ± standard error of 15 plants in each treatment. *, Statistically significant differences between PASP treatment and control within each nitrogen level, according to Student’s test at p < 0.05.
Agronomy 08 00188 g004
Figure 5. Relative expression of ZmNR1, ZmNR2, ZmNR3, and ZmNR4 in the leaves on the 1st, 3rd, and 7th day after PASP treatment. Data were presented as the mean of 15 plants in each treatment. ns, *, **, and ***, Statistically significant differences according to multiple analyses at p > 0.05, p < 0.05, p < 0.01, and p < 0.001. N0, N0.5, N1, N2, and N4 indicate the seedlings treated with 0, 0.5, 1.0, 2.0, and 4.0 mmol L−1 of NO3 without PASP treatment, respectively. N0P, N0.5P, N1P, N2P, and N4P indicate the seedlings treated with 0, 0.5, 1.0, 2.0, and 4.0 mmol L−1 of NO3 plus PASP addition, respectively.
Agronomy 08 00188 g005
Figure 6. Relative expression of ZmNR1, ZmNR2, ZmNR3, and ZmNR4 in the roots on the 1st, 3rd, and 7th day after PASP treatment. Data were presented as the mean of 15 plants in each treatment. ns, *, **, and ***, Statistically significant differences according to multiple analyses at p > 0.05, p < 0.05, p < 0.01, and p < 0.001. N0, N0.5, N1, N2, and N4 indicate the seedlings treated with 0, 0.5, 1.0, 2.0, and 4.0 mmol L−1 of NO3 without PASP treatment, respectively. N0P, N0.5P, N1P, N2P, and N4P indicate the seedlings treated with 0, 0.5, 1.0, 2.0, and 4.0 mmol L−1 of NO3 plus PASP addition, respectively.
Agronomy 08 00188 g006
Figure 7. Leaf nitrate reductase (NR) protein content analysis by ELISA on the 1st (A), 3rd (B), and 7th (C) day after PASP treatment. The PASP and control indicate seedlings with and without PASP addition, respectively. Data were presented as the mean ± standard error of 15 plants in each treatment. *, Statistically significant differences between PASP treatment and control within each nitrogen level, according to Student’s test at p < 0.05.
Agronomy 08 00188 g007
Figure 8. Root NR protein content analysis by ELISA on the 1st (A), 3rd (B), and 7th (C) day after PASP treatment. The PASP and control indicate seedlings with and without PASP addition, respectively. Data were presented as the mean ± standard error of 15 plants in each treatment. *, Statistically significant differences between PASP treatment and control within each nitrogen level, according to Student’s test at p < 0.05.
Agronomy 08 00188 g008
Table 1. Primers for the qPCR.
GeneGene IDForward Primer (5′-3′)Reverse Primer (5′-3′)
ZmNR1GRMZM2G568636ATGATCCAGTTCGCCATCTCGTCCGTGGTACGTCGTAGGT
ZmNR2GRMZM2G428027AGCAAGTCTTGAGGGAGCACCGCCTTGCATGACATTCGTT [41]
ZmNR3GRMZM5G878558ACTGGTGCTGGTGCTTCTGGTCCATGCCGATCTCGCCCTTGTGC [42]
ZmNR4GRMZM2G076723GCGTGCAGTTTCAATTCGGTAGCTATTCCCCGTTGCCATC
actinXM_008656735GATTCCTGGGATTGCCGATTCTGCTGCTGAAAAGTGCTGAG [43]
Table 2. Multiple analyses of enzyme activities correlated to nitrogen metabolism in maize seedlings leaves and roots at the 1st, 3rd, and 7th day after PASP treatment.
PartsSource of VariationDays after PASP Treatment
1d3d7d
NRGSAspATAlaATNRGSAspATAlaATNRGSAspATAlaAT
LeavesNO3*************nsns*********
PASP***ns**ns**nsnsns**nsnsns
NO3 × PASP***nsnsns**ns*****nsnsns
RootsNO3******ns*********ns************
PASP***nsns*nsnsnsns*****ns*
NO3 × PASP***nsnsnsnsnsns*****nsns*
Note: ns, no significant difference, * p < 0.05, ** p < 0.01, ***p < 0.001.

