GainTKW: A Measurement System of Thousand Kernel Weight Based on the Android Platform


1
College of Biosystems Engineering and Food Science, Zhejiang University, Hangzhou 310058, China
2
Key Laboratory of Spectroscopy Sensing, Ministry of Agriculture, Hangzhou 310058, China
*
Author to whom correspondence should be addressed.
Agronomy 2018, 8(9), 178; https://doi.org/10.3390/agronomy8090178
Submission received: 11 July 2018
/
Revised: 17 August 2018
/
Accepted: 3 September 2018
/
Published: 10 September 2018
(This article belongs to the Special Issue Precision Phenotyping in Plant Breeding)
Abstract
:Thousand kernel weight (TKW) is an important parameter for the evaluation of grain yield. The traditional measurement method relies on manual steps: weighing and counting. In this paper, we developed a system for the automated evaluation of thousand kernel weight that combines a weighing module and Android devices, called “gainTKW”. The system is able to collect the weight information from the weighing module through a serial port using the RS232-micro USB cable. In the imaging process, we adopt a k-means clustering segmentation algorithm to solve the problem of uneven lighting. We used the marker-controlled watershed algorithm and area threshold method to count the number of kernels that are touching one another. These algorithms were implemented based on the OpenCV (Open Source Computer Vision) libraries. The system tested kernel images of six species taken with the Android device under different lighting conditions. The algorithms in this study can solve the segmentation problems caused by shadows, as well. The appropriate numbers of kernels, of different species, are counted with an error ratio upper limit of 3%. The application is convenient and easy to operate. For the experiments, we can prove the efficiency and accuracy of the developed system by comparing the results between the manual method and the proposed application.
1. Introduction
As a complex agronomic trait, grain yield is multiplicatively determined by three components: the number of spikes per area, grain number per spike, and grain weight. Grain weight is usually represented by 1000-kernel weight. Thousand kernel weight (TKW) is an important parameter for the evaluation of variety breeding. TKW is not only directly related to the grain yield and milling quality of grain, but also has an impact on the seedling vigor and growth indirectly affecting the yield [1]. TKW was also found to be closely associated with kernel size traits as well, such as kernel length (KL), kernel width (KW), kernel thickness (KT), and the kernel length/width ratio (L/W) [2]. As a result, TKW is frequently used in crop research as a measurement indicator [3].
The measurement of the thousand kernel weight includes weighing and counting the kernels. Weight data is obtained from scales and traditional methods based on manual counting are used to count the kernels [4]. As manual counting is time-consuming and labor-intensive with subjective results, electronic counting devices [5] are also commonly used. The machine is accurate at slow speeds but cannot ensure precision at higher speeds. In addition, the machine cannot handle a wide range of kernel sizes and is noisy. The counting machine equipped with a laser can overcome these shortcomings but it is expensive, bulky and can only be used in laboratories. The operation is also complex and cumbersome. A less costly and easier to implement a method to count the kernels is image processing technology [6]. It can achieve satisfactory results if the recognition algorithm is efficient enough.
This study solves the counting problem using the image processing method. Counting kernels using on image processing occurs in two steps. First is the image segmentation that separates the kernels from the image background. Then the kernels themselves are separated so that the number of kernels can be calculated. Good image segmentation is the foundation of the counting accuracy. There are many segmentation algorithms such as threshold [7], edge detection [8] and clustering [9]. The touching kernels increase the difficulty of counting the kernels correctly. In order to solve this problem, different methods of separating touching kernels have been reported in the literature, such as the morphological operations [10], the ellipse fitting algorithm [11,12], the concave points matching algorithm [13,14] and the watershed segmentation algorithm [15]. The morphological method is simple but the frequency of erosion and dilation is dependant on human experience [10]. The ellipse fitting algorithm is time-intensive and does not perform well on elongated shapes [12]. The concave points matching algorithm is prone to oscillation and the results presented are poor when separating more than three touching kernels [14]. The watershed algorithm is a widely-used segmentation method that uses local gradient difference in touching areas and identifies dividing lines through a simulation process of water flooding, from kernel areas under the pixel gradient constraints. The traditional watershed algorithm is prone to over segmentation [16]. Kernel segmentation and separating algorithms based on image processing are mostly performed on a computer or laptop, which can be inconvenient [17]. With the development of mobile intelligent terminals, mobile devices have changed the way of living and people’s behaviors. Modern mobile devices contain digital cameras with high resolution. The Android mobile phone platform provides third-party developers with a wide ranging, free environment, allowing users to capture and process images wherever necessary. A number of applications on mobile devices have been developed for agricultural applications, such as grain phenotyping [18], estimating citrus yield [19], identifying plant species [20], weed identification [21], estimating soil-color [22] and so on.
The goal of the present work was to develop a convenient, efficient and reliable system that was able to perform an automated calculation of the thousand kernel weight using a weighing module and Android devices, called “gainTKW”. The system counts the number of the kernels and weighs them. The Android application will get the weight information from the weighing module through a serial port. In the counting part, to eliminate the influence caused by shadow, we chose the k-means clustering algorithm instead of the traditional threshold algorithm to segment the object from the background. For counting the touching kernels, we used the marker-controlled watershed algorithm to avoid over-segmentation. Because the complex touching conditions of kernels cannot be divided well by the improved watershed algorithm, we used an area threshold method to calculate the number of kernels in clusters.
2. Materials and Methods
2.1. Materials Preparation
To test the system’s performance, we chose six species of kernels with differences in color, shape, and size. They were Indica rice (Oryza sativa L.), adzuki bean (Vigna angularis (Willd.) Ohwi & Ohashi), mung bean (Vigna radiata L.), soybean (Glycine max (L.) Merr.), peanut (Arachis hypogaea L.) and sesame (Sesamum indicum L.). The Indica rice had an average length of ~10 mm, a width of ~3 mm, and a yellow coloration. The adzuki bean had an average diameter of ~5 mm and a red coloration. The mung bean had an average diameter of ~4 mm and a green coloration. The soybean has an average diameter of ~6 mm and a yellow coloration. The peanut had an average length of ~13 mm, a width of ~7 mm and a red coloration. The sesame had an average length of ~3 mm, a width of ~2 mm and a black coloration. The experiments were carried out using a Nexus 7 on a clear day indoors. The devices were separately used to acquire and analyze 60 images of 6 different species (10 images per variety).
2.2. System Design
The whole system consists of two hardware parts: an Android device and a weighing module. The experimental setup is shown in Figure 1. In this study, as an example, we used the Google Nexus 7 tablet. The tablet incorporates a Qualcomm Snapdragon S4 Pro 1.3 GHz high-speed 4-core CPU and its memory is 2 GB. It also has a 120 megapixel video camera and an LED flashlight. To test the performance of the application, we used the Huawei P9 mobile phone purchased from Huawei Technologies Co., Ltd. (Shenzhen, China). The mobile phone incorporates a Hisilicon Kirin 955 2.5 GHz high-speed 8-core CPU and its memory is 3 GB. It has a 1200 megapixel video camera and an LED flashlight.
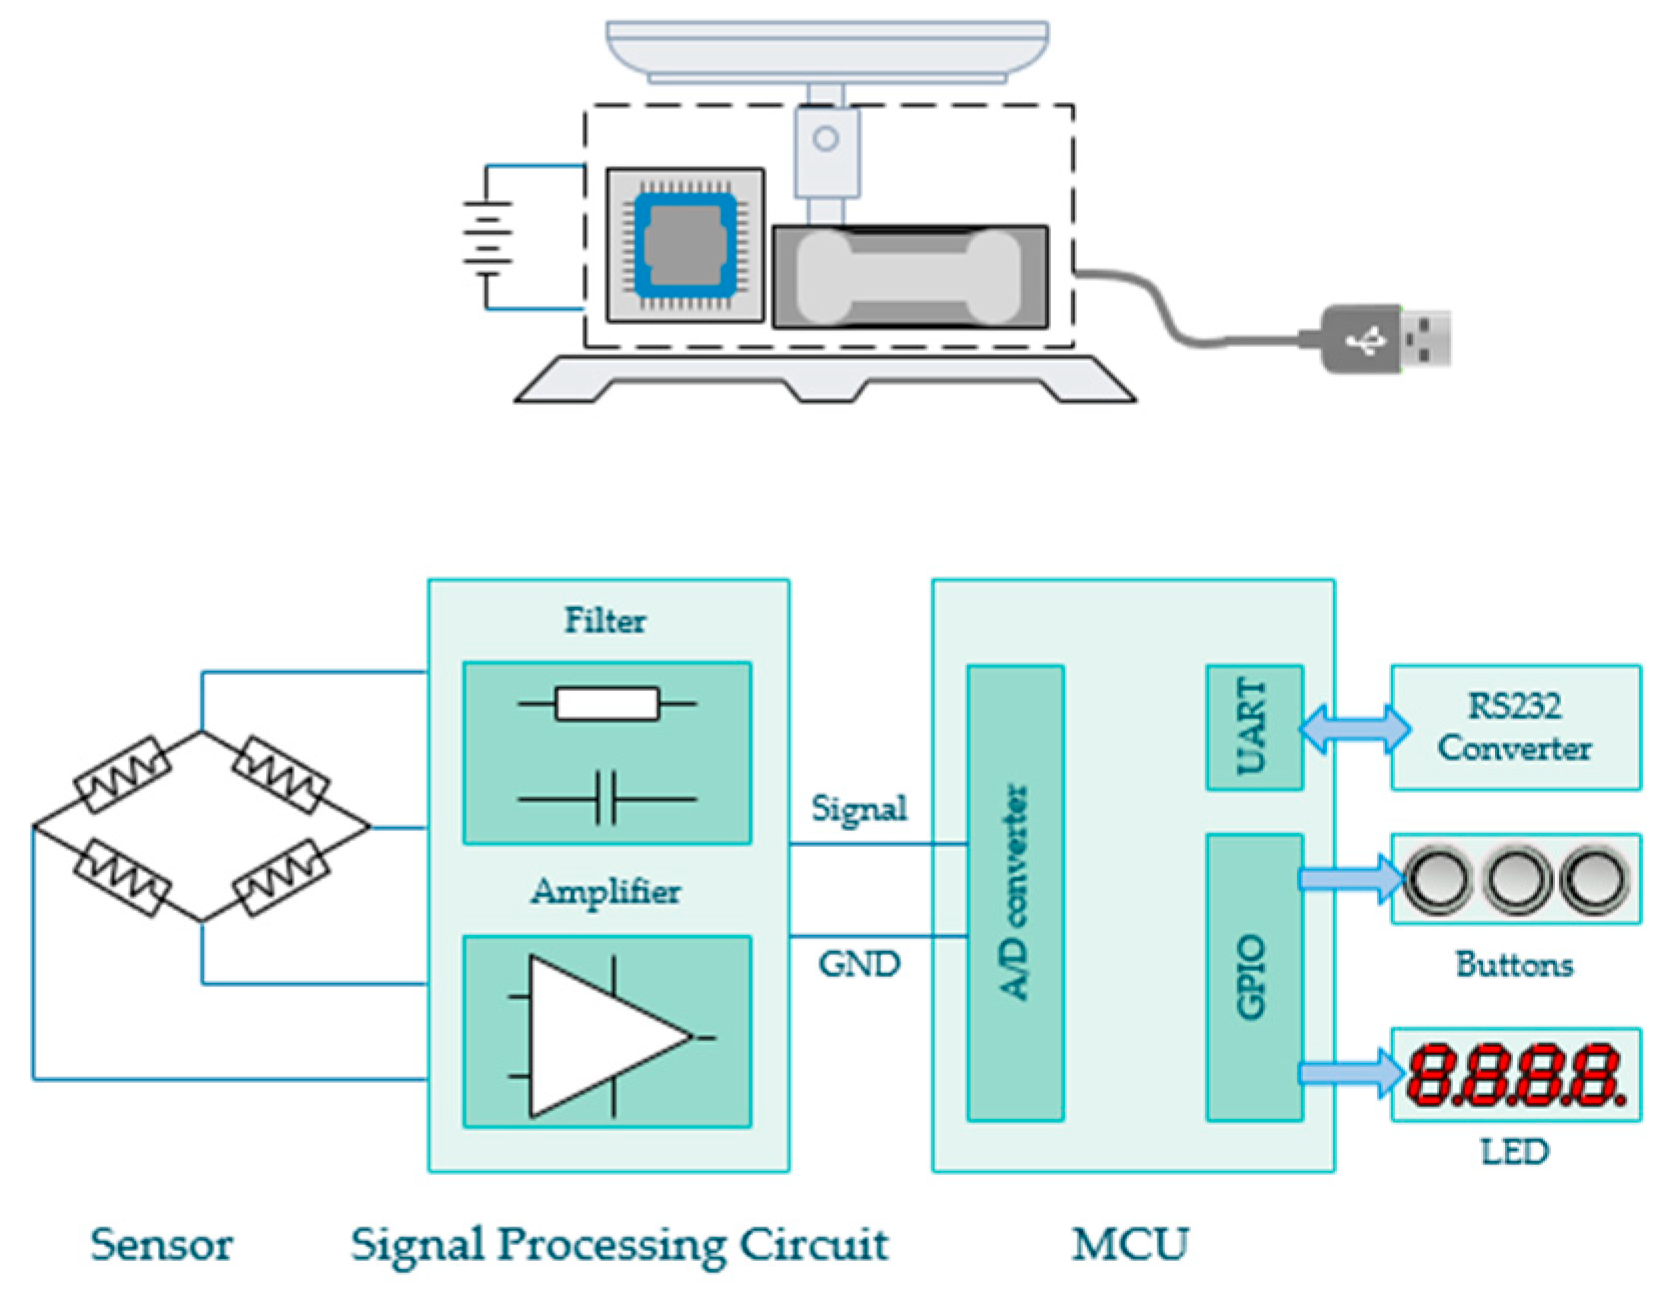
In order to gain an accurate measurement of grain weight, we designed the weighing module for high performance. Its structure diagram is shown in Figure 2. The resistance strain type pressure sensor is the core of the weighing system. It produces a voltage signal output when subjected to pressure. A digital signal processing circuit consisting of filters and an amplifier was designed to eliminate interference and amplify the signal. A microcontroller is then used to read the processed voltage signal through the embedded AD converter. Then the weight of the grains can be calculated. The measurement result is displayed by LED segment displays and output via USB interface. The electronic balance’s maximum weighing is 110 g and the resolution is 0.01 g.
2.3. Development Tools
The application was developed using Google’s own Android IDE, Android Studio. The IDE is based on the popular IntelliJ IDEA from JetBrains and is being offered by Google for free. Compared to Eclipse, there are several main differences.
- Build Tools: Android Studio utilizes the fast growing Gradle build system. Eclipse, on the other hand uses Apache Ant as its main build system.
- Advanced Code Completion/Refactoring: Both IDEs feature the standard Java code auto completion but in the case of Android Studio, Google has baked in deeper support for specific Android code and refactoring. Android Studio can refactor your code in places where it’s just not possible using Eclipse and ADT.
- Project Organization: Both IDEs work differently in an effort to help you manage and organize your projects. When using Eclipse you must be familiar with the concept of workspaces, but Android Studio introduces the concept of modules.
- IDE Performance/Stability: Eclipse is a purely Java based software, and needs high amounts of Ram and CPU power to run reliably. Android Studio is a more stable and lightweight IDE.
The Android operating system provides outstanding accessibility advantages. However, it still has certain limitations in terms of efficiency and versatility for the needs of this work, especially for the implementation of the image processing algorithms. In this respect, OpenCV (Open Source Computer Vision Library) is a highly optimized library written in C/C++, which offers a wide catalog of image processing and analysis functions. Android applications are mainly developed in Java, with an existing Android version of this library called OpenCV4Android (http://opencv.org/platforms/Android.html). Figure 3 shows the “gainTKW” system implementation flow.
2.4. Image Processing
2.4.1. Kernels Segmentation
According to the traditional image processing steps, after obtaining the image we transformed it from RGB to gray. The gray image was smoothed by Gaussian filtering [23,24] (sigma = 1.5, template size = 4 × 4) to improve operational efficiency. Then the Otsu segmentation algorithm [7,25,26] was applied, by which a maximum contrast between the kernels and the image background was created to ensure the extraction of intact kernels.
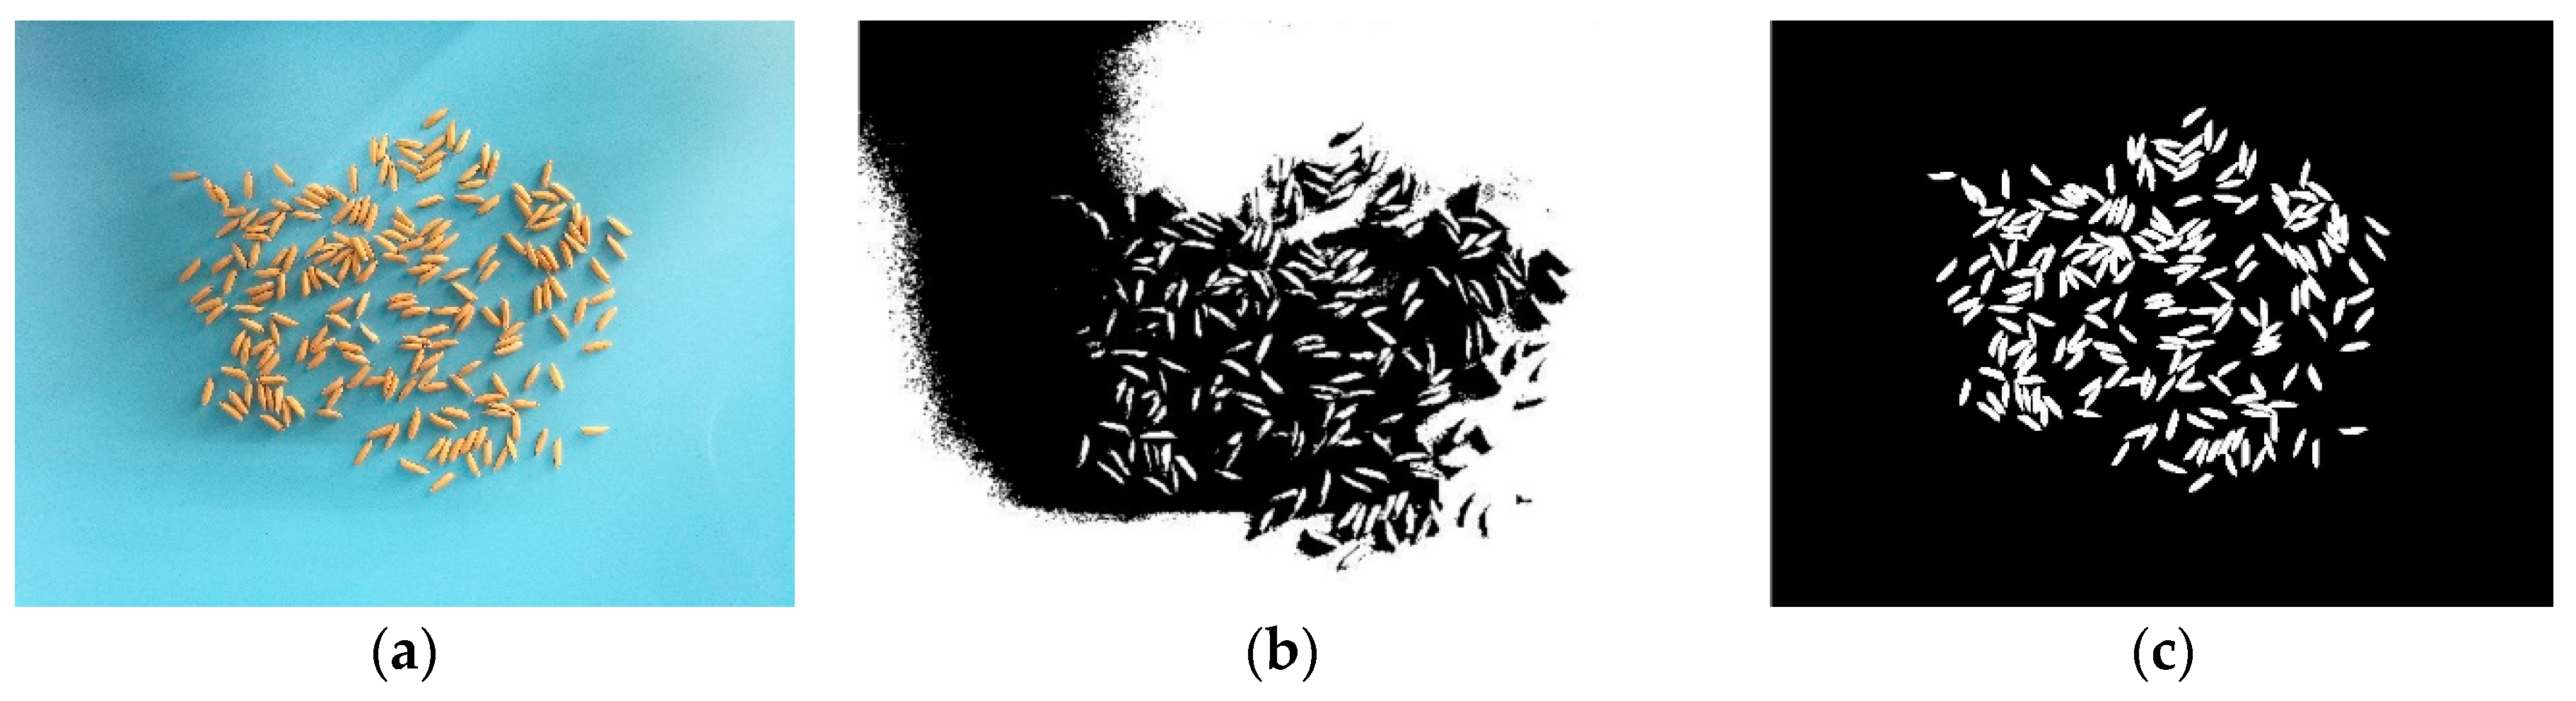
Interference from uncontrolled or uneven lighting is the most basic challenge for smartphone optical sensing [27]. Because of the problem caused by shadows, the traditional method could not segment the object appropriately. Hence, in this study, a K-means clustering-based algorithm was utilized to segment the image. As the most widely used partition algorithm, K-means is one of several clustering algorithms. Algorithm 1 shows the flow diagram of the K-means clustering algorithm. K-means clustering needs to specify the number of clusters to be partitioned and a distance metric to quantify how near the two classes are to each other. The basic idea is that the given cluster number is k, and the result of clustering the sample set is k clustering centers. The final clustering result is done by minimizing the sum of squares of distances between the data objects and the corresponding region. The kernels have their own color, different from the background, thus the number of clusters should be two.
| Algorithm 1 K-means algorithm |
| Input: K (number of clusters), Training set x(1), x(2), …, x(m) |
| Randomly initialize K cluster centroids μ1, μ2, …, μK |
| repeat |
| // cluster assignment step: find closest centroid |
| for i = 1 to m data points do |
| c(i): = index of cluster centroid closest to x(i) |
| end for |
| // update centroid step: compute means based on assignment |
| for k = 1 to K centroid do |
| μ: = average(mean) of points assigned to cluster k |
| end for |
| until N iterations |
| Output: centroids assignments c(1), c(2), …, c(m), and learned centroids μ1, μ2, …, μK |
In order to minimize the effect caused by the light variation during capturing the original image, in this study, we processed the images in the CIE L*a*b color space [28]. The ‘L’ means color space dimension for light, ‘*a’ means color space dimension for red-green, ‘*b’ means color space dimension for yellow-blue. The RGB values are transformed to CIE tristimulus values as follows:
The CIE L*a*b equation is then applied. This involves the evaluation of cube roots.
where
First, the application read the image and transformed it into the CIE L*a*b color space, then applied the K-means clustering algorithm in ‘a*b*’ space to generate the different regions and finally selected the segmented image containing kernels to finish the binarization process. We applied the morphology opening operation to eliminate the noise existing in the binary image. Figure 4 shows the results of Otsu segmentation algorithm and K-means clustering segmentation algorithm.
2.4.2. Counting Method
After getting kernel binary images, the number of kernels was counted. In general, conventional kernel segmentation methods sometimes could not separate kernels completely because of the touching kernels. In this study, we chose the watershed segmentation algorithm to separate touched kernels. The watershed algorithm is a technique that makes use of image gradient cues to segment images. To begin with, the process of watershed segmentation started with the Euclidean distance map for each of the pixels followed by the determination of maxima points which are also called ultimate eroded points. Then we started flooding from each of these maxima points, to segment and separate the kernels from each other. Finally, we counted the number of kernels.
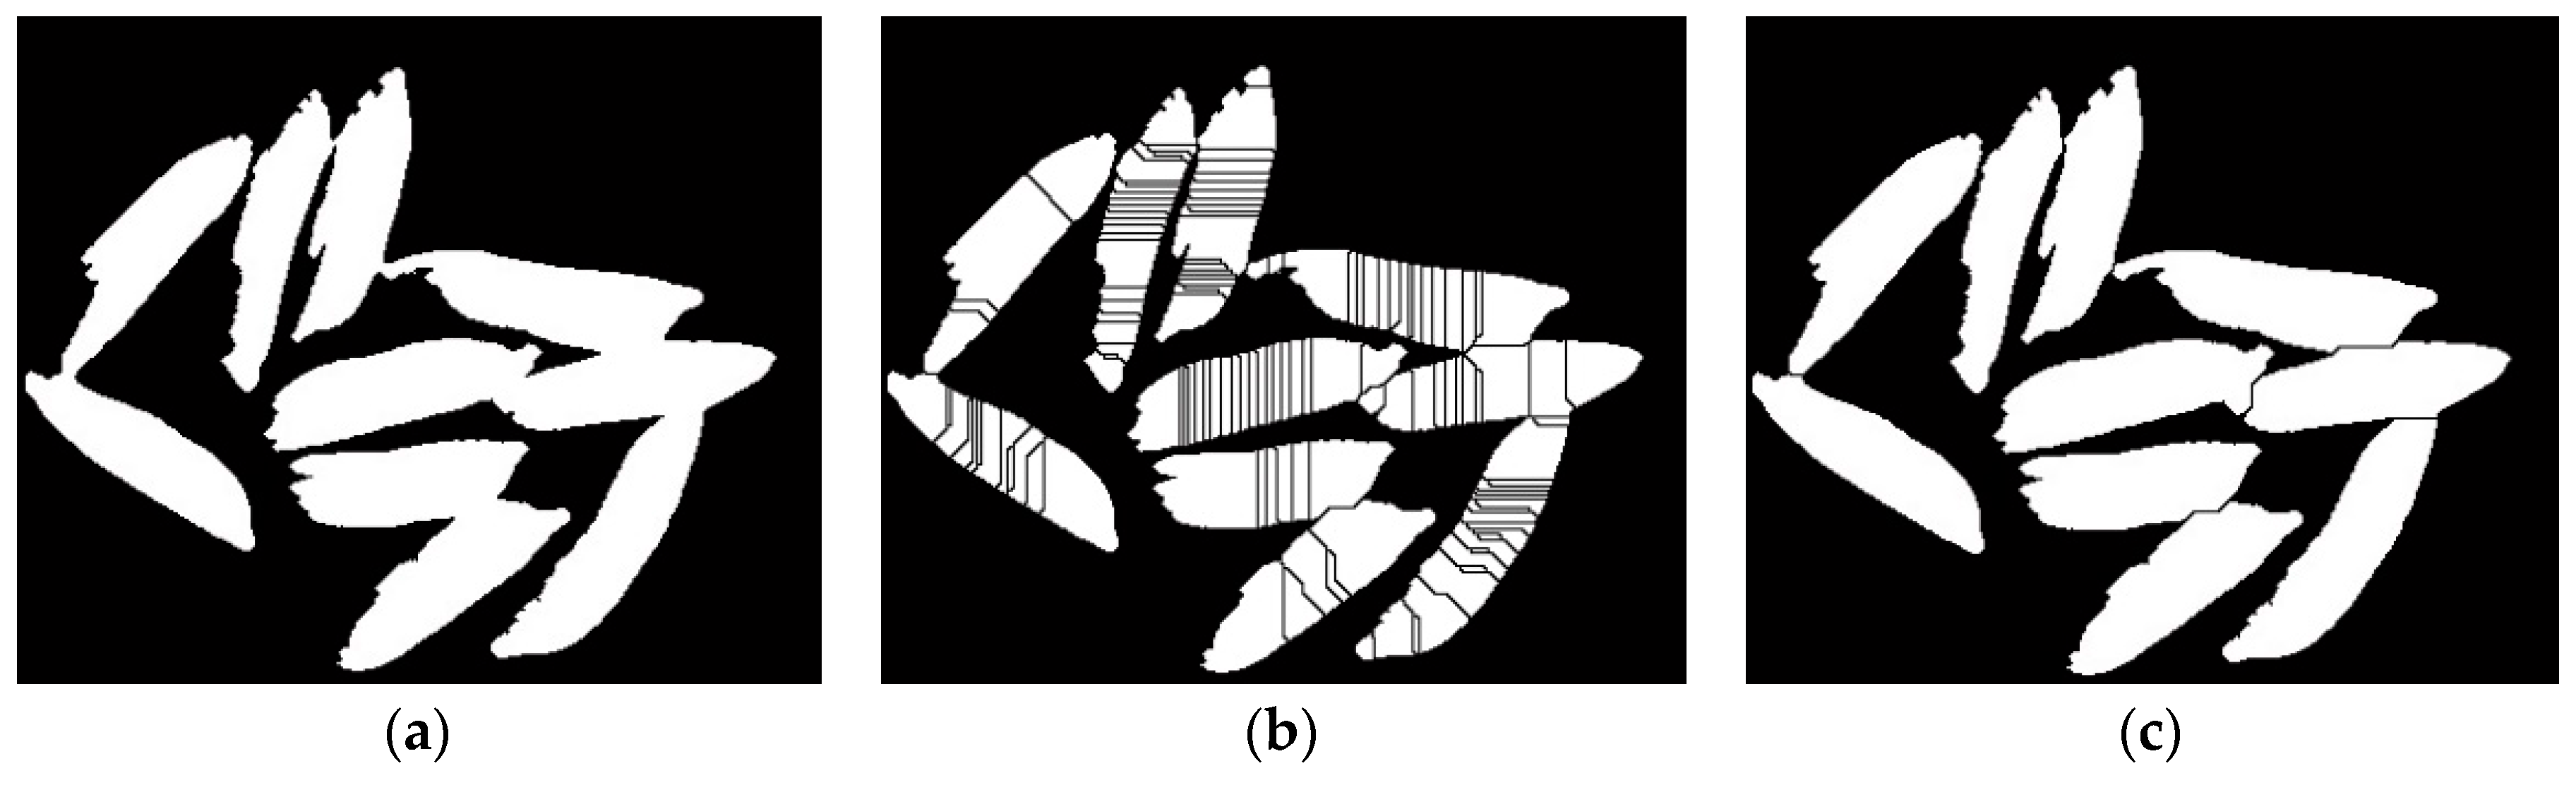
Though the watershed segmentation algorithm was relatively effective in separating the objects in the image, in some cases we did not have the most accurate characterization. We had two cases where the segmentation algorithm was inefficient. In the first case, a single kernel was split into several kernels. In the other case, multiple kernels which were touching each other were combined to form a single kernel. For the first case, we applied the marker-controlled watershed algorithm [29]. The algorithm simulates flooding from the markers and inflates the regions according to the increasing values of a priority map until the regions extend to the watershed lines. In this method, the number of separated particles is the same as the number of labeled markers, so the simple touching kernels can be separated well. Figure 5 shows a representative binary image with traditional and marker-controlled watershed segmentation algorithm results (using mung beans images as an example). For the second case, we chose the area threshold method to segment the kernels. First, we calculated the area of all the contours in a binary image and saved them in a list. Then we sorted the list and found the median area of the contours. Because the image process might slightly destroy the contours edge and affect the original area, we chose the 1.2 times median area as the threshold. If the contour’s area was smaller than the threshold, we thought of it as a single kernel, otherwise, we divided the area by the threshold and rounded the result, which was the number of the touching kernels. At the same time, the touching area was outlined in red and the number of the kernels was displayed in the center of the touching area. Combining the marker-controlled watershed algorithm and area threshold method, we can calculate the number of kernels in the image. Figure 6 shows the counting result after using the area threshold method.
3. Results
3.1. Description of Application’s Performance
“GainTKW” was designed to be used by all kinds of smartphone users. It was achieved by following two decisions. (1) Implementation of a simple and friendly graphical user interface. The interface shows only the relevant information to the users, using symbols or illustrations instead of descriptive text. (2) Linear execution. It allows users to utilize the application without any knowledge about its internal performance.
The interface is designed for simplicity and convenience. Figure 7 shows an illustrated flow-chart diagram of the application, in which the application has three main functions. (1) Image source selection function. The button ‘Open Camera’ is used to capture real-time images. The button ‘Open Album’ is used to select local images to process. The selected image will be displayed on the top of the application. (2) Kernel counting function. The button ‘Count’ is used to count the number of grains in the on-screen image and display the number. The image processing algorithm mentioned above will be run. (3) Thousand kernel weight calculating function. The button ‘Calculate’ is used to calculate the thousand kernel weight using the weight value and number value. Users can also manually enter the weight and number to the application and the result will be calculated.
3.2. Evaluatio of Application’s Performance
The way to calculate the thousand kernel weight is by counting and weighing the samples. In general, we selected some kernels from the sample randomly and recorded the weight as m0 and the amount as N. The thousand kernel weight is calculated into the following formula (result in gram).
Since the accuracy of the application was mainly determined by the accuracy of the counting result, we did experiments on the different species of kernels to evaluate the accuracy of the application. The error ratio ((estimated number − true number)/true number) was used to evaluate the accuracy of the proposed algorithm. The closer the error ratio is to zero, the higher the counting accuracy is. The designed kernel counting method and current main methods were using samples with different species and numbers of kernels. For all the datasets we have manually counted the number of kernels in each of the images and, compared it with the number of kernels detected by the proposed algorithm.
The application’s performance was evaluated with a triple target: the assessment of its ability to accurately count different species of kernels under different light conditions and the comparison of its computational efficiency using the smartphone’s cameras.
3.2.1. Performance Evaluation under Different Light Conditions
In order to test the counting accuracy of the application under different lighting conditions, we designed three experimental conditions. They were as follows: natural lighting (L1); Android device’s flash lamp on (L2); an artificial lighting under the Android device (L3). The sheet was placed on a table with a dark top, and the experiments were performed in the room on a clear day. Details of the experimental conditions are listed in Table 1.
We tested the application on two different Android devices (shown in Table 2) under three light conditions mentioned above. Figure 8 shows the counting results of the app under different light conditions. It indicates that using the algorithm in this study could segment the object well from the background. The binary images have nearly no difference. Since the counting process is based on the binary images, the same binary image could lead to the same count result. So the different lighting conditions have little effect on the counting error ratio.
3.2.2. Performance Evaluation on Different Species of Kernels
The details about the datasets and the counting results are presented in Table 2. The equation of error ratio is as follows. The N0 is the number of kernels calculated by the algorithm mentioned above. The N is the number of kernels counted manually.
Among different species of kernels, the error ratio increased as the number of kernels increased. The accuracy of the algorithm mentioned above mainly depends on the complexity of the touching kernels. When the number of kernels increased, the likelihood of the complex touching conditions rises too. Among these kernel species, the average error ratio of the sesame is the highest, because of its small area and irregular shape. We also found that the error ratios of the soybeans were lower than other kernels, which might be explained by its more regular shape than other species of kernels.
To determine the suitable cases for the algorithm to be used, we used a line chart to display the correlation between kernel number and error ratio, shown in Figure 9. We used the experiments under L1 lighting condition with HUAWEI P9. The number of kernels is from 1 to the maximum number that can be placed on the A4 (background-size) paper. The maximum number of Indica rice, adzuki bean, Mung bean and sesame is around 1200. The maximum number of soybean is around 900 and peanut is around 700. Because the error rates for image-based kernel counting typically increase as the number of kernels per image increase, because the frequency of overlap among the kernels increases. It is necessary to determine for each species the maximum number of kernels that can accurately be counted within a single image. In consideration of the accuracy and practical application, we chose 3% as the upper limit. In this case, the suitable number of kernels to count is different between species. The suitable number of the Indica rice is within 450, adzuki bean is within 500, mung bean is within 400, soybean is within 900, sesame is within 300, peanut is within 250. To ensure the credibility of the TKW parameter, the minimum number should be 100. The average TKW parameters of different species of kernels are shown in Table 3. The average TKW parameter can be calculated as following. For every species of kernels, the tkw is the thousand kernel weight calculated by the “gainTKW” in an experiment, the n is the number of the experiments.
3.3. Application’s Computational Efficiency Study
We tested the software running time on six species of kernels and the application was installed on Huawei P9. To accomplish a rigorous and accurate comparison, all devices analyzed exactly the same image. The kernel images were acquired with the Huawei P9 using the common Android camera application. For standardizing the state of the smartphones and minimizing the interference of other applications or services installed, the following testing protocol was defined and followed to carry out the test:
- Closing all recent applications in the device.
- Re-starting the device.
- Selecting the flight mode.
- Waiting for 40 s for the operating system to completely load.
- Starting the “gainTKW” application.
- Running the tests 3 times.
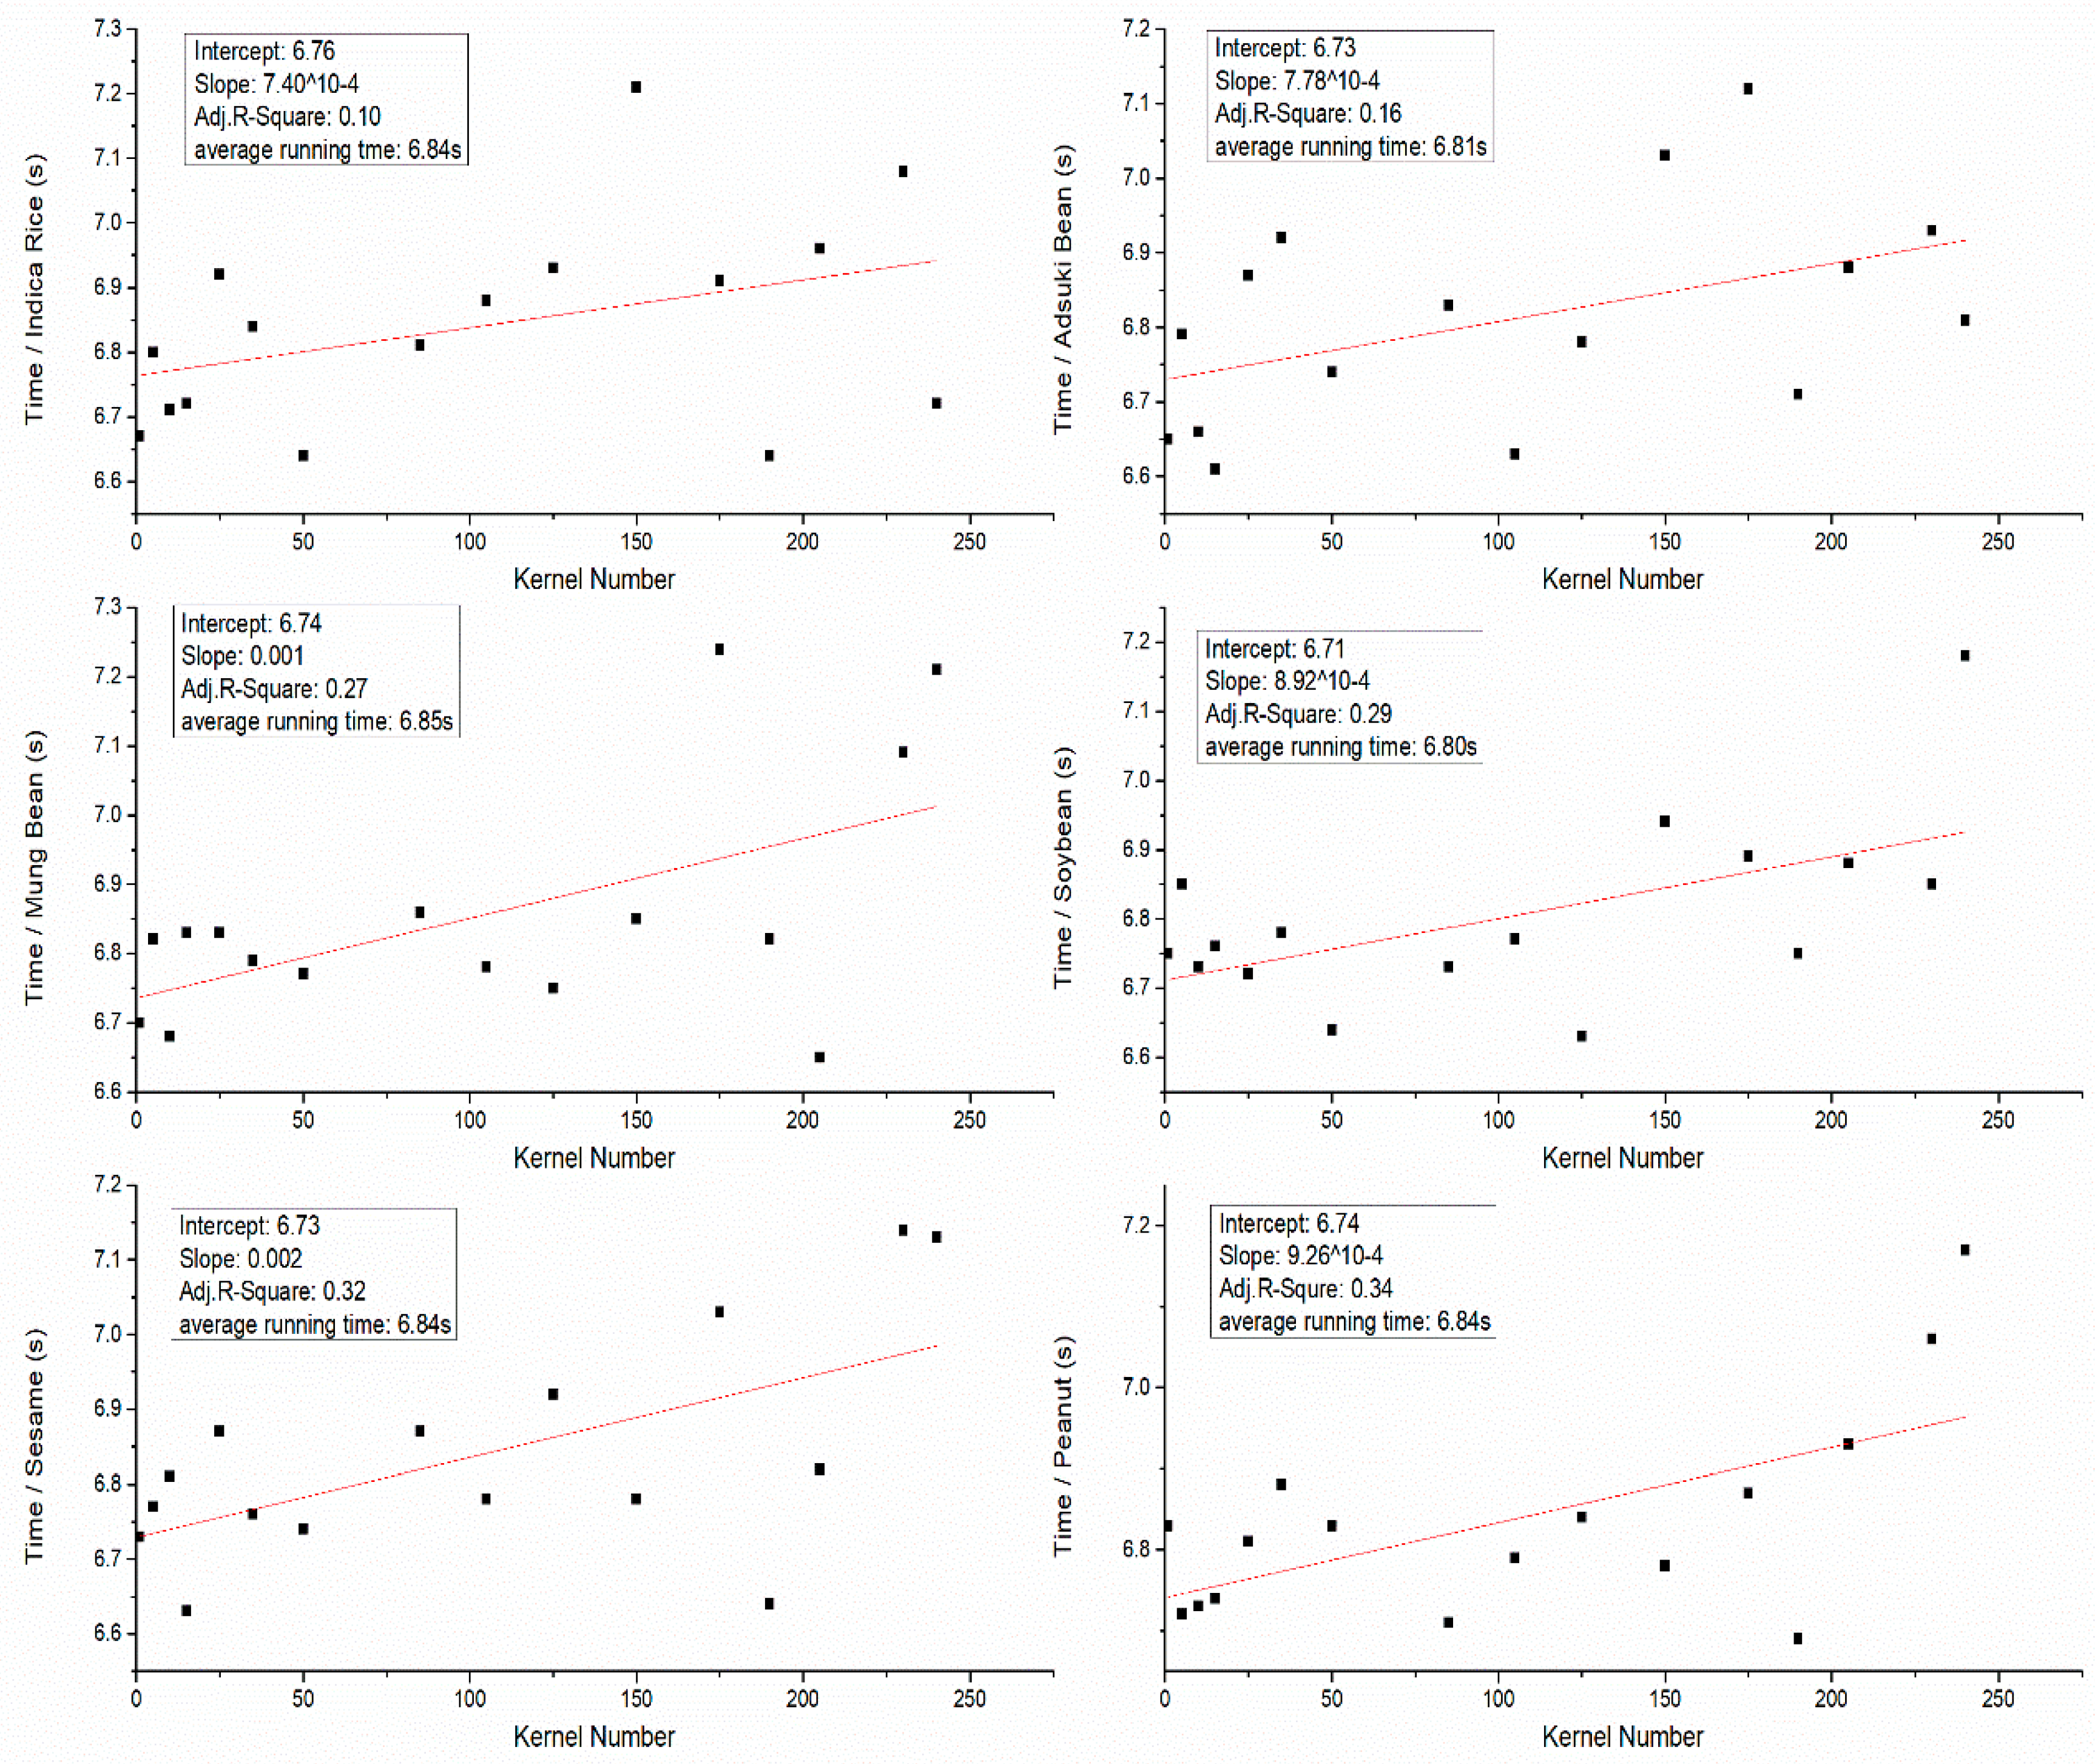
Finally, the definitive computation time for an image was calculated as the average time taken for its analysis in the three performed iterations. Results of linear regression are shown in Figure 10. On the one certain device, results indicate a positive moderate linear relationship between running time and the number of kernels. Since the slopes are nearly zero and the adjust R-squares are below 0.4. We did the one-way analysis of variance (ANOVA) to determine the effect of different species of kernels on running time. The result indicated that the running time was not significantly affected by the different kinds of kernels (p-value = 0.85). Statistical analyses were performed by SPSS 15.0 (SPSS Inc., Chicago, IL, USA). The running time of the Huawei P9 is about 6.8 s.
4. Discussion
This study aimed to develop a measurement system of thousand kernel weight based on the Android platform through image analysis. To reduce the effect of uneven lighting on the result, we used k-means clustering segmentation algorithm. To solve the difficulty of counting the touching kernels, we combined the marker-controlled segmentation algorithm and the area threshold method.
In the kernel segmentation stage of analysis, we transferred the image into a different color space to separate the luminance and chrominance signals. There are several color spaces that could be chosen like CIE L*a*b, YCbCr (Y—luminance, Cb—blue difference, Cr—red difference), HSV (Hue, Saturation, Value). The k-means clustering segmentation algorithm under these color spaces can segment the kernels from the background well. In the counting part, since the morphological operations would destroy the shape of kernels and the ellipse fitting algorithm is complex and time-consuming, we proposed an algorithm that combines the marker-controlled watershed segmentation algorithm and the area threshold method. The method is simple, efficient and adaptable to separate the touching kernels.
Current kernel counting tools, besides manual counting, rely mainly on desktop counting equipment (http://www.shuliyi.com/html/products/71.html). The products include mainframe, stock pan, and feeder. The counting speed is 1000–2000 kernels per minute. The optical-electrical sensors are used to count the kernels. The equipment is expensive and the machine cannot be carried conveniently. It is suitable for large-scale kernel counting. Kernel counting based on image analysis is usually performed on a personal computer [30,31]. These analyses pay more attention to phenotyping. When capturing images, users should minimize contact between grains. The background and the light conditions should also be controlled. Some mobile phone applications [18,32] have been developed but also did not solve the uneven lighting problem well.
The system “gainTKW” can get the thousand kernel weight information through mobile phone in an image and solve the uneven lighting problem as well as improve the counting accuracy. This system can reduce the cost of kernel counting and can be a valuable tool for farmers and researchers.
5. Conclusions
This paper presents a measurement system of thousand kernel weight based on the Android platform, called “gainTKW”, which provides agricultural practitioners with a powerful tool for easily and automatically assessing thousand grain weight and providing useful information for yield estimation.
To test the accuracy of the algorithm, we performed a series of image analysis experiments using two types of Android devices with six species of kernels under three different lighting conditions. Since that error rates for image-based kernel counting typically increase as the number of kernels per image increase, because the frequency of overlap among the kernels increases. Because of this, and because of differences in kernel size and shape among different species, it is necessary to determine for each species the maximum number of kernels that can accurately be counted within a single image. Choosing 3% as the upper limit of the error ratio, the suitable number of kernels to count is different between species. The suitable number of the Indica rice is within 450, adzuki bean is within 500, mung bean is within 400, soybean is within 900, sesame is within 300, and peanut is within 250. There are several approaches suggested to improve image quality and counting accuracy, some of which require add-on devices (enclosed lighting and imaging attachments) to enhance the sensitivity of the camera.
Our results demonstrate that the accuracy and efficiency of “gainTKW” is comparable with those obtained using desktop PC/scanner/camera equipment, and even with modest devices, the application can be effective and reliably operated at high rates of applicability and performance.
Author Contributions
Conceptualization, W.W. and Z.Q.; Data curation, W.W. and L.Z.; Formal analysis, W.W.; Funding acquisition, Z.Q. and Y.H.; Methodology, W.W., L.Z. and J.C.; Project administration, Z.Q.; Resources, Z.Q.; Software, W.W. and J.C.; Supervision, Z.Q. and Y.H.; Validation, W.W. and L.Z.; Writing—original draft, W.W.; Writing—review & editing, Z.Q. All authors reviewed the manuscript.
Funding
This study was supported by China national key research and development program (2016YFD0700304).
Conflicts of Interest
The authors declare no conflict of interest.
References
- Botwright, T.L.; Condon, A.G.; Rebetzke, G.J.; Richards, R.A. Field evaluation of early vigour for genetic improvement of grain yield in wheat. Aust. J. Agric. Res. 2002, 53, 1137–1145. [Google Scholar] [CrossRef]
- Dholakia, B.B.; Ammiraju, J.S.S.; Singh, H.; Lagu, M.D.; Röder, M.S.; Rao, V.S.; Dhaliwal, H.S.; Ranjekar, P.K.; Gupta, V.S. Molecular marker analysis of kernel size and shape in bread wheat. Plant Breed. 2003, 122, 392–395. [Google Scholar] [CrossRef]
- Li, J.; Thomson, M.; McCouch, S.R. Fine mapping of a grain-weight quantitative trait locus in the pericentromeric region of rice chromosome 3. Genetics 2004, 168, 2187–2195. [Google Scholar] [CrossRef] [PubMed]
- Liu, T.; Wu, W.; Chen, W.; Sun, C.; Chen, C.; Wang, R.; Zhu, X.; Guo, W. A shadow-based method to calculate the percentage of filled rice grains. Biosyst. Eng. 2016, 150, 79–88. [Google Scholar] [CrossRef]
- Mclaughlin, N.B.; Giesbrecht, J.; Bligh, D.F. Design and performance of an electronic seed counter. Can. J. Plant Sci. 1976, 56, 351–355. [Google Scholar] [CrossRef]
- Lin, P.; Chen, Y.M.; He, Y.; Hu, G.W. A novel matching algorithm for splitting touching rice kernels based on contour curvature analysis. Comput. Electron. Agric. 2014, 109, 124–133. [Google Scholar] [CrossRef]
- Otsu, N. A Threshold Selection Method from Gray-Level Histograms. IEEE Trans. Syst. Man. Cybern. 1979, 9, 62–66. [Google Scholar] [CrossRef]
- Nam, Y.; Hwang, E.; Kim, D. A similarity-based leaf image retrieval scheme: Joining shape and venation features. Comput. Vis. Image Underst. 2008, 110, 245–259. [Google Scholar] [CrossRef]
- Dubey, S.R.; Jalal, A.S. Apple disease classification using color, texture and shape features from images. Signal. Image Video Process. 2016, 10, 819–826. [Google Scholar] [CrossRef]
- Jayas, D.S.; Bulley, N.R. Digital image analysis for software separation and classification of touching grains: II. classification. Trans. ASAE 1995, 38, 645–649. [Google Scholar]
- Yan, L.; Park, C.-W.; Lee, S.-R.; Lee, C.-Y. New separation algorithm for touching grain kernels based on contour segments and ellipse fitting. J. Zhejiang Univ. Sci. C 2011, 12, 54–61. [Google Scholar] [CrossRef]
- Zhang, G.; Jayas, D.S.; White, N.D.G. Separation of touching grain kernels in an image by ellipse fitting algorithm. Biosyst. Eng. 2005, 92, 135–142. [Google Scholar] [CrossRef]
- Bai, X.; Sun, C.; Zhou, F. Splitting touching cells based on concave points and ellipse fitting. Pattern Recognit. 2009, 42, 2434–2446. [Google Scholar] [CrossRef]
- Visen, N.S.; Shashidhar, N.S.; Paliwal, J.; Jayas, D.S. Identification and segmentation of occluding groups of grain kernels in a grain sample image. J. Agric. Eng. Res. 2001, 79, 159–166. [Google Scholar] [CrossRef]
- Zhong, Q.; Zhou, P.; Yao, Q.; Mao, K. A novel segmentation algorithm for clustered slender-particles. Comput. Electron. Agric. 2009, 69, 118–127. [Google Scholar] [CrossRef]
- Wang, W.; Paliwal, J. Separation and identification of touching kernels and dockage components in digital images. Can. Biosyst. Eng. 2006, 48, 1–7. [Google Scholar]
- Mebatsion, H.K.; Paliwal, J. A Fourier analysis based algorithm to separate touching kernels in digital images. Biosyst. Eng. 2011, 108, 66–74. [Google Scholar] [CrossRef]
- Komyshev, E.; Genaev, M.; Afonnikov, D. Evaluation of the SeedCounter, A Mobile Application for Grain Phenotyping. Front. Plant Sci. 2017, 7. [Google Scholar] [CrossRef] [PubMed]
- Gong, A.; Yu, J.; He, Y.; Qiu, Z. Citrus yield estimation based on images processed by an Android mobile phone. Biosyst. Eng. 2013, 115, 162–170. [Google Scholar] [CrossRef]
- Zhao, Z.Q.; Ma, L.H.; Cheung, Y.M.; Wu, X.; Tang, Y.; Chen, C.L.P. ApLeaf: An efficient Android-based plant leaf identification system. Neurocomputing 2015, 151, 1112–1119. [Google Scholar] [CrossRef]
- Rahman, M.; Blackwell, B.; Banerjee, N.; Saraswat, D. Smartphone-based hierarchical crowdsourcing for weed identification. Comput. Electron. Agric. 2015, 113, 14–23. [Google Scholar] [CrossRef]
- Gómez-Robledo, L.; López-Ruiz, N.; Melgosa, M.; Palma, A.J.; Capitán-Vallvey, L.F.; Sánchez-Marañón, M. Using the mobile phone as munsell soil-colour sensor: An experiment under controlled illumination conditions. Comput. Electron. Agric. 2013, 99, 200–208. [Google Scholar] [CrossRef]
- Onyango, C.M.; Marchant, J.A. Segmentation of row crop plants from weeds using colour and morphology. Comput. Electron. Agric. 2003, 39, 141–155. [Google Scholar] [CrossRef]
- Lee, J.-S. Digital image smoothing and the sigma filter. Comput. Vis. Graph. Image Process. 1983, 24, 255–269. [Google Scholar] [CrossRef]
- Mizushima, A.; Lu, R. An image segmentation method for apple sorting and grading using support vector machine and Otsu’s method. Comput. Electron. Agric. 2013, 94, 29–37. [Google Scholar] [CrossRef]
- Montalvo, M.; Pajares, G.; Guerrero, J.M.; Romeo, J.; Guijarro, M.; Ribeiro, A.; Ruz, J.J.; Cruz, J.M. Automatic detection of crop rows in maize fields with high weeds pressure. Expert Syst. Appl. 2012, 39, 11889–11897. [Google Scholar] [CrossRef] [Green Version]
- McCracken, K.E.; Yoon, J.Y. Recent approaches for optical smartphone sensing in resource-limited settings: A brief review. Anal. Methods 2016, 8, 6591–6601. [Google Scholar] [CrossRef]
- Connolly, C.; Fliess, T. A study of efficiency and accuracy in the transformation from RGB to CIELAB color space. IEEE Trans. Image Process. 1997, 6, 1046–1048. [Google Scholar] [CrossRef] [PubMed]
- Parvati, K.; Prakasa Rao, B.S.; Mariya Das, M. Image segmentation using gray-scale morphology and marker-controlled watershed transformation. Discret. Dyn. Nat. Soc. 2008, 2008. [Google Scholar] [CrossRef]
- Tanabata, T.; Shibaya, T.; Hori, K.; Ebana, K.; Yano, M. SmartGrain: High-Throughput Phenotyping Software for Measuring Seed Shape through Image Analysis. Plant Physiol. 2012, 160, 1871–1880. [Google Scholar] [CrossRef] [PubMed] [Green Version]
- Gong, L.; Lin, K.; Wang, T.; Liu, C.; Yuan, Z.; Zhang, D.; Hong, J. Image-Based On-Panicle Rice [Oryza sativa L.] Grain Counting with a Prior Edge Wavelet Correction Model. Agronomy 2018, 8, 91. [Google Scholar] [CrossRef]
- Liu, T.; Chen, W.; Wang, Y.; Wu, W.; Sun, C.; Ding, J.; Guo, W. Rice and wheat grain counting method and software development based on Android system. Comput. Electron. Agric. 2017, 141, 302–309. [Google Scholar] [CrossRef]
Figure 1.
The experimental setup for the system.
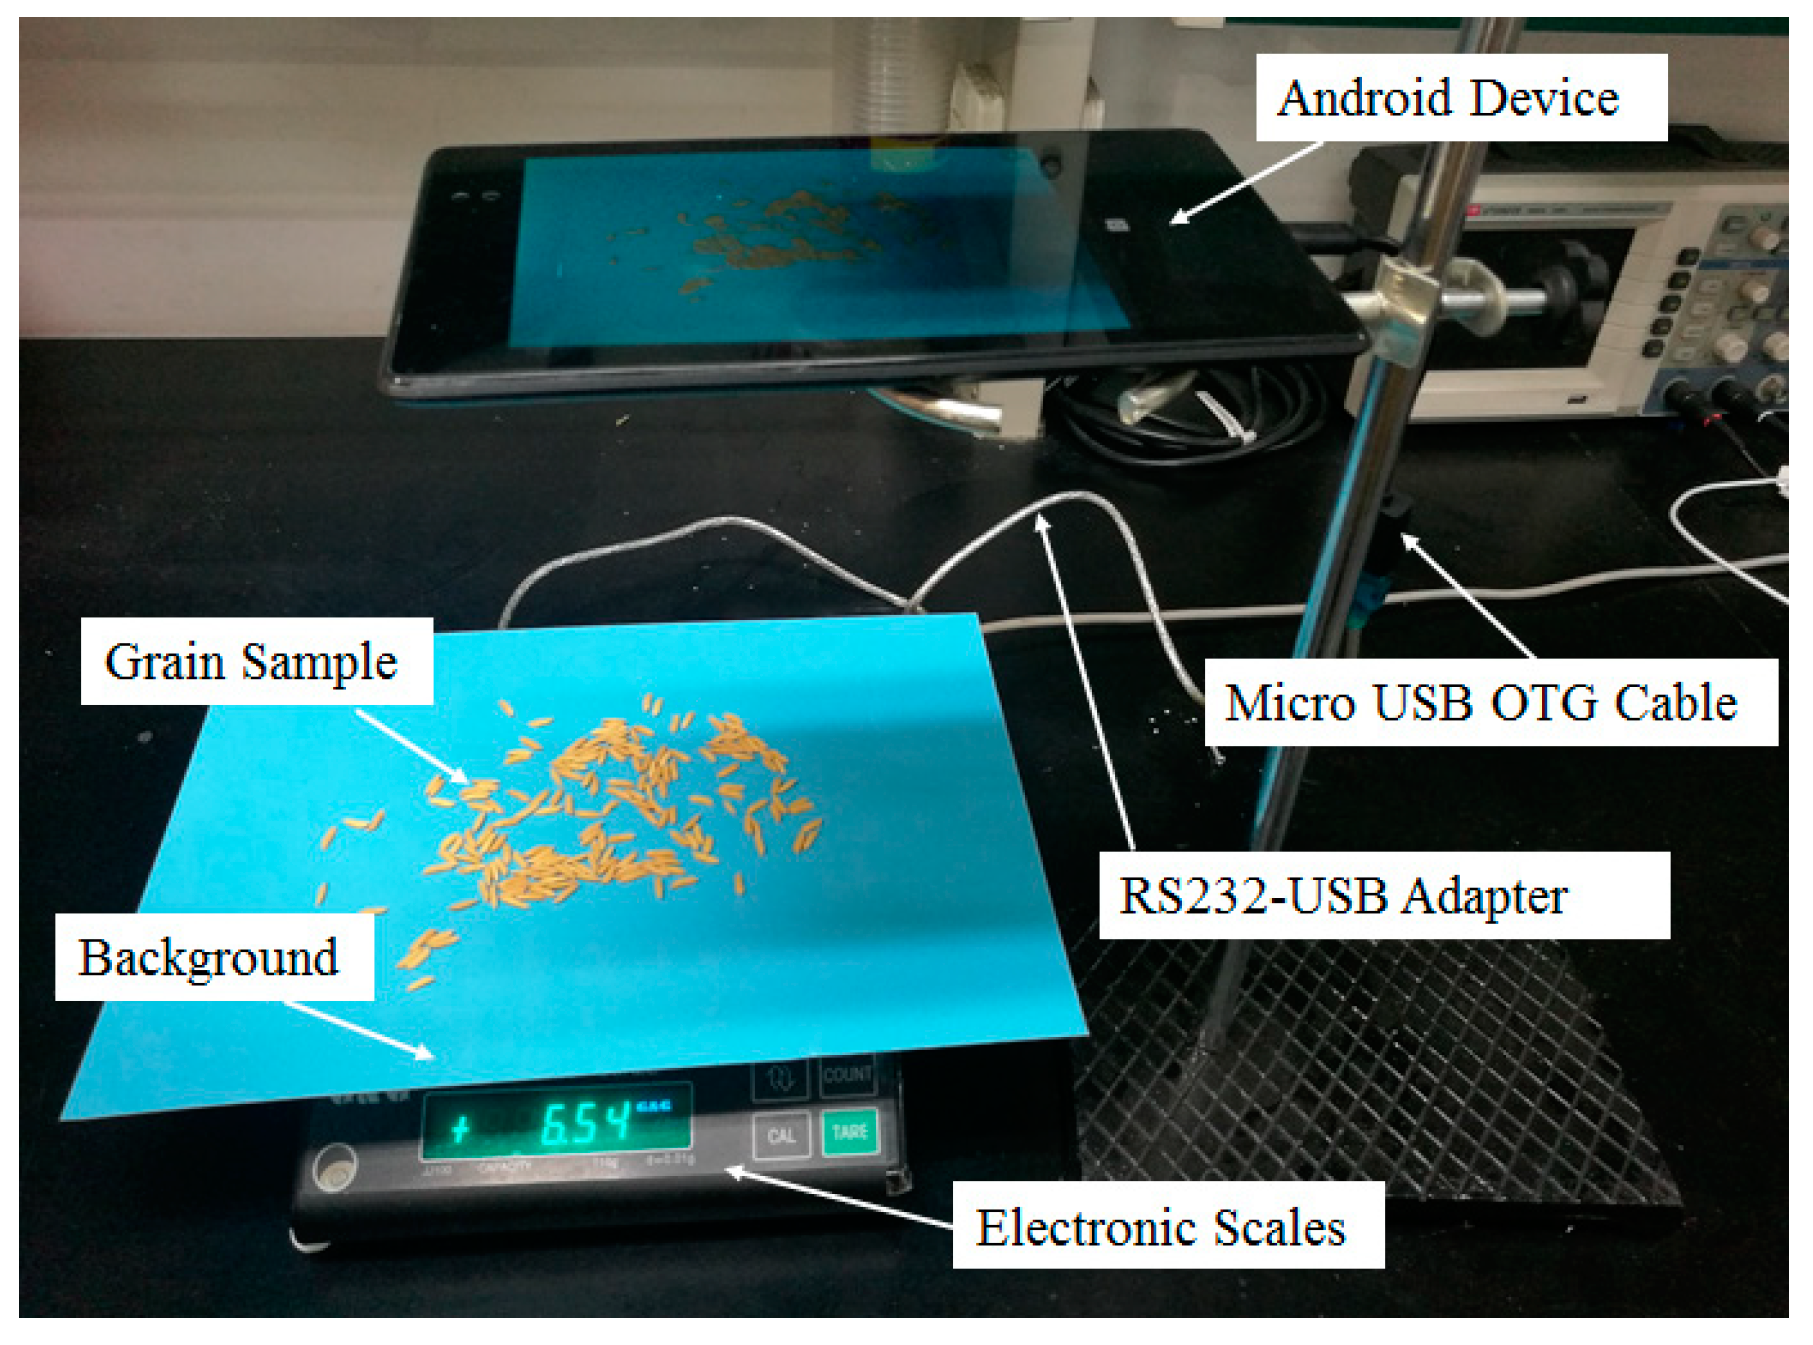
Figure 2.
The structure diagram of the electronic balance.

Figure 3.
The system Implementation Flow. From left to right: hardware, programming tools, image process algorithm, software interface.
Figure 3.
The system Implementation Flow. From left to right: hardware, programming tools, image process algorithm, software interface.
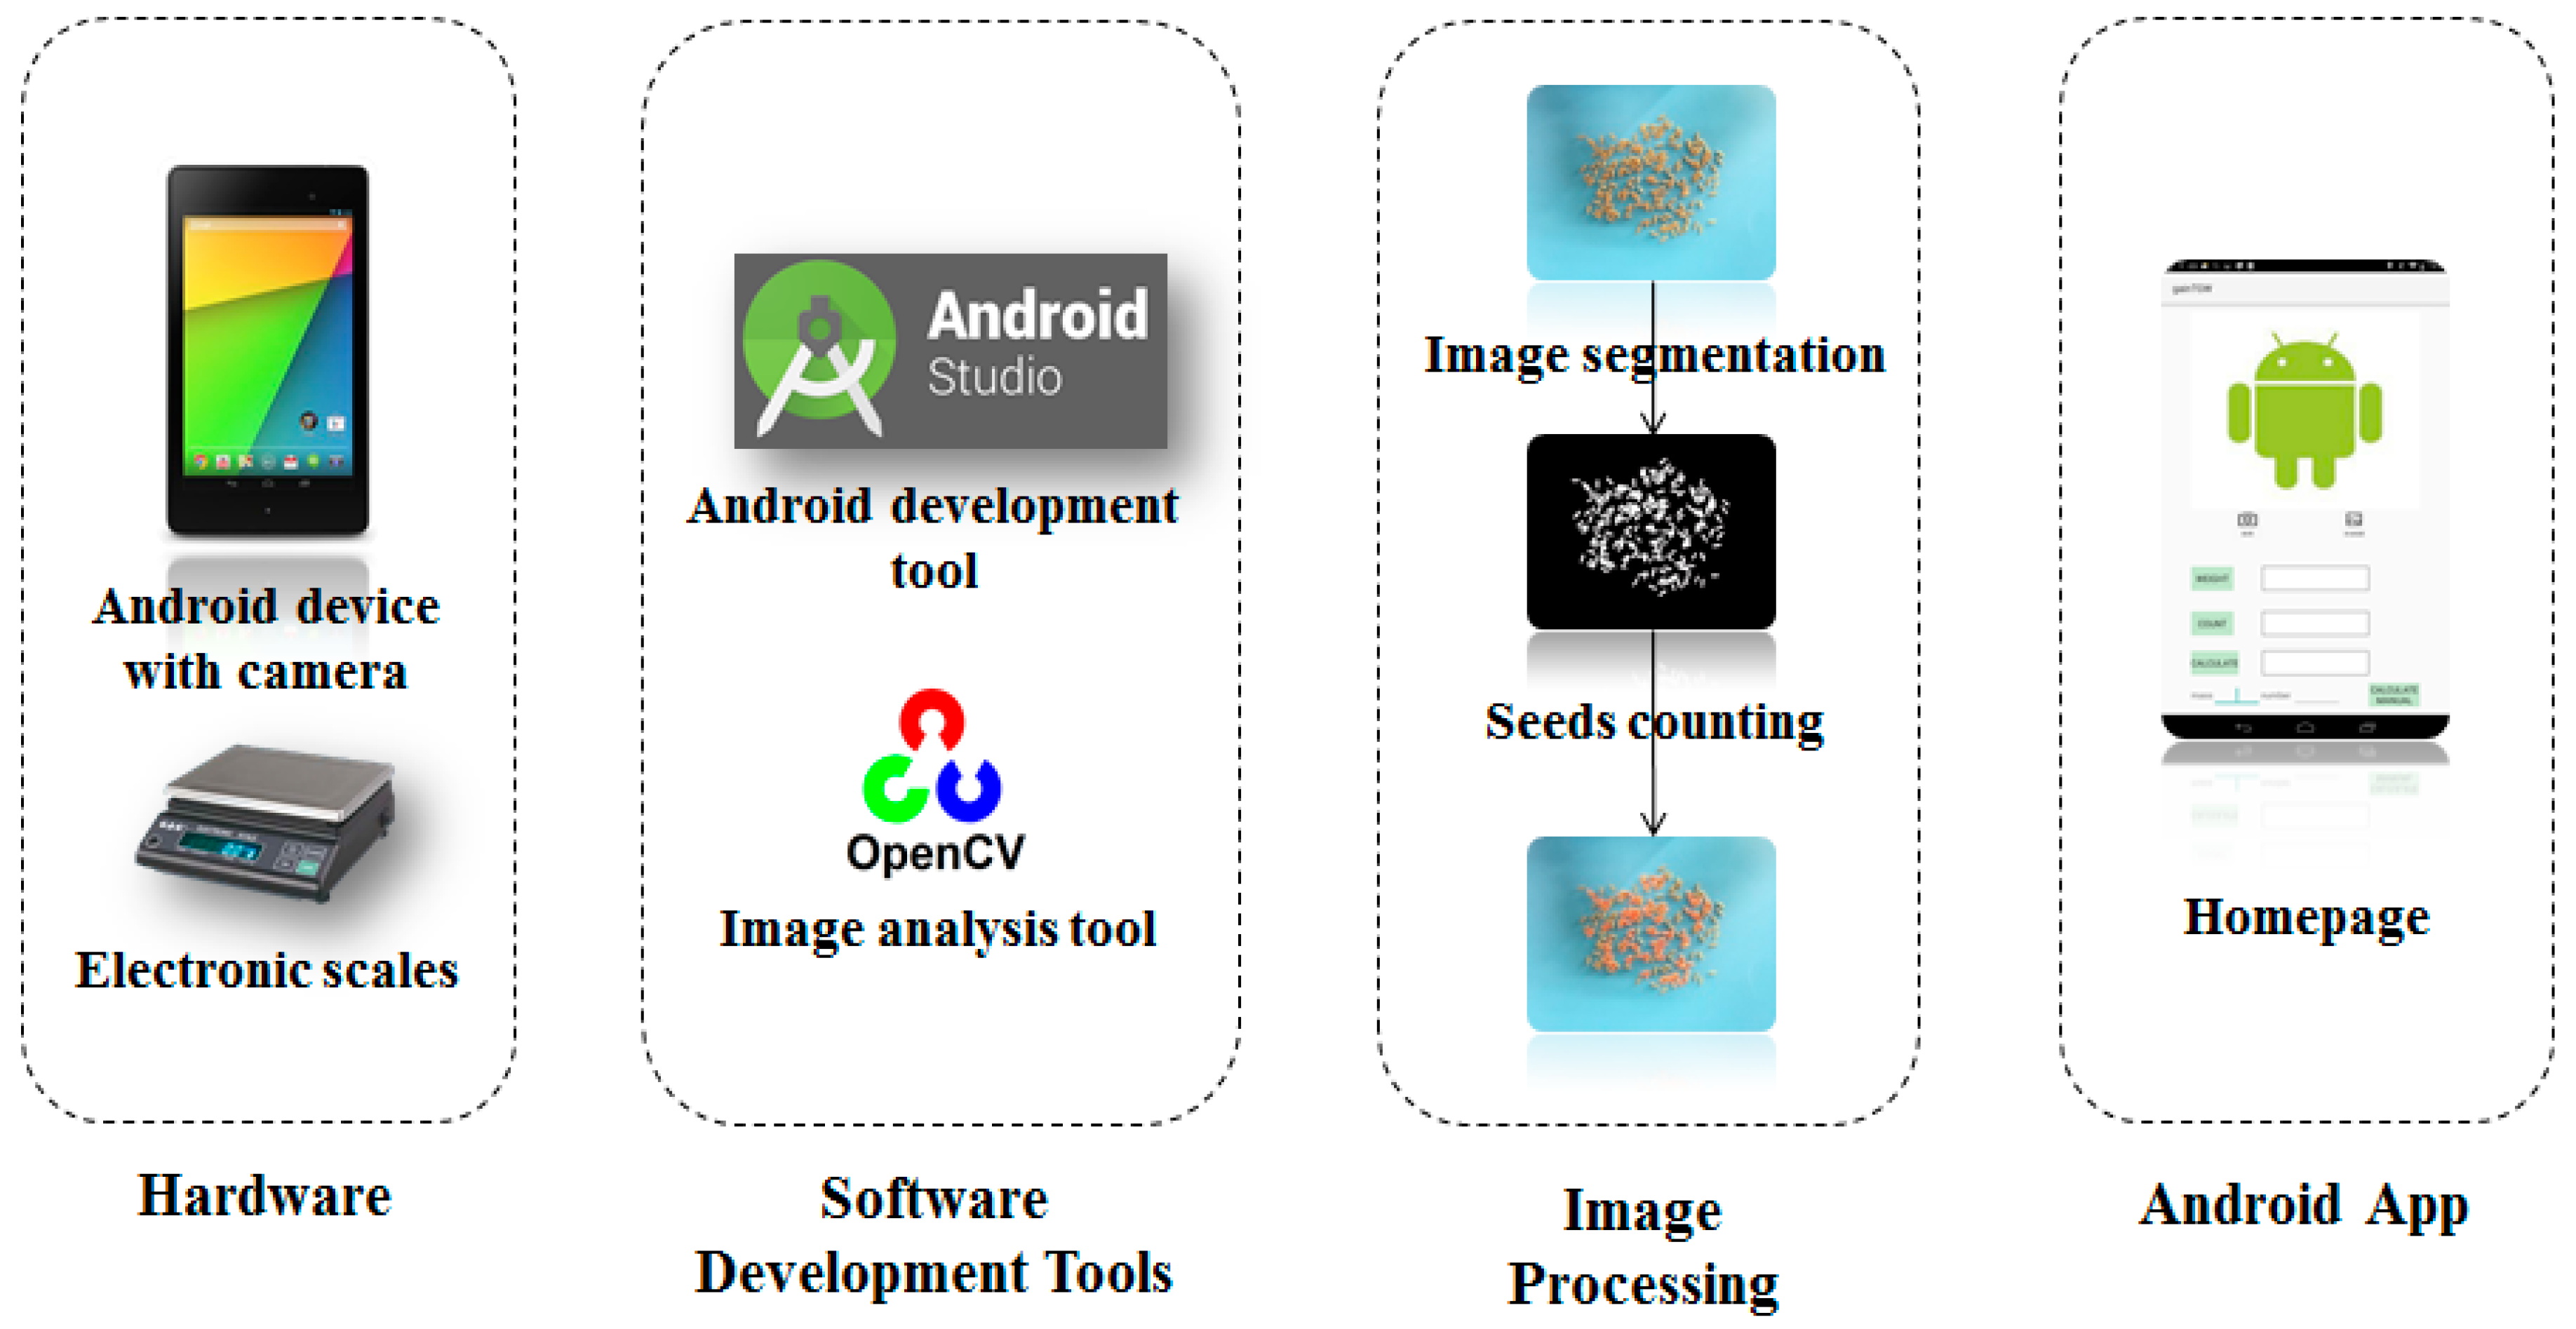
Figure 4.
The extraction of Indica Rice binary images using the Otsu segmentation algorithm and K-means clustering segmentation algorithm; (a) Original image of Indica rice; (b) Binary image of Indica rice based on Otsu algorithm; (c) Binary image of Indica rice based on K-means clustering algorithm.

Figure 5.
The result images of different watershed segmentation algorithms; (a) Binary image of Indica rice; (b) Output image of traditional watershed segmentation algorithm; (c) Output image of the marker-controlled watershed segmentation algorithm.
Figure 5.
The result images of different watershed segmentation algorithms; (a) Binary image of Indica rice; (b) Output image of traditional watershed segmentation algorithm; (c) Output image of the marker-controlled watershed segmentation algorithm.

Figure 6.
The result of the area threshold method; (a) Binary image of the Indica rice; (b) Indica rice grains that are not separated correctly; (c) The result image of algorithm (the touching area was outlined in red and the number of the kernels was displayed in the center of the touching area).
Figure 6.
The result of the area threshold method; (a) Binary image of the Indica rice; (b) Indica rice grains that are not separated correctly; (c) The result image of algorithm (the touching area was outlined in red and the number of the kernels was displayed in the center of the touching area).
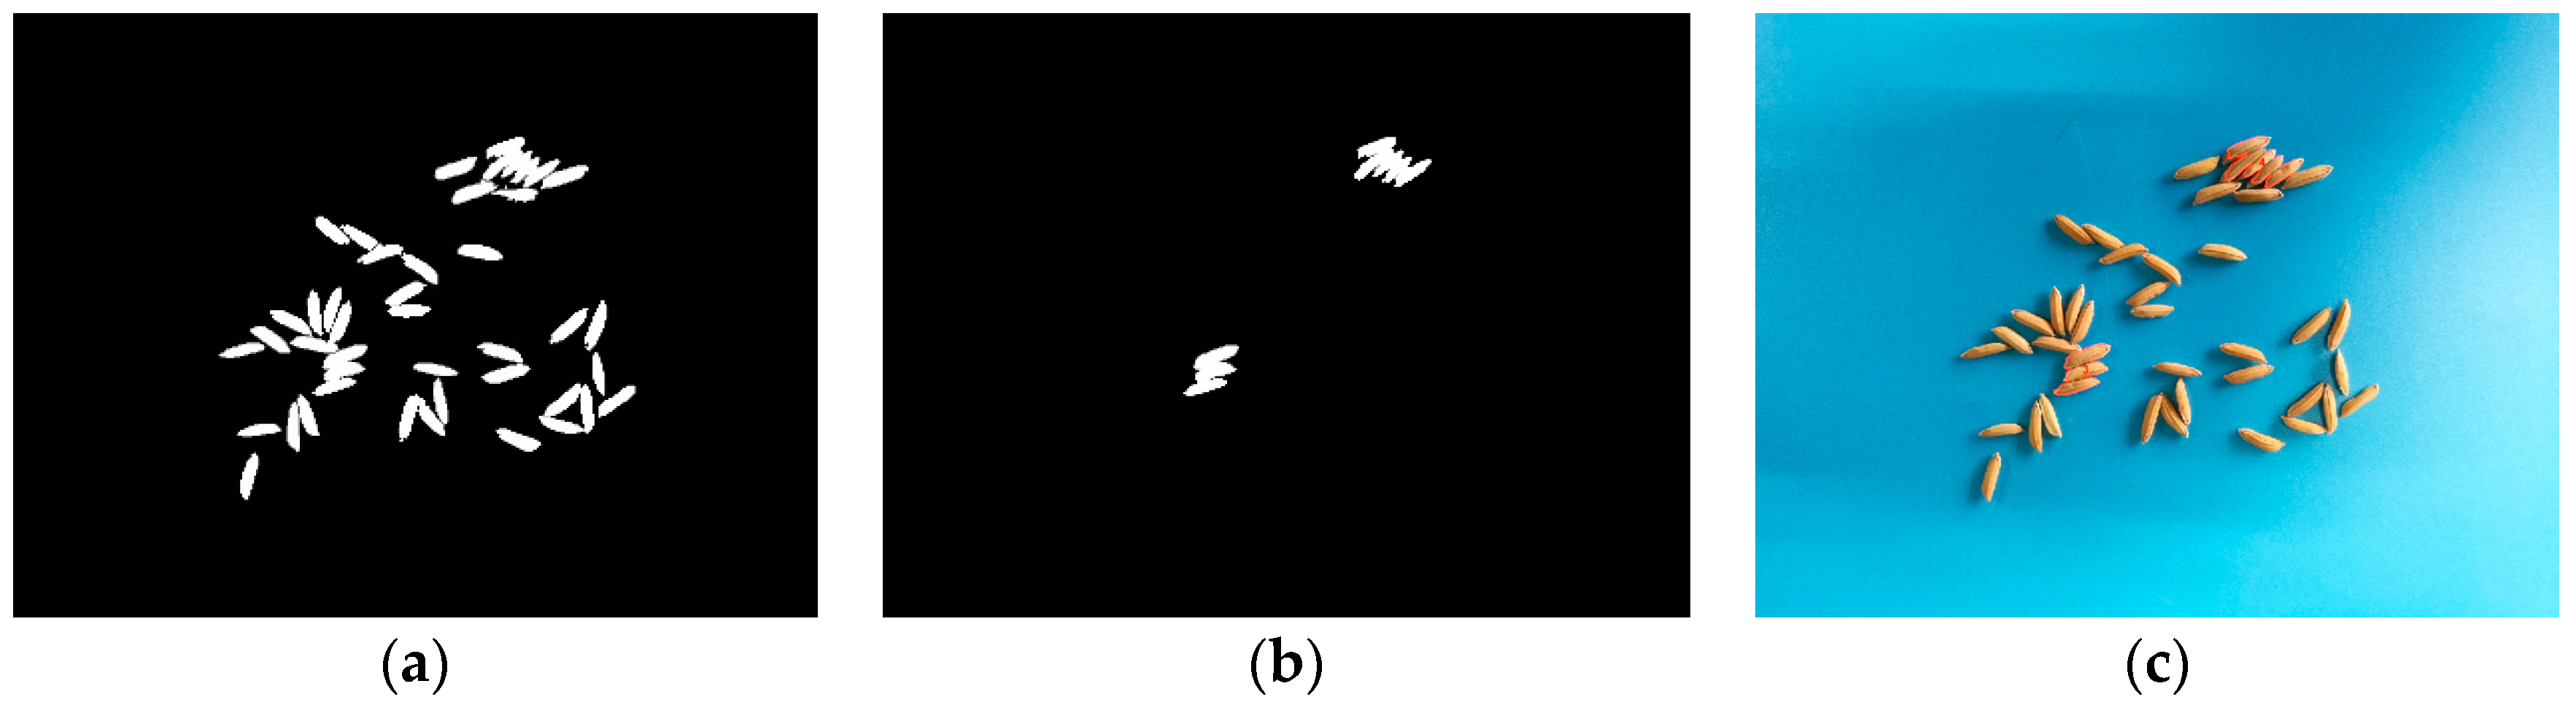
Figure 7.
The flow-chart diagram of the “gainTKW” application illustrated with the application’s screenshots.
Figure 7.
The flow-chart diagram of the “gainTKW” application illustrated with the application’s screenshots.
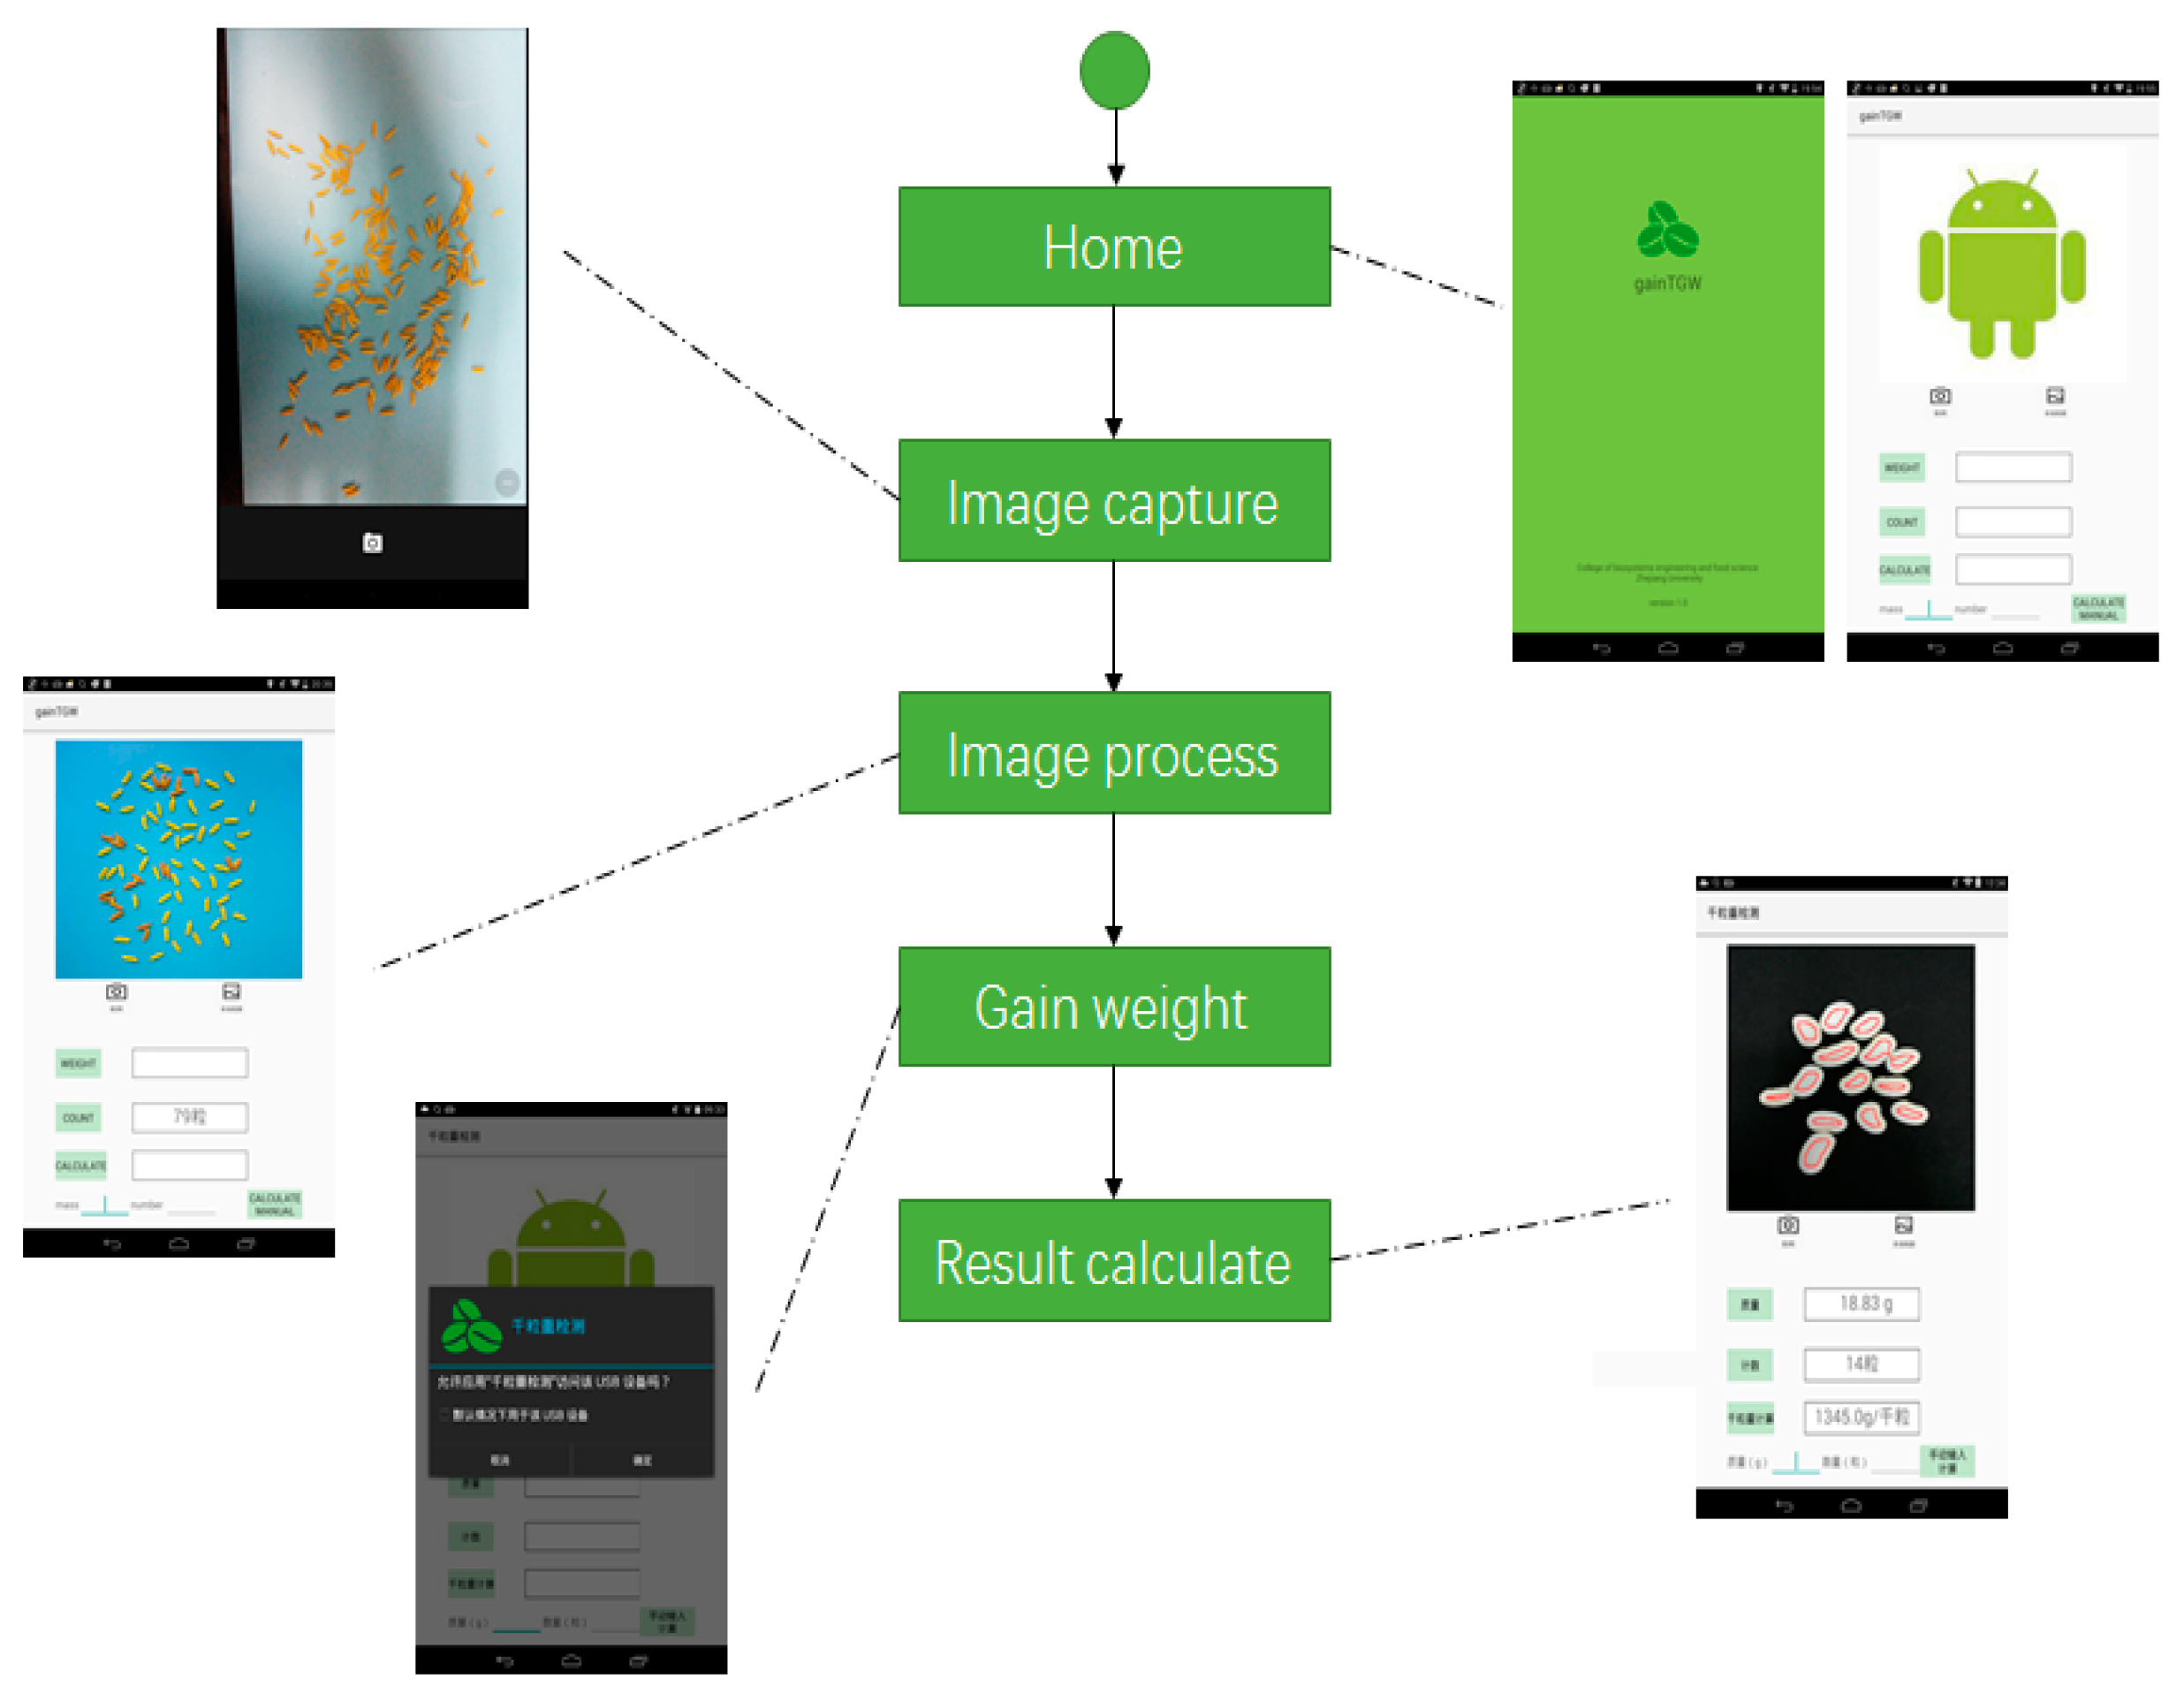
Figure 8.
The counting results under different lighting conditions.
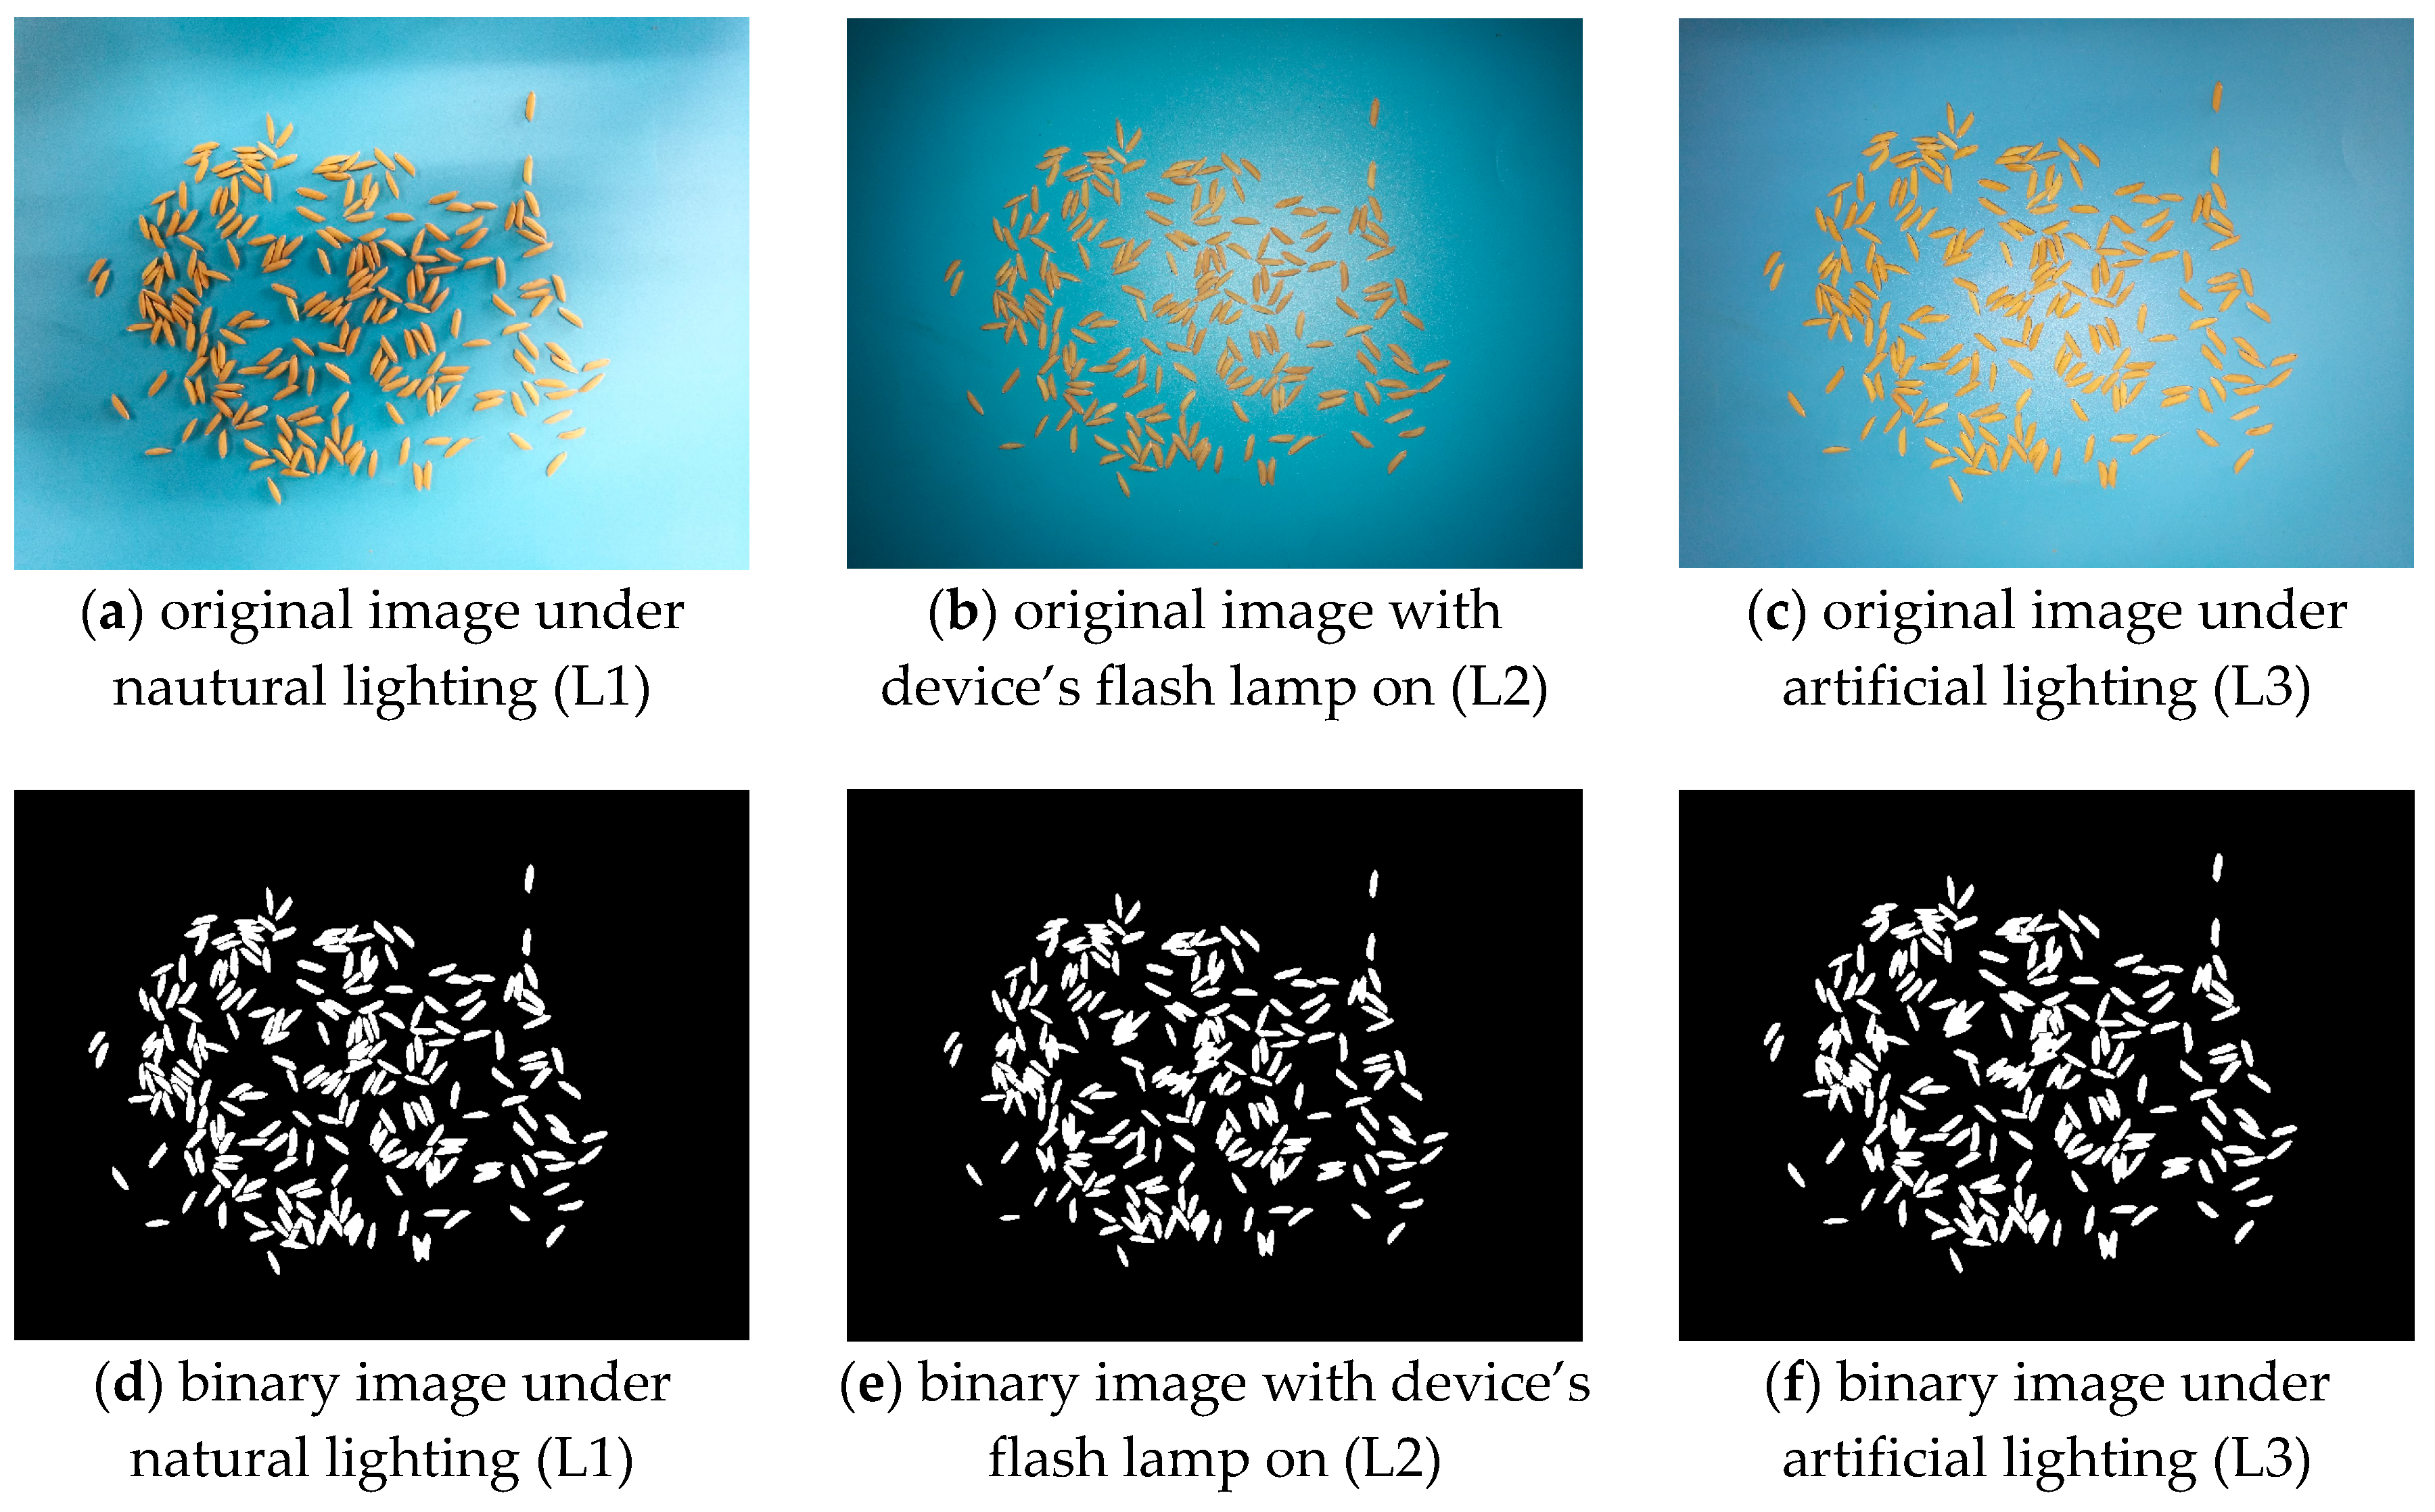
Figure 9.
The relationship between error ratios and kernel number.
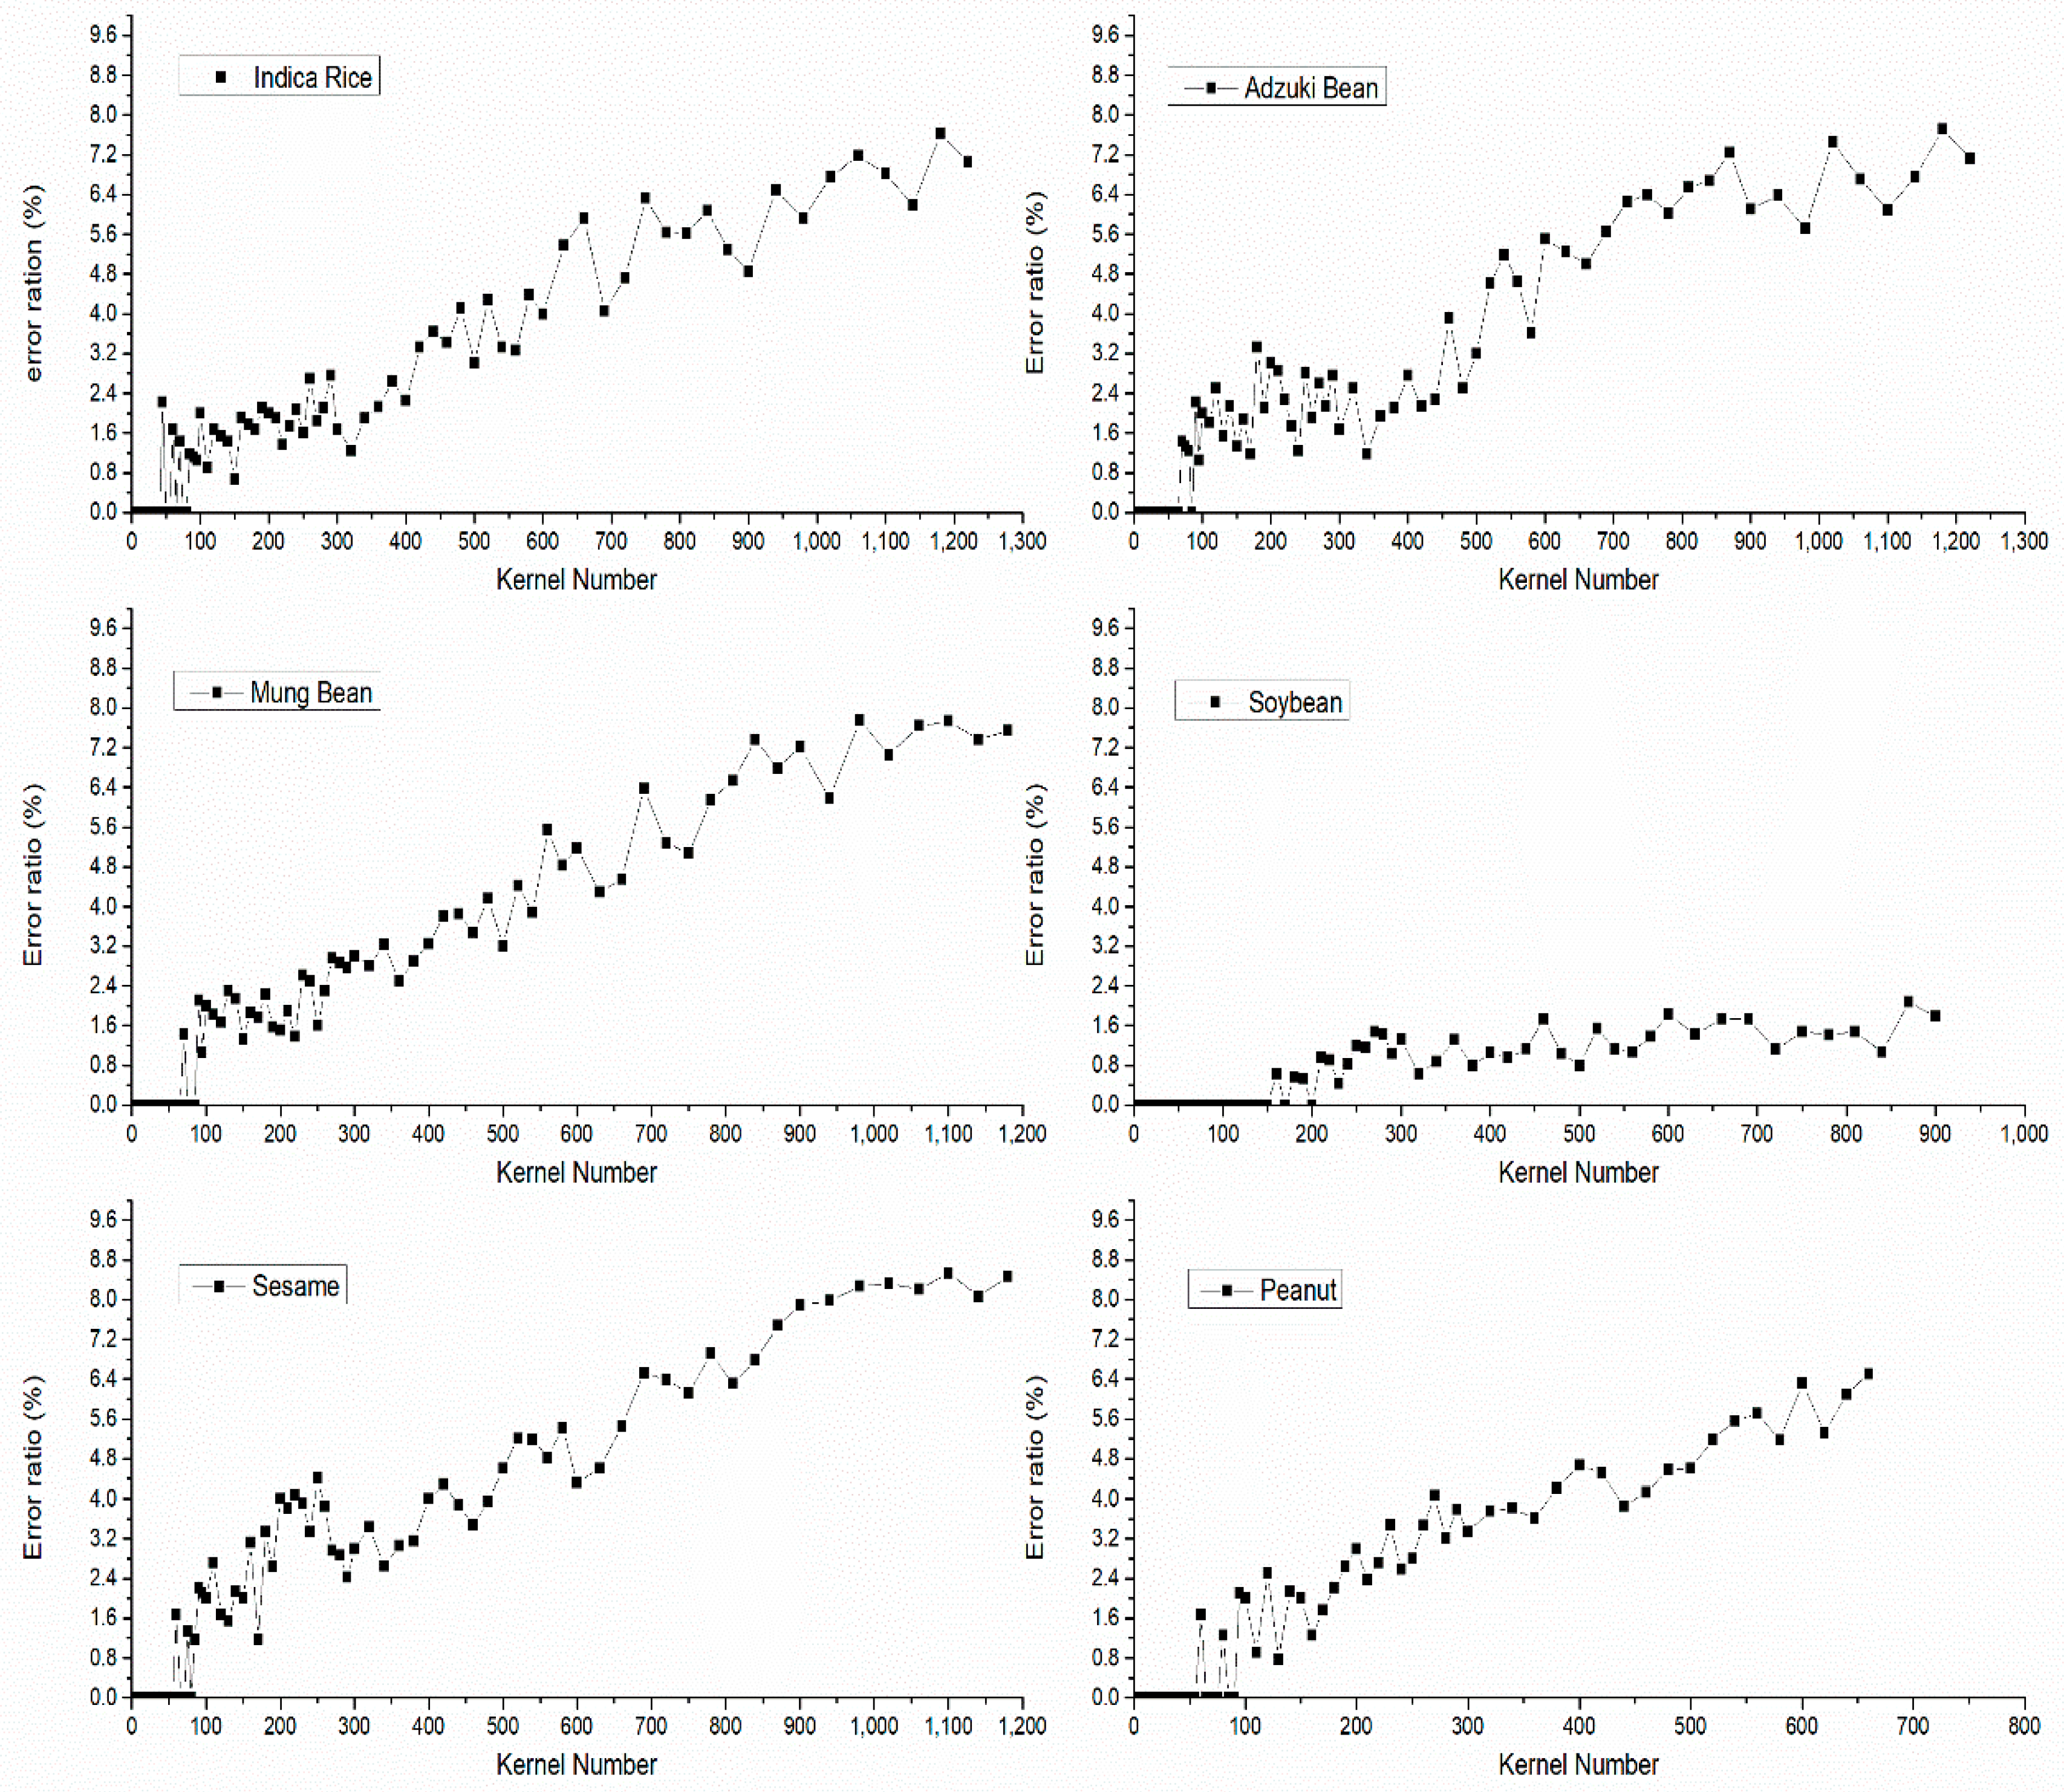
Figure 10.
The relationship between running time and kernel number on the same device.

Table 1.
The light conditions for measuring the accuracy of the segmentation algorithm.
| Number | Lighting Facilities | Luminous Flux (Lux) |
|---|---|---|
| L1 | Daylight, sunny day, indoors | 105 |
| L2 | With the Android device’s flash lamp on | 350 |
| L3 | Artificial lighting under the Android device | 500 |
Table 2.
The performance evaluation of the accuracy of kernel counting using the “gainTKW” application on two different Android devices using six species of kernels (KN means kernel number).
Table 2.
The performance evaluation of the accuracy of kernel counting using the “gainTKW” application on two different Android devices using six species of kernels (KN means kernel number).
| Device | HUAWEI P9 | Nexus 7 | |||||||
|---|---|---|---|---|---|---|---|---|---|
| Seed Species | |||||||||
| Indica Rice | KN | Error Ratio (%) | KN | Error Ratio (%) | KN | Error Ratio (%) | KN | Error Ratio (%) | |
| 5 | 0.00 | 150 | 0.67 | 5 | 0.00 | 150 | 1.33 | ||
| 10 | 0.00 | 200 | 2.00 | 10 | 0.00 | 200 | 1.50 | ||
| 20 | 0.00 | 250 | 1.60 | 20 | 0.00 | 250 | 1.60 | ||
| 50 | 0.00 | 300 | 1.67 | 50 | 2.00 | 300 | 1.67 | ||
| 100 | 2.00 | 350 | 2.28 | 100 | 1.00 | 350 | 2.28 | ||
| Adzuki Bean | 5 | 0.00 | 150 | 1.33 | 5 | 0.00 | 150 | 1.33 | |
| 10 | 0.00 | 200 | 2.50 | 10 | 0.00 | 200 | 2.00 | ||
| 20 | 0.00 | 250 | 2.80 | 20 | 0.00 | 250 | 2.80 | ||
| 50 | 0.00 | 300 | 1.67 | 50 | 0.00 | 300 | 1.67 | ||
| 100 | 2.00 | 350 | 1.71 | 100 | 2.00 | 350 | 1.71 | ||
| Mung Bean | 5 | 0.00 | 150 | 1.33 | 5 | 0.00 | 150 | 1.33 | |
| 10 | 0.00 | 200 | 1.50 | 10 | 0.00 | 200 | 2.00 | ||
| 20 | 0.00 | 250 | 1.60 | 20 | 0.00 | 250 | 1.60 | ||
| 50 | 0.00 | 300 | 3.00 | 50 | 0.00 | 300 | 3.33 | ||
| 100 | 2.00 | 350 | 1.43 | 100 | 2.00 | 350 | 2.29 | ||
| Soybean | 5 | 0.00 | 150 | 0.00 | 5 | 0.00 | 150 | 0.00 | |
| 10 | 0.00 | 200 | 0.00 | 10 | 0.00 | 200 | 0.50 | ||
| 20 | 0.00 | 250 | 1.20 | 20 | 0.00 | 250 | 1.20 | ||
| 50 | 0.00 | 300 | 1.33 | 50 | 0.00 | 300 | 1.67 | ||
| 100 | 0.00 | 350 | 0.86 | 100 | 0.00 | 350 | 1.14 | ||
| Sesame | 5 | 0.00 | 150 | 2.00 | 5 | 0.00 | 150 | 2.00 | |
| 10 | 0.00 | 200 | 4.00 | 10 | 0.00 | 200 | 4.00 | ||
| 20 | 0.00 | 250 | 4.40 | 20 | 0.00 | 250 | 4.40 | ||
| 50 | 2.00 | 300 | 3.30 | 50 | 2.00 | 300 | 3.67 | ||
| 100 | 2.00 | 350 | 3.43 | 100 | 2.00 | 350 | 3.71 | ||
| Peanut | 5 | 0.00 | 150 | 0.67 | 5 | 0.00 | 150 | 1.33 | |
| 10 | 0.00 | 200 | 1.50 | 10 | 0.00 | 200 | 1.50 | ||
| 20 | 0.00 | 250 | 2.80 | 20 | 0.00 | 250 | 3.20 | ||
| 50 | 0.00 | 300 | 3.33 | 50 | 0.00 | 300 | 3.33 | ||
| 100 | 1.00 | 350 | 3.71 | 100 | 1.00 | 350 | 3.71 | ||
Table 3.
The average TKW (thousand kernel weight) parameters of different species of kernels.
| Species | Indica Rice | Adzuki Bean | Mung Bean | Soybean | Sesame | Peanut |
|---|---|---|---|---|---|---|
| TKW (g) | 28.84 | 58.27 | 53.44 | 182.31 | 2.76 | 386.25 |
© 2018 by the authors. Licensee MDPI, Basel, Switzerland. This article is an open access article distributed under the terms and conditions of the Creative Commons Attribution (CC BY) license (http://creativecommons.org/licenses/by/4.0/).
Share and Cite
MDPI and ACS Style
Wu, W.; Zhou, L.; Chen, J.; Qiu, Z.; He, Y. GainTKW: A Measurement System of Thousand Kernel Weight Based on the Android Platform. Agronomy 2018, 8, 178. https://doi.org/10.3390/agronomy8090178
AMA Style
Wu W, Zhou L, Chen J, Qiu Z, He Y. GainTKW: A Measurement System of Thousand Kernel Weight Based on the Android Platform. Agronomy. 2018; 8(9):178. https://doi.org/10.3390/agronomy8090178
Chicago/Turabian StyleWu, Wenhua, Lei Zhou, Jian Chen, Zhengjun Qiu, and Yong He. 2018. "GainTKW: A Measurement System of Thousand Kernel Weight Based on the Android Platform" Agronomy 8, no. 9: 178. https://doi.org/10.3390/agronomy8090178
Note that from the first issue of 2016, this journal uses article numbers instead of page numbers. See further details here.