Marketability Probability Study of Cherry Tomato Cultivars Based on Logistic Regression Models


Department of Engineering, University of Almería, Agrifood Campus of International Excellence (CeiA3), 04120 La Cañada de San Urbano, Almería, Spain
*
Author to whom correspondence should be addressed.
Agronomy 2018, 8(9), 176; https://doi.org/10.3390/agronomy8090176
Submission received: 11 August 2018
/
Revised: 5 September 2018
/
Accepted: 6 September 2018
/
Published: 9 September 2018
(This article belongs to the Special Issue Genetics and Genomics of Tomato and Solanaceae)
Abstract
:The purpose of this study was to demonstrate interest in applying simple and multiple logistic regression analyses to the marketability probability of commercial tomato (Solanum lycopersicum L.) cultivars when the tomatoes are harvested as loose fruit. A fruit’s firmness and commercial quality (softening or over-ripe fruit, cracking, cold damage, and rotting) were determined at 0, 7, 14, and 21 days of storage. The storage test simulated typical conditions from harvest to purchase-consumption by the consumer. The combined simple and multiple analyses of the primary continuous and categorical variables with the greatest influence on the commercial quality of postharvest fruit allowed for a more detailed understanding of the behavior of different tomato cultivars and identified the cultivars with greater marketability probability. The odds ratios allowed us to determine the increase or decrease in the marketability probability when we substituted one cultivar with a reference one. Thus, for example, the marketability probability was approximately 2.59 times greater for ‘Santyplum’ than for ‘Angelle’. Overall, of the studied cultivars, ‘Santyplum’, followed by ‘Dolchettini’, showed greater marketability probability than ‘Angelle’ and ‘Genio’. In conclusion, the logistic regression model is useful for studying and identifying tomato cultivars with good postharvest marketability characteristics.
1. Introduction
The tomato (Solanum lycopersicum L.) is one of the most popular and in-demand vegetables in the world [1,2,3,4]. However, postharvest losses are a major problem in supply chains [5]. Globally, postharvest losses from tomato supply chains range from 10% to 40% of harvested tomatoes [6,7]. Tomatoes are vulnerable to postharvest losses due to their perishable nature [8]. In recent years, tomato processing firms have encountered increasing difficulties, due both to an increase in raw material costs and market difficulties [9].
Food systems are complex systems that encompass a plurality of processes, from production to processing and retailing, all the way to consumption [10]. The quantitative and qualitative losses of vegetables occur from harvest through handling [11], storage, processing, and marketing to their final delivery to the consumer. Losses in industrialized countries occur at the retail and consumer stages, and in developing countries, losses occur during the production, harvest, postharvest, and processing phases [12].
Tomatoes have a relatively short life over the course of the marketing process [13]. The postharvest handling and transport conditions of fresh products directly affect their shelf life [14]. The longer the time between harvest and consumption is, the greater the loss of quality [15]. The storage and maturation recommendations for tomatoes are well known, but quality problems associated with postharvest mismanagement and transportation continue to occur during distribution [16].
Postharvest losses in quality and quantity are related to crop immaturity, inadequate initial quality control, incidence and severity of physical damage, exposure to improper temperatures, and delays between harvest and consumption [17]. The primary causes of the postharvest loss of commercial value in tomatoes are softening from impact or over-ripe fruit, cracking, water loss, cold damage, and changes in composition and decay [18]. The intrinsic variables in the tomato fruit that can affect the organoleptic quality during marketing are the pH, titratable acidity (TA), total soluble solids (TSS), TSS/TA, glucose, fructose, firmness, and color. Regarding the primary extrinsic factors, those that produce the greatest change in quality are the ripening state and the time and conditions of transport and storage. Of the intrinsic and extrinsic factors, those that have the greatest influence on the tomato marketability probability are the time and storage conditions, together with the fruit firmness [19,20].
In recent decades, the demand for improved storage and transport conditions to maintain the fruit quality (i.e., flavor, color, nutritional aspects, firmness, and shelf life) of fresh products during their shelf life has increased [21]. Strategies to reduce postharvest losses of fruits and vegetables include the development of new cultivars with a longer commercial life, improved handling systems (less aggressive packaging and the maintenance of the cold chain), and the use of modified atmospheres and treatments at the pre- and postharvest stages with substances that reduce the deterioration of the fruits [22,23,24,25,26,27]. Most studies on the commercial life of tomatoes are based on statistical models that estimate the fruit’s commercial life based on its initial firmness [28,29,30,31]. However, the improvement of the useful life should be based on studies that include all the factors that cause losses in the commercial value, and therefore, they should be based on analytical techniques that integrate and combine quantitative (e.g., firmness) and qualitative (e.g., cracked and rotten fruits) variables. In addition, these variables should also be simple to determine so they can be used by production and marketing companies as well as for breeding and genetic improvement studies, especially for the selection of precommercial cultivars.
Despite the existence of many studies focused on the development of new tomato cultivars with a longer commercial life based on statistical models, in no case do these models consider all the aspects that lead to commercial loss, as described by Kader [18]. In the development of new tomato cultivars with greater commercial lifespans, there are no studies on the development of models that can be used to predict the marketability probability of stored fresh products. To understand the postharvest behavior of new tomato cultivars, it is necessary to study the commercial life in response to the current needs. Therefore, it is necessary to develop study models that holistically integrate all the causes of commercial loss (Figure 1), such as the studies performed by Melesse et al. [20] on the marketability of tomatoes subjected to different pre- and postharvest treatments and Tolesa et al. [19] on the marketability of tomato fruits harvested at different stages of maturity and subjected to different disinfection and storage conditions.
Logistic regression models are statistical models that determine the relationship between a dichotomous qualitative dependent variable (binary or binomial logistic regression) and one or more independent explanatory variables or covariables, whether qualitative or quantitative (multiple logistic regression) [32]. The logistic regression model is presented as a novel approach for calculating the marketability probability of fresh products that have been subjected to multiple agro-economic practices [19,20,33]. This logistic regression model has not been applied in comparative studies of tomato cultivars (Figure 1).
The objective of the present study is to demonstrate that the application of simple and multiple logistic regression analysis is a useful tool for studying and understanding the marketability potential of tomato cultivars, which allows for the selection of plant materials with longer postharvest commercial lives. In the development of these logistic models, both continuous and categorical variables will be used, representing the primary causes of postharvest loss. Likewise, best-fit models will be selected for predicting the marketability probability of tomatoes stored under conditions that simulate the typical storage conditions from collection to consumer purchase-consumption.
2. Materials and Methods
2.1. Production and Preparation of the Sampled Tomatoes
This research was performed on four cultivars of cherry tomatoes cultivated in 4 greenhouses in Almeria (south-eastern Spain) owned by professional producers who are dedicated to the production and export of tomatoes. The commercial cultivars studied here were ‘Santyplum’, ‘Dolchettini’, ‘Angelle’, and ‘Genio’. The evaluated fruits were sampled from fruit batches marketed to different European countries (the fruits harvested at optimum commercial maturity). All the plants were cultivated under the same standard conditions of fertilization, irrigation, climate control, etc. The plants were transplanted during the second half of August, 2017, and the crop cycle ended in May of 2018 (a typical growing cycle in south-eastern Spain). The first collections began in October of 2017.
2.2. Experimental Design
In each crop field, a sample of 200 fruits from each cultivar was collected during the months of November, December, January and April. Each sample was identified and labeled with the aim of maintaining traceability throughout the study, and each was then moved to a laboratory at the Universidad de Almería (located in Almería, Spain). Each 200-fruit sample was subdivided into 4 subsamples of 50 fruits each to evaluate their commercial quality at different time intervals of 0, 7, 14, and 21 days of storage (T0, T7, T14, and T21). The storage conditions simulated the route taken by the fruit from their collection (in south-eastern Spain) to their purchase by the consumer in north-central Europe. The storage period was divided into a first stage of 7 days of storage in a cold room, in which refrigerated transport was simulated at 12 °C, and a second period of 7 to 21 days of storage in a chamber at ambient temperature (18–20 °C), simulating the period of fruit exposure and sale to consumers. The activities during each stage of the fruit evaluation were the following:
- T0: At the time of collection, a subsample of 50 fruits from the initial 200 was randomly selected. The commercial quality was measured for each fruit (firmness, state of freshness, presence of fruit anomalies such as splitting, and fungi). The remaining 150 fruits were kept under storage conditions of 12 °C and 70% relative humidity for 7 days.
- T7: After 7 days under these storage conditions, a second subsample of 50 fruits was randomly extracted and evaluated for their commercial quality. The remaining 100 fruits were kept in a chamber at room temperature (18–20 °C), simulating the period of fruit exposure and sale to consumers.
- T14: After 7 days under market conditions (14 days after collection), of the remaining sample of 100 fruits, a third subsample of 50 fruits was randomly extracted, on which the commercial quality parameters were evaluated. The remaining 50 fruits were kept at room temperature (18–20 °C).
- T21: After 7 days (21 days after collection), the last subsample of 50 fruits was evaluated, on which the commercial quality parameters were measured.
2.3. Data Collection and Laboratory Measurements
The commercial quality was evaluated for each fruit. The storage time at the optimal temperature and the firmness of the stored fruit are the factors with the greatest influence on the marketability probability of tomatoes [19,20]. Therefore, the measured parameters were the firmness as determined by an AGROSTA 100 digital durometer (Durofel DFT 100, Serqueux, France) specific to fruits and vegetables. The system has a head that measures 2.54 mm in length and is assembled on a precision spring. The head can be more inserted if the material measured is harder. The measurement range goes from 0 to 100. The 0 measurement means that the sensor is completely outside, and the 100 measurement means that the sensor is fully inserted. The resolution of the system is 1 graduation and the accuracy is ±1 graduation.
The marketability of the fruit was subjectively evaluated by considering the primary causes of postharvest loss as described by Kader [18] and Valero and Serrano [34], with causes consisting of softening from impact or over-ripe fruits, cracking, cold damage, and rot. These are the primary reasons for claims associated with postharvest problems from distribution companies (wholesalers and retailers) to production and handling companies.
2.4. Data Analysis
Logistic Regression
The binary logistic regression models are statistical models that can determine the relationship between a dichotomous qualitative-dependent variable (yes–no, 0–1, true–false, etc.) and one or more independent explanatory variables, or covariates, whether qualitative or quantitative [32,35].
The logistic regression model in its simplest form (one explanatory variable) is shown in Equation (1) [36]. This regression model was used to analyze the relationship between the days of storage and the marketability of the tomato fruits from each cultivar.
The logit function transforms the probability scale from the range (0, 1) to (−∞, +∞). The logistic regression formula for an explanatory variable involves the following formula for the probability π (x):
where π (x) is the probability that a tomato fruit is marketable for a value x that can be a categorical variable (e.g., cultivar) or a continuous one (e.g., days of storage (DOS)). The parameters α and β are the intersection and the slope [20,36].
Equation (1) can be generalized to multiple independent continuous and/or categorical explanatory variables. This equation is known as multiple logistic regression, and its expression is as follows [32,33].
where π (x) is the marketability probability of the tomato given a set of n explanatory variables xi (i = 1,..., n), which can be categorical variables (e.g., cultivar) or continuous ones (e.g., days of storage (DOS)), α is the intersection parameter, and βi are the slope parameters for the primary effects of each explanatory variable (i = 1,..., n) [19,32].
We used the multiple logistic regression model to evaluate significant predictors of marketability probability for all the explanatory variables considered in the study. Equation (3) was also used to determine the effect of the most influential explanatory variables on the marketability of the tomato cultivars. For the logistic regression analysis, IBM SPSS Statistics Version 23 and Statgraphics Centurion XVII–X64 software were used.
The inferential calculation of the logistic regression parameters consists of calculating the parameter values to maximize the marketability probability of the observed data. For this purpose, the maximum likelihood estimation method was applied [36].
The interpretation of a logistic regression model involves probabilities and odds ratios. For Equation (1), the probabilities of response 1 (that is, the probabilities of success) are as follows.
The interpretation of β in (5) can be understood as for each increase of one unit in x, the probabilities are multiplied by eβ. That is, the probabilities at the level x + 1 are equal to the probabilities at x multiplied by eβ. When β = 0, eβ = 1 and the probabilities do not change as x changes. [32,36]. Odds ratios are measures of association that are widely used, especially in epidemiology [37].
3. Results and Discussion
3.1. Influence of Days in Storage on the Marketability Probability Based on Simple Independent Logistic Regressions for Each Cultivar
The temporal evolution of the marketability probability for the fruits of the cherry tomato cultivars are shown in Figure 2. These models were obtained from the simple logistic regression for each cultivar and adjusted for the days of storage (DOS). The adjusted model predicts the probability that the tomato fruits of each cultivar can be marketed during storage. All the simple logistic regression models were statistically significant (p < 0.05). The regression coefficients, the odds ratios (Exp (β)), and their lower and upper 95% confidence limits were calculated (Figure 2).
The marketability probability refers to the global changes in postharvest fruit quality related to the loss of firmness, cracking, rotting, etc. that occurs under the experimental storage conditions. Negative regression coefficients show a negative relationship (e.g., Equation (6)), which indicates that as the length of time the fruit remains in storage increases and the marketability probability decreases, as described by other authors [19,20,33]. For example, at 0 days of storage, the marketability probability was 100% for the cultivars ‘Angelle’, ‘Genio’, and ‘Santyplum’, and it reached 99% in ‘Dolchettini’. By contrast, after 14 days of storage, the marketability probability was reduced to 97% in the case of ‘‘Santyplum’’, 90% in ‘Dolchettini’, 86% in ‘Angelle’, and 85% in ‘Genio’ (Figure 2).
In CE Regulation n 182/2011 [38], specific provisions are established for the marketability of certain agricultural products, allowing for a total marketing tolerance of 5% for tomatoes (in number or by weight) in the Extra category and 10% in categories I and II. In practice, a 5% tolerance is usually allowed for the marketing of tomatoes in the European Union. A tolerance level of 5% for noncommercial fruits (95% for commercial fruits) is also included in Figure 2. When comparing the simple logistic regression models for each cultivar with respect to the line representing 95% of marketable fruits, it can be observed that the noncommercial fruits reached 5% after 10 days of storage for ‘Genio’, ‘Angelle’, and ‘Dolchettini’ and at 15 DOS for ‘Santyplum’ (Figure 2). However, when we performed a multiple analysis based on the continuous variable DOS and the categorical variable cultivar (Figure 3 and Table 1), the probability of obtaining a 5% tolerance in noncommercial fruits was obtained after 10 days in the case of ‘Angelle’ and ‘Genio’ and at 13 days for ‘Dolchettini’ and ‘Santyplum’.
The odds ratios show the decreased marketability probability during the storage of each of the cultivars. The odds ratio of 0.816 for DOS in the cultivar ‘Angelle’ indicates that for a one day increase in storage, the odds of marketability decreases by (1 − 0.8116) × 100 = 18.4%. In the other cultivars was 18.5% for ‘Dolchettini’, 23.0% for ‘Genio’, and 32.7% for ‘Santyplum’.
3.2. Effects of the Cultivar and Days of Storage as Influencing Factors on the Marketability Probability
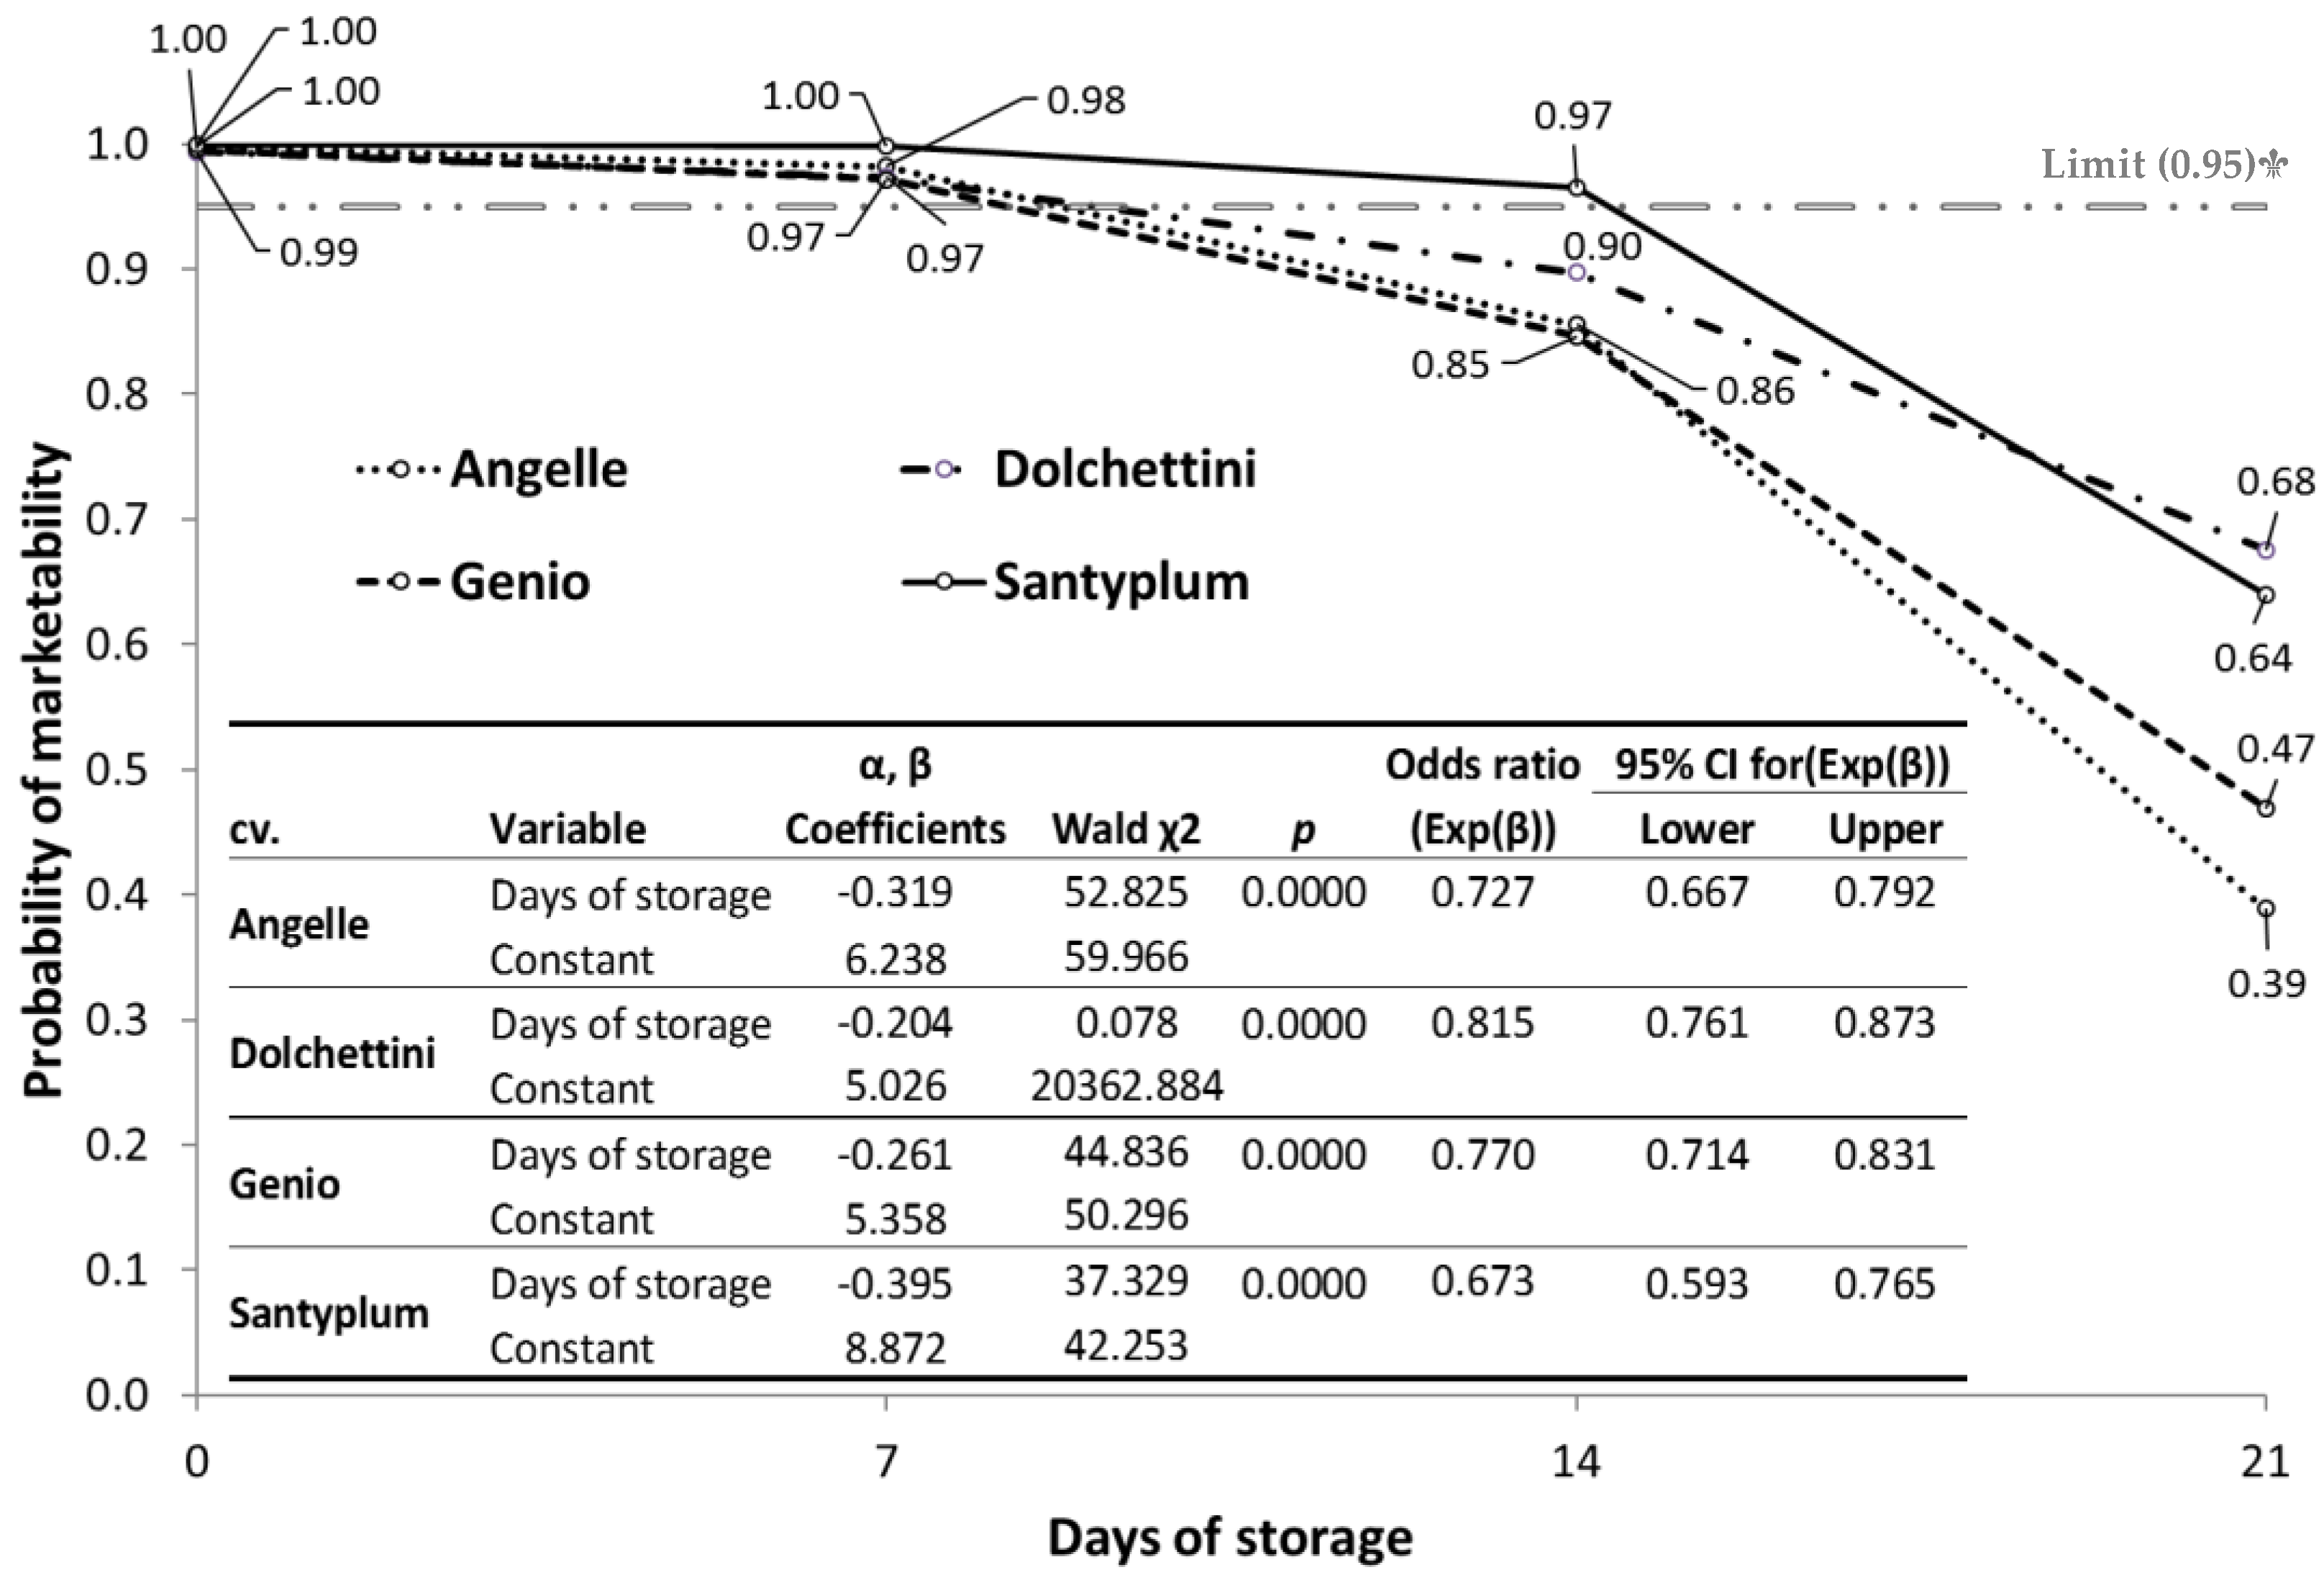
The response of the marketability probability to the combined effect of the type of cultivar and the days of storage was studied (Table 1 and Figure 3). The regression coefficients, the odds ratios (and their confidence limits), and the significance for each of the variables were calculated when each of the cultivars was used as a reference in the multiple logistic regression model (Table 1). The fit for most of the variables to the multiple logistic regression models was significant, except for ‘Dolchettini’ when considering ‘Santyplum’ as a reference (and vice versa) and ‘Angelle’ when considering ‘Genio’ as a reference (and vice versa).
The odds ratio is the ratio of the probability that an event will occur in one group with respect to the probability of the same event occurring in another group [20]. The odds ratio for the days of storage was 0.753, so each day of storage under the studied conditions produced a decrease of 24.7% in the marketability probability if the cultivars = 1. The odds ratios for each cultivar shows the relationship between the marketability probability of a cultivar with respect to the reference cultivar. Odds ratios greater than one indicate that this cultivar has a greater marketability probability than the reference cultivar. However, if the value is less than one, then the cultivar has a lower marketability probability with respect to the reference cultivar. For example, a change from the cultivar ‘Santyplum’ to ‘Angelle’ corresponds to an odds ratio of 0.386, which indicates that the marketability probability is approximately 2.59 times higher (in terms of probabilities) for ‘Santyplum’ than for ‘Angelle’. In general, the highest odds ratios occurred in ‘Dolchettini’ and ‘Santyplum’ in contrast to ‘Angelle’ and ‘Genio’, which indicates that the former showed greater marketability (in terms of probabilities) than the latter (Table 1). This finding is corroborated in Figure 3 in which the behavior of the marketability probability is plotted according to the days under storage for the four cultivars of cherry tomatoes according to the multiple regression analysis in Table 1.
3.3. Effects of the Firmness and Cultivar as Influencing Factors on the Marketability Probability
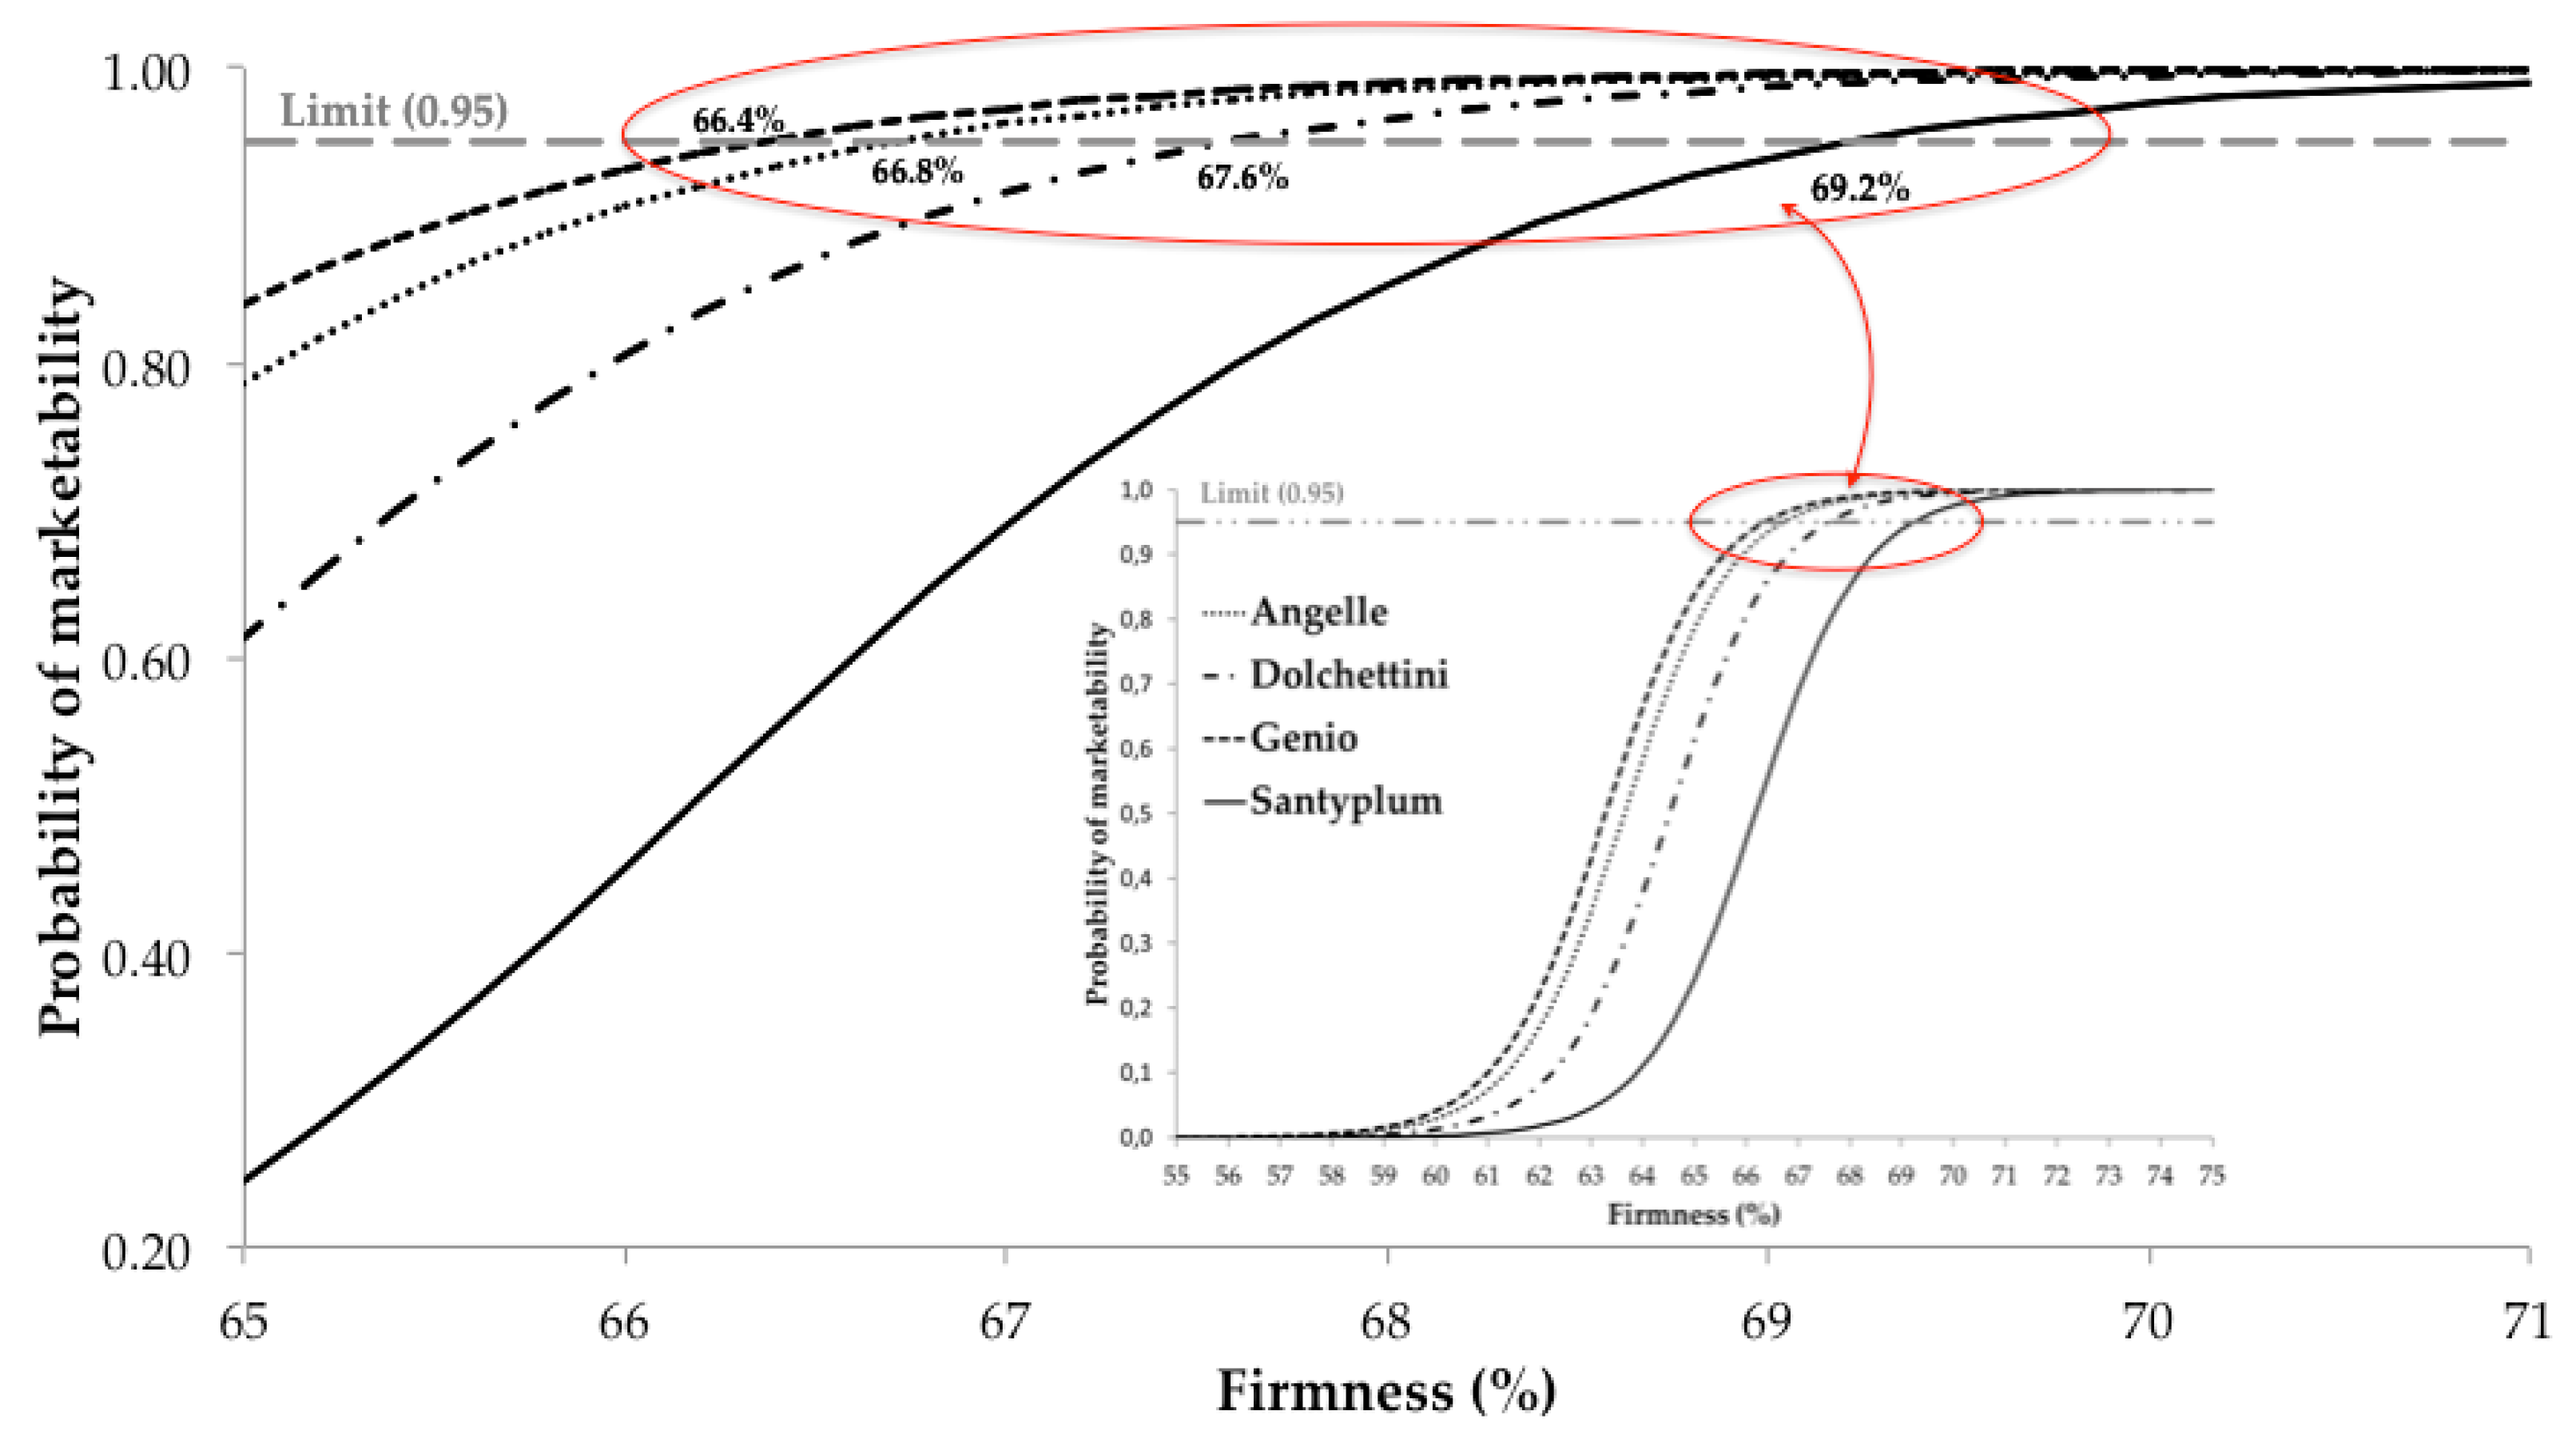
One of the primary causes of postharvest loss in tomatoes is the softening of the fruit [18,39]. The fruit firmness has a strong influence on the marketability probability of the tomato, as shown by logistic regression models [19]. The combined effect of the type of cultivar and the fruit firmness on the marketability probability was analyzed, that is, the marketability probability of the cultivars was studied based on the firmness (Table 2). Most variables were significant. The firmness values show a positive relationship with the marketability probability of the tomato fruit (Figure 4), coinciding with the findings already described by other authors [19,33].
The odds ratios were also studied. The odds ratio for fruit firmness was 2.62, which indicates that an increase in the firmness by one unit produces an increase in the marketability probability of 162% (if the cultivars = 1). For cultivars, odds ratios greater than one unit indicate an increase in the marketability probability with respect to the reference cultivar, and the opposite is true when the value is less than one. For example, when ‘Santyplum’ was employed as a reference, the cultivars ‘Dolchettini’, ‘Angelle’, and ‘Genio’ showed 4.898, 11.343, and 16.055 times more marketability probability, respectively, in terms of firmness. This result indicates that, for example, the marketability probability of ‘Santyplum’ is 16.055 times more sensitive to the firmness variable than that of ‘Genio’ (Table 2). In general, the cultivar with the highest marketability probability based on firmness was ‘Genio’, followed by ‘Dolchettini’, ‘Angelle’, and, finally, ‘Santyplum’ (Figure 4).
Figure 4 shows the graph of the predicted probability versus fruit firmness for the different cultivars and the line corresponding to 5% of noncommercial fruits [38]. The firmness associated with the predicted probability of 0.95 for a fruit to be rejected due to lack of firmness, occurred for firmness values of 66.8% in ‘Angelle’, in ‘Dolchettini’ from 67.6%, in ‘Genio’ in 66.4%, and in ‘Santyplum’ in 69.2%.
3.4. Multiple Logistic Regression Model Fit Based on All the Studied Explanatory Variables
The result of the multiple logistic regression model based on several continuous and categorical explanatory variables is shown in Table 3. Estimates of the model parameters, and Wald's upper and lower 95% confidence limits for the estimates of the parameters and the odds ratios were calculated.
The categorical variables included in the model were the tomato cultivars (‘Angelle’, ‘Dolchettini’, ‘Genio’, and ‘Santyplum’) and the months of the crop cycle during which the fruits were evaluated (November, December, January, and April). The continuous variables considered in the model were the fruit firmness and days of storage (DOS). The high correlative effect of some dependent variables on the multiple regression models can generate nonsignificant effects in other dependent variables [19]. In our case, the days of storage (DOS), the firmness, and the months during which the fruits were evaluated (month) were variables with high correlative effects, which, after backward elimination, resulted in a final model that only included variables that were significantly associated with noncommercial fruits. The final model did not include tomato cultivars (cv). This result could be due to the fact that the correlation of the cv with the other variables is significantly lower. Although the model in our study did not include the tomato cultivar variable (cv), there are other variables presenting higher correlations that are interesting (Table 3).
The independent variables DOS, firmness, and month used to predict the marketability probability of the tomato fruits showed a significant fit with the multiple logistic regression model (p < 0.05). The month of collection is an important variable in the model. The month of April is not included in Table 3 because it was used as a reference in the multiple logistic regression model. The odds ratio showed that the November marketability probabilities were 75.239 times higher than those of April, when keeping all the other factors fixed. In December and January, the marketability probabilities were 125.759 and 12.309 higher, respectively, than they were in April (Table 3).
Some researchers have done previous work in which they applied logistic regression models in the study of postharvest in fruits. Logistic regression models were considered the best statistical tools for the evaluation of bruising development in tomato cultivars [40]; they successfully analyzed the effect of storage temperature on the avocado fruit [41], identified the factors that influence the decomposition of the nucleus in pear fruits [33], quantified the factors associated with the microbial contamination of the product in the pre- and postharvest phases in 14 types of fruits and vegetables [42], evaluated the quality of the tomato subjected to different treatments before and after the harvest [19,20], and the loss of quality in chicory associated with the discoloration of the head of the leaves was evaluated [43]. In these works, the effect of continuous and categorical variables on changes in fruit quality could be identified by logistic regression analysis. In the present work a similar approach has been applied to identify changes in postharvest quality for different tomato cultivars.
4. Conclusions
The logistic regression model allows investigators to study and identify tomato cultivars with good attributes in relation to postharvest marketability. The combination of simple and multiple regression analyses of the continuous and categorical variables with the greatest influence on the commercial quality in postharvest tomato fruits can help to determine the behaviors of different cultivars and identify those with the greatest marketability probability. In addition, the logistic model allowed to determine the firmness values for each cultivar from which a fruit would be rejected commercially. The approach of the developed model can be used by companies that are developing new tomato cultivars, by farmers-processors, and by distributors (wholesalers and retailers) since it is based on simple measurement parameters (firmness, cracking, etc.) that represent the primary causes of postharvest loss.
An analysis of the odds ratios can determine whether a cultivar improves upon or makes the marketability probability worse when it is substituted for another cultivar. Of the cultivars studied here, ‘Santyplum’ and ‘Dolchettini’ had greater marketability than ‘Angelle’ and ‘Genio’. The odds ratios can also determine the marketability probability of the cultivars based on their firmness. In our study, the marketability probability of the ‘Santyplum’ cultivar had the greatest sensitivity to the fruit firmness.
In a multiple logistic regression based on continuous and categorical explanatory variables, only highly correlated variables are included in the final model. It was found that the firmness, days of storage, and months evaluated are the primary determining factors in tomato marketability. The cultivar variable was not included in the final model because it was weakly correlated with the other variables. Nevertheless, this analysis is interesting in light of the other highly correlated variables.
This type of study can be applied to any type of tomato fruit whose collection and marketability are based on loose fruit. Additionally, it would be interesting to perform these same studies in the context of marketing the complete tomato branch.
Author Contributions
All authors contributed equally to the manuscript, and have approved the final manuscript.
Funding
This research received no external funding.
Acknowledgments
University Research Contract Numbers 401309 and 401287.
Conflicts of Interest
The authors declare no conflict of interest.
References and Note
- Simonne, A.H.; Behe, B.K.; Marshall, M.M. Consumers prefer low-priced and high-lycopene-content fresh-market tomatoes. HortTechnology 2006, 4, 674–681. [Google Scholar]
- Toor, R.K.; Savage, G.P. Changes in major antioxidant components of tomatoes during postharvest storage. Food Chem. 2006, 99, 724–727. [Google Scholar] [CrossRef]
- Beckles, D.M. Factors affecting the postharvest soluble solids and sugar content of tomato (Solanum lycopersicum L.) fruit. Postharvest Biol. Technol. 2012, 1, 129–140. [Google Scholar] [CrossRef]
- Sibomana, M.S.; Ziena, L.W.; Schmidt, S. Influence of transportation conditions and postharvest disinfection treatments on microbiological quality of fresh market tomatoes (cv. Nemo-netta) in a South African supply chain. J. Food Protect. 2017, 2, 345–354. [Google Scholar] [CrossRef] [PubMed]
- Gustavsson, J.; Cederberg, C.; Sonesson, U.; Van Otterdijk, R. The Methodology of the FAO Study: “Global Food Losses and Food Waste—Extent, Causes and Prevention”—FAO, 2011. Available online: http://www.diva-portal.org/smash/get/diva2:944159/FULLTEXT01.pdf (accessed on 24 July 2018).
- Sibomana, M.S.; Workneh, T.S.; Audain, K. A review of postharvest handling and losses in the fresh tomato supply chain: A focus on sub-saharan Africa. Food Secur. 2016, 2, 389–404. [Google Scholar] [CrossRef]
- Macheka, L.; Spelt, E.J.; Bakker, E.J.; van der Vorst, J.G.; Luning, P.A. Identification of determinants of postharvest losses in Zimbabwean tomato supply chains as basis for dedicated interventions. Food Control 2018, 87, 135–144. [Google Scholar] [CrossRef]
- Buntong, B.; Srilaong, V.; Wasusri, T.; Kanlayanarat, S.; Acedo, A.L.J. Reducing postharvest losses of tomato in traditional and modern supply chains in Cambodia. Int. Food Res. J. 2013, 1, 233–238. [Google Scholar]
- Iotti, M.; Bonazzi, G. Analysis of the Risk of Bankruptcy of Tomato Processing Companies Operating in the Inter-Regional Interprofessional Organization “OI Pomodoro da Industria Nord Italia. Sustainability 2018, 10, 947. [Google Scholar] [CrossRef]
- Gamboa, G.; Kovacic, Z.; Di Masso, M.; Mingorría, S.; Gomiero, T.; Rivera-Ferré, M.; Giampietro, M. The Complexity of Food Systems: Defining Relevant Attributes and Indicators for the Evaluation of Food Supply Chains in Spain. Sustainability 2016, 8, 515. [Google Scholar] [CrossRef]
- Takeda, F.; Yang, W.; Li, C.; Freivalds, A.; Sung, K.; Xu, R.; Hu, B.; Williamson, J.; Sargent, S. Applying New Technologies to Transform Blueberry Harvesting. Agronomy 2017, 7, 33. [Google Scholar] [CrossRef]
- Prusky, D. Reduction of the incidence of postharvest quality losses, and future prospects. Food Secur. 2011, 4, 463–474. [Google Scholar] [CrossRef]
- Hoeberichts, F.A.; Linus, H.W.; Plas, V.D.; Woltering, E.J. Ethylene perception is required for the expression of tomato ripening-related genes and associated physiological changes even at advanced stages of ripening. Postharvest Biol. Technol. 2002, 26, 125–133. [Google Scholar] [CrossRef]
- Adams, M.R.; Hartley, A.D.; Cox, L.J. Factors affecting the efficacy of washing procedures used in the production of prepared salads. Food Microbiol. 1989, 6, 69–77. [Google Scholar] [CrossRef]
- Kader, A.A. Flavor quality of fruits and vegetables. J. Sci. Food. Agric. 2008, 11, 1863–1868. [Google Scholar] [CrossRef]
- Cantwell, M.; Nie, X.; Hong, G. Impact of storage conditions on grape tomato quality. In Proceedings of the 6th ISHS Postharvest Symposium, Antalya, Turkey, 8–12 April 2009. [Google Scholar]
- Kader, A.A. Effects of postharvest handling procedures on tomato quality. Acta Hortic. 1986, 190, 209–222. [Google Scholar] [CrossRef]
- Kader, A.A. Postharvest quality maintenance of fruits and vegetables in developing countries. In Postharvest Physiology and Crop Preservation; Lieberman, M., Ed.; Plenum Press: New York, NY, USA, 1983; pp. 455–470. [Google Scholar] [CrossRef]
- Tolesa, G.N.; Workneh, T.S.; Melesse, S.F. Logistic regression analysis of marketability of tomato fruit harvested at different maturity stages and subjected to disinfection, storage condition and storage period treatments. Biol. Agric. Hortic. 2017, 1, 40–52. [Google Scholar] [CrossRef]
- Melesse, S.; Sobratee, N.; Workneh, T.S. Application of logistic regression statistical technique to evaluate tomato quality subjected to different pre-and postharvest treatments. Biol. Agric. Hortic. 2016, 4, 277–287. [Google Scholar] [CrossRef]
- Tzortzakis, N.G.; Borland, A.; Singleton, I.; Barnes, J. Impact of atmospheric ozone-enrichment on quality-related attributes of tomato fruit. Postharvest Biol. Technol. 2007, 45, 317–325. [Google Scholar] [CrossRef]
- Lurie, S. Postharvest heat treatments. Postharvest Biol. Technol. 1998, 3, 257–269. [Google Scholar] [CrossRef]
- Paull, R.E.; Chen, N.J. Heat treatment and fruit ripening. Postharvest Biol. Technol. 2000, 1, 21–37. [Google Scholar] [CrossRef]
- Kader, A.A. Increasing food availability by reducing postharvest losses of fresh produce. Acta Hortic. V Int. Postharvest Symp. 2005, 682, 2169–2176. [Google Scholar] [CrossRef]
- Sudheer, K.P.; Indira, V. Postharvest Technology of Horticultural Crops; New India Publishing Agency: New Delhi, India, 2007; p. 291. ISBN 818942243X. [Google Scholar]
- Faize, L.; Faize, M. Functional Analogues of Salicylic Acid and Their Use in Crop Protection. Agronomy 2018, 8, 5. [Google Scholar] [CrossRef]
- Adiletta, G.; Pasquariello, M.; Zampella, L.; Mastrobuoni, F.; Scortichini, M.; Petriccione, M. Chitosan Coating: A Postharvest Treatment to Delay Oxidative Stress in Loquat Fruits during Cold Storage. Agronomy 2018, 8, 54. [Google Scholar] [CrossRef]
- Polderdijk, J.J.; Tijskens, L.M.M.; Robbers, J.E.; van der Valk, H.C.P.M. Predictive model of keeping quality of tomatoes. Postharvest Biol. Technol. 1993, 2, 179–185. [Google Scholar] [CrossRef]
- Kader, A.A.; Morris, L.L.; Stevens, M.A.; Holton, M.A. Composition and flavor quality of fresh market tomatoes as influenced by some postharvest handling procedures. J. Am. Horti. Sci. 1978, 1, 6–13. [Google Scholar]
- Sirisomboon, P.; Tanaka, M.; Kojima, T.; Williams, P. Nondestructive estimation of maturity and textural properties on tomato ‘Momotaro’ by near infrared spectroscopy. J. Food Eng. 2012, 3, 218–226. [Google Scholar] [CrossRef]
- Sirisomboon, P.; Tanaka, M.; Kojima, T. Evaluation of tomato textural mechanical properties. J. Food Eng. 2012, 4, 618–624. [Google Scholar] [CrossRef]
- Hosmer, D.W.; Lemeshow, S.; Sturdivant, R.X. Applied Logistic Regression; John Wiley & Sons: Hoboken, NJ, USA, 2013; Volume 398, p. 500. ISBN 978-0-470-58247-3. [Google Scholar]
- Lammertyn, J.; Aerts, M.; Verlinden, B.E.; Schotsmans, W.; Nicolaı, B.M. Logistic regression analysis of factors influencing core breakdown in ‘Conference’ pears. Postharvest Biol. Technol. 2000, 1, 25–37. [Google Scholar] [CrossRef]
- Valero, D.; Serrano, M. Postharvest Biology and Technology for Preserving Fruit Quality; CRC Press, Taylor & Francis Group: New York, NY, USA, 2010; p. 217. ISBN 978-1-4398-0266-3. [Google Scholar]
- Collett, D.R. Modelling Binary Data, 2nd ed.; Chapman and Hall: London, UK, 2002; p. 408. ISBN 9871420057386. [Google Scholar]
- Agresti, A. An Introduction to Categorical Data Analysis, 2nd ed.; John Wiley & Sons: Hoboken, NJ, USA, 1996; p. 372. ISBN 978-0-471-22618-5. [Google Scholar]
- Rothman, K.J.; Greenland, S.; Lash, T.L. Modern epidemiology, 3rd ed.; Lippincott Williams & Wilkins: Philadelphia, PA, USA, 2008; p. 758. ISBN 9781451190052. [Google Scholar]
- Commission Implementing Regulation (EU) No 543/2011 of 7 June 2011. Laying down detailed rules for the application of Council Regulation (EC) No 1234/2007 in respect of the fruit and vegetables and processed fruit and vegetables sectors
- Fagundes, C.; Moraes, K.; Pérez-Gago, M.B.; Palou, L.; Maraschin, M.; Monteiro, A.R. Effect of active modified atmosphere and cold storage on the postharvest quality of cherry tomatoes. Postharvest Biol. Technol. 2015, 109, 73–81. [Google Scholar] [CrossRef]
- Van linden, V.; De Ketelaere, B.; Desmet, M.; De Baerdemaeker, J. Determination of bruise susceptibility of tomato fruit by means of an instrumented pendulum. Postharvest Biol. Technol. 2006, 1, 7–14. [Google Scholar] [CrossRef]
- Dixon, J.; Pak, H.A.; Smith, D.B.; Elmsly, T.A. New Zealand avocado fruit quality: The impact of storage temperatura and maturity. In Proceedings of the V World Avocado Congress, Granada and Málaga, Spain, 19–24 October 2003. [Google Scholar]
- Ailes, E.C.; Leon, J.S.; Jaykus, J.L.M.; Clayton, H.A.; Blanding, S.; Kleinbaum, D.G.; Backer, L.C.; Moe, C.L. Microbial concentrations on fresh produce are affected by postharvest processing, importation, and season. J. Food Prot. 2008, 71, 2389–2397. [Google Scholar] [CrossRef] [PubMed]
- Vanstreels, E.; Lammertyn, J.; Verlinden, B.E.; Gillis, N.; Schenk, A.; Nicolai, B.M. Red discoloration of chicory under controlled atmosphere conditions. Postharvest Biol. Technol. 2002, 3, 313–322. [Google Scholar] [CrossRef]
Figure 1.
Diagram of the interest in and practical application of the logistic regression model in comparative studies of tomato cultivars to identify the cultivars with the longest postharvest commercial lives. Where π (x) is the probability that a tomato fruit is marketable, “x” are the days of storage, “e” is Euler’s number, “α” is the intersection, and “β” is the slope parameter.
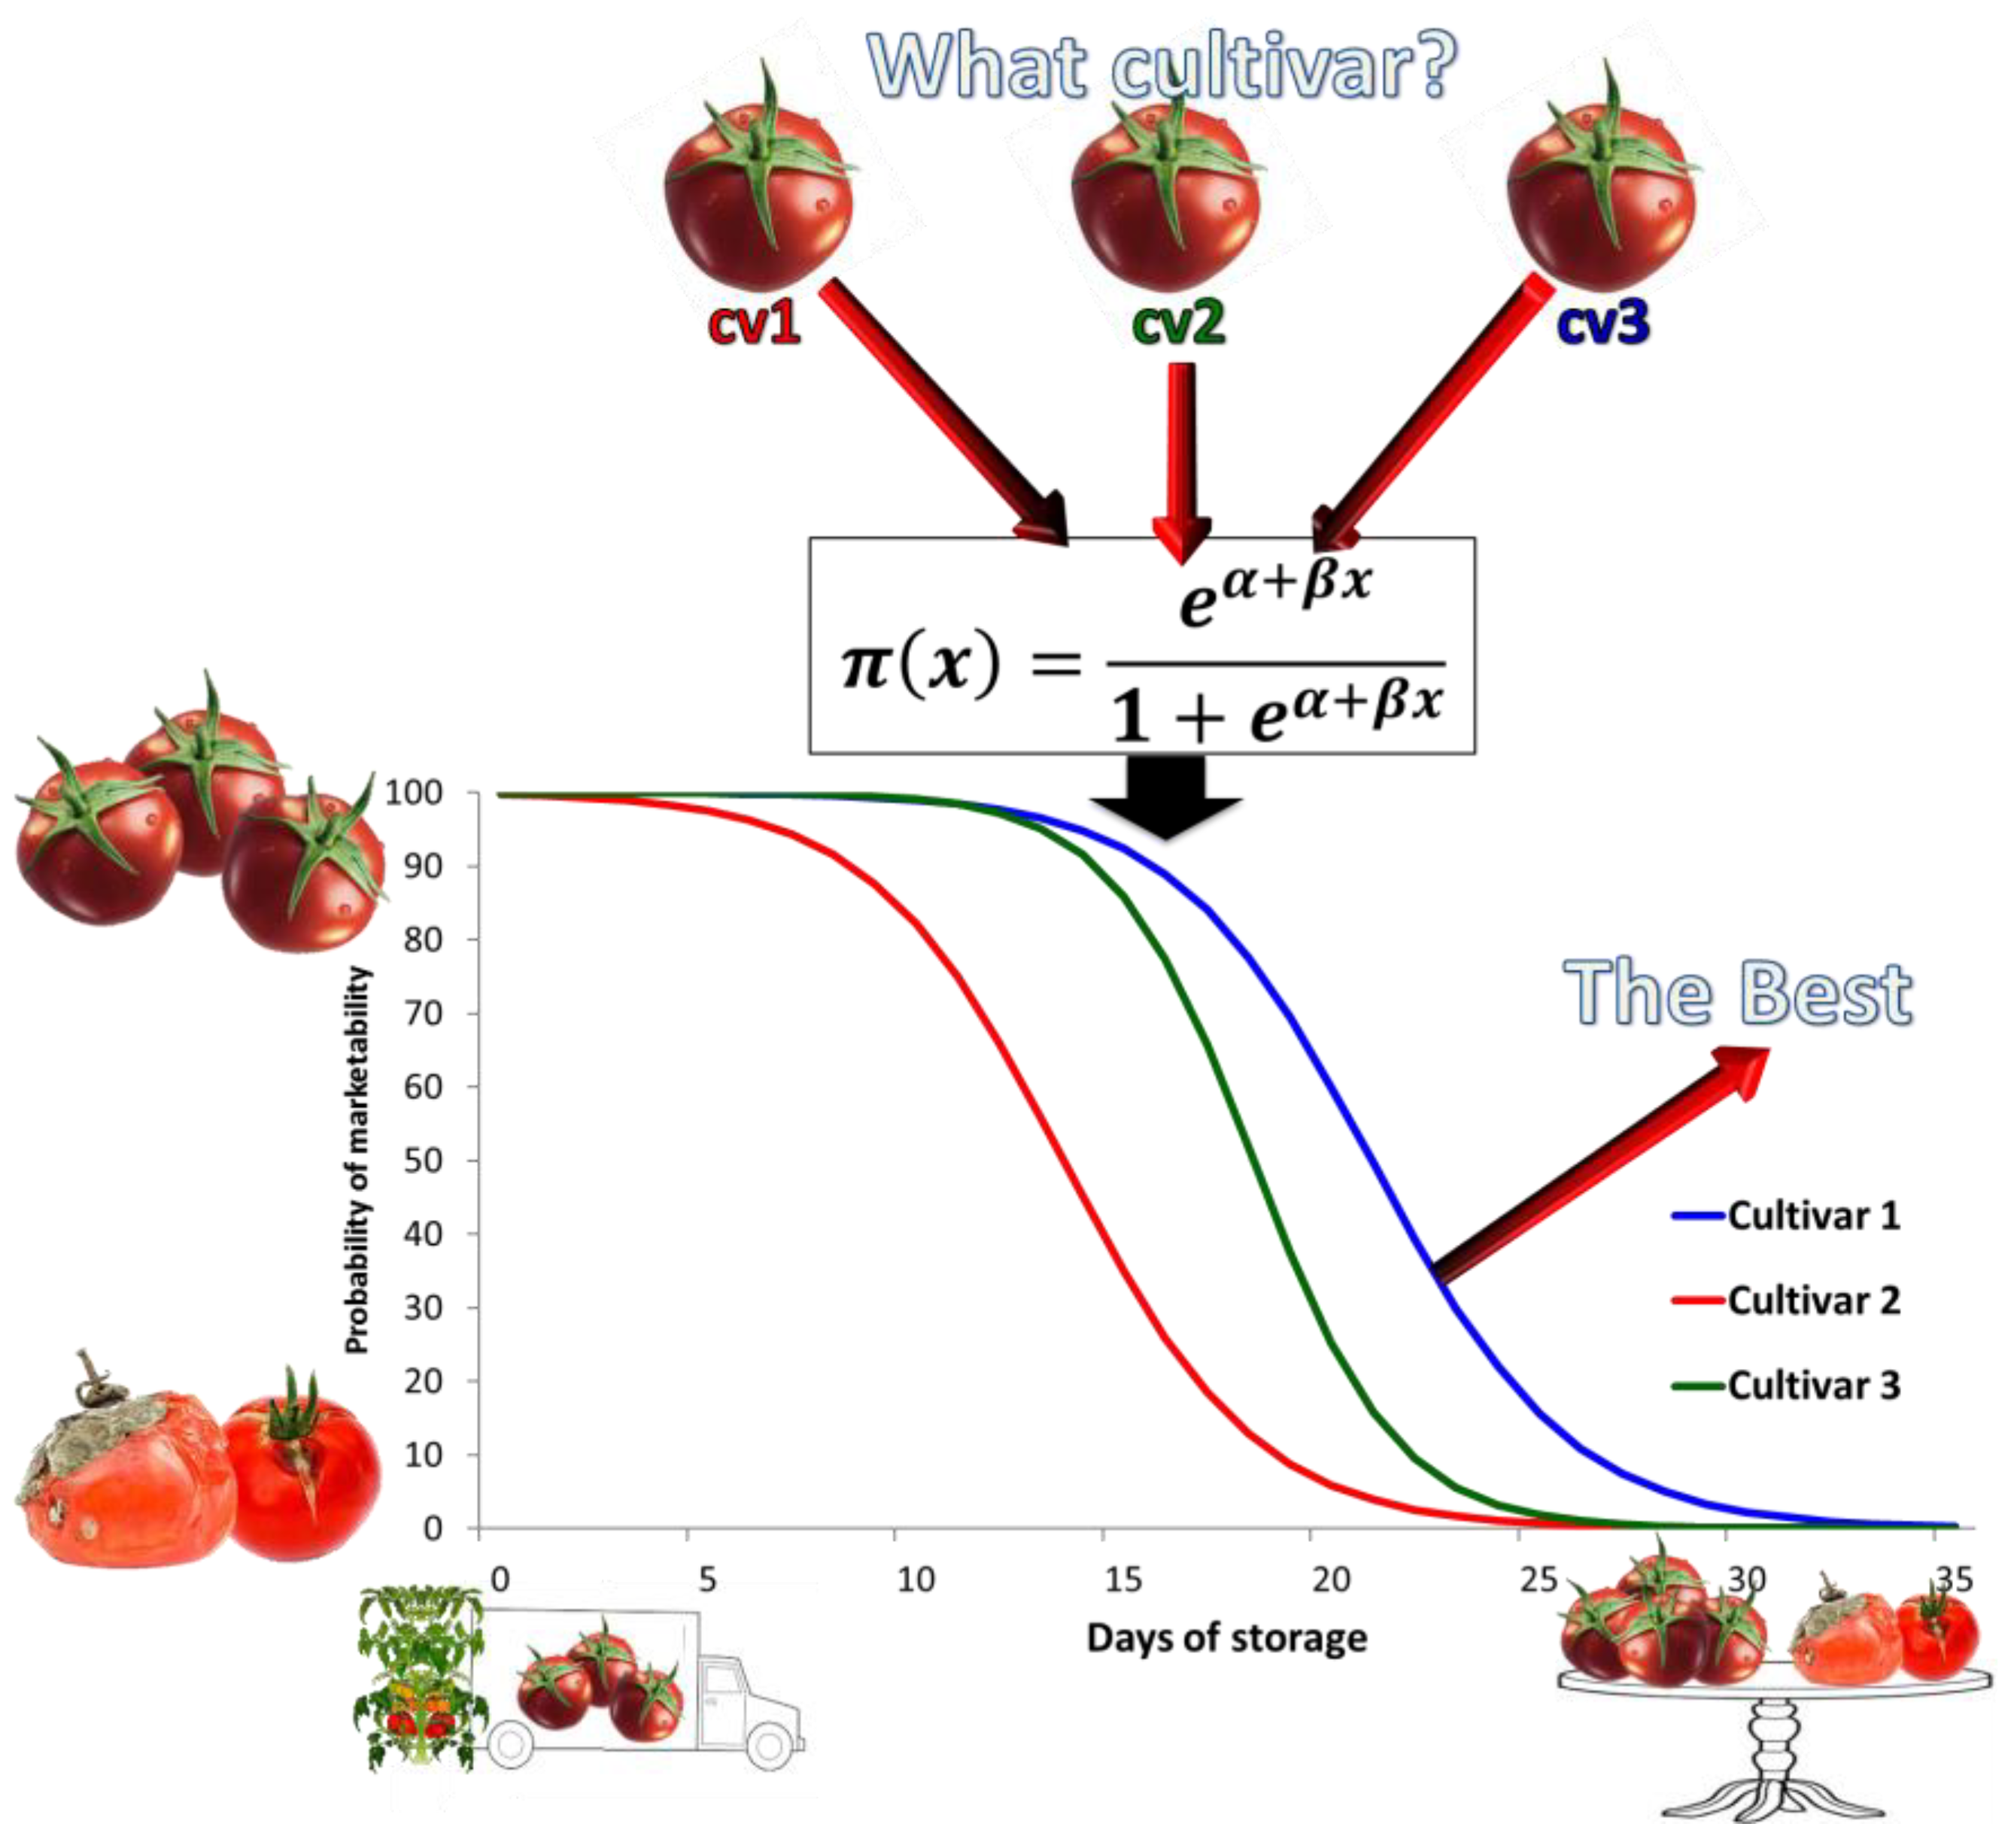
Figure 2.
Temporal evolution of the marketability probability for the studied cherry tomato cultivars. The results originate from the simple independent logistic model for each cultivar based on the days of storage. The Hosmer and Lemeshow test: p > 0.05.
Figure 2.
Temporal evolution of the marketability probability for the studied cherry tomato cultivars. The results originate from the simple independent logistic model for each cultivar based on the days of storage. The Hosmer and Lemeshow test: p > 0.05.

Figure 3.
Temporal evolution of the marketability probability based on days of storage for the ‘Angelle’, ‘Genio’, ‘Dolchettini’, and ‘Santyplum’ cultivars.
Figure 3.
Temporal evolution of the marketability probability based on days of storage for the ‘Angelle’, ‘Genio’, ‘Dolchettini’, and ‘Santyplum’ cultivars.
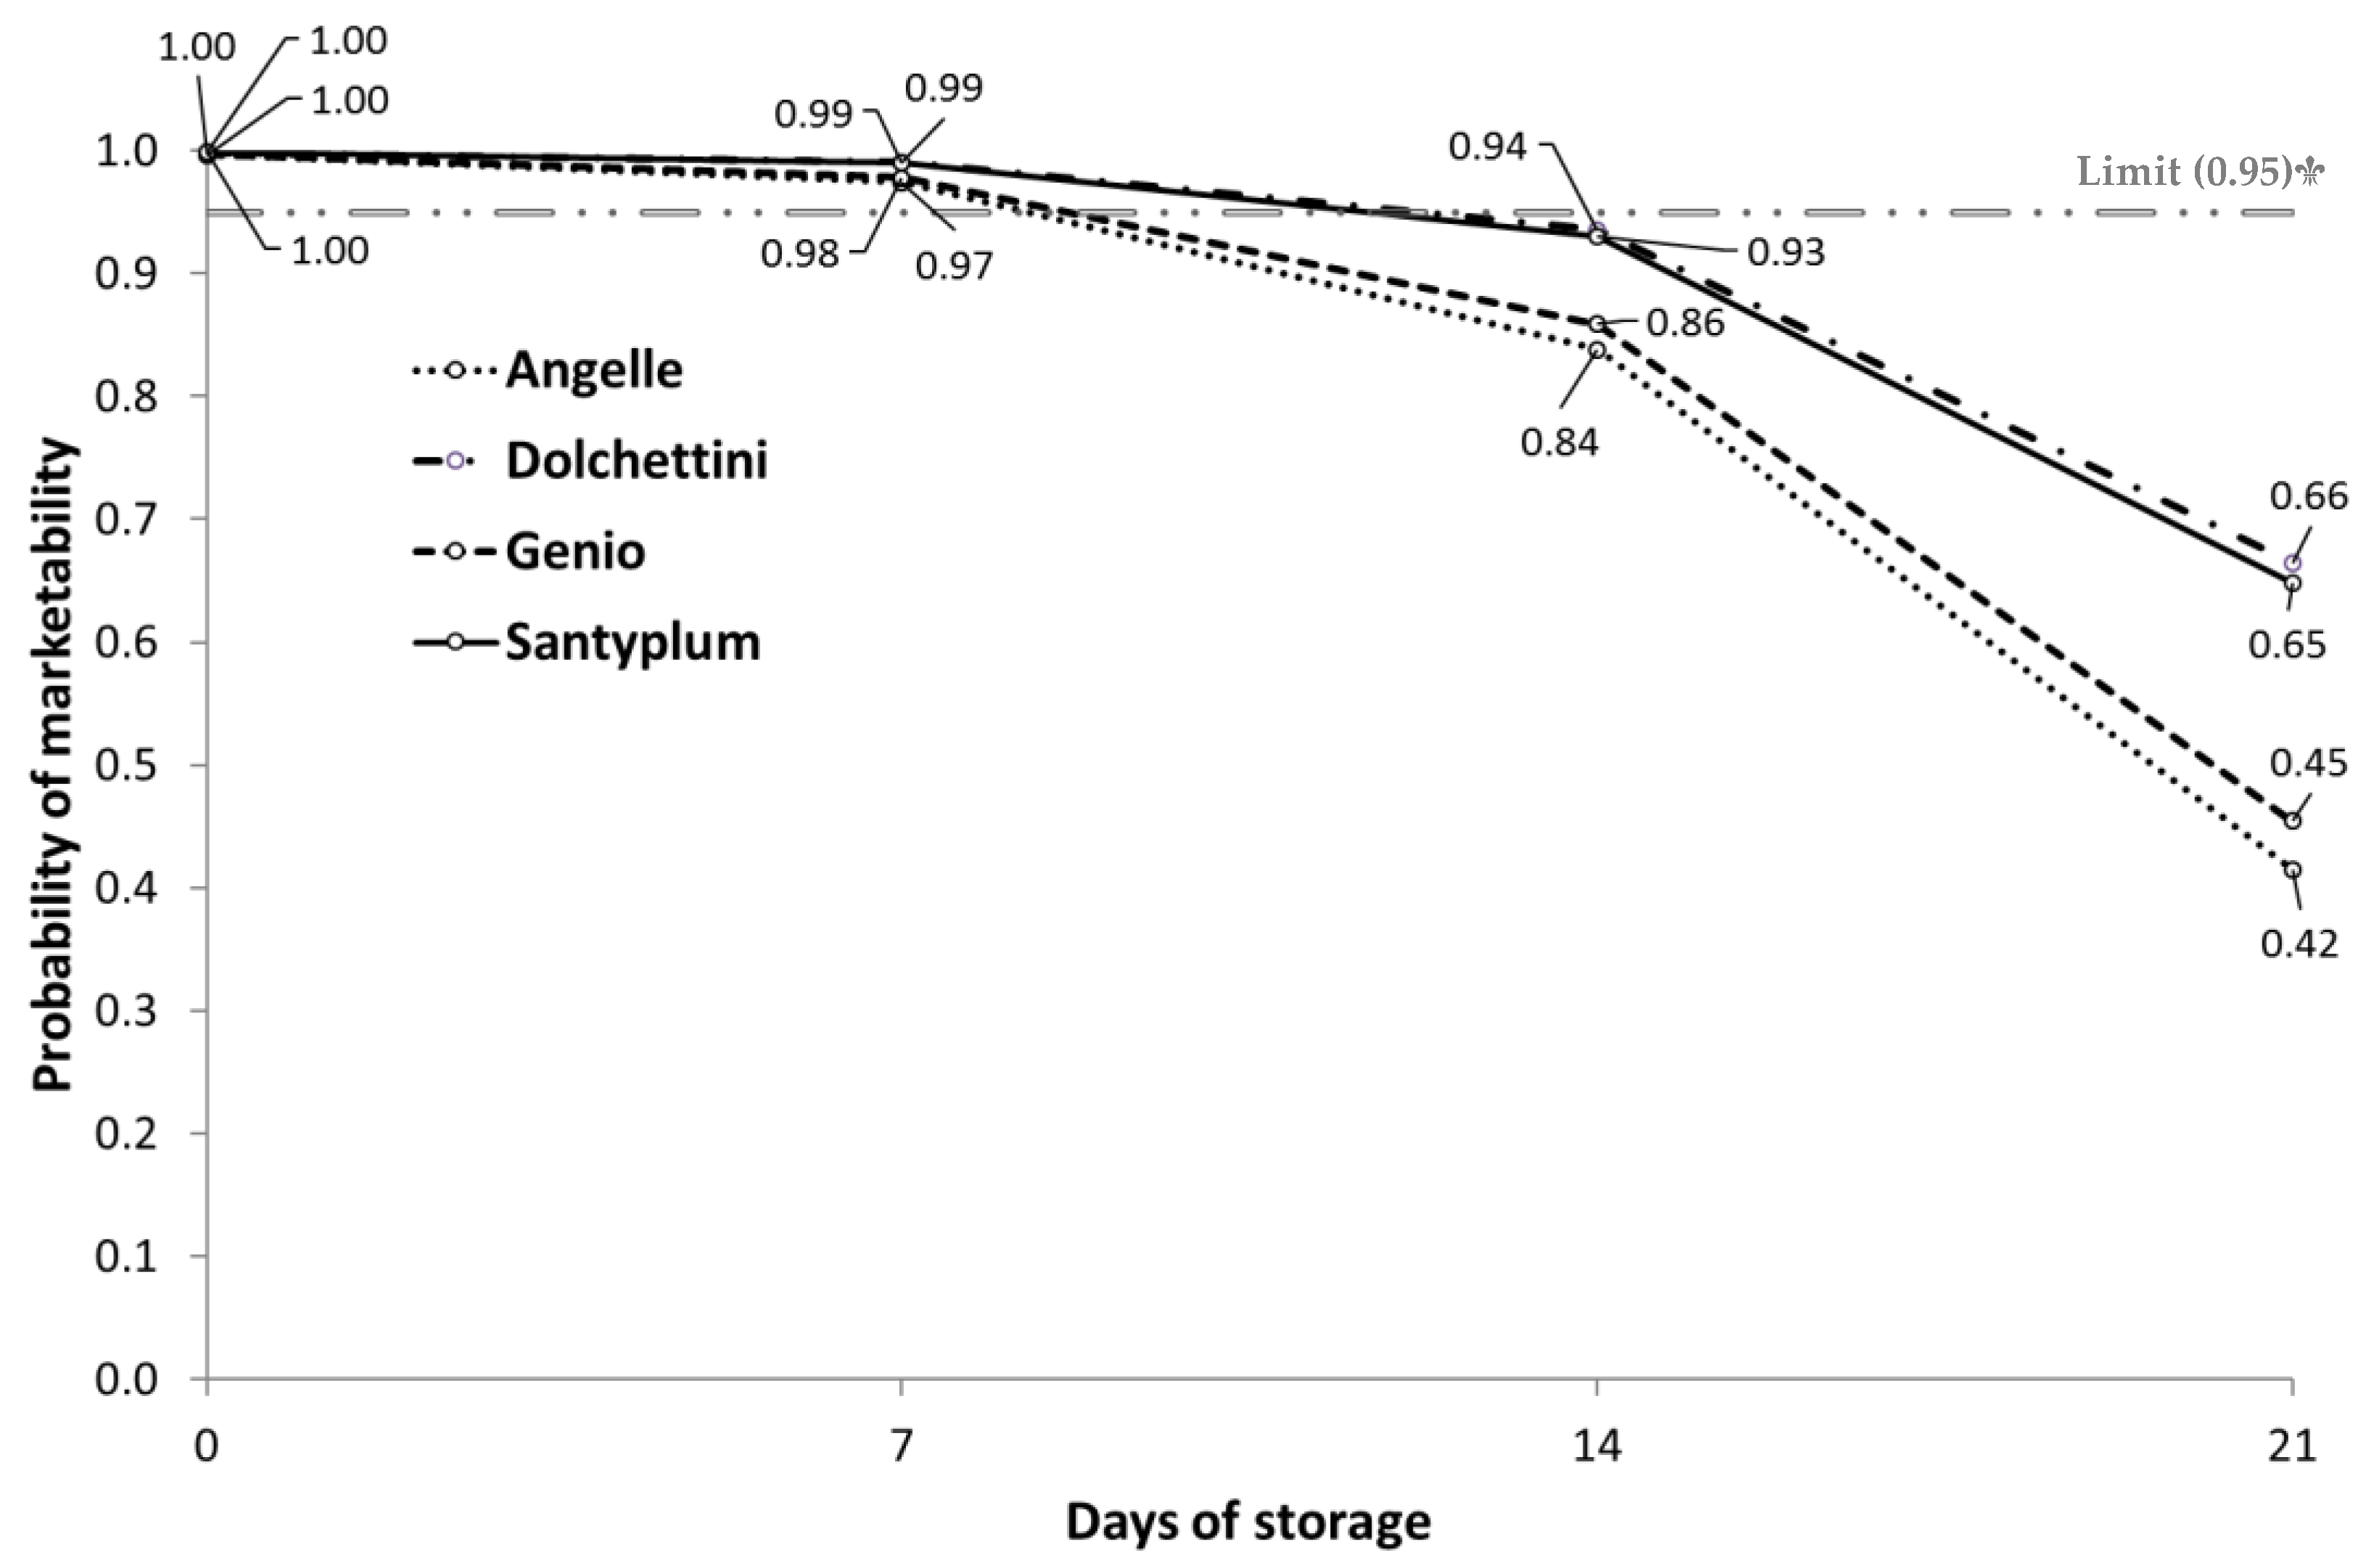
Figure 4.
Temporal evolution of the marketability probability based on firmness in the cultivars ‘Angelle’, ‘Genio’, ‘Dolchettini’, and ‘Santyplum’.
Figure 4.
Temporal evolution of the marketability probability based on firmness in the cultivars ‘Angelle’, ‘Genio’, ‘Dolchettini’, and ‘Santyplum’.


Table 1.
Estimates of logistic regression parameters for cultivars and days of storage (DOS) as influencing factors on the marketability probability.
Table 1.
Estimates of logistic regression parameters for cultivars and days of storage (DOS) as influencing factors on the marketability probability.
| Variables | α, β Coefficients a | Wald χ2 | p | Odds Ratio (Exp (β)) | 95% CI for | (Exp(β)) b |
|---|---|---|---|---|---|---|
| Lower | Upper | |||||
| Constant | 6.573 | 185.705 | <0.000 | 715.527 | ||
| DOS | −0.284 | 170.626 | <0.000 | 0.753 | 0.722 | 0.786 |
| ‘Angelle’ | −0.952 | 11.435 | 0.001 | 0.386 | 0.222 | 0.670 |
| ‘Genio’ | −0.793 | 6.772 | 0.009 | 0.452 | 0.249 | 0.822 |
| ‘Dolchettini’ | 0.075 | 0.056 | 0.813 | 1.078 | 0.580 | 2.002 |
| ‘Santyplum’ | Reference | |||||
| Constant | 6.648 | 164.583 | <0.000 | 771.114 | ||
| DOS | −0.284 | 170.626 | <0.000 | 0.753 | 0.722 | 0.786 |
| ‘Santyplum’ | −0.075 | 0.056 | 0.813 | 0.928 | 0.499 | 1.724 |
| ‘Angelle’ | −1.027 | 10.298 | 0.001 | 0.358 | 0.191 | 0.671 |
| ‘Genio’ | −0.868 | 6.547 | 0.011 | 0.420 | 0.216 | 0.816 |
| ‘Dolchettini’ | Reference | |||||
| Constant | 5.780 | 152.953 | <0.000 | 323.679 | ||
| DOS | −0.284 | 170.626 | <0.000 | 0.753 | 0.722 | 0.786 |
| ‘Dolchettini’ | 0.868 | 6.547 | 0.011 | 2.382 | 1.225 | 4.632 |
| ‘Santyplum’ | 0.793 | 6.772 | 0.009 | 2.211 | 1.216 | 4.018 |
| ‘Angelle’ | −0.158 | 0.281 | 0.596 | 0.853 | 0.475 | 1.534 |
| ‘Genio’ | Reference | |||||
| Constant | 5.621 | 175.057 | <0.000 | 276.251 | ||
| DOS | −0.284 | 170.626 | <0.000 | 0.753 | 0.722 | 0.786 |
| ‘Genio’ | 0.158 | 0.281 | 0.596 | 1.172 | 0.652 | 2.106 |
| ‘Dolchettini’ | 1.027 | 10.298 | 0.001 | 2.791 | 1.491 | 5.225 |
| ‘Santyplum’ | 0.952 | 11.435 | 0.001 | 2.590 | 1.492 | 4.497 |
| ‘Angelle’ | Reference |
a Hosmer and Lemeshow test (p = 0.122); b CI: Confidence interval.
Table 2.
Estimates of logistic regression parameters for cultivars and fruit firmness as influencing factors on the marketability probability.
Table 2.
Estimates of logistic regression parameters for cultivars and fruit firmness as influencing factors on the marketability probability.
| Variables | α, β Coefficients a | Wald χ2 | p | Odds Ratio (Exp (β)) | 95% CI for | (Exp(β)) b |
|---|---|---|---|---|---|---|
| Lower | Upper | |||||
| Constant | −63.724 | 58.665 | 0 | 0 | ||
| Firmness (%) | 0.963 | 59.548 | 0.000 | 2.620 | 2.052 | 3.347 |
| ‘Angelle’ | 2.429 | 10.990 | 0.001 | 11.343 | 2.699 | 47.678 |
| ‘Genio’ | 2.776 | 12.547 | 0.000 | 16.055 | 3.456 | 74.592 |
| ‘Dolchettini’ | 1.589 | 4.074 | 0.044 | 4.898 | 1.047 | 22.911 |
| ‘Santyplum’ | Reference | |||||
| Constant | −62.135 | 58.153 | 0.000 | 0.000 | ||
| Firmness (%) | 0.963 | 59.548 | 0.000 | 2.620 | 2.052 | 3.347 |
| ‘Santyplum’ | −1.589 | 4.074 | 0.044 | 0.204 | 0.044 | 0.955 |
| ‘Angelle’ | 0.840 | 1.376 | 0.241 | 2.316 | 0.569 | 9.423 |
| ‘Genio’ | 1.187 | 2.417 | 0.120 | 3.278 | 0.734 | 14.643 |
| ‘Dolchettini’ | Reference | |||||
| Constant | −60.948 | 58.850 | 0.000 | 0.000 | ||
| Firmness (%) | 0.963 | 59.548 | 0.000 | 2.620 | 2.052 | 3.347 |
| ‘Dolchettini’ | −1.187 | 2.417 | 0.120 | 0.305 | 0.068 | 1.363 |
| ‘Santyplum’ | −2.776 | 12.547 | 0.000 | 0.062 | 0.013 | 0.289 |
| ‘Angelle’ | −0.347 | 0.328 | 0.567 | 0.707 | 0.215 | 2.322 |
| ‘Genio’ | Reference | |||||
| Constant | −61.295 | 59.285 | 0.000 | 0.000 | ||
| Firmness (%) | 0.963 | 59.548 | 0.000 | 2.620 | 2.052 | 3.347 |
| ‘Genio’ | 0.347 | 0.328 | 0.567 | 1.415 | 0.431 | 4.651 |
| ‘Dolchettini’ | −0.840 | 1.376 | 0.241 | 0.432 | 0.106 | 1.757 |
| ‘Santyplum’ | −2.429 | 10.990 | 0.001 | 0.088 | 0.021 | 0.371 |
| ‘Angelle’ | Reference |
a Hosmer and Lemeshow test (p = 0.342); b CI: Confidence interval.
Table 3.
Parameter estimates for the multiple logistic regression model.
| Variables | α, β Coefficients | Wald χ2 | p | Odds Ratio (Exp (β)) | 95% CI for | (Exp(β)) |
|---|---|---|---|---|---|---|
| Lower | Upper | |||||
| November | 4.321 | 14.895 | <0.000 | 75.239 | 8.385 | 675.095 |
| December | 4.834 | 17.994 | <0.000 | 125.759 | 13.473 | 1173.857 |
| January | 2.510 | 7.6980 | 0.006 | 12.309 | 2.090 | 72.509 |
| DOS c | −0.124 | 5.639 | 0.018 | 0.883 | 0.797 | 0.979 |
| Firmness | 1.102 | 45.149 | <0.000 | 3.011 | 2.183 | 4.154 |
| Constant | −71.750 | 43.388 | <0.000 | ≈ 0 |
Hosmer and Lemeshow test (p = 0.162); CI: Confidence interval; c DOS: Days of storage.
© 2018 by the authors. Licensee MDPI, Basel, Switzerland. This article is an open access article distributed under the terms and conditions of the Creative Commons Attribution (CC BY) license (http://creativecommons.org/licenses/by/4.0/).
Share and Cite
MDPI and ACS Style
Díaz-Pérez, M.; Carreño-Ortega, Á.; Gómez-Galán, M.; Callejón-Ferre, Á.-J. Marketability Probability Study of Cherry Tomato Cultivars Based on Logistic Regression Models. Agronomy 2018, 8, 176. https://doi.org/10.3390/agronomy8090176
AMA Style
Díaz-Pérez M, Carreño-Ortega Á, Gómez-Galán M, Callejón-Ferre Á-J. Marketability Probability Study of Cherry Tomato Cultivars Based on Logistic Regression Models. Agronomy. 2018; 8(9):176. https://doi.org/10.3390/agronomy8090176
Chicago/Turabian StyleDíaz-Pérez, Manuel, Ángel Carreño-Ortega, Marta Gómez-Galán, and Ángel-Jesús Callejón-Ferre. 2018. "Marketability Probability Study of Cherry Tomato Cultivars Based on Logistic Regression Models" Agronomy 8, no. 9: 176. https://doi.org/10.3390/agronomy8090176
Note that from the first issue of 2016, this journal uses article numbers instead of page numbers. See further details here.