Article

Effect of Molybdenum Rate on Yield and Quality of Lettuce, Escarole, and Curly Endive Grown in a Floating System

Dipartimento Scienze Agrarie, Alimentari e Forestali, Università di Palermo, Viale delle Scienze 4, 90128 Palermo, Italy
*
Author to whom correspondence should be addressed.
Agronomy 2018, 8(9), 171; https://doi.org/10.3390/agronomy8090171
Submission received: 29 June 2018 / Revised: 24 August 2018 / Accepted: 27 August 2018 / Published: 1 September 2018

Abstract

:
Molybdenum (Mo) is required in enzymes involved in a number of different metabolic processes, and is crucial for the survival of plants and animals. The influence of nutrient solutions containing four levels of molybdenum (0, 0.5, 1.5, and 3.0 µmol/L) on growth, yield, and quality of lettuce, escarole, and curly endive grown in a hydroponic floating system was evaluated. Biometric, nutrient, and quality analyses were conducted to assess the response of each species to Mo. The results demonstrated that molybdenum is essential for harvesting marketable plants. Lettuce, escarole, and curly endive plants differed significantly in their response to molybdenum fertilization. The increase of Mo concentration in the nutrient solution was not harmful for plants and had no influence on yield and morphological traits of the leafy vegetables; however, it significantly affected some quality characteristics. Mo fertilization raised the nutritional quality by increasing ascorbic acid content up to 320.2, 139.0, and 102.1 mg kg−1 FW (fresh weight), and reducing nitrate content down to 1039.2, 1047.3, and 1181.2 mg kg−1 FW for lettuce, escarole, and curly endive, respectively. The addition of Mo in the nutrient solution increased the Mo content of plants up to 0.50, 4.02, and 2.68 μg g−1 FW for lettuce, escarole, and curly endive, respectively. Increasing Mo supply to lettuce, escarole, and curly endive up to 3.0 µmol L−1 could lead to a higher nutritional quality with no significant morphological alteration or yield loss.

1. Introduction

Micronutrients are essential for plant growth, even if they are present in plant tissue in trace amounts (0.1–200 μg kg−1) [1]. They include boron (B), copper (Cu), iron (Fe), manganese (Mn), molybdenum (Mo), zinc (Zn), nickel (Ni), and chloride (Cl). A lack of any of these micronutrients can limit growth, even when all other nutrients are present in adequate amounts. Molybdenum is a rare transition element, well-known for a long time to be an essential micronutrient for microorganisms, plants, and animals [2]. The importance of molybdenum for plants was first reported by Arnon and Stout [3] in 1939. In almost all plant tissues, Mo is the least abundant essential micronutrient [4]. The requirements of plants for Mo are lower than for any other micronutrient, except nickel [5]. Mo itself is inactive in biological systems until it becomes part of an organic pterin complex called molybdenum co-factor (Moco) [6]. Like other organisms, plants utilize molybdenum in selected enzymes (nitrate reductase, xanthine dehydrogenase, aldehyde oxidase, and sulfite oxidase) to carry out redox reactions in particular in processes involving the nitrogen metabolism and the synthesis of the phytohormones abscisic acid and indole-3 butyric acid [4]. The nitrogen metabolism is influenced by molybdenum, which acts directly on the nitrate reductase enzyme. The activity of this enzyme is used as a bio-indicator for the Mo and N status of plants [7], and can be altered by changes in Mo [8] and NO3 [9] concentration. Furthermore, it was reported that Mo nutrition promotes nitrogen use efficiency and nitrate reduction [10], and that the deficiency of this element can induce an increase of nitrates in plant tissues and a decrease in plant growth and yields [11,12,13]. Therefore, the increase of supplied Mo can presumably reduce the content of nitrates. Leafy vegetables tend to accumulate the highest amount of nitrate [14]; among these vegetables, lettuce is one of the most sensitive to molybdenum deficiency [15]. Boertje [16] found serious Mo deficiencies in lettuce plants grown in white peat. To prevent Mo deficiencies, Sonneveld and Voogt [17] suggest the addition of 0.5 µmol L−1 of molybdenum to the nutrient solution of hydroponics. Nevertheless, the doses and the methods of application of Mo need further studies, in order to assess if Mo fertilization could increase nitrogen metabolism and the nutritional quality of leafy vegetables. The aim of this research was to evaluate the effect of increasing Mo rate on growth, yield, and quality of some leafy vegetables (lettuce, escarole, curly endive) cultivated in a hydroponic floating system.

2. Materials and Methods

The trial was carried out in an unheated greenhouse of the Department of Agricultural, Food and Forest Sciences (University of Palermo, Palermo, Italy) (Istituto agrario Castelnuovo, located at 38°9′23″ N, 13°19′58″ E; altitude 48 m). Lettuce (Lactuca sativa L.), escarole (Cichorium endivia L., var. latifolium Hegi), and curly endive (Cichorium endivia L., var. crispum Hegi) plants were grown in a hydroponic floating system using nutrient solutions with four levels of molybdenum (0, 0.5, 1.5, and 3.0 µmol L−1).
Mineral nutrient solutions (MNS), prepared using groundwater treated with inverse osmosis (electrical conductivity 430 μS cm−1; pH 7.7), contained 4.5 mmol L−1 of Ca2+, 2 mmol L−1 of H2PO4, 1.25 mmol L−1 of NH4+, 1 mmol L−1 of Mg2+, 19 mmol L−1 of NO3, 11 mmol L−1 of K+, 1.1 mmol L−1 of SO42−, 40 µmol L−1 of Fe3+, 5 µmol L−1 of Mn2+, 4 µmol L−1 of Zn2+, 30 µmol L−1 of BO33−, and 0.75 µmol L−1 of Cu2+ [17], and differed only in Mo content. The electrical conductivity (EC) of the MNS was 2.5 mS cm−1, and the pH was 5.8. Each nutrient solution was poured into a rectangular tank (200 cm long × 100 cm wide × 20 cm deep, containing 300 L of MNS). Seedlings with 3–4 true leaves of lettuce (var. Minae, Topseed s.r.l., Sarno, Italy), escarole (var. IS187, Topseed s.r.l., Sarno, Italy), and curly endive (var. Salad King, Topseed s.r.l., Sarno, Italy), purchased from a local commercial nursery, were transplanted (14 March) in drilled polystyrene panels (0.5 × 1.0 m; 12 plants m−2). Four panels were placed in every tank. Each treatment was composed of three replicated tanks for each leafy vegetable and each Mo level (36 tanks in total). The nutrient solutions were not aerated during plant growth, as fast growing leafy vegetables do not need a high oxygen concentration in the nutrient solution [18]. The MNS was monitored daily for water consumption and weekly for EC and pH. Hydroponic tanks were refilled with new MNS when the volume of the MNS dropped by 20%, adding the amount of consumed MNS.
At harvest (55 days after transplant), all plants were destructively sampled. Yield and average plant weight were calculated after eliminating the decayed external leaves. Plant height and stem diameter were measured on 20 plants, randomly selected for each replicate. The number of leaves was counted. Leaf colour was measured with a colorimeter (Chroma-meter CR-400, Minolta corporation Ltd., Osaka, Japan) at three points of photosynthetic tissue on the upper side of ten leaves, randomly selected for each replicate. The CIELAB colour parameters L* (lightness), a* (positive values for reddish colours and negative values for the greenish one), and b* (positive values for yellowish colours and negative values for the bluish one) were recorded. Hue angle (h°) and Chroma (C*) were calculated as h° = 180° + arctan(b*/a*) [19] and C* = (a*2 + b*2)1/2. Afterwards, 10 plants, randomly selected for each replicate, were divided into shoots and roots, weighed, and then dried to constant weight at 85 °C.
A representative sample of 200 g for each replicate was juiced with a commercial home juicer. The extracts was centrifuged at 3500 rpm for 10 min, and supernatants was used to determine ascorbic acid, nitrates, titratable acidity (TA), and total soluble solids (TSS). Ascorbic acid and nitrate contents (mg kg−1 of fresh weight (FW)) were determined reflectometrically using a Reflectometer RQflex10 Reflectoquant (Sigma-Aldrich, Saint Louis, MO, USA), and the Reflectoquant ascorbic acid and nitrate test strips (Merck, Darmstadt, Germany) [20]. TA was determined by potentiometric titration with 0.1 M NaOH up to pH 8.1, using 15 mL of plant extract and expressed as percent malic acid equivalents. TSS (°Brix) was determined using a digital refractometer (MTD-045nD, Three-In-One Enterprises Co. Ltd., New Taipei City, Taiwan). The Mo content was determined as follows: 2 g of leaves were digested with 10 mL of ultrapure nitric acid (Merck, Darmstadt, Germany) in a microwave system (Mars 5 Plus-CEM, Indian Trail, NC, USA); at the end of the digestion, the mineralized sample was transferred into volumetric flasks and diluted to 100 mL with ultrapure water. An aliquot of the solution obtained was filtered through a 0.45 μm membrane of cellulose acetate; the filtrate was used for the determination of molybdenum content by ICP-MS (Inductively Coupled Plasma Mass Spectrometry) (Element2, Thermo, Bremen, Germany) via a calibration curve (concentration range 0–100 μg kg−1 in Mo) after optimization of instrument sensitivity.
The experimental design was composed of three blocks, completely randomized, and each block included 12 treatments (4 levels of molybdenum × 3 leafy vegetables). Each treatment was composed of three replicate tanks. To determine the effect of leafy vegetables and Mo levels, a two-way analysis of variance (ANOVA) was carried out. Mean values were compared by the least significant difference (LSD) test, in order to identify significant differences among treatments. To define the optimal Mo rate for each leafy vegetable, a regression analysis was used to fit a linear or second-order polynomial equation to the data of plant parameters evaluated. Statistical significance of the terms in the regression equations was examined by ANOVA for each response. Principal components analysis (PCA) was employed to investigate any underlying relationship among the different Mo doses, based on the agronomic and quality parameters of lettuce, escarole, and curly endive at harvest. The input matrix for the analysis consisted of head average weight, head height, number of leaves, stem diameter, head dry matter, root dry matter, leaf colour components (L*, Chroma and Hue), TSS, TA, ascorbic acid, nitrate, and Mo contents. For the selection of the optimum number of principal components (PCs), factors with eigenvalues higher than 1.0 were retained. In addition, the plot of the PCs enabled the investigation of correlations between the variables of the input data set. To this end, the initial variables were projected into the subspace defined by the reduced number of PCs (first and second components), and correlated variables were identified. The PCA was implemented with SPSS version 13.0 (SPSS Inc., Chicago, IL, USA).

3. Results and Discussion

The management of the mineral nutrition is a key pre-harvest factor determining the yield and the quality of many crops [20,21,22]. The precise control of the mineral elements in the nutrient solution of soilless cultivations allows the direction of production towards specific purposes and objectives [23,24]. All of this can be achieved either by modifying the macronutrient concentration or by varying the amount of micronutrients or other mineral elements (Fe, Mo, Na, Si, Se, etc.) [5,25,26,27,28,29,30,31,32,33]. In this work, we investigated the effect of Mo fertilization on yield and quality parameters of lettuce, escarole, and curly endive plants grown in a hydroponic floating system. We increased the amount of molybdenum from the dose suggested to prevent deficiencies (0.5 µmol L−1 of Mo) [17] up to 3.0 µmol L−1, in order to evaluate the response of leafy plants to increased Mo availability.
During plant growth, the average air and MNS temperatures were 21.8 °C and 23.7 °C, respectively. Air temperature ranged between 31.2 °C (day) and 12.3 °C (night). The characteristics of MNS in the tanks varied during plant growth, due to water absorption and evaporation, as well as MNS refills. The EC and pH of MNS slightly increased during plant cultivation, and at harvest reached 3.12 mS cm−1 and 6.16 on average, respectively. No significant differences were found among the MNS of the different tanks.

3.1. Yield and Morphological Parameters of Lettuce, Escarole and Curly Endive Plants

The plants of lettuce, escarole, and curly endive grown in the MNS without Mo fertilization showed the typical symptoms of Mo deficiency [34] from the earliest growth stages onwards; leaves were chlorotic or pale green with necrotic regions at leaf margins, and plants showed a stunted growth. Lettuce, escarole, and curly endive plants were harvested at the same time 55 days after transplant; the plants grown with 0.5, 1.5 and 3.0 μmol L−1 of Mo in the MNS were all marketable, while the plants grown without Mo in the MNS were not marketable. The head weight and the yield of the tested leafy vegetables were significantly lower when plants were grown in MNS without Mo, ranging respectively from 147.2 g and 1.8 kg m−2 for lettuce to 210.8 g and 2.5 kg m−2 for curly endive. The addition of Mo to the MNS almost doubled these parameters, but no significant difference was found among plants grown with 0.5, 1.5 or 3.0 μmol L−1 of Mo in the MNS (Table 1).
A similar trend was observed with regards to the biometric traits (Table 1). A significantly lower head height, stem diameter, and number of leaves were noted only in the plants grown without Mo fertilization. The plants of lettuce, escarole, and curly endive had similar head height and number of leaves when grown in a nutrient solution with 0 μmol L−1 of Mo, while these parameters differed significantly at higher doses of Mo; lettuce had higher plants (34.3 cm on average) but fewer leaves (62.1 on average) than escarole (22.3 cm and 84.8 leaves on average) and curly endive (27.7 cm and 85.0 leaves on average). The increase of Mo concentration in the nutrient solution above the recommended dose [17] had no influence on yield and morphological traits of the leafy vegetables grown on floating panels. Similarly, other authors reported that no significant change occurred in the yield of alfalfa, bean, carrot, and spinach as a function of Mo treatment applied to soil or foliage [35,36,37,38]. The regression analysis showed a quadratic relationship among Mo levels and yield, head weight, head height, stem diameter, and number of leaves (Table 2). The models had high and significant R2 values for all the variables except for the stem diameter of escarole and for the head height and stem diameter of curly endive. Considering the predicted values of the significant models, yield, and morphological parameters had their top in the range 1.87–2.15 μmol L−1 for lettuce, 1.85–1.96 μmol L−1 for escarole, and 1.98–1.99 μmol L−1 for curly endive.
Head and root dry matter of the leafy vegetables tested were influenced in different ways by the level of Mo in the nutrient solution. The lettuce plants had the lowest head and root dry matter (10.8 and 2.0%, respectively) when grown with 0 Mo in the MNS. An increment of Mo concentration up to 1.5 μmol L−1 determined an increase in head (16.6%) and root (7.8%) dry matter, with no further significant changes at the highest concentration of Mo in the nutrient solution (Table 1). The head dry matter of escarole plants increased significantly with 0.5 μmol L−1 of Mo in the MNS (11.0%) and reached the highest value in the plants cultivated in the nutrient solution with 3.0 μmol L−1 of Mo (16.7%) (Table 1). The head dry matter of curly endive and the root dry matter of escarole and curly endive increased significantly with the lowest Mo level (0.5 μmol L−1), but the increase of Mo concentration up to 3.0 μmol L−1 had no further effect (Table 1). The regression analysis confirmed the differences among the leafy vegetables tested as regards the effect of Mo rate on plant dry matter (Table 3). Lettuce plants showed a relationship between the Mo rate and dry matter that fitted a second-order polynomial equation (R2 = 0.981 and 0.870 for head and root dry matter, respectively), with the highest predicted values corresponding to 2.53 and 2.29 μmol L−1 of Mo for head and root dry matter, respectively. The model that predicted the responses of escarole head dry matter to molybdenum rates also fitted a quadratic equation (R2 = 0.889), but had its minimum value at 0 μmol L−1 of Mo. Boertje [16] found that the deficiency of Mo determined the decrease of dry matter in lettuce, while Mo application caused a significant increase of total dry matter production in chickpea [39] and grain [40]. These results are confirmed by our study, which shows that Mo rates above the recommended dose were effective in increasing the plant dry matter especially for lettuce and escarole plants.

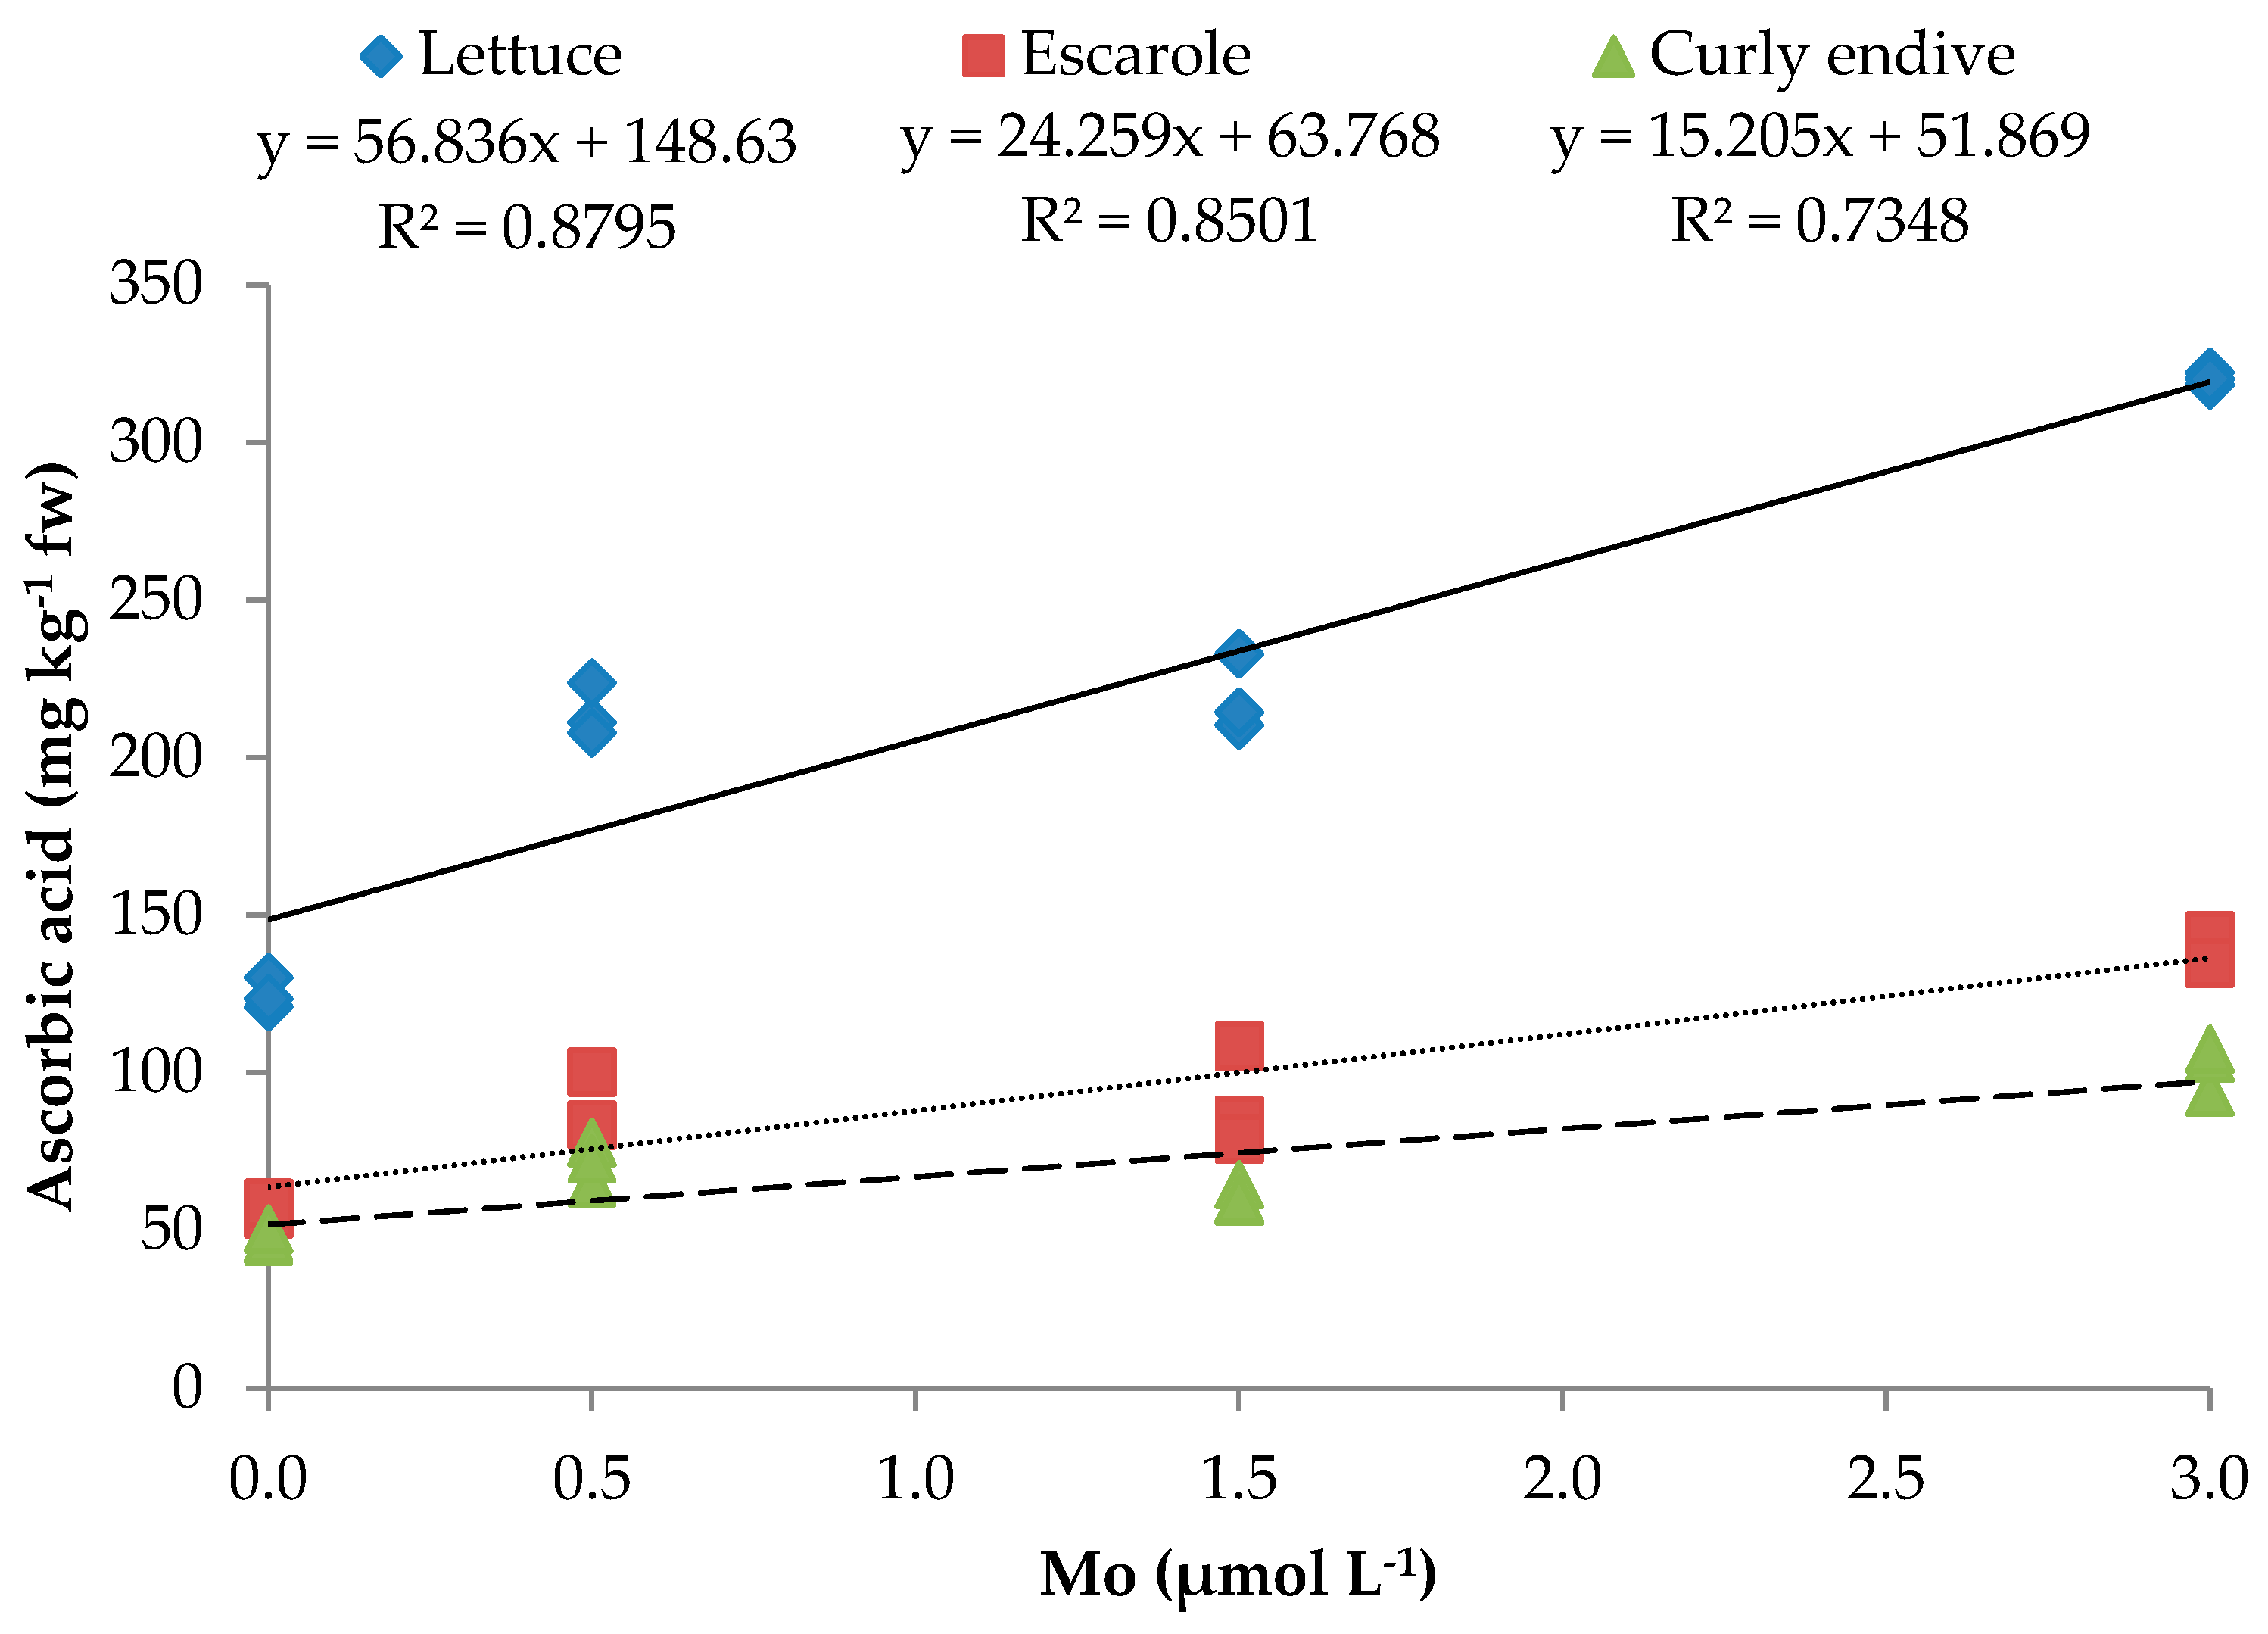
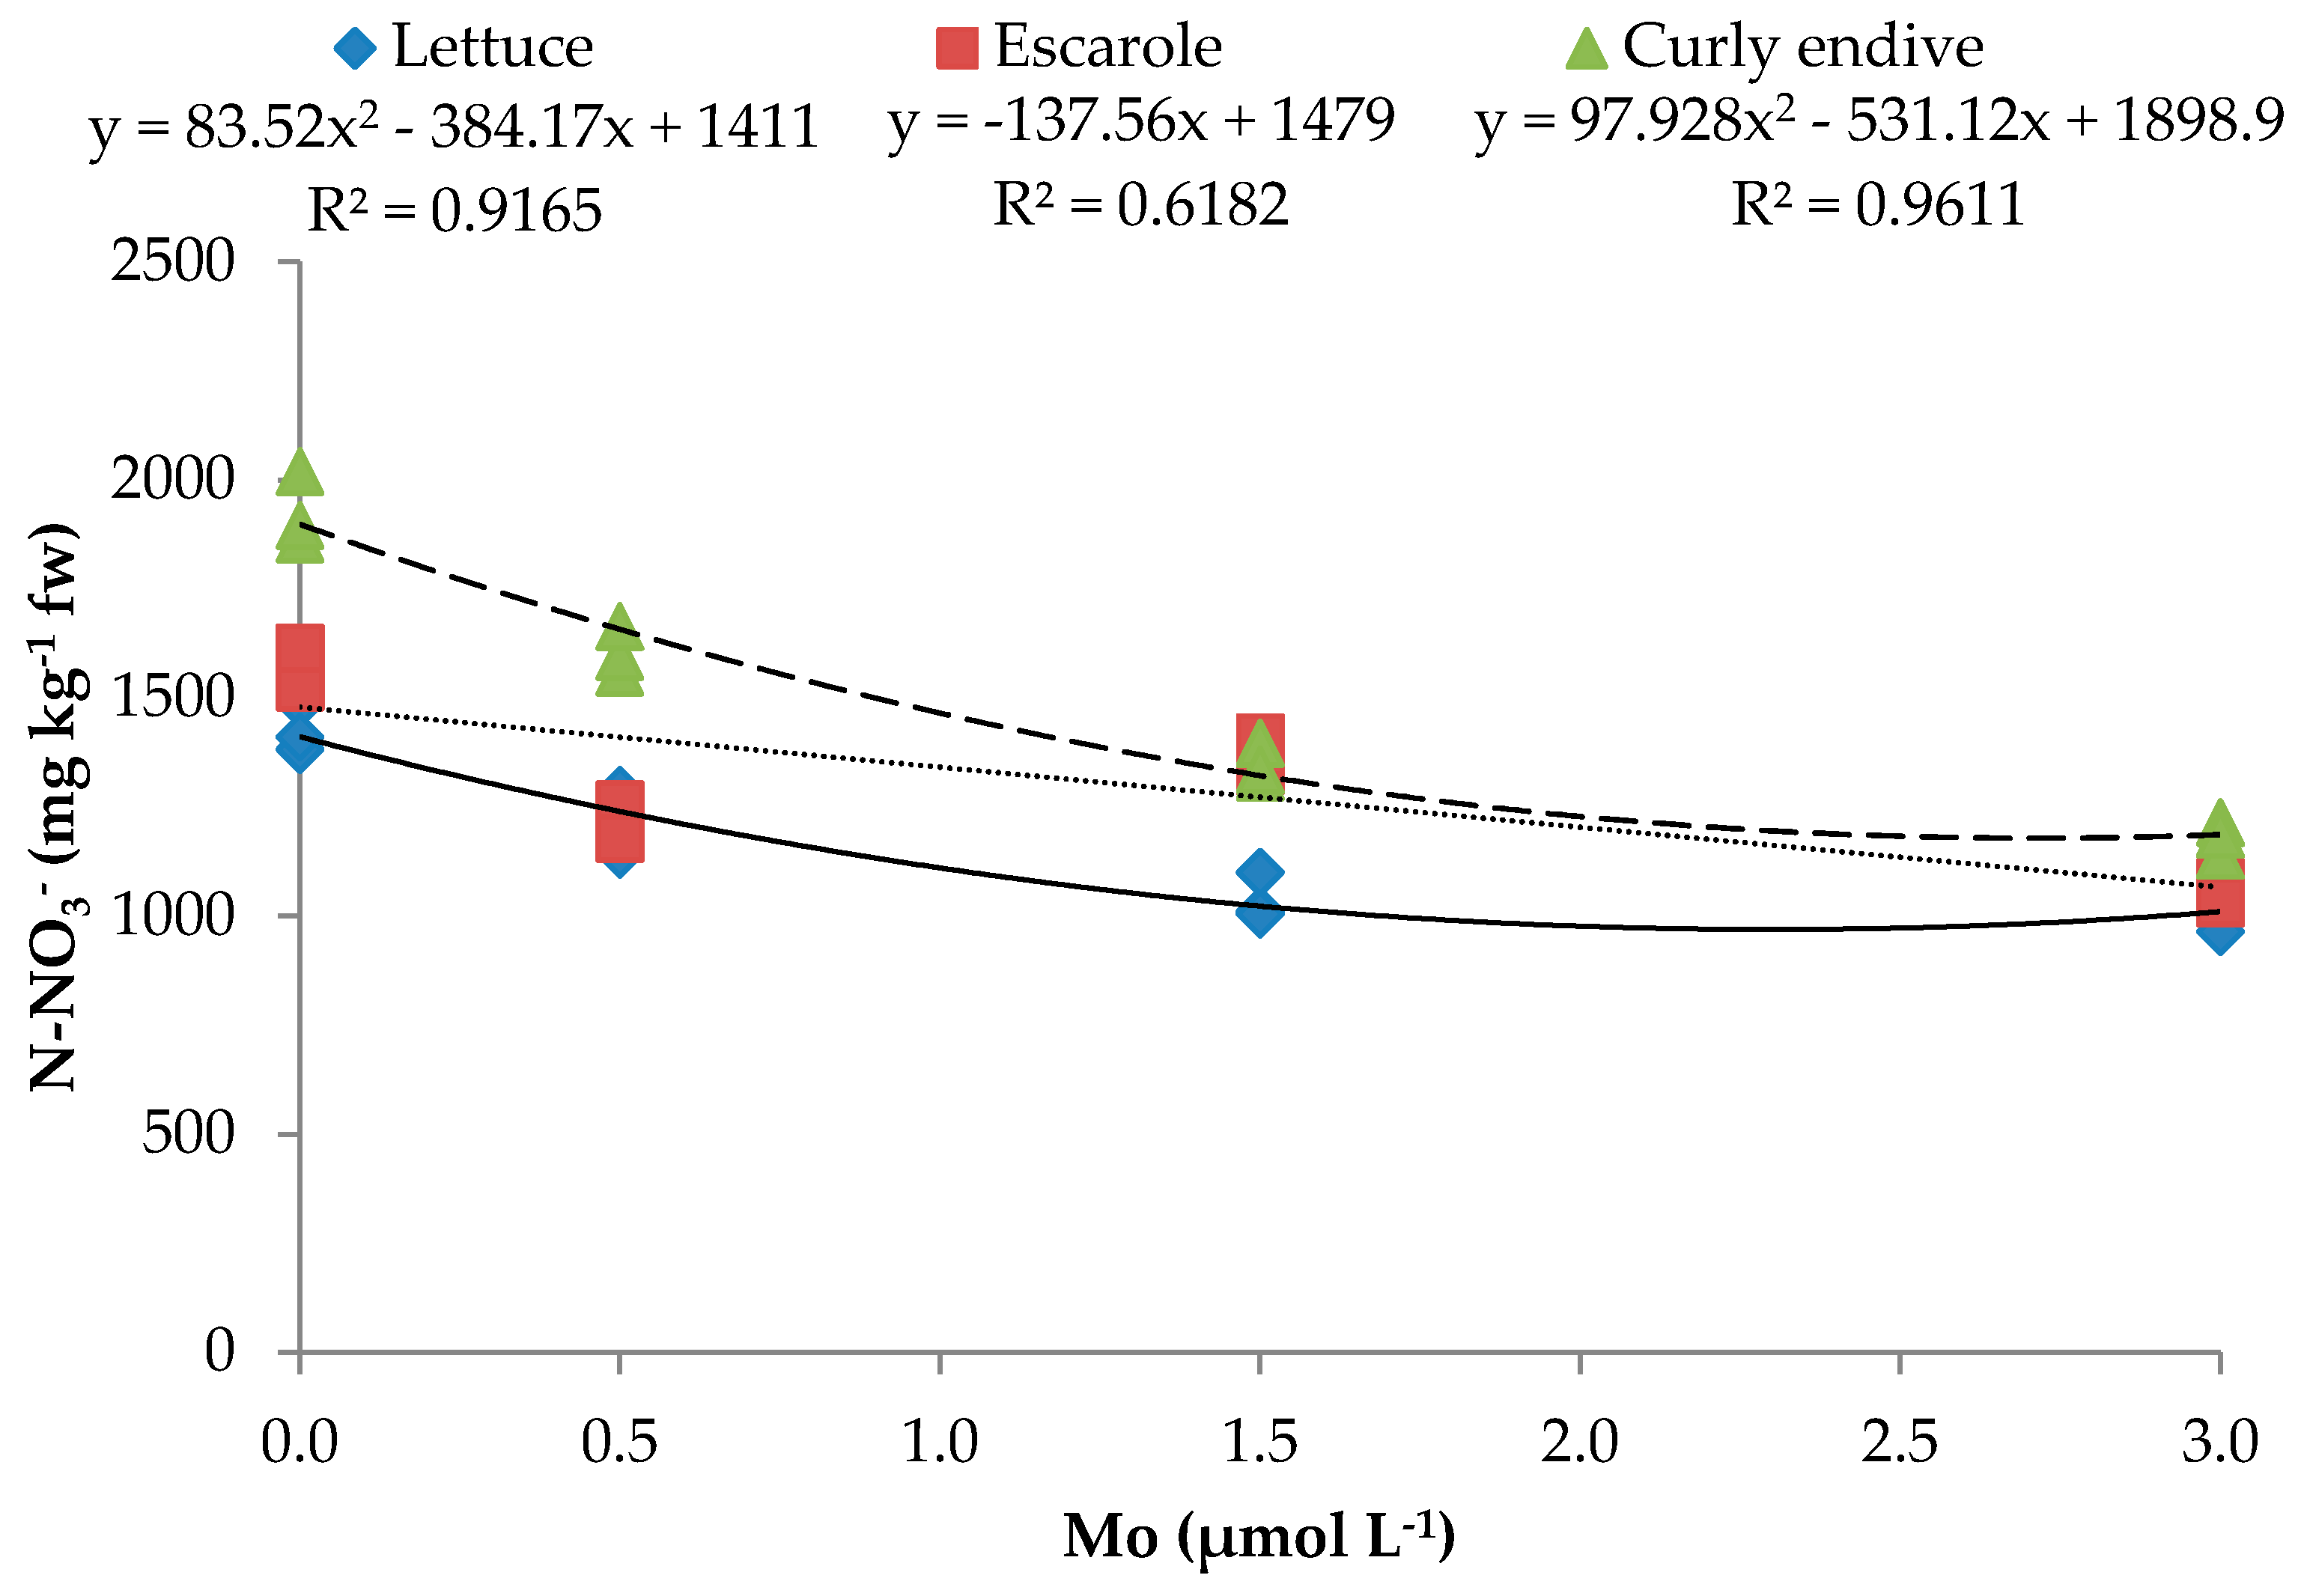
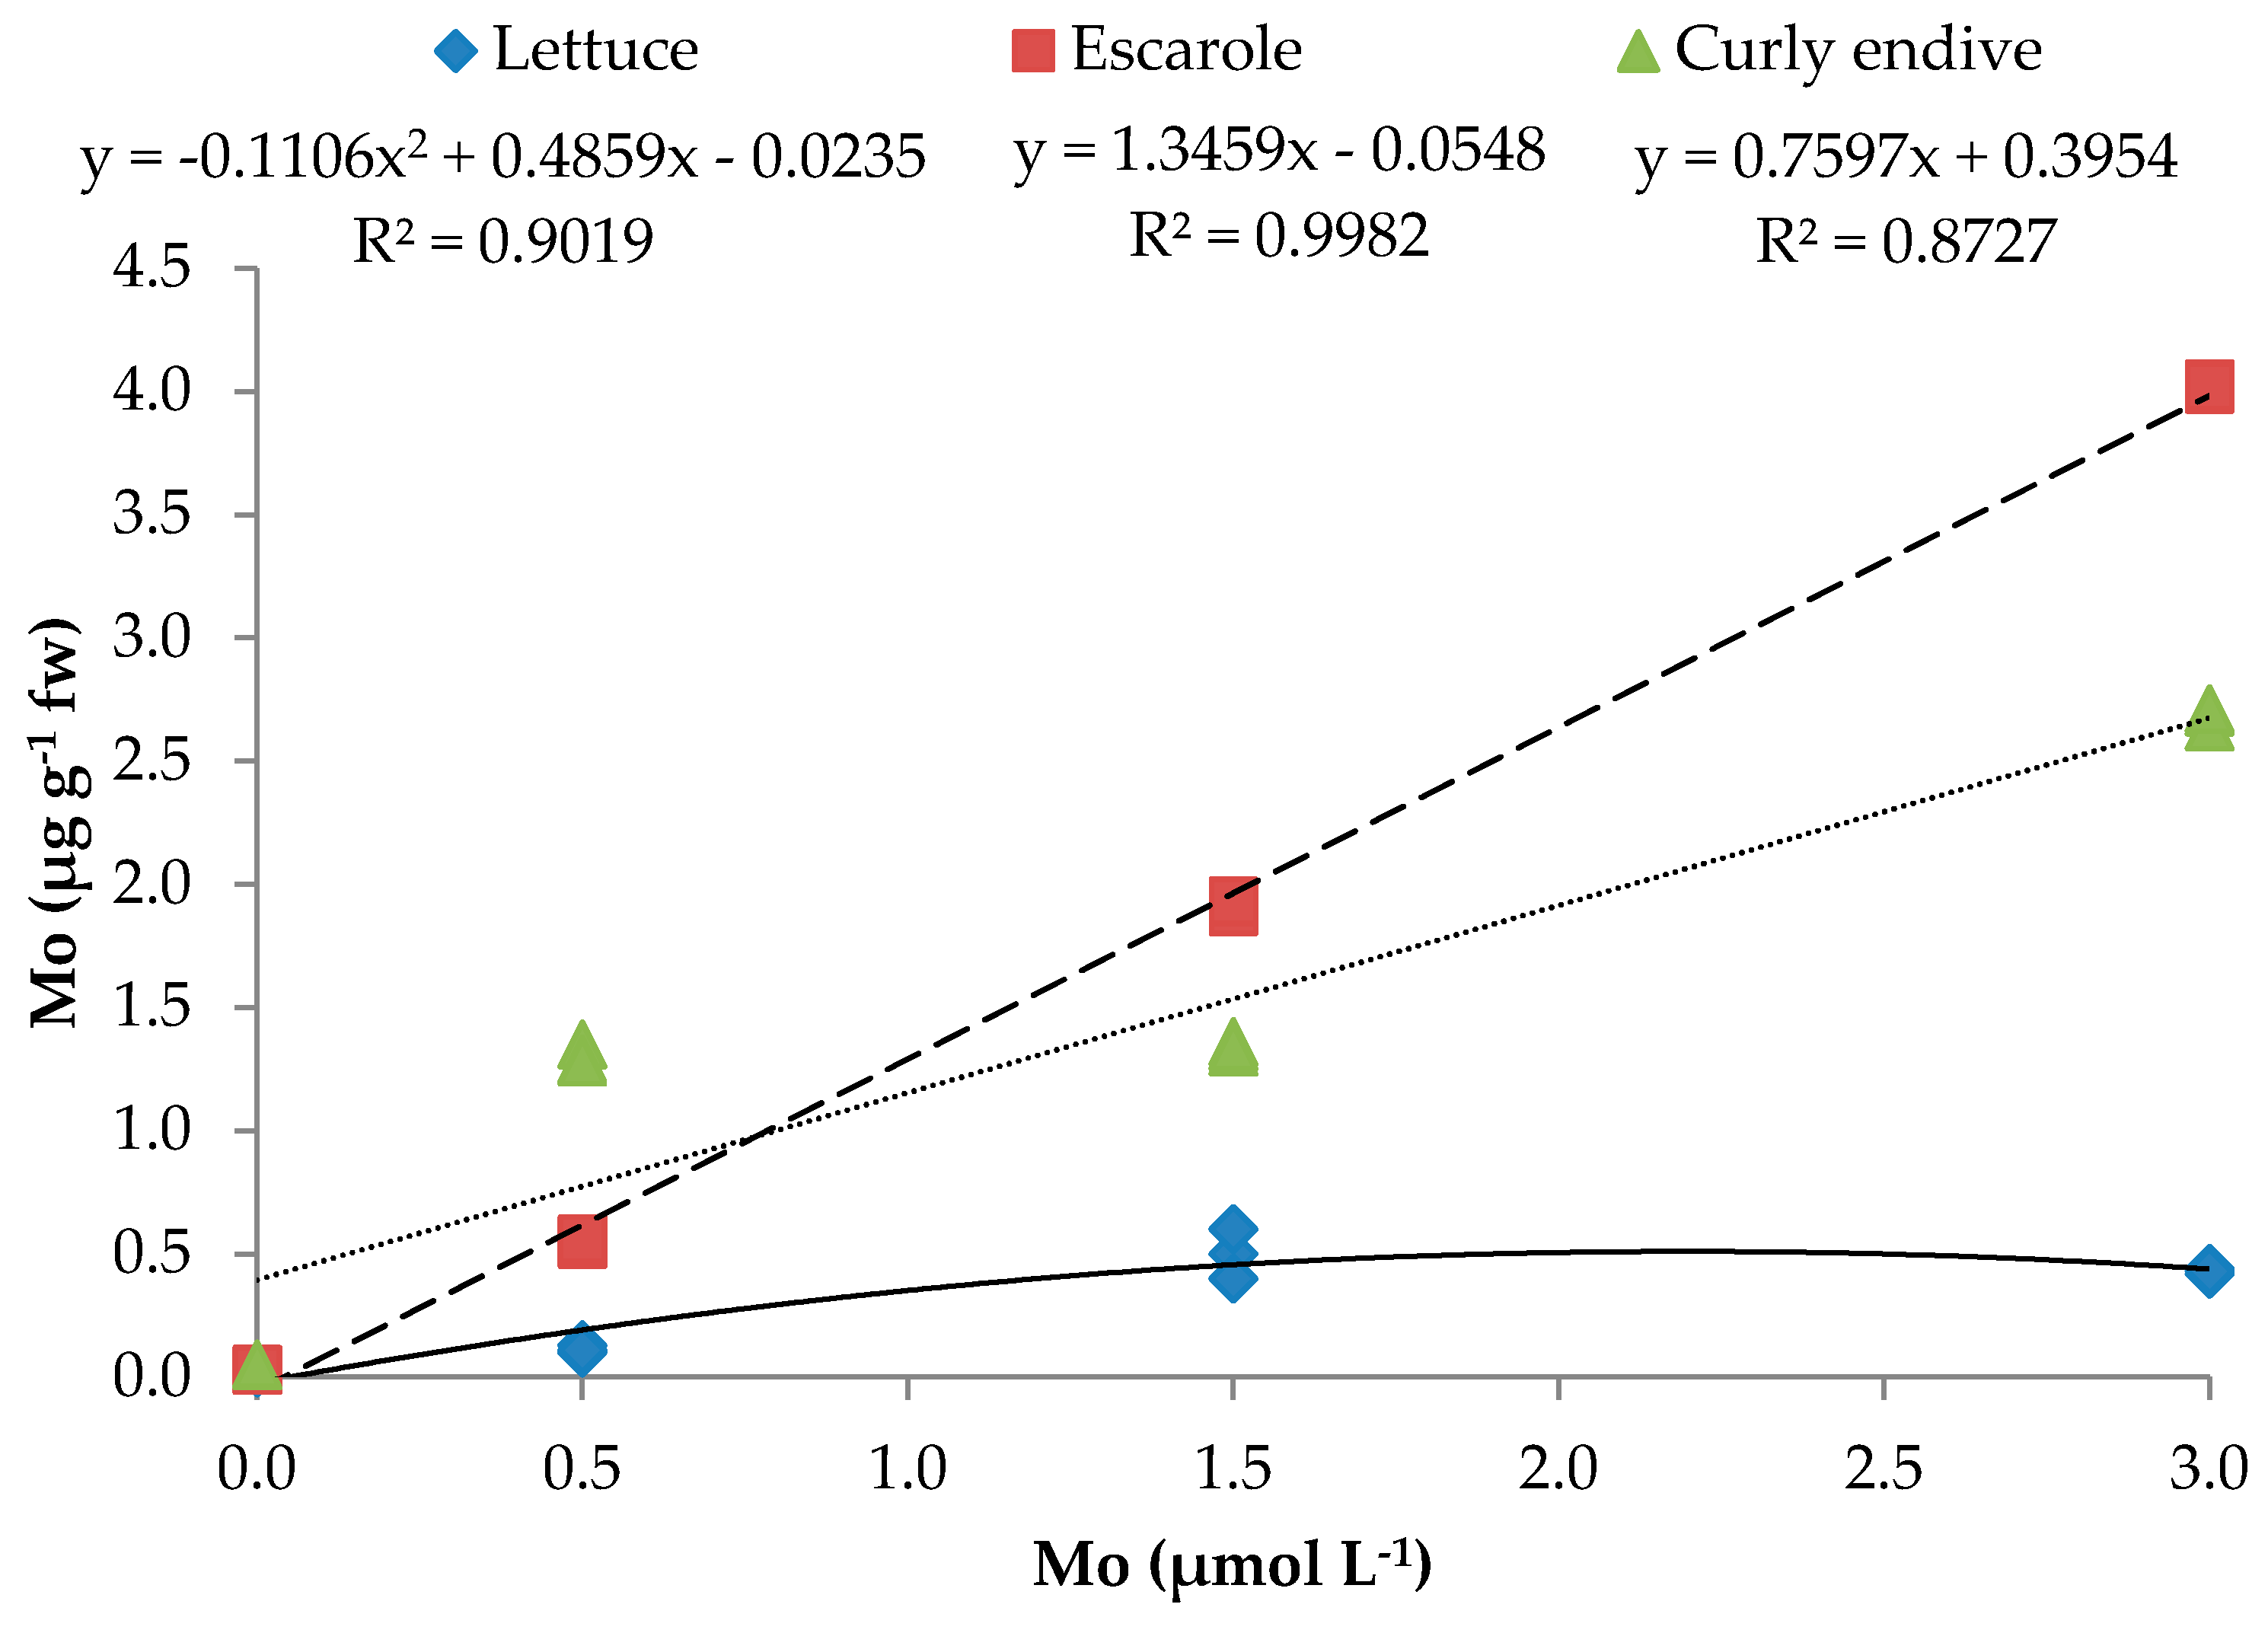
3.2. Quality Parameters of Lettuce, Escarole and Curly Endive Plants

Chemical composition of lettuce, escarole, and curly endive was affected by Mo fertilization. The two-way ANOVA performed reported a significant interaction between leafy vegetables and molybdenum levels in the nutrient solution (Table 3), while the regression analysis detected significant models that predicted, for each leafy vegetable, the responses of the evaluated quality variables to molybdenum rates (Table 4).
The lowest TSS value was observed in all the plants grown without the addition of Mo to the MNS (3.1 °Brix on average) (Table 3). The increase in Mo concentration in the nutrient solution determined a linear increase (Table 4) of TSS values in escarole (R2 = 0.891) and curly endive (R2 = 0.807) plants, which reached the highest values observed in the plants grown in nutrient solutions with 3.0 μmol L−1 of Mo (5.9 and 5.1 °Brix, respectively). Lettuce plants reached their highest TSS value (5.4 °Brix) when grown with 0.5 µmol L−1 Mo; however, further increasing the Mo concentration in the nutrient solution up to 3.0 μmol L−1 determined a slight yet significant decrease of TSS down to 4.1 °Brix (Table 3). The Mo level had different effects on the titratable acidity of the plants. The lowest TA was observed in escarole and curly endive (0.41% on average), as well as in lettuce (0.57%) plants grown with 0 µmol L−1 Mo. The highest TA of lettuce plants was observed with 0.5, 1.5 and 3.0 µmol L−1 Mo; these values fitted a quadratic equation (R2 = 0.921) as those of curly endive plants (R2 = 0.963), which reached their highest TA value between 1.5 and 3.0 µmol L−1 Mo. Escarole plants slightly increased their TA up to 1.5 µmol L−1 Mo and needed 3.0 µmol L−1 Mo in the nutrient solution in order to reach the highest TA (Table 3 and Table 4). Total soluble solids increased significantly at the highest Mo level (3.0 µmol L−1) in escarole and curly endive, whereas an opposite trend was observed in the lettuce plants. Also the changes observed in the titratable acidity followed different trends in each leafy vegetable tested (Table 4). These differences could be due to different effects of Mo availability on the metabolism of different species. Hewitt [41] reports a decrease in total and reducing sugars in cauliflower as a consequence of Mo deficiency; however, he also noticed an opposite trend in Mo-deficient plants grown with nitrate as a nitrogen source. Molybdenum is utilized by specific plant enzymes to participate in reduction and oxidative reactions. These enzymes, involved in the primary nitrogen assimilation (nitrate reductase) and in sulphur metabolism (sulfite oxidase), are also linked to the metabolism of carbohydrates and organic acids. Since molybdenum is involved in a number of different enzymatic processes, a defined plant response to molybdenum can be complex, and thus difficult to assign causally to specific enzyme systems [4].
The nutritional value of vegetables is often related to ascorbic acid content, total antioxidant activity, and nitrate content in the case of leafy vegetables. The molybdenum rate determined significant changes in the nutritional quality of lettuce, escarole, and curly endive plants grown in a hydroponic floating system (Table 3).
Curly endive plants had the lowest content of ascorbic acid, three times lower than lettuce plants (Table 3). MNS that were not supplemented with Mo induced a significant reduction of the ascorbic acid content (124.9, 57.5, and 48.2 mg kg−1 FW for lettuce, escarole, and curly endive, respectively) against those that contained the recommended dose of Mo (0.5 µmol L−1) (214.3, 89.0, and 71.9 mg kg−1 FW for lettuce, escarole, and curly endive respectively). A further significant and linear increase of the ascorbic acid content was obtained by raising the amount of Mo in the nutrient solution up to 3.0 µmol L−1 (Table 3 and Table 4; Figure 1).
A lack of molybdenum may induce a decrease of ascorbic acid content in lettuce [16] and cauliflower [42], while an increased molybdenum supply also determined a significantly higher content of ascorbic acid in potatoes [43]. Ascorbic acid is a sugar acid, and we observed a positive correlation between ascorbic acid and sugar content, especially for escarole (R2 = 0.914) and curly endive (R2 = 0.862), as also reported by Shinohara and Suzuki [44]. The ascorbic acid content of the plants can be affected by many factors, some of which are related to the effect of Mo. Increases in the activity of enzymes responsible of the oxidation of ascorbic acid, such as phenol oxidase and peroxidase, may be involved in the effect of Mo on ascorbic acid content. This organic acid seems to play a role in preserving the chloroplast in a functional state. Thus, the marked decrease in ascorbic acid content in molybdenum-deficient tissue might be related significantly to the chloroplast disorganization that occurs in Mo-deficient plants [39]. Moreover, many authors found that in order to maintain ascorbic acid synthesis, sufficient nitrogen (N) is required [20,45,46,47,48], and N availability is affected by the role of Mo in nitrate reductase. Ascorbic acid content in lettuce leaves increases under strong light conditions and decreases under weak light or shaded conditions [44,49]. Light affects the nitrate reductase activity, just like Mo does. Thus, the rise of ascorbic acid content in leafy vegetables could be due to the intense nitrate reductase activity caused by an increased Mo availability.
Molybdenum plays a key role in the synthesis of nitrate reductase. Its deficiency leads to accumulation of high concentrations of nitrates in many plants. On the contrary, Mo fertilization was effective in reducing nitrate content in the leaves of lettuce [33], spinach [50], and poinsettia [51,52], as well as in leaves, petioles, and the fruit of eggplant [5]. Like other authors, we found that lettuce, escarole, and curly endive plants subjected to Mo deficiency (0 µmol L−1) tended to accumulate high amounts of nitrates in their leaves (Table 3). Curly endive plants were the most sensitive to Mo deficiency; their nitrate content reached 1927.1 kg−1 FWwithout adding Mo to the nutrient solution. All the tested leafy vegetables, grown in hydroponics with increased Mo doses, significantly reduced their nitrate content. Lettuce was the most sensitive to Mo fertilization, as its nitrate content reached the lowest value (1006.9 kg−1 FW) with 1.5 µmol L−1 of Mo, while escarole and curly endive gradually dropped their nitrate content as the Mo concentration was raised up to 3.0 µmol L−1 (1047.3 and 1182.2 kg−1 FW, respectively). There was a linear negative relationship between the Mo rate and nitrate content in escarole (R2 = 0.618), while lettuce (R2 = 0.917), and curly endive (R2 = 0.961) followed a quadratic relationship, with the minimum of the fitted curve at 2.30 and 2.71 µmol L−1 of Mo, respectively (Table 4; Figure 2).
The level of Mo in the nutrient solution also influenced the amount of Mo found in leafy vegetables (Table 3). Plants grown without Mo added to the nutrient solution had a very low content of this element (0.02, 0.03, and 0.05 μg g−1 FW for lettuce, escarole, and curly endive, respectively). The presence of Mo in the leafy vegetables, even without Mo fertilization, might be due to low amounts of Mo naturally occurring in groundwater [53] or in fertilizer impurities [54]. All the plants increased their Mo content as Mo availability in the nutrient solution changed. Escarole plants tended to accumulate more Mo in their tissue than the other leafy vegetables. The amount of Mo found in lettuce plants increased up to 0.50 μg g−1 FW (1.5 µmol L−1 Mo); the plants’ Mo content fitted a quadratic equation (R2 = 0.902), with the maximum of the curve at 2.19 µmol L−1 of Mo. Escarole and curly endive linearly increased their Mo content up to 4.02 and 2.68 μg g−1 FW, with a positive relationship with the Mo rate (R2 = 0.998 and 0.873, respectively) (Table 4; Figure 3). The enrichment of leafy vegetables with Mo could affect their nutritional quality; thus, the occurrence of health-related issues due to an excessive Mo intake should be taken into account and carefully evaluated. The European Food Safety Authority [55] recommended an adequate intake (AI) for molybdenum of 65 μg d−1 for adult men and women. The tolerable upper intake level (UL) for adults was set at 0.6 mg d−1. The molybdenum content varied greatly among leafy vegetables tested and as a function of Mo fertilization. Lettuce had the lowest Mo content, ranging from 0.11 to 0.50 μg g−1 FW, while escarole varied from 0.55 to 4.02 μg g−1 FW (for 0.5 and 3.0 µmol L−1 of Mo in the nutrient solution, respectively). Our results showed that 100 g of leaves of lettuce, curly endive, and escarole, hydroponically grown with nutrient solutions containing Mo, provided a maximum of 50, 268, and 402 μg 100 g−1, respectively. Thus, a daily intake of 100 g of enriched lettuce, escarole, or curly endive would not lead to Mo toxicity. Nevertheless, the total intake level is also dependent on the intake of Mo from other food sources, on the amounts of copper and sulphur in the diet, and on the levels of other dietary constituents [56]. Therefore, the intake of more than 100 g of leafy vegetables hydroponically grown with nutrient solutions containing more than 1.5 µmol L−1 of Mo would not be advisable, especially for curly endive and escarole.
Colour is an important quality attribute of leafy vegetables, and it influences consumer’s choices and preferences. Colour variations may be due to the plant nutritional status, or they can be symptoms of nutrient deficiencies or excesses. Plants of tomato and cauliflower grown at high concentrations of molybdenum produce leaves that accumulate anthocyanins and turn purple, whereas legume leaves turn yellow [57,58]. On the contrary, one of the main symptoms of molybdenum deficiency is stunting and failure of leaves to develop a healthy green colour, resulting in pale leaves with interveinal and marginal chlorosis and necrosis [59,60]. In our trial, the plants grown without Mo added to the nutrient solution showed deficiency symptoms, with significant leaf colour changes (Table 5). Nevertheless, we did not find significant colour changes as the Mo dose in the nutrient solution was increased, even when the regression analysis showed some weak quadratic relationships between Mo rate and colour parameters (Table 4). This could be an indirect visual indication that the range of Mo rates was not harmful to lettuce, escarole, and curly endive.

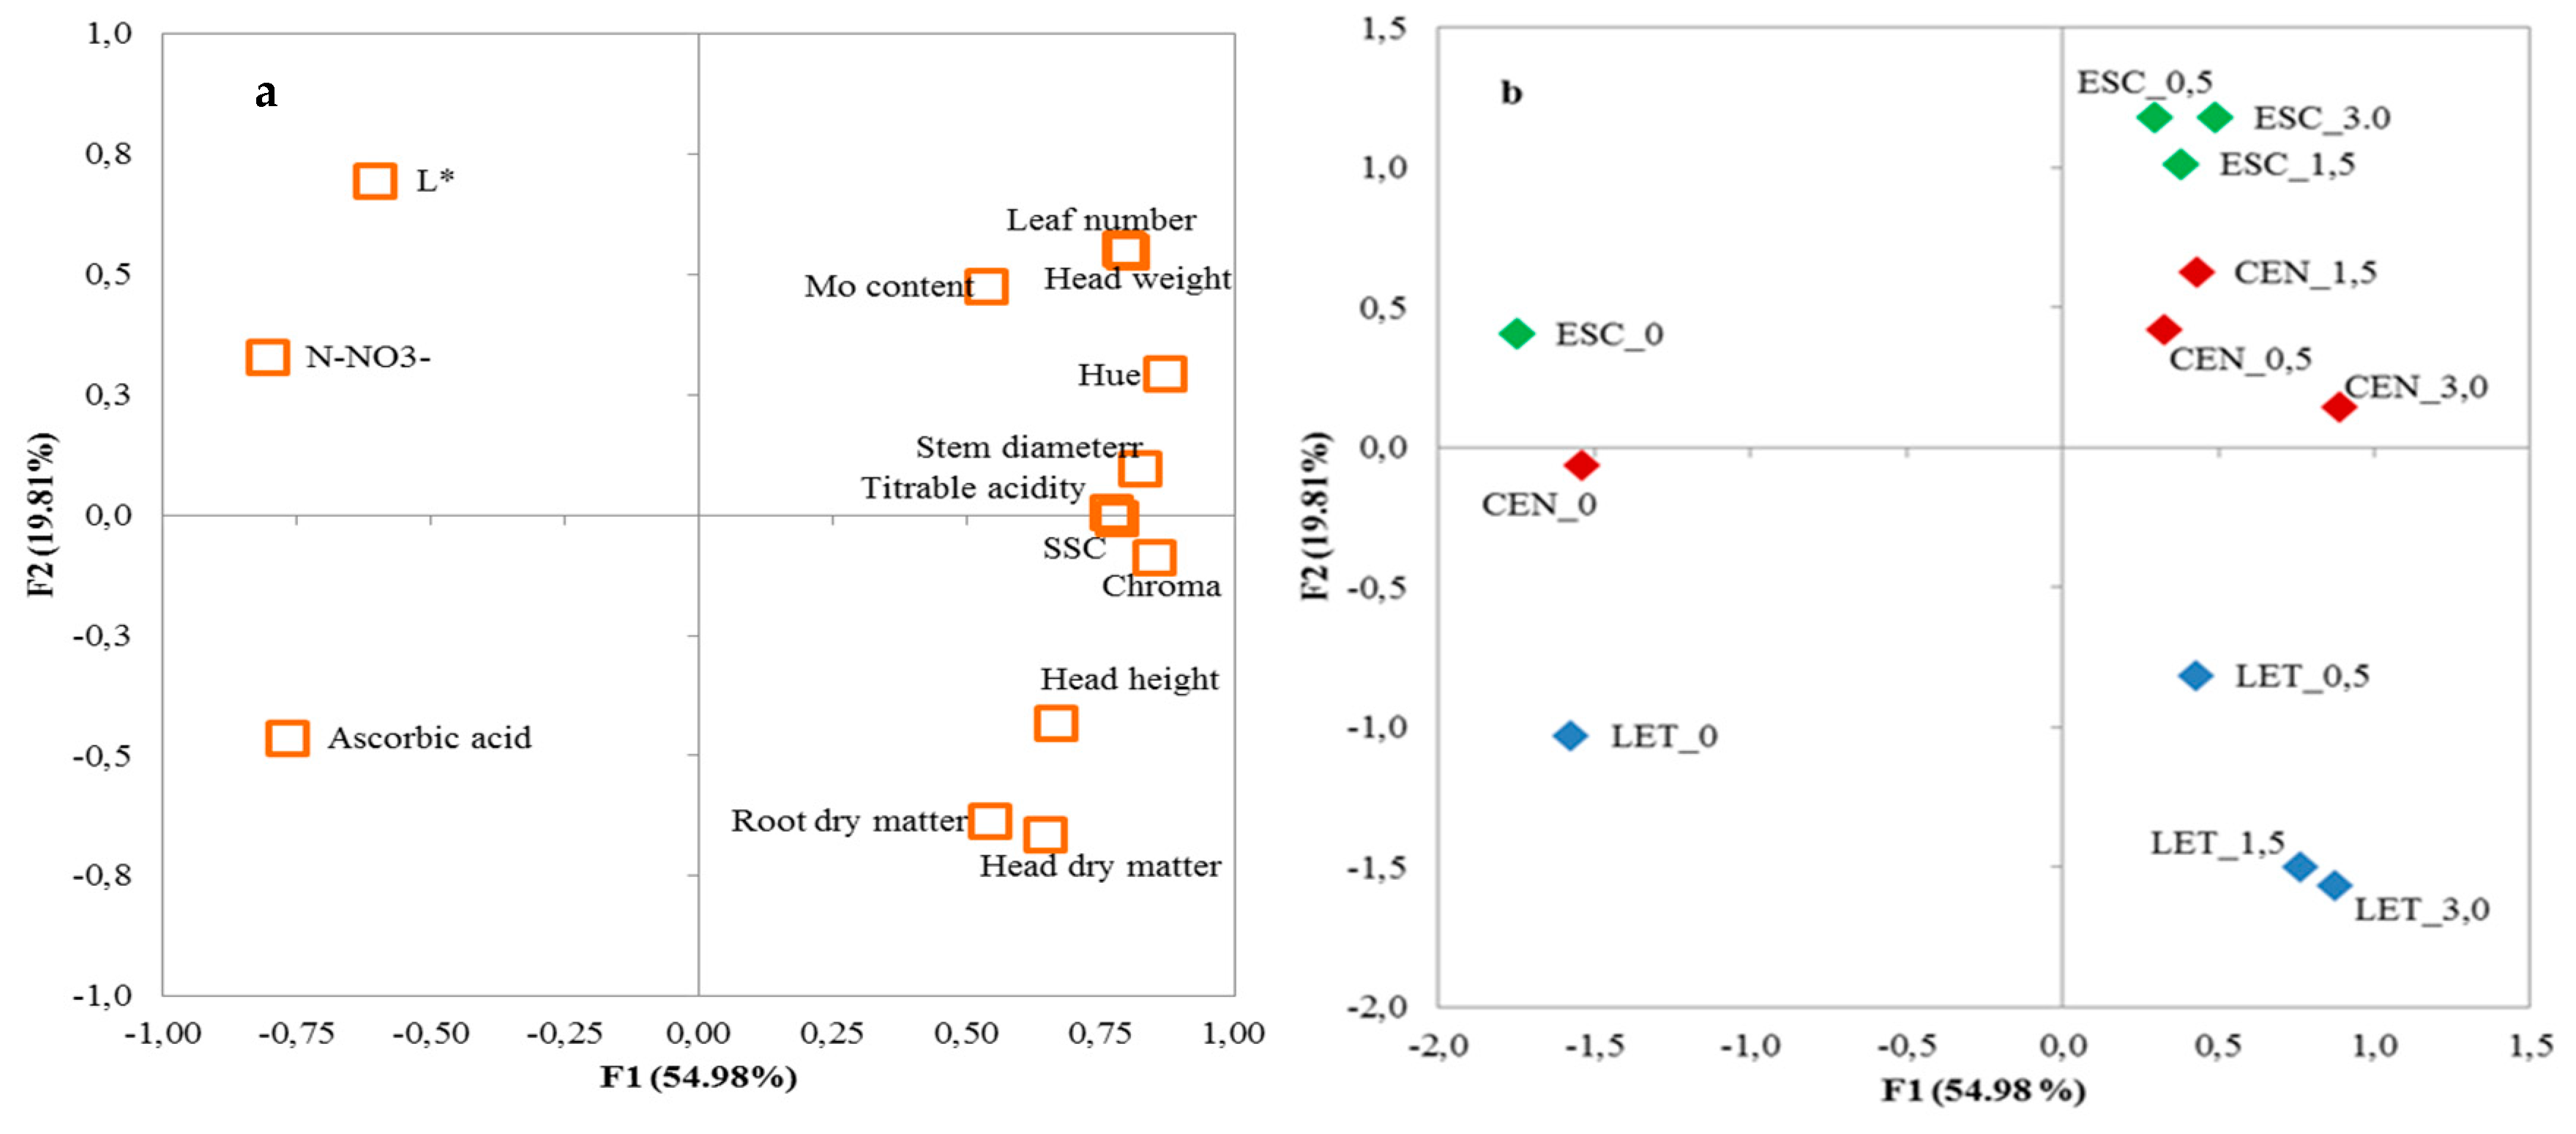
3.3. Principal Components Analysis

The results of the principal components analysis showed three principal components (PCs) with eigenvalues higher than 1.00 (Table 6), accounting for 54.98%, 19.80%, and 11.77% of the total variance, respectively. This indicated that the initial fourteen variables could be expressed as a linear combination of three PCs, explaining 86.55% of the total variance. PC1 was mainly related to head weight, stem diameter, leaf number, TSS, TA, nitrate and ascorbic acid content, chroma, and hue; PC2 was related to head and root dry matter and L*; and finally, PC3 was mainly related to Mo content (Table 6).
The projection of the original variables on the plane of the two first PCs could clearly illustrate such a relationship as shown in the plot of loadings (Figure 4a). The discrimination of the various doses of Mo supplied to lettuce, escarole, and curly endive can be visualized in the plot of scores (Figure 4b), where four clusters could be clearly distinguished. Excluding the 0 Mo dose, the escarole and curly endive scores were close together, located mainly in the first quadrant, and clearly separated from the lettuce located in the second quadrant. Combining the information from the plot of loadings and scores, it can be inferred that Mo doses influenced the tested species in different ways (Figure 4a,b). Lettuce response to Mo fertilization was positively related with dry matter and ascorbic acid content, and negatively related with nitrate content; in endive and escarole plants, the increase of Mo in the nutrient solution was positively related with TA, Mo, and soluble solid content, and negatively related with nitrate content (Figure 4a,b).
The PCA showed that lettuce, escarole, and curly endive were all negatively affected by Mo deficiency, though with a different intensities of symptoms. Moreover, the range of the plant response to Mo doses proved to be species-dependent. Thus, the different effect of Mo availability on the metabolism and enzymatic processes of different species can be complex and difficult to predict [4].

4. Conclusions

Lettuce, escarole, and curly endive plants were influenced by the molybdenum level in the nutrient solution of a hydroponic floating system. Mo fertilization was shown to be essential for normal growth and development of high quality and marketable lettuce, escarole, and curly endive plants. Increasing the level of Mo in the nutrient solution above the recommended dose (0.5 µmol L−1) eventually resulted into lower nitrate content and a higher TSS, ascorbic acid, and Mo content in plants; nonetheless, their yield, morphological characteristics, and colour were not modified.
Results also indicate that the addition of Mo in the nutrient solution was not harmful to plants; besides, an increase of Mo content in the nutrient solution up to 3.0 µmol L−1 could lead to a higher nutritional quality of lettuce, escarole, and curly endive, with no significant morphological alteration or yield loss. Finally, this investigation suggested that for each leafy vegetable tested there is an optimal Mo concentration in the nutrient solution (between 1.5 and 3.0 µmol L−1), such that maximum levels of yield and quality may be reached.

Author Contributions

A.M. (Alessandra Moncada), A.M. (Alessandro Miceli) and F.V. conceived and designed the experiments; A.M. (Alessandra Moncada), A.M. (Alessandro Miceli), F.V., and L.S. performed field trials with field data collection; A.M. (Alessandra Moncada), A.M. (Alessandro Miceli) and F.V. analyzed the data; F.D. and G.I. contributed reagents/materials/analysis tools; A.M. (Alessandra Moncada) and A.M. (Alessandro Miceli) wrote the manuscript.

Funding

This research received no external funding.

Conflicts of Interest

The authors declare no conflict of interest.

References

  1. Marschner, P. Marschner’s Mineral Nutrition of Higher Plants, 3rd ed.; Elsevier/Academic Press: Amsterdam, The Netherlands, 2012. [Google Scholar]
  2. Bortels, H. Molybdän als Katalysator bei der biologischen Stickstoffbindung. Archiv. Für Mikrobiol. 1930, 1, 333–342. [Google Scholar] [CrossRef]
  3. Arnon, D.I.; Stout, P.R. Molybdenum as an essential element for higher plants. Plant Physiol. 1939, 14, 599–602. [Google Scholar] [CrossRef] [PubMed]
  4. Kaiser, B.N; Gridley, K.L.; Brady, J.N.; Phillips, T.; Tyerman, S.D. The Role of molybdenum in agricultural plant production. Ann. Bot. 2005, 96, 745–754. [Google Scholar] [CrossRef] [PubMed]
  5. Villora, G.; Moreno, D.A.; Romero, L. Phosphorus supply influence the molybdenum, nitrate and nitrate reductase activity in eggplant. J. Hortic. Sci. Biotechnol. 2002, 77, 305–309. [Google Scholar] [CrossRef]
  6. Schwarz, G.; Mendel, R.R.; Ribbe, M.W. Molybdenum cofactors, enzymes and pathways. Nature 2009, 460, 839–847. [Google Scholar] [CrossRef] [PubMed]
  7. Lavon, R.; Goldschmidt, E.E. Enzymatic methods for detection of mineral element deficiencies in citrus leaves. J. Plant Nutr. 1999, 22, 139–150. [Google Scholar] [CrossRef]
  8. Redingbaugh, M.G.; Campbell, W.H. Higher plant responses to environmental nitrate. Physiol. Plant. 1991, 82, 640–650. [Google Scholar] [CrossRef]
  9. Crawford, N.M. Nitrate: Nutrient and signal for plant growth. Plant Cell 1995, 7, 859–868. [Google Scholar] [CrossRef] [PubMed]
  10. Min, Y.U.; Hu, C.X.; Sun, X.C.; Wang, Y.H. Influences of Mo on nitrate reductase, glutamine synthetase and nitrogen accumulation and utilization in Mo-efficient and Mo-inefficient winter wheat cultivars. Agric. Sci. China 2010, 9, 355–361. [Google Scholar]
  11. Agarwala, S.C.; Sharma, C.P.; Farooq, S.; Chatterjee, C. Effect of molybdenum deficiency on the growth and metabolism of corn plants raised in sand culture. Can. J. Bot. 1978, 56, 1905–1909. [Google Scholar] [CrossRef]
  12. Chatterjee, C.; Nautiyal, N.; Agarwala, S.C. Metabolic changes in mustard plants associated with molybdenum deficiency. New Phytol. 1985, 100, 511–518. [Google Scholar] [CrossRef]
  13. Spencer, D.; Wood, J.G. The role of molybdenum in nitrate reduction in higher plants. Aust. J. Biol. Sci. 1954, 7, 425–434. [Google Scholar] [CrossRef] [PubMed]
  14. Santamaria, P.; Elia, A.; Serio, F.; Todaro, E. A survey of nitrate and oxalate content in fresh vegetables. J. Sci. Food Agric. 1999, 79, 1882–1888. [Google Scholar] [CrossRef]
  15. Gupta, U.C. Molybdenum in Agriculture; Cambridge University Press: Cambridge, UK, 1997. [Google Scholar]
  16. Boertje, G.A. Molybdenum and lettuce. In Annual Report—Glasshouse Crops Research and Experiment Station; Glasshouse Crops Research and Experiment Station: Naaldwijk, The Netherlands, 1969. [Google Scholar]
  17. Sonneveld, C.; Voogt, W. Plant Nutrition of Greenhouse Crops; Springer: New York, NY, USA, 2009. [Google Scholar]
  18. Goto, E.; Both, A.J.; Albright, L.D.; Langhans, R.W.; Leed, A.R. Effect of dissolved oxygen concentration on lettuce growth in floating hydroponics. Acta Hortic. 1996, 440, 205–210. [Google Scholar] [CrossRef] [PubMed]
  19. McGuire, R.G. Reporting of objective color measurements. Hortic. Sci. 1992, 27, 1254–1255. [Google Scholar]
  20. Miceli, A.; Miceli, C. Effect of nitrogen fertilization on the quality of Swiss chard at harvest and during storage as minimally processed produce. J. Food Qual. 2014, 37, 125–134. [Google Scholar] [CrossRef]
  21. Resh, H.M. Hydroponic Food Production; Woodbridge Press: Santa Barbara, CA, USA, 1997. [Google Scholar]
  22. Islam, M.M.; Karim, M.R.; Oliver, M.M.H.; Urmi, T.A.; Hossain, M.A.; Haque, M.M. Impacts of trace element addition on lentil (Lens culinaris L.). Agronomy 2018, 8, 100. [Google Scholar] [CrossRef]
  23. D’Anna, F.; Miceli, A.; Vetrano, F. First results of floating system cultivation of Eruca sativa L. Acta Hortic. 2003, 609, 361–364. [Google Scholar] [CrossRef]
  24. Miceli, A.; Moncada, A.; Vetrano, F.; D’Anna, F. First results on yield and quality response of basil (Ocimum basilicum L.) grown in floating system. Acta Hortic. 2003, 609, 377–381. [Google Scholar] [CrossRef]
  25. Adams, P. Effect of diurnal fluctuations in humidity on the accumulation of nutrients in the leaves of tomato (Lycopersicon esculentum). J. Hortic. Sci. 1991, 66, 545–550. [Google Scholar] [CrossRef]
  26. Bèlanger, R. Soluble silicon: Its role in crop and disease management of greenhouse crops. Plant Dis. 1995, 79, 329–336. [Google Scholar] [CrossRef]
  27. Ehret, D.L.; Ho, L.C. Effects of salinity on dry matter partitioning and fruit growth in tomatoes grown in nutrient film culture. J. Hortic. Sci. 1986, 61, 361–367. [Google Scholar] [CrossRef]
  28. Epstein, E. The anomaly of silicon in plant biology. Proc. Natl. Acad. Sci. USA 1994, 91, 11–17. [Google Scholar] [CrossRef] [PubMed]
  29. Epstein, E. Silicon in plants: Facts vs. concepts. Stud. Plant Sci. 1999, 8, 1–15. [Google Scholar]
  30. Epstein, E.; Bloom, A.J. Inorganic components of plants. In Mineral Nutrition of Plants: Principles and Perspectives, 2nd ed.; Epstein, E., Bloom, A.J., Eds.; Sinauer Associates, Inc.: Sunderland, MA, USA, 2005; pp. 44–45. [Google Scholar]
  31. Mulholland, B.J.; Taylor, I.B.; Jackson, A.C.; Thompson, A.J. Can ABA mediate responses of salinity stressed tomato. Environ. Exp. Bot. 2003, 50, 17–28. [Google Scholar] [CrossRef]
  32. Sonneveld, C.; van der Burg, A.M.M. Sodium chloride salinity in fruit vegetable crops in soilless culture. Neth. J. Agric. Sci. 1991, 39, 115–122. [Google Scholar]
  33. Zhen, Y.; Liu, S.; Liu, S. Effect of appling molybdenum fertilizer on nitrate content in lettuce and you-mai vegetable. Soil Fertil. Sci. China 2007, 1, 51–53. [Google Scholar]
  34. Uchida, R. Essential nutrients for plant growth: Nutrient functions and deficiency symptoms. In Plant Nutrient Management in Hawaii’s Soils, Approaches for Tropical and Subtropical Agriculture; Silva, J.A., Uchida, R., Eds.; College of Tropical Agriculture and Human Resources, University of Hawaii at Manoa: Honolulu, HI, USA, 2000; pp. 31–55. [Google Scholar]
  35. Biacs, P.A.; Daood, H.G.; Kadar, I. Effect of Mo, Se, Zn, and Cr treatments on the yield, element concentration, and carotenoid content of carrot. J. Agric. Food Chem. 1995, 43, 589–591. [Google Scholar] [CrossRef]
  36. Breimer, T. Environmental factors and cultural measures affecting the nitrate content in spinach. Fert. Res. 1982, 3, 191–292. [Google Scholar] [CrossRef] [Green Version]
  37. Campo, R.J.; Araujo, R.S.; Hungria, M. Molybdenum-enriched soybean seeds enhance N accumulation, seed yield, and seed protein content in Brazil. Field Crops Res. 2009, 110, 219–224. [Google Scholar] [CrossRef]
  38. Vieira, R.F.; Salgado, L.T.; Ferreira, A.C.B. Performance of common bean using seeds harvested from plants fertilized with high rates of molybdenum. J. Plant Nutr. 2005, 28, 363–377. [Google Scholar] [CrossRef]
  39. Valenciano, J.B.; Boto, J.A.; Marcelo, V. Chickpea (Cicer arietinum L.) response to zinc, boron and molybdenum application under field conditions. N. Z. J. Crop Hortic. Sci. 2011, 39, 217–229. [Google Scholar]
  40. Randall, P.J. Changes in nitrate and nitrate reductase levels on restoration of molybdenum to molybdenum-deficient plants. Aust. J. Agric. Res. 1969, 20, 635–642. [Google Scholar] [CrossRef]
  41. Hewitt, E.J. The essential nutrient elements: requirements and interactions in plants. In Plant Physiology: A Treatise; Steward, F.C., Ed.; Academic Press: New York, NY, USA, 1963. [Google Scholar]
  42. Agarwala, S.C.; Hewitt, E.J. Molybdenum as a plant nutrient: IV. The interrelationships of molybdenum and nitrate supply in chlorophyll and ascorbic acid fractions in cauliflower plants grown in sand culture. J. Hortic. Sci. 1954, 29, 291–300. [Google Scholar] [CrossRef]
  43. Munshi, C.B.; Mondy, N.I. Effect of soil applications of sodium molybdate on the quality of potatoes: Polyphenol oxidase activity, enzymatic discoloration, phenols, and ascorbic acid. J. Agric. Food Chem. 1988, 36, 688–690. [Google Scholar] [CrossRef]
  44. Shinohara, Y.; Suzuki, Y. Effects of light and nutritional conditions on the ascorbic acid content of lettuce. J. Jpn. Soc. Hortic. Sci. 1981, 50, 239–246. [Google Scholar] [CrossRef]
  45. Biesiada, A.; Kołota, E. The effect of nitrogen fertilization on yielding and chemical composition of radicchio chicory for autumn-harvest cultivation. Acta Sci. Pol. 2010, 9, 85–91. [Google Scholar]
  46. Kansal, B.; Singh, B.; Bajaj, K.; Kaur, G. Effect of different levels of nitrogen and farmyard manure on yield and quality of spinach (Spinacea oleracea L.). Plant Food Hum. Nutr. 1981, 31, 163–170. [Google Scholar] [CrossRef]
  47. Mozafar, A. Plant Vitamins Agronomic, Physiological and Nutritional Aspects; CRC Press Inc.: Boca Raton, FL, USA, 1994. [Google Scholar]
  48. Muller, K.; Hippe, J. Influence of differences in nutrition on important quality characteristics of some agricultural crops. Plant Soil 1987, 100, 35–45. [Google Scholar] [CrossRef]
  49. Hulewicz, D.; Kalbarczyk, M. The influence of light on the yield of lettuce and its nutrient content. Archiv. fur Gartenbau. 1976, 24, 113–120. [Google Scholar]
  50. Cantliffe, D.J.; MacDonald, G.E.; Peck, N.H. Reduction of nitrate accumulation by molybdenum in spinach grown at low pH. Commun. Soil Sci. Plant Anal. 1974, 5, 273–282. [Google Scholar] [CrossRef]
  51. Cox, D.A. Poinsettia cultivars differ in their response to molybdenum deficiency. HortScience 1992, 27, 892–893. [Google Scholar]
  52. Cox, D.A. Foliar-applied molybdenum for preventing or correcting molybdenum deficiency of poinsettia. Hortscience 1992, 8, 894–895. [Google Scholar]
  53. Smedley, P.L.; Cooper, D.M.; Ander, E.L.; Milne, C.J.; Lapworth, D.J. Occurrence of molybdenum in British surface water and groundwater: Distributions, controls and implications for water supply. Appl. Geochem. 2014, 40, 144–154. [Google Scholar] [CrossRef]
  54. Martens, D.C.; Westermann, D.T. Fertilizer application for correcting micronutrient deficiencies. In Micronutrients in Agriculture, 2nd ed.; SSSA Book Series, No. 4; ACSESS DL: Madison, WI, USA, 1991; pp. 549–592. [Google Scholar]
  55. EFSA NDA Panel (EFSA Panel on Dietetic Products, Nutrition and Allergies). Scientific opinion on dietary reference values for molybdenum. EFSA J. 2013, 11, 3333. [Google Scholar] [CrossRef] [Green Version]
  56. Rajagopalan, K.V. Molybdenum: An essential trace element in human nutrition. Annu. Rev. Nutr. 1988, 8, 401–427. [Google Scholar] [CrossRef] [PubMed]
  57. Bergmann, W. Nutritional Disorders of Plants—Development, Visual and Analytical Diagnosis; Spektrum Akademischer Verlag: Berlin, Germany, 1992. [Google Scholar]
  58. Gupta, U.C. Symptoms of molybdenum deficiency and toxicity in crops. In Molybdenum in Agriculture; Gupta, U.C., Ed.; Cambridge University Press: Cambridge, UK, 1997. [Google Scholar]
  59. Hamlin, R.L. Molybdenum. In Handbook of Plant Nutrition; Barker, A.V., Pilbeam, D.J., Eds.; CRC Press: Boca Raton, FL, USA, 2007; pp. 375–394. [Google Scholar]
  60. Mengel, K.; Kirkby, E.A. Molybdenum. Principles of Plant Nutrition, 5th ed.; Kluwer Academic Publishers: Dordrecht, The Netherlands, 2001; pp. 613–619. [Google Scholar]
Figure 1. Linear predictions of the relationship between molybdenum (Mo) rate and the ascorbic acid values of lettuce (continuous line), escarole (dotted line), and curly endive (dashed line) plants grown in nutrient solutions containing different levels of molybdenum fertilization for 55 days.
Agronomy 08 00171 g001
Figure 2. Linear and quadratic predictions of the relationship between molybdenum (Mo) rate and the nitrate content values of lettuce (continuous line), escarole (dotted line), and curly endive (dashed line) plants grown in nutrient solutions containing different levels of molybdenum fertilization for 55 days.
Agronomy 08 00171 g002
Figure 3. Linear and quadratic predictions of the relationship between molybdenum (Mo) and the Mo content values of lettuce (continuous line), escarole (dotted line), and curly endive (dashed line) plants grown in nutrient solutions containing different levels of molybdenum fertilization for 55 days.
Agronomy 08 00171 g003
Figure 4. Plot of (a) loadings (agronomic and quality parameters of lettuce, escarole, and curly endive plants at harvest) and (b) scores (trials) formed by the first two principal components from the PCA analysis. LET_0, LET_0.5, LET_1.5, and LET_3.0: lettuce cultivated in nutrient solutions with 0, 0.5, 1.5, and 3.0 µmol L−1 Mo, respectively; ESC_0, ESC_0.5, ESC_1.5, and ESC_3.0: escarole cultivated in nutrient solutions with 0, 0.5, 1.5, and 3.0 µmol L−1 Mo, respectively; CEN_0, CEN_0.5, CEN_1.5, and CEN_3.0: curly endive cultivated in nutrient solutions with 0, 0.5, 1.5, and 3.0 µmol L−1 Mo, respectively.
Agronomy 08 00171 g004
Table 1. Yield and morphological parameters of lettuce, escarole, and curly endive plants grown in nutrient solutions containing different levels of molybdenum fertilization for 55 days.
Leafy Vegetables (LV)Mo (µmol L−1)Yield (kg m−2)Head Weigth (g)Head Height (cm)Stem Diameter (mm)Number of LeavesHead Dry Matter (%)Root Dry Matter (%)
Lettuce01.8 ae147.2e21.3d14.4d37.6c10.8c2.0c
0.53.9c322.3c34.0ab22.8ab60.7b13.2b2.4b
1.54.0c331.0c36.7a24.0a63.3b16.6a7.8a
3.03.9c326.2c32.2ab22.8ab62.3b17.4a7.0a
Escarole02.0de169.2de17.7e18.7c42.3c9.2d2.7c
0.54.5b374.5b21.8d23.8ab84.2a11.0c3.8b
1.54.6b379.0b22.8d21.5b89.8a10.9c4.5b
3.04.3b362.1b22.3d21.0b80.5a16.7a4.3b
Curly Endive02.5d210.8d19.7de18.6c37.4c8.3d1.7d
0.55.6a469.3a29.3bc25.0a81.8a10.3c2.1c
1.55.5a456.3a25.7c20.7b87.3a10.3c2.3c
3.05.6a464.0a28.0c21.0b85.8a9.9c1.8cd
LV *** b******ns*********
Mo *********************
Interaction LV × Mo ****************
a each value is the mean of three replicates of 20 plants each (10 plants each for head and root dry matter). Values in a column followed by the same letter are not significantly different, according to LSD test. b significance (ns = not significant); * significant at p < 0.05; ** significant at p < 0.01; *** significant at p < 0.001.
Table 2. Models that predicted the responses of the evaluated yield and morphological variables to molybdenum rates for each leafy vegetable.
VariableLettuceEscaroleCurly Endive
Model aR2Model aR2Model aR2
Yieldy = −0.605x2 + 2.378x + 2.1460.769 **,by = −0.726x2 + 2.769x + 2.4800.748 **y = −0.798x2 + 3.162x + 3.1440.697 **
Head weighty = −0.605x2 + 2.378x + 2.1470.769 **y = −0.726x2 + 2.769x + 2.4810.748 **y = −0.798x2 + 3.162x + 3.1450.697 **
Head heighty = −4.092x2 + 17.596x + 23.1330.824 ***y = −1.424x2 + 5.581x + 18.2850.820 ***y = −1.466x2 + 6.176x + 22.1680.352 ns
Stem diametery = −3.153x2 + 11.795x + 15.5880.761 **y = −1.076x2 + 3.480x + 19.9840.166 nsy = −0.887x2 + 2.708x + 20.4810.120 ns
Number of leavesy = −6.987x2 + 27.632x + 41.5310.733 ***y = −14.428x2 + 53.331x + 49.0170.798 **y = −13.436x2 + 53.443x + 44.9250.777 **
Head dry mattery = −1.081x2 + 5.466x +10.7860.981 ***y = 0.742x2 + 0.052x + 9.7590.889 ***y = 0.327x + 9.2770.101 ns
Root dry mattery = −1.252x2 + 5.723x + 1.2500.870 ***y = 0.4486x + 3.26430.219 nsy = −0.0149x + 1.98030.002 ns
a where y is the response of the dependent variable; x = Mo rate. b significance (ns = not significant); ** significant at p < 0.01; *** significant at p < 0.001.
Table 3. Titratable acidity (TA), total soluble solids (TSS), nitrate, ascorbic acid, and Mo content of lettuce, escarole, and curly endive plants grown in nutrient solutions containing different levels of molybdenum fertilization for 55 days.
Leafy Vegetables (LV)Mo
(µmol L−1)
TSS
(°Brix)
TA
(%) c
Ascorbic Acid
(mg kg−1 FW)
N-NO3
(mg kg−1 FW)
Mo
μg g−1 FW)
Lettuce03.1e a0.57c124.9c1427.3c0.02h
0.55.4b0.75b214.3b1210.2d0.11g
1.54.7c0.98ab219.3b1006.9e0.50ef
3.04.1d0.93b320.2a1039.2e0.43f
Escarole03.2e0.42d57.5e1585.2b0.03h
0.54.3cd0.65c89.0d1222.3d0.55e
1.54.7c0.59c90.8d1373.3cd1.91c
3.05.9a1.23a139.0c1047.3e4.02a
Curly Endive03.0e0.39d48.2f1927.1a0.05gh
0.54.2d0.67c71.9e1606.9b1.31d
1.54.1d1.05ab61.3e1350.8c1.34d
3.05.1bc1.13ab102.1d1181.2d2.68b
LV *** bns*********
Mo ***************
Interaction LV × Mo ***************
a each value is the mean of three replicated samples of 200 g each. Values in a column followed by the same letter are not significantly different, according to LSD test. b significance (ns = not significant); *** significant at p < 0.001. c Titratable acidity, expressed as % malic acid equivalents.
Table 4. Models that predicted the responses of the evaluated quality variables to molybdenum rates for each leafy vegetable.
VariableLettuceEscaroleCurly Endive
Model aR2Model aR2Model aR2
TSSy = 0.270x + 3.9960.130 ns by = 0.8111x + 3.52780.891 ***y = 0.5968x + 3.3540.807 ***
TAy = −0.101x2 + 0.424x + 0.5680.921 ***y = 0.0849x2 − 0.0141x + 0.49590.852 ***y = −0.1265x2 + 0.6275x + 0.38920.963 ***
Ascorbic acidy = 56.836x + 148.6260.880 ***y = 24.259x + 63.7680.850 ***y = 15.205x + 51.8690.735 ***
N-NO3y = 83.52x2 − 384.17x + 14110.917 ***y = −137.56x + 14790.618 **y = 97.928x2 − 531.12x + 1898.90.966 ***
Moy = −0.111x2 + 0.486x − 0.0240.902 **y = 1.3459x − 0.05480.998 ***y = 0.7597x + 0.39540.873 ***
L *y = −1.116x + 46.6480.194 nsy = −1.0054x + 52.6690.315 nsy = 1.734x2 − 6.562x + 55.8510.661 **
Chromay = −1.145x2 + 4.506x + 28.9910.615 *y = −1.862x2 + 6.320x + 28.8510.781 **y = −1.142x2 + 3.759x + 28.7430.392 ns
Hue angley = −2.178x2 + 8.324x + 116.310.526 *y = −2.420x2 + 9.736x + 113.030.659 **y = −2.545x2 + 9.950x + 113.810.656 **
a where y is the response of the dependent variable; x = Mo rate. b significance (ns = not significant); * significant at p < 0.05; ** significant at p < 0.01; *** significant at p < 0.001.
Table 5. Colour parameters of the leaves of lettuce, escarole, and curly endive plants grown in nutrient solutions containing different levels of molybdenum fertilization for 55 days.
L *ChromaHue Angle
Leafy Vegetable (LV)
Lettuce45.3b a31.4a120.5a
Escarole51.4a31.4a118.3b
Curly Endive52.7a30.4b118.9ab
Mo (µmol L−1)
053.4a28.2b112.9b
0.548.2b32.1a121.2a
1.548.9b32.4a121.5a
3.048.5b31.4a121.3a
LV*** b**
Mo*********
Interaction LV × Monsnsns
a each value is the mean of three replicates (ninety measures). For each factor, values within a column followed by the same letter are not significantly different according to LSD test. b significance (ns not significant); * significant at p < 0.05; *** significant at p < 0.001.
Table 6. Correlation of variables to the factors of the principal components analysis (PCA) based on factor loadings.
VariableFactor 1Factor 2Factor 3
Head weight0.7950.552−0.138
Head height0.666−0.433−0.310
Stem diameter0.8260.096−0.478
Leaf number0.8000.5480.006
Head dry matter0.649−0.6640.234
Root dry matter0.543−0.635−0.109
TSS0.782−0.0060.471
TA0.7710.0050.458
Ascorbic acid−0.768−0.4630.256
N-NO3−0.8060.328−0.369
Mo0.5380.4760.652
L*−0.6030.6950.087
Chroma0.851−0.088−0.295
Hue angle0.8710.293−0.293
Values in bold within the same factor indicate the variable with the largest correlation.

