Article

Short-Term Effects of Biochar Amendment on Greenhouse Gas Emissions from Rainfed Agricultural Soils of the Semi–Arid Loess Plateau Region

1
Gansu Provincial Key Lab of Aridland Crop Science, Gansu Agricultural University, Lanzhou 730070, China
2
College of Resources and Environmental Sciences, Gansu Agricultural University, Lanzhou 730070, China
3
CSIR-Crops Research Institute, P.O. Box 3785 Kumasi, Ghana
4
College of Agronomy, Gansu Agricultural University, Lanzhou 730070, China
5
Department of Agronomy, University for Development Studies, P.O. Box 1882 Tamale, Ghana
*
Author to whom correspondence should be addressed.
Agronomy 2018, 8(5), 74; https://doi.org/10.3390/agronomy8050074
Submission received: 1 March 2018 / Revised: 17 April 2018 / Accepted: 19 April 2018 / Published: 16 May 2018

Abstract

:
In rainfed agricultural ecosystems in northwest China, improving soil fertility and reducing greenhouse gas (GHG) emissions are key factors for developing sustainable agriculture. This study determined the short-term effects of different biochar amendment rates on diurnal and seasonal variations of GHG emissions in the Loess Plateau to produce a background dataset that may be used to inform nutrient management guidelines for semiarid environments. Biochar produced by pyrolysis at 300–500 °C from maize straw was applied at rates of 0, 10, 20, 30, 40, and 50 t ha−1 (T0, T1, T2, T3, T4, T5), respectively. The results indicated that in the first year after the application, T3, T4, and T5 treatments increased soil organic carbon (0–10 cm) by 54.7%, 56.3%, and 56.9% compared to the other treatments. In the first, year, biochar amendment decreased diurnal CH4 and N2O flux by an average of 17–119% compared to T0, among which T3 had the lowest mean value. T3 and T4 also had similar mean CO2 flux, which was 33% lower than T0. Application of 30 t ha−1 biochar produced the lowest cumulative CO2 and N2O emissions of 2300 and 4.07 kg h−1, respectively. Biochar amendment showed no effect on grain yiel but reduced the global warming potential and GHG emission intensity by an average of 23% and 25%, respectively. The biochar application rate of 30 t ha−1 under the conditions of this study may be an appropriate rate for improving soil C sequestration and mitigation of GHG emissions in the first year after its application to soils on semi–arid Loess Plateau.

1. Introduction

Greenhouse gas (GHG) emissions are main driving forces inducing global warming and threatening the sustainability of agricultural production on the planet [1]. It has been reported that amounts of CH4, N2O, and CO2 emitted from agro–ecosystems can account for 50%, 60%, and 20% of the global emissions from anthropogenic activities [2]. Farmlands are a major carbon source of GHG, accounting for 14% of the anthropogenic emissions globally [3]. Therefore, alternative, effective, and environmentally friendly strategies need to be developed in agricultural sector [4].
Biochar is a carbon–rich solid byproduct of biomass pyrolysis at 350–600 °C. Evidence has shown that biochar amendment can significantly improve carbon sequestration in soil, and reduce anthropogenic GHG fluxes, and enhance crop productivity [5]. When it is returned to field, it can slow down the process of organic carbon mineralization, increasing C sequestration [6], while reducing C emission due to inhibition of native C mineralization (negative priming) [7]. However, observations concerning biochar effects on GHG emission were conflicting. For instance, while some studies have shown that biochar amendment significantly decreased the GHG emission from croplands [8] others found that biochar amendment increased CH4 emissions [5]. Studies on the magnitude of GHG emissions other than CO2 in contrasting pedoclimatic situations are still scarce in an agricultural context.
The aforementioned studies mainly conducted in various crops on irrigated land, which is very different to rain–fed soil developed from Loess parent substrate. In this study, we investigated the short-term effects of biochar amendment of semi–arid soil under rain–fed agriculture on GHG emissions and crop yield. Although the effect of biochar on soil properties and GHG could change in the long-term, experimental data derived from this 1-year study may be useful to develop suitable crop models for the establishment of practical guidelines and best management practices for biochar use in agriculture in northwestern China. We hypothesized that biochar amendment would improve soil organic carbon and reduce GHG emissions after application. In this study, different application rates of biochar were tested in soils of the Loess Plateau of northwest China, a typical semi-arid rain–fed agricultural region. Variations of GHG emission, including CH4, N2O, and CO2, were investigated during the entire growing season following biochar amendment The objective of this study is to identify optimal application rate of biochar for rain–fed spring wheat.

2. Materials and Methods

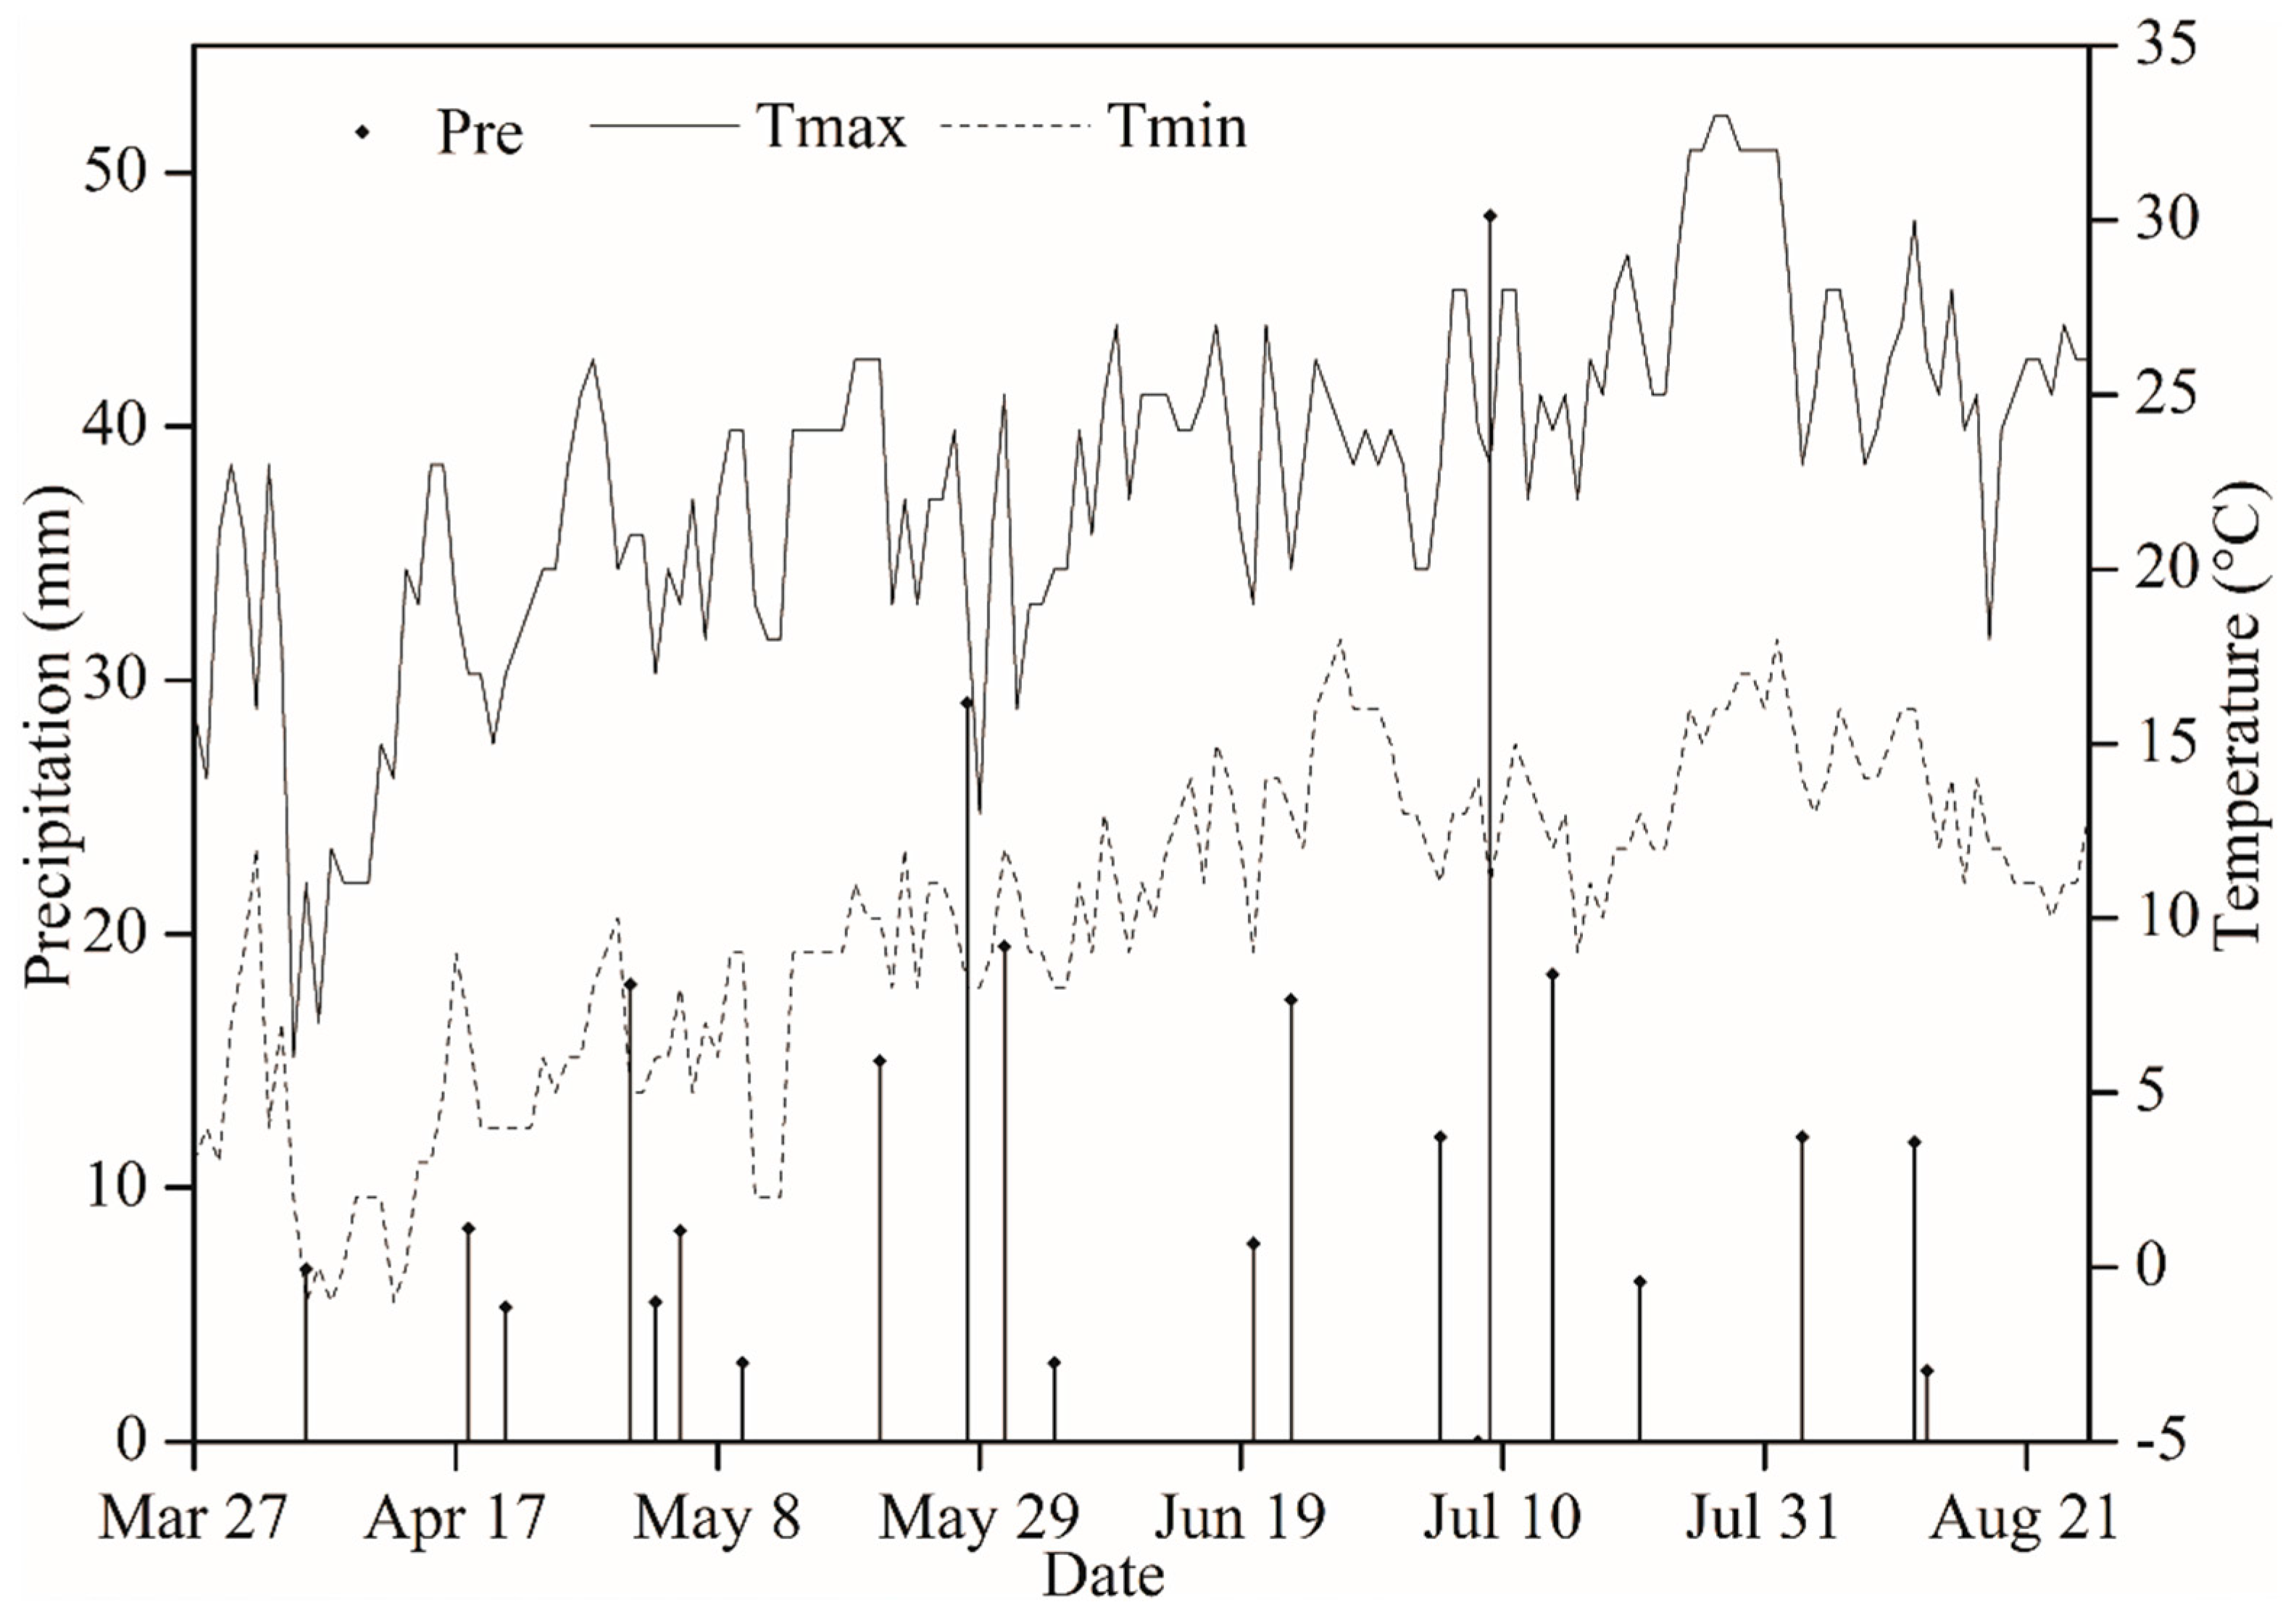
2.1. Site Description

The field experiment was carried out in 2015 at Dingxi Experimental Station of Gansu Agricultural University, China (35°28′ N, 104°44′ E, 1971 m a.s.l.). The soil is derived from loess parent substrate. It has a sandy–loamy texture and low fertility, and is classified as Calcaric Cambisols [9]. Long-term (1981–2010) annual mean precipitation is 391 mm, with about 54% occurring between July and September. Accumulated temperature above 10 °C is 2239 °C, mean temperature 6.5 °C, frost–free period 149 d, solar radiation 5929 MJ m−2, and sunshine duration 2470 h. Daily maximum and minimum temperature and precipitation during the experiment year are presented in Figure 1. The sandy–loam soil has a pH value in 0–60 cm soil layer of 8.4, soil bulk density was 1.17 g cm−3, soil organic matter content was 9.6 g kg−1, total nitrogen (N) and phosphorus (P) contents were 0.76 and 1.77 g kg−1, wilting point and saturated water content was 7.3% and 21.9%, respectively.

2.2. Experimental Design

Biochar was applied at rates of 0, 10, 20, 30, 40, and 50 t ha−1 (T0, T1, T2, T3, T4, and T5), respectively. Urea (46% N) and calcium superphosphate (6.1% P) were applied as basal fertilizer at 105 kg N ha−1 and 46 kg P ha−1, respectively. The experiment was a randomized complete block design with three replicates. Plot size was 2.8 m × 6 m. The individual plots were separated by protection rows that were 0.5 m in width. At the beginning of the experiment, fertilizers were spread on the soil surface and incorporated into soil by rotary cultivator drawn by a 13.4 kW (18 HP) tractor to 20 cm depth. No additional fertilizer was applied thereafter. Spring wheat (cv. Dingxi No. 35) was sown on 25 March, harvested on 10 August. Sowing rate was 187.5 kg ha−1, and row spacing was 20 cm.

2.3. Production and Basic Properties of Biochar

Biochar was produced from maize straw through pyrolysis at 350–550 °C, which can convert 35% of the biomass to biochar in form of granular particles (Golden Future Agriculture Technology Co., Ltd., Liaoning, China). Biochar mass was ground to pass through a 5 mm sieve, and mixed thoroughly to obtain a powder consistency that would mix more uniformly with the soil. Biochar was applied before sowing and mechanically incorporated into the soil to a depth of 20 cm synchronously with fertilizer application after rotary tillage. Biochar’s properties were characterized for total organic C and N with an Elementar Vario max CNS Analyser (German Elementar Company, Langenselbold, Hesse, Germany). The pH of biochar was measured for a 1:5 biochar/water suspension with a compound glass electrode (Seven Easy Mettler Toledo, Oakland , CA, USA). Total ash content was determined using 720 °C ignition in a muffle furnace for 3 h, and the mineral element content was determined by acid digestion and elemental analysis by atomic adsorption spectroscopy. The biochar had C and N contents of 53.3% and 1.04%, respectively, a total ash content of 20.8%, and a pH (H2O) of 9.2. With respect to elemental analysis, the biochar contained 0.8% Ca, 0.6% Mg, 0.4% Fe and 2.6% K.

2.4. Soil Sampling and Analysis

Soil samples were collected within 3 days after harvest in 2015 for determination of microbial biomass carbon and soil organic carbon. Undisturbed soils samples were collected from three points in each plot using a soil corer (4.9 cm diameter). The soil from the same depth at 0–5 cm, 5–10 cm and 10–30 cm was bulked and mixed. The samples were air-dried, ground to <2 mm, and then sub–sampled and ground to <0.25 mm. Soil organic carbon in the fine ground samples was determined by a modified Walkley–Black wet oxidation method [10]. The method of chloroform fumigation and extraction (FE) as described by [11] was used to determine the microbial biomass carbon.

2.5. CH4, N2O, and CO2 Emission Monitoring

A base collar made of stainless steel was inserted into the soil to a depth of 20 cm before sowing. The collar remained in place during the entire growing season. A groove was made on the edge of the collar. A standard closed chamber was placed in the groove which was filled with water to prevent gas leakage during GHG gas collection. The chamber size was 36 cm × 35 cm × 38 cm in length × width × height, which was adapted to spring wheat growth. The gas sampling work started from sowing to harvest at 15 d interval. Gas sampling was performed between 8:30 a.m. and 11:30 a.m., and gas samples were collected using an airtight syringe with a volume of 50 mL at 0, 10, 20 and 30 min after chamber closure, and immediately transferred into a 150 mL aluminum–plastic compounded bags for storage.
Concentrations of CH4, N2O ,and CO2 were analyzed using a gas chromatograph (Agilent 7890A, Agilent Technologies, Wilmington, DE, USA) equipped with an electron capture detector (ECD) and a flame ionization detector (FID). Rates of CH4, N2O, and CO2 fluxes were calculated by linear increment of the gas concentration at 0, 10, 20 and 30 min. The calculation was only accepted when the R2 of the linear correlation was higher than 0.90 (p < 0.05). The average GHG fluxes were a mean of t hree replicates of each treatment over the sampling dates. The total emissions of CH4, N2O and CO2 over the whole spring wheat growing season were sequentially accumulated from the emissions averaged on every two adjacent intervals of the measurements [12].
The flux calculation equation was as follows [13]:
F = C 2 × V × M 0 × 273 / T 2 C 1 × V × M 0 × 273 / T 1 A × ( t 2 t 1 ) × 22.4
where F is the greenhouse gas fluxes (mg m−2 h−1); A is the area of collar (m2); V is the volume of the greenhouse gas fluxes (m3); M0 is the molecular weight of greenhouse gas fluxes; C1 and C2 is the concentration of greenhouse gas fluxes before and after chamber closure (mol mol−1); T1 and T2 is previous and current sampling flux temperature in the chamber; t1 and t2 is the previous and current sampling time.
The cumulative flux of CO2, N2O and CH4 in kg ha−1 was estimated using the equation as follows:
M = ( F n + 1 + F n ) × 0.5 × ( t n + 1 t n ) × 24 × 10 2
where F is the daily mean flux of CO2, N2O and CH4 (mg m−2 h−1); t is the Julian date for GHG collection; n and n + 1 is the nth and n + 1th observation of GHG fluxes, respectively.
Synchronous with gas sampling, soil temperature at 5, 10, 15 cm were determined using a thermo–couple (JM624, Tianjin Jinming Instrument Co. Ltd., Tianjin, China) from each plot in the area near the chamber.
In this study, global warming potential (GWP) is defined as the sum of the cumulative CO2−eq emissions (including CO2) as follows [7,14]:
GWP = 25 × CH 4 + 298 × N 2 O + CO 2
Greenhouse gas emission intensity (GHGI) is the yield–scaled GWP as follows:
GHGI = GWP / Yield
Spring wheat was harvested on 10 August 2015. After harvest, grain yield was determined on plot basis when moisture content of seeds was air–dried to 14%. Dry matter was measured at harvest stage, using quadrat cuts (3 rows × 1 m), replicated 3 times in each plot. The yield per plot was converted to kg ha−1 for statistical analysis.

2.6. Calculation and Statistics

Analysis of variance (ANOVA) was performed to determine the effects of different treatments on GHG emissions using Duncan’s multiple range tests. All statistical analyses were carried out using the SPSS package (SPSS Software, version 22.0; SPSS Institute Inc., Chicago, IL, USA). Significance was declared at p < 0.05.

3. Results

3.1. Soil Properties

The results of microbial biomass carbon and soil organic carbon for all the treatments are shown in Table 1. The results showed that application of T4 and T5 significantly reduced microbial biomass carbon (MBC) in the 0–5 soil depth compared to the other treatments, whereas in the 5–10 cm soil depth, significant differences were observed only between only T3 and T5 (Table 1). The T3, T4 and T5 treatments significantly (p < 0.05) increased soil organic carbon by 69.4% on average compared to the other treatments. Application of 50 t biochar ha−1 (T5), significantly (p < 0.05) increased soil organic C in all the layers studied compare to T0.

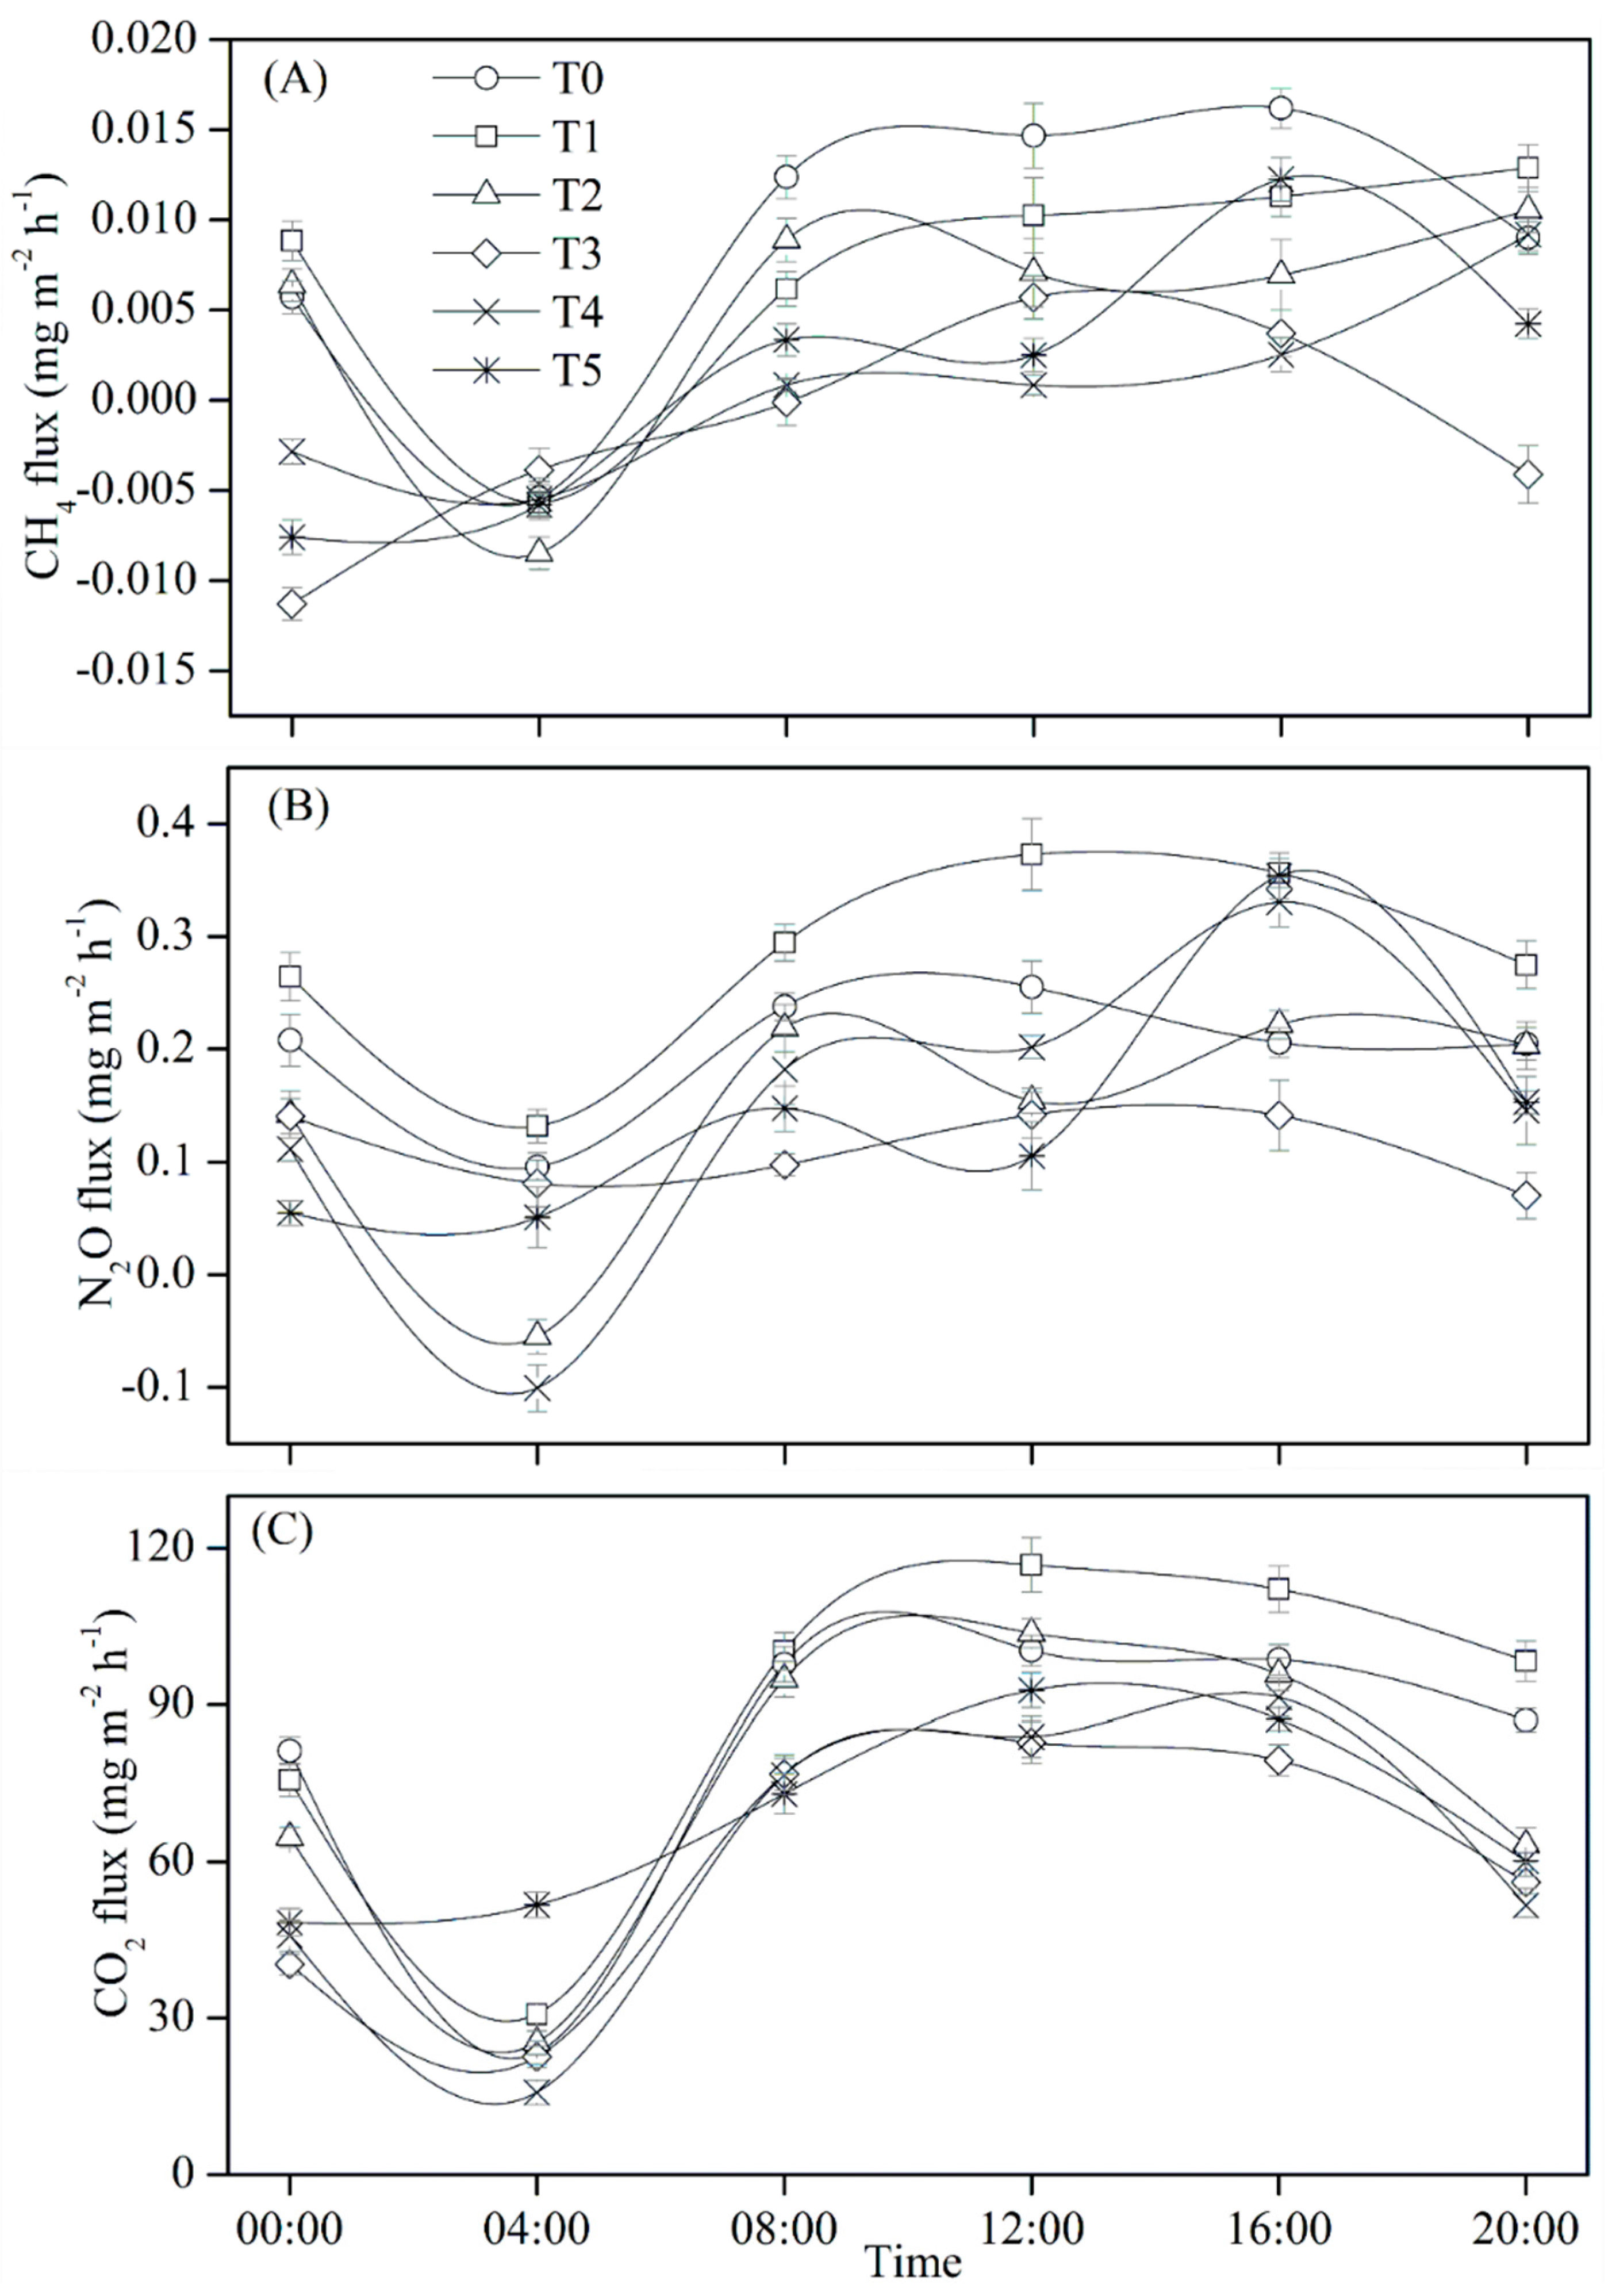
3.2. Diurnal Dynamics of GHG Flux

Across all treatments, GHG fluxes peaked at 12:00–16:00 h during a day and reached the lowest value at 0:00–4:00 h, showing a similar tendency to soil temperature (Figure 1). Moreover, mean diurnal GHG fluxes changed with biochar application rates in a parabolic manner, decreasing initially with the rates increasing to 30 t ha−1, reaching to the lowest point at T3, and then starting to bottom out from the lowest when the rates added from 30 to 50 t ha−1 (Figure 2).
All treatments presented a net CH4 emission source during daytime, whereas they became a net absorption sink of CH4 during the duration from 1:00 to 5:00 in night time (Figure 2A). T3 significantly lowered CH4 emissions, especially during nighttime, compared to the other treatments. For example, from 20:00 the current day to 8:00 next morning, T3 performed as a net CH4 absorption sink, with a mean flux of −0.0048 mg m−2 h−1. For other treatments a “sink effect” only occurred at 0:00–4:00 h under T4 and T5 treatments, and only at 4:00 h under T0, T1, and T2, respectively, during a day (Figure 2A). Moreover, biochar amendment significantly decreased the diurnal CH4 flux by an average of 17–119% compared to T0, among which T3 resulted in the lowest mean value of −0.0017 mg m−2 h−1, followed by T4 (0.0009 mg m−2 h−1).
T3 had a much flatter and lower diurnal curve of N2O flux compared to the other treatments (Figure 2B). However, diurnal dynamics of N2O flux under the other treatments more likely changed with soil temperature (data not shown). On average, T3 had the lowest mean value of 0.1121 mg m−2 h−1, whereas T0 resulted in the highest mean value of 0.2824 mg m−2 h−1. Although diurnal N2O fluxes under T2, T4, and T5 treatments were significantly different at 04:00 h and 12:00 h, the mean diurnal values were not different during a day, averaging at 0.1442–0.1475 mg m−2 h−1.
Diurnal CO2 flux peaked at 12:00 h during a day, and reached the lowest point at 4:00 (Figure 2C). Biochar amendment had the potential to lower both the minimum and maximum values of diurnal CO2 flux (Figure 2C). Among all treatments, T4 gave rise to the lowest CO2 flux of 15.76 mg m−2 h−1 at 4:00, 49% lower than T0, followed by T3, with a decrease by 27%. While both T3 and T4 had similar maximum CO2 flux at 12:00 h during a day. The maximum flux under T3 and T4 was 30% lower compared to T0. On average, T3 and T4 also had similar mean CO2 flux of 59.66–60.86 mg m−2 h−1, 33% around lower than T0, followed by T5, with a reduction of mean CO2 flux by 23%.

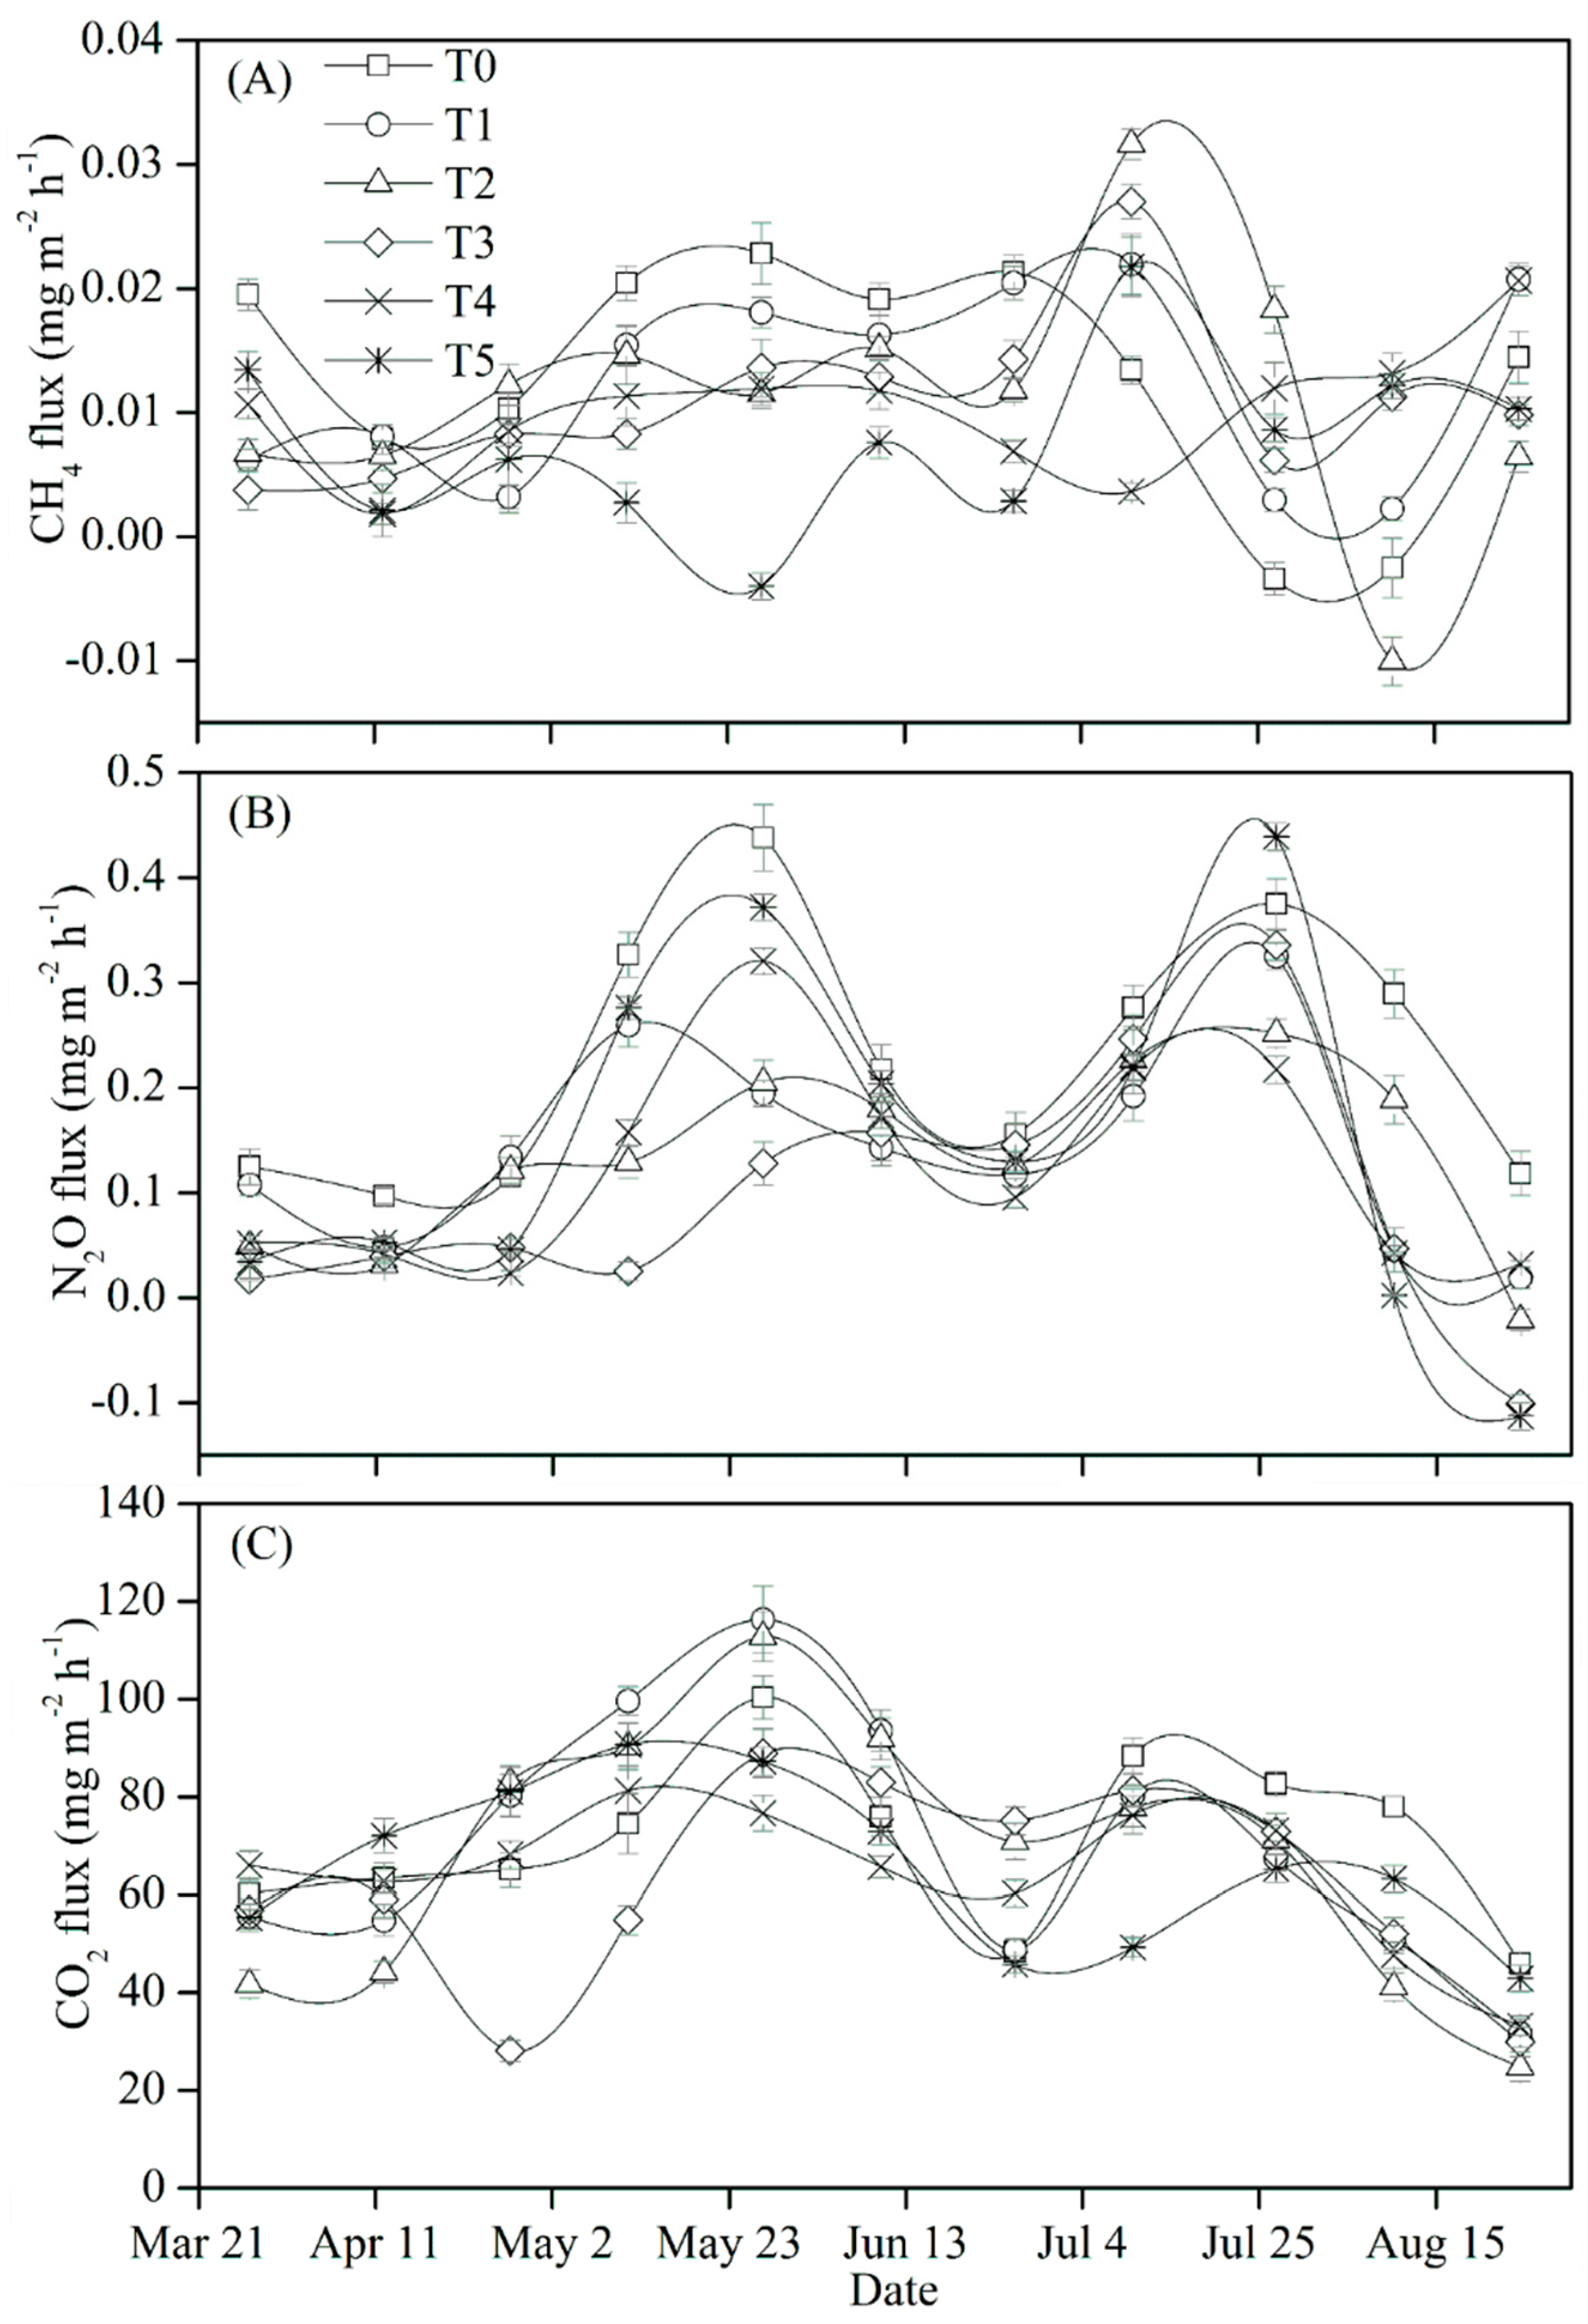
3.3. Seasonal Dynamics of GHG Flux

The largest seasonal GHG flux occurred from heading stage (late June) to flowering (mid-July) across all treatments, followed by jointing (mid-May) to booting stage (mid-June), whereas the smallest occurred at harvest (Figure 3).
Seasonal flux of CH4 emission (averaging at 0.0119 mg m−2 h−1) was greater than the absorption flux (averaging at −0.0050 mg m−2 h−1) across all treatments during the whole growing season (Figure 3A). Seasonal CH4 flux initially peaked at jointing stage around mid-May. The second (maximal) emission peak occurred at flowering stage around mid-July, coinciding with the high precipitation and air temperature in this duration. Except T4, biochar amendments resulted in significantly higher (62–135%) maximal values of CH4 emissions than T0. Although CH4 flux fluctuated with different growth stages of spring wheat under different application rates, when summing up emission and absorption cumulative flux during the entire growing season, the field can be identified as a weak emission source of CH4 for all treatments due to small values of CH4 flux.
Each treatment had a similar trend of seasonal N2O dynamics in the life cycle of spring wheat (Figure 3B). Furthermore, noticeable double peaks were observed on 27 May and 27 July for all treatments. The first peak value was lowest under T3 (0.1280 mg m−2 h−1) but highest under T0 (0.4382 mg m−2 h−1); whereas for the second peak, T5 had the highest N2O emission flux of 0.4393 mg m−2 h−1, followed by T0 (0.3754 mg m−2 h−1), and the smallest was T4, with a value of 0.2174 mg m−2 h−1. N2O emission flux was significantly lower before tillering stage (late April) for all treatments. N2O flux over the entire growth stage ranged from 0.0023 to 0.4393 mg m−2 h−1, whereas the absorption flux was from −0.1129 to −0.0213 mg m−2 h−1. Nevertheless, almost all N2O fluxes were positive value, except the last measurement on 25 August. The N2O emission flux (averaging at 0.1583 mg m−2 h−1) was markedly greater than the absorption flux (averaging at −0.0785 mg m−2 h−1). As a result, each treatment could be considered as an obvious source of N2O emission.
Seasonal CO2 flux increased with time after sowing (25 March), and firstly peaked at jointing stage in late May (Figure 3c). It declined after jointing until the second peak values occurred at flowering stage in early July, and then it decreased rapidly until the maturity. There were no differences in maximal seasonal CO2 fluxes between T1 and T2 (112–116 mg m−2 h−1), but they were 12–16% higher (p < 0.05) than T0. By contrast, T4 significantly reduced the maximal flux by 24%, compared to T0, followed by T5 (13%) and T3 (11%). T5 significantly reduced the second peak value (65.22 mg m−2 h−1 on 27 July) of seasonal CO2 flux by 26% compared to T0 (88.39 mg m−2 h−1 on July 10). There existed no differences in second peak values among T1, T2, T3, and T4, but they were decreased by an average of 11%, compared to T0. On average, T3 decreased mean CO2 flux over the entire growth stage by 13%, compared to T0, followed by T4 (9%) and T5 (7%), whereas there was no effect on season mean flux of CO2 under T1 and T2.

3.4. GHG Flux Correlated with Soil Temperature at Topsoil

Seasonal fluxes of CH4, N2O, and CO2 changed with soil temperature (Ts) in topsoil, and were correlated with Ts in a positive linear relationship (Table 2). Individually, CH4 flux was significantly correlated with Ts at 5 cm at p < 0.01 and Ts at the 10 cm and 15 cm at p < 0.05. However, N2O and CO2 flux were only significantly correlated with Ts at 5 cm.

3.5. Grain Yield, Total GHG Emissions and GWP

Although, biochar amendment increased grain yield (Table 3) of rain–fed spring wheat by an average of 3%, the difference was non-significant. Cumulative flux of CH4 decreased gradually with the increases of biochar amendment rates (Table 3). Over the entire growing season, cumulative flux of CH4 ranged from 0.002 kg ha−1 (T5) to 0.190 kg ha−1 (T0). While there existed no significant difference in cumulative CH4 flux between T0 and T1, in contrast, T2, T3, T4, and T5 significantly decreased cumulative CH4 flux by 24%, 30%, 60%, and 99%, respectively, compared to T0. Cumulative flux of N2O initially decreased with biochar application rates, reached the lowest point at a rate of 30 t ha−1 (T3), then it rose with the rate continuing increasing (Table 3). Biochar amendment significantly decreased cumulative N2O flux. Among all the biochar treatments, T3 reduced N2O flux to the lowest value by 53%, followed by T4, T2, and T1 with a reduction by 45%, 39%, and 37%, respectively, whereas amendment treatment with the highest N2O emission was T5, with a reduction by 29%. There existed no significant effect on CO2 mitigation in T1 and T2, compared to T0 (Table 3). However, T3, T4, and T5 significantly decreased cumulative CO2 emission by 12%, 9%, and 7%, respectively, compared to T0. Biochar amendment significantly reduced the GWP and GHGI, respectively, compared to T0 (Table 3). Among all treatments, T3 reduced the GWP and GHGI by 33% and 35%, respectively, compared to T0; followed by T4, with a decrease by 27% and 29%, respectively.

4. Discussion

The impact of biochar as an amendment on greenhouse gas emissions from soil depends on its properties, which are affected by the production conditions, feedstock and duration of exposure [6]. Under the conditions of this study, diurnal dynamics of GHG emissions in rain–fed spring wheat followed a similar tendency as soil temperature, with a maximum at midday and minimum before dawn (Figure 2). Similar findings have been reported by other studies [15]. Regardless of the mitigation effects of biochar amendment, we found that rain–fed spring wheat field was a weak source of CH4 emission. The result is inconsistent with a previous study that indicated farmland in the Loess plateau was a net sink for CH4 [16]. Soil derived from loess parent substrate in the study area had a sandy loam texture with good soil porosity and penetration capacity. However, in the experimental year, weather conditions were characterized by frequent precipitation and high temperature (Figure 1) probably due to El Nino phenomenon. These conditions led to a relatively anaerobic environment in soil. Increased soil moisture in the experimental year may have increased methanogen activity, resulting in a higher CH4 flux than previous years. However, biochar amendment showed potential to mitigate CH4 emission. This might be attributed to (i) increased soil aeration increasing soil CH4 consumption [17]; (ii) increased O2 supply suppressing methanogenesis and (iii) increased soil microbial biomass carbon and organic carbon [13]. In this study, the increased C content in biochar amended soils could be related to its high C content and the fact that biochar could slow down organic C utilization by microbes [6]. Measurement of biologically active fractions of SOC such as microbial biomass carbon could better reflect changes in soil quality and productivity. The mechanism for the increased in microbial biomass carbon in biochar amended soils could be related to the higher C content which protects the biological component of the soil and enhance nutrient availability for microbial growth. Under the conditions of this study, the seemingly fast increase in organic C when biochar was applied could be related to the soil parent material of the study area. This is in support of an observation by [18] who reported that soils on calcareous parent material have a higher ability to store carbon than soils on non-calcareous parent material.
Biochar applied to rain–fed spring wheat field significantly reduce N2O flux by an average of 41% (Table 3). However, due to much greater N2O emissions relative to N2O uptakes by the amended soils, the field was a net N2O source regardless of biochar application rates. In this study, the relationship between N2O emission and biochar application rate was fit to a quadratic function. This indicates that N2O flux decrease after biochar addition, reaching the lowest emissions at an application rate of 30 t ha−1. With biochar application rates >30 t ha−1, increasing N2O emissions were noted. Diurnal curve of N2O flux under T3 treatment was flat and smooth (Figure 2b). The “inhibition effect” on N2O flux by T3 indicated that biochar applied at 30 t ha−1 might be a favorable rate for suppressing nitrification and denitrification activity under rain–fed condition.
Our results based on the short-term study indicated that an appropriate application rate (30 t ha−1) of biochar can mitigate CO2 emission and increase soil organic C (Table 1 and Table 3). Previous studies have shown that the mitigation effect of biochar amendment was highly dependent on soil types, and biochar producing process [19]. Our study showed that adding a reasonable quantity of biochar can increase soil C sequestration and reduce C emission. The result was consistent with a study by [20], who observed that due to excellent chemical stability of soil biochar, soil C can be tightly fixed on biochar surface, directly reducing C emission in agro–ecosystem. However, some published literature concluded conflicting results that biochar amendment may promote soil C emission [17]. Our study indicated that effects of biochar amendment on C emission were highly dependent on biochar application rates.
GHG emissions are significantly correlated with environmental factors, among which soil temperature is the most important factor affecting emissions (Table 2). Previous studies have shown that biochar addition may lower soil temperature [20], and therefore may have a significant effect on soil temperatures at 5 and 10 cm. Therefore, the effect of biochar amendment on soil thermal properties will inevitably affect GHG emissions. Our results showed that under different application rates, GHG flux was positively correlated with topsoil temperature, with various R2 for different sources of GHG. The present study demonstrated that biochar amendment can significantly increase soil temperature, via increasing solar radiation absorption. Moreover, oxygen supply due to biochar amendment may accelerate methane oxidization, reducing CH4 emission, offsetting the potential of an increase in CH4 emission driven by enhanced soil temperature.
Although biochar addition increased grain yield compared to T0, the difference was not significant (Table 3). This was probably dependent upon biochar types or a shorter-term of application. Previous studies showed that applying charred bark of Acacia mangium increased maize biomass yield by 43% [21] in the long-term; similarly, adding wood and maize stalk biochar increased maize grain yield by 114% [22]. Despite limited impacts on grain yield in the first year after application, biochar application significantly reduced GWP and GHGI by an average of 23% and 25%, respectively (Table 3). Decreases in GWP and GHGI may have been linked to increased SOC contents [23,24]. The result was consistent with [5] who conducted a similar study in upland cotton field in northwest China. The long-term effects of biochar amendment on grain yield and GHG emissions yet need to be investigated.

5. Conclusions

In this study, the short-term application of biochar amendment showed substantial benefits for GHG mitigation in rain–fed spring wheat, and presumably GWP and GHGI reduction. The results indicated that T3, T4 and T5 treatments could increase SOC in northwestern China, but the effect of T6 was the greatest. In conclusion, biochar applied at 30 t ha−1 in the short-term generated the least GHG emissions in the first year after application with small positive effects on grain yield.

Author Contributions

L.C. and S.Y. conceived and designed the experiments; S.Y. and M.S. performed the experiments; S.Y., S.L. and M.S. analyzed the data; S.Y. and S.L. wrote the paper and all authors approved submission of the paper.

Acknowledgments

This research was supported by the National Natural Science Foundation of China (31571594 and 41661049), The “National Twelfth Five-Year Plan” Circular Agricultural Science and Technology Project (2012 BAD14B03) and Gansu Provincial Key Laboratory of Aridland Crop Science open fund project (GSCS—2013-13).

Conflicts of Interest

The authors declare no conflict of interest.

References

  1. Change, I.C. The Physical Science Basis: Working Group I Contribution to the Fifth Assessment Report of the Intergovernmental Panel on Climate Change; Cambridge University Press: New York, NY, USA, 2013; Volume 1, pp. 531–535. [Google Scholar]
  2. Intergovernmental Panel on Climate Change Working Group 3; Metz, B.; Davidson, O.; Bosch, P.; Dave, R.; Meyer, L. Climate Change 2007: Mitigation: Contribution of Working Group III to the Fourth Assessment Report of the Intergovernmental Panel on Climate Change: Summary for Policymakers and Technical Summary; Cambridge University Press: New York, NY, USA, 2007. [Google Scholar]
  3. IPoCCWG; Metz, B.; Davidson, O.; Bosch, P.; Dave, R.; Meyer, L. Climate Change 2007: Mitigation: Contribution of Working Group III to the Fourth Assessment Report of the Intergovernmental Panel on Climate Change: Summary for Policymakers and Technical Summary; Cambridge University Press: New York, NY, USA, 2007. [Google Scholar]
  4. Solomon, S. Climate Change 2007−The Physical Science Basis: Working Group I Contribution to the Fourth Assessment Report of the IPCC; Cambridge University Press: New York, NY, USA, 2007. [Google Scholar]
  5. Atkinson, C.J.; Fitzgerald, J.D.; Hipps, N.A. Potential mechanisms for achieving agricultural benefits from biochar application to temperate soils: A review. Plant Soil 2010, 337, 1–18. [Google Scholar] [CrossRef]
  6. Wang, J.; Zhang, M.; Xiong, Z.; Liu, P.; Pan, G. Effects of biochar addition on N2O and CO2 emissions from two paddy soils. Biol. Fertil. Soils 2011, 47, 887–896. [Google Scholar] [CrossRef]
  7. Ventura, M.; Alberti, G.; Viger, M.; Jenkins, J.; Girardin, C.; Baronti, S.; Zaldei, A.; Taylor, G.; Rumpel, C.; Miglietta, F.; et al. Biochar mineralization and priming effect on SOM decomposition in two European short rotation coppices. Glob. Chang. Biol. Bioeng. 2015, 7, 1150–1160. [Google Scholar] [CrossRef]
  8. Castaldi, S.; Riondino, M.; Baronti, S.; Esposito, F.; Marzaioli, R.; Rutigliano, F.; Vaccari, F.; Miglietta, F. Impact of biochar application to a Mediterranean wheat crop on soil microbial activity and greenhouse gas fluxes. Chemosphere 2011, 85, 1464–1471. [Google Scholar] [CrossRef] [PubMed]
  9. FAO. Soil Map of the World: Revised Legend; World Soil Resources Report 60; Food and Agriculture Organization of the United Nations: Rome, Italy, 1990. [Google Scholar]
  10. Nelson, D.W.; Sommers, L.W. Total carbon, organic carbon and organic matter. In Methods of Soil Analysis. Part 2. Chemical and Microbiological Properties, Agronomy Monograph, 2nd ed.; Page, A.L., Miller, R.H., Keeney, D.R., Eds.; American Society of Agronomy, Soil Science Society of America: Madison, WI, USA, 1982; pp. 301–312. [Google Scholar]
  11. Ladd, J.N.; Amato, M. Relationship between microbial biomass carbon in soils and absorbance of extracts of fumigated soils. Soil Biol. Biochem. 1989, 21, 457–459. [Google Scholar] [CrossRef]
  12. Zou, J.; Huang, Y.; Jiang, J.; Zheng, X.; Sass, R.L. A 3-year field measurement of methane and nitrous oxide emissions from rice paddies in China: Effects of water regime, crop residue, and fertilizer application. Glob. Biogeochem. Cycles 2005, 19. [Google Scholar] [CrossRef]
  13. Yeboah, S.; Zhang, R.; Cai, L.; Song, M.; Li, L.L.; Xie, J.; Luo, Z.; Wu, J.; Zhang, J. Greenhouse gas emissions in a spring wheat–field pea sequence under different tillage practices in semi-arid Northwest China. Nutr. Cycl. Agroecosyst. 2016, 106, 77–91. [Google Scholar] [CrossRef]
  14. Zhang, Y.M.; Hu, C.S.; Zhang, J.B.; Dong, W.X.; Wang, Y.Y.; Song, L.N. Research advances on source/sink intensities and greenhouse effects of CO2, CH4 and N2O in agricultural soils. Chin. J. Eco-Agric. 2011, 19, 966–975. [Google Scholar] [CrossRef]
  15. Zhu, Y.; Wang, X.; Yang, X.; Xu, H.; Jia, Y. Key microbial processes in nitrous oxide emissions of agricultural soil and mitigation strategies. Huan Jing Ke Xue 2014, 35, 792–800. [Google Scholar] [PubMed]
  16. XinBxin, W.; Ping, Z.; JianBrong, F. Effects of bamboo biochar amendments on methane and nitrous oxide emission from paddy soil. J. Agric. Environ. Sci. 2014, 33, 198–204. [Google Scholar]
  17. De-Cai, G.; Zhang, L.; Qiang, L. Effects of biochar on CO2, CH4, N2O emission and its environmental benefits in dryland soil. Acta Ecol. Sin. 2015, 35, 3615–3624. [Google Scholar]
  18. Baritz, R.; Seufert, G.; Montanarella, L.; Van Ranst, E. Carbon concentrations and stocks in forest soils of Europe. For. Ecol. Manag. 2010, 260, 262–277. [Google Scholar] [CrossRef]
  19. Guo, Y.; Wang, D.; Zheng, J.; Zhao, S.; Zhang, X. Effect of Biochar on Soil Greenhouse Gas Emissions in Semi-arid Region. Huan Jing Ke Xue 2015, 36, 3393–3400. [Google Scholar] [PubMed]
  20. Kolb, S.E.; Fermanich, K.J.; Dornbush, M.E. Effect of charcoal quantity on microbial biomass and activity in temperate soils. Soil Sci. Soc. Am. J. 2009, 73, 1173–1181. [Google Scholar] [CrossRef]
  21. Yamato, M.; Okimori, Y.; Wibowo, I.F.; Anshori, S.; Ogawa, M. Effects of the application of charred bark of Acacia mangium on the yield of maize, cowpea and peanut, and soil chemical properties in South Sumatra, Indonesia. Soil Sci. Plant Nutr. 2006, 52, 489–495. [Google Scholar] [CrossRef]
  22. Cornelissen, G.; Martinsen, V.; Shitumbanuma, V.; Alling, V.; Breedveld, G.D.; Rutherford, D.W.; Sparrevik, M.; Hale, S.E.; Obia, A.; Mulder, J. Biochar effect on maize yield and soil characteristics in five conservation farming sites in Zambia. Agronomy 2013, 3, 256–274. [Google Scholar] [CrossRef] [Green Version]
  23. Xie, Z.; Xu, Y.; Liu, G.; Liu, Q.; Zhu, J.; Tu, C.; Amonette, J.E.; Cadisch, G.; Yong, J.W.; Hu, S. Impact of biochar application on nitrogen nutrition of rice, greenhouse−gas emissions and soil organic carbon dynamics in two paddy soils of China. Plant Soil 2013, 370, 527–540. [Google Scholar] [CrossRef]
  24. Wu, J.; Guo, W.; Feng, J.; Li, L.; Yang, H.; Wang, X.; Bian, X. Greenhouse gas emissions from cotton field under different irrigation methods and fertilization regimes in arid Northwestern China. Sci. World J. 2014, 2014. [Google Scholar] [CrossRef] [PubMed]
Figure 1. Daily precipitation (vertical drop lines) and maximum (solid lines) and minimum (dotted lines) air temperature during the growing season of spring wheat in 2015.
Agronomy 08 00074 g001
Figure 2. Diurnal variations of CH4 (A), diurnal variations of N2O (B) and diurnal variations of CO2 (C) fluxes respectively for spring wheat measured during the growing season of 2015. Bars indicate standard errors (SE) at p < 0.05. Treatments are biochar applied at 0, 10, 20, 30, 40, and 50 t ha−1 (corresponding to T0, T1, T2, T3, T4, and T5), respectively.
Agronomy 08 00074 g002
Figure 3. Seasonal variations of CH4 (A), seasonal variations of N2O (B) and seasonal variations of CO2 (C) fluxes respectively for spring wheat measured during the growing season of 2015. Bars indicate standard errors (SE) at p < 0.05. Treatments are biochar applied at 0, 10, 20, 30, 40, and 50 t ha−1 (corresponding to T0, T1, T2, T3, T4, and T5), respectively.
Agronomy 08 00074 g003
Table 1. Microbial biomass carbon (MBC) and soil organic carbon (SOC) of topsoil (0–30 cm) at harvest in 2015, at Dingxi experiment station, China.
TreatmentsMicrobial Biomass CarbonSoil Organic Carbon
0–55–1010–300–55–1010–30
g kg−1
T0205 b185 a,b160 a7.44 c7.56 b6.57 b
T1262 a149 b216 a10.76 b,c8.13 a,b6.33 a,b
T2219 b154 b187 a13.07 b9.09 a,b7.12 a,b
T3277 a258 a239 a16.97 a11.56 a,b7.17 a,b
T4160 c179 a,b194 a18.86 a10.34 a,b6.89 a,b
T5119 c159 b161 a17.16 a12.17 a7.84 a
a Treatments are biochar applied at 0, 10, 20, 30, 40, and 50 t ha−1 (corresponding to T0, T1, T2, T3, T4, and T5), respectively. b Different letters in each column represent significant difference at p < 0.05.
Table 2. Regression equations between daily mean greenhouse gas (GHG) flux (mg m−2 h−1, F) and soil temperature (°C, Ts) at different soil layers up to 25 cm soil depth, GHG flux responses to soil temperature in a positive linear correlation.
GHG FluxSoil Layer (cm)Regression EquationCoefficient of Determination (R2)
CH4 flux5F = 0.006 × Ts − 0.0950.887 * a
10F = 0.016 × Ts − 0.2430.684 *
15F = 0.021× Ts − 0.3250.714 *
N2O flux5F = 0.081× Ts − 1.1280.723 *
10F = 0.210 × Ts − 3.1190.545
15F = 0.246 × Ts − 3.7640.575
CO2 flux5F = 11.89 × Ts − 118.10.801 *
10F = 29.34 × Ts − 387.70.590
15F = 39.55 × Ts − 558.50.497
a * indicates a significant correlation at p < 0.05.
Table 3. Grain yield and total cumulative GHG emissions estimated over the entire growing season, and global warming potential (GWP) and greenhouse gas intensity (GHGI) of rain–fed spring wheat under different biochar amendment treatments.
TreatmentsCH4–CN2O–NCO2–CGrain YieldGWPGHGI
kg ha−1kg CO2-e ha−1kg CO2-e t−1
T00.190 ab8.69 a2627 a2476 a5222 a2.11 a
T10.165 ab5.48 c2647 a2495 a4284 b1.72 b
T20.145 b5.31 cd2580 a2577 a4164 b1.62 b
T30.133 b4.07 e2300 c2557 a3515 d1.37 d
T40.076 c4.80 d2381 b2553 a3813 c1.49 c
T50.002 d6.13 b2436 b2551 a4263 b1.67 b
a Treatments are biochar applied at 0, 10, 20, 30, 40, and 50 t ha−1 (corresponding to T0, T1, T2, T3, T4, and T5), respectively. b Different letters in each column represent significant difference at p < 0.05. c GWP = CO2 + 25 × CH4 + 298 × N2O. d GHGI = GWP/grain yield.

